
Applying Deep Learning Techniques for Sentiment Analysis to Assess Sustainable Transport


1
Department of Computer Science and Artificial Intelligence, University of the Basque Country UPV/EHU, 20018 Donostia-San Sebastián, Spain
2
HiTZ Center—Ixa, University of the Basque Country UPV/EHU, 20018 Donostia-San Sebastián, Spain
*
Authors to whom correspondence should be addressed.
Sustainability 2021, 13(4), 2397; https://0-doi-org.brum.beds.ac.uk/10.3390/su13042397
Submission received: 31 December 2020
/
Revised: 12 February 2021
/
Accepted: 16 February 2021
/
Published: 23 February 2021
(This article belongs to the Collection Methods and Measures to Improve Road Safety and Travel Efficiency in Sustainable Urban Transport Management)
Abstract
:Users voluntarily generate large amounts of textual content by expressing their opinions, in social media and specialized portals, on every possible issue, including transport and sustainability. In this work we have leveraged such User Generated Content to obtain a high accuracy sentiment analysis model which automatically analyses the negative and positive opinions expressed in the transport domain. In order to develop such model, we have semiautomatically generated an annotated corpus of opinions about transport, which has then been used to fine-tune a large pretrained language model based on recent deep learning techniques. Our empirical results demonstrate the robustness of our approach, which can be applied to automatically process massive amounts of opinions about transport. We believe that our method can help to complement data from official statistics and traditional surveys about transport sustainability. Finally, apart from the model and annotated dataset, we also provide a transport classification score with respect to the sustainability of the transport types found in the use case dataset.
1. Introduction
The global annual volume of transport-generated CO emissions increased by 68% between 1990 and 2015 [1]. According to the European Commission, in 2020 cars are responsible for around 12% of total EU emissions of CO, the main greenhouse gas.
Furthermore, transport practices have direct impact on sustainability [2,3,4]: (i) economic impact, namely, on issues related to traffic congestion, mobility barriers, accident damages, facility costs, consumer costs and depletion of nonrenewable resources (DNRR), (ii) social, which include disadvantaged mobility, health impacts, community interaction, liveability and aesthetics and, (iii) environmental, with respect to air and water pollution, habitat loss, hydrologic impacts, and DNRR. In this context, policy makers are seeking solutions to address these issues on a long-term basis by increasing the efficiency and sustainability of the transport system. The envisaged solutions would involve promoting a greener mobility such as walking and cycling, greater support of public transport, and limiting the use of motor vehicles in highly congested cities. Furthermore, these solutions are proposed to achieve a number sustainability and transport objectives: in terms of sustainability, they would include reducing pollution, preserving wildlife habitat, increasing exercise, etc.; with respect to transport, the main goals would refer to reducing traffic accidents, reducing traffic congestion and barriers, and progressive pricing, among others [4].
Traditional research methods to analyze and foster sustainable transport combine both qualitative and quantitative research supported mainly by questionnaires and statistical data [5]. The majority of approaches are focused on the use of more sustainable modes of transport [6,7,8] and on improving the efficiency and reducing the impact of motor vehicles [9,10,11]. Although online surveys have in the last few years been used [12], the most innovative are those nonintrusive methods based on analyzing the comments freely contributed in social media [13,14,15,16,17,18].
The main goal of this paper is to contribute to the analysis of transport sustainability by applying Sentiment Analysis techniques to analyze opinions expressed by users in the transport and mobility domain. Sentiment Analysis is a field within Natural Language Processing (NLP) that learns to make predictions regarding opinions and sentiments expressed by textual content. There is a huge body of work both in terms of research and applications for the analysis of product evaluation, textual survey answers, social media content, etc. [19].
Within the area of transport and mobility domain, Sentiment Analysis may help to analyze surveys and opinions expressed by users, which means that it can be used to complement data and statistical studies performed by public administrations [17]. In other words, and in contrast to traditional surveys, it should be considered that the large number of multilingual opinions available in social media and specialized portals are actually voluntarily offered by the users themselves. This constitutes an important and realistic source of information conveying the perception of users with respect to the transport domain. The following example shows the kind of data we will work with in the form of some opinions about transport classified in terms of their polarity (positive or negative opinions):
- (1)
- “When I first visited the fortress 14 years ago, the cable car was not an option and the fort was a derelict ruin picked-mocked by shells absorbed in the Homeland War.” Negative
- (2)
- “Having bought a ticket we only had to wait approx 5 min and in the height of tourist season is great.” Positive
More specifically, in this work we study the performance of Sentiment Analysis systems to automatically classify the polarity of opinions such as the ones shown above. In order to do that, we will compare the performance of a classic, unsupervised knowledge-based approach based on a sentiment lexicon, SentiWordNet [20], with respect to a deep-learning classifier obtained by fine-tuning a large pretrained language model based on the Transformer architecture, namely, XLM-RoBERTa [21].
While lexicon-based approaches to Sentiment Analysis are widely known [19,22], a recent and important advancement in the NLP field has been the appearance of the Transformer architecture [23], which has in turn allowed the development of large language models. These models are pretrained using very large corpora and can be fine-tuned for a variety of downstream tasks. According to Sanh et al. [24] “[...] some multilingual pretrained models perform tasks on texts such as classification, information extraction, question answering, summarization, translation, text generation, etc. in more than 100 languages” [21,25].
Using pretrained language models has quickly become a common practice for many text classification tasks. However, as far as we know, this work is the first attempt to apply them to the transport domain. The comparison between the lexicon-based and the Transformer-based approaches shows, as it was expected, that the Transformer classifier obtains substantially better results overall. More importantly, we also conduct a series of experiments with the aim of analyzing the robustness of each method in the presence of noisy or incorrect data. The results suggest that the deep learning method behaves quite robustly in the presence of such noise but that a small amount of carefully curated training data is desirable to obtain optimal results.
The objective evaluation and training of such systems for their application on massive amounts of opinions about transport is made possible by the development of a manually annotated corpus for polarity classification about transport. In fact, it should be noted that there is a lack of reliable corpora for the transport domain [26], which may be partially explained by the laborious and time-consuming work required to generate such annotated data. To fill this gap, we provide a new GSC (Gold-standard Corpus) dataset for the transport domain by manually annotating 2000 reviews from a UGC (User Generated Content) corpus of 117K reviews obtained from TripAdvisor. The GSC dataset consists user reviews written in English for different modes of transport in a time frame between 2007 and 2020.
Summarizing, the main contributions of this paper are the following:
- The development of a new dataset, the Gold Standard Corpus (GSC), derived from user reviews about transport, which has been manually annotated. The dataset covers a range of transportation modes according to their sustainability. This is the first dataset of its kind.
- A data-driven method to automatically classify user opinions on transport domain based on large pretrained language models [21]. We report experiments comparing the fine-tuning of such large language models with previous work based on sentiment lexicons [17]. Results show that the classifier obtained by fine-tuning XLM-RoBERTa performs with very high precision, to the point that it can be deployed in production systems to offer real-life, tangible benefits to policy makers in gathering information and making informed decisions.
- We perform a comprehensive empirical study of the robustness of the two methods in the presence of noisy data, which is the usual case when labeling opinions in the wild.
- We provide a classification of the transport types present in our dataset based on sustainability criteria.
- The obtained models and dataset will be made publicly available to encourage further research on the analysis of transport and to facilitate the reproducibility of the reported results.
The rest of the paper is structured as follows. Section 2 reviews previous work on Social Media for the transport domain as well as the most important approaches to Sentiment Analysis. After that, in Section 3 we describe the steps performed to undertake our work. Section 4 describes the creation of the manually annotated GSC dataset, based on a large UGC automatically obtained from TripAdvisor reviews. The systems used to perform Sentiment Analysis are presented in Section 5 and in Section 6 we present the experiments and results obtained comparing the two methods. Finally, Section 8 offers some concluding remarks and future work.
2. Related Work
The literature review is divided into two parts. We first provide an overview of the work on Sentiment Analysis which is closest to our interests, whereas in the second part we focus on the use of social media for research in the transport domain.
2.1. Sentiment Analysis
The Opinion Mining and Sentiment Analysis fields have seen, in the last 20 years, a huge increase in popularity to automatically determining opinion trends and attitudes about commercial products, companies reputation management, brand monitoring, or to track attitudes by mining social media, etc. These techniques have been particularly useful in addressing the explosion of information produced and shared via the Internet, especially in social media, which means that it is simply not possible to keep up with the constant flow of new information exclusively using manual methods.
Most popular approaches are based on document classification, where the task is to determine the polarity (positive, negative, neutral) of a given document or review similar to Examples (1) and (2) shown above. Well known benchmarks for polarity classification at document level include the Movie Reviews Corpus [27,28], the Large Movie Review Dataset [29], and the Stanford Sentiment Treebank (SST) [30], although many other corpora and resources have since been developed for many languages and domains [19,22,31].
It should be noted that there is a large body of work also on finer-grained Sentiment Analysis [31,32]. This was mostly motivated by the fact that a single review may contain more than one opinion about a variety of aspects or attributes of a given product or topic. Thus, Aspect Based Sentiment Analysis (ABSA) was defined as a task consisting of identifying the following components: the opinion holder, the target, the opinion expression (the textual expression conveying polarity), and the aspects. Aspects are mostly domain-dependent and refer to relevant aspects pertaining to the specific domain. For example, in restaurant reviews relevant aspects would include food quality, price, service, etc. Similarly, if our domain would be that of consumer electronics such as laptops, then relevant aspects would be those referring to weight, battery life, hard drive capacity, etc.
While performing Aspect Based Sentiment Analysis might certainly be of interest for the transport domain, in this paper we focus on presenting the first publicly available dataset to assess transport sustainability in terms Sentiment Analysis at document or review level, leaving the fine-grained aspects for future work.
The techniques most often used to perform sentiment analysis classification at document level can be largely classified into two main approaches: unsupervised methods based on sentiment lexicons and supervised methods which learn classifiers from labeled corpora.
With respect to lexicon-based methods, Sentiment Analysis often relies on the availability of words and phrases annotated according to the positive or negative connotations they express. Thus, words such as beautiful, and wonderful would indicate a positive polarity, whereas words such as bad or poor refer to a negative polarity. The generation of annotated lists of sentiment words has been addressed by manual-, corpus- and dictionary-based methods. Manually collecting such polarity lexicons is labor intensive and time consuming, and it is usually combined with automated approaches. However, there are very popular sentiment lexicons which have been fully [33,34] or at least partially manually created [35,36].
Corpus-based methods are mostly used to generate domain-specific polarity lexicons. They are usually built by trying to find related words in a given corpus taking a list of seed words as starting point [37,38].
Dictionary-based methods often rely on a lexical knowledge base (LKB) such as WordNet [39] that contains synonyms and antonyms for each word. Thus, a common technique is to start with some sentiment words as seeds which are taken as the starting point to perform some iterative propagation on the LKB [40,41]. Among these, SentiWordNet (SWN) [20] is perhaps the most commonly used opinion lexicon based on WordNet [39], although other approaches have shown better performance on intrinsic [42] and extrinsic [22] evaluations. WordNet is a lexical resource in which the lexical entries are sets of words that express the same concept, namely, a synset. SWN assigns to each synset in WordNet three scores (positive, negative, and objective) which are normalized to be equal to 1.0, although most previous works that use SentiWordNet calculate aggregate polarity values at word or lemma level from the corresponding synsets [22,34].
With respect to supervised approaches, it is possible distinguish between those based on manually-engineered features to train supervised classifiers (classic machine-learning) and recent deep-learning and neural-based approaches.
Overall, most classic machine learning methods employ bag-of-words representations together with manually engineered features based on local information such as n-grams, orthographic features, etc. but also on external information such as morphological tags or polarity features obtained from sentiment lexicons [19,27,29,31]. The most common machine learning algorithms within this tradition include Naive Bayes, Maximum Entropy [43] and Support Vector Machines [44], among others [45]. Although they are nowadays usually outperformed by deep-learning systems, these methods are still very competitive and much faster and cheaper to run. As a downside, these systems depend on manually coded features.
Recursive neural networks (RNNs) and, more specifically, various variations of Bidirectional Long-Short Term Memory (BiLSTM) networks initialized with vector-based word representations [46,47] helped to improve state-of-the-art results on usual Sentiment Analysis datasets, such as SST [30], which is included in the GLUE benchmark [48], although many other BiLSTM-based approaches exist [49,50,51].
Current best performing systems for Sentiment Analysis at document level are based on large pretrained language models [21,25]. These language models generate rich representations of text based on contextual word embeddings. Instead of generating static word embeddings [46,47], namely, unique representations for a given word regardless of the context, the idea is to be able to generate word representations according to the context in which the word occurs. Currently there are many approaches to generate such contextual word representations, but we will focus on those that have had a direct impact in text classification, namely, the models based on the transformer architecture [52] and of which BERT is perhaps the most popular example [25].
There are also several multilingual versions of these models. Thus, the multilingual version of BERT [25] was trained for 104 languages. More recently, XLM-RoBERTa [21] distributes a multilingual model which contains 100 languages trained on 2.5 TB of filtered Common Crawl text. To put results into perspective, results of BiLSTM based systems are around 90% word accuracy on the SST dataset included in GLUE. These results were hugely improved by the English BERT Large model (94.9 word accuracy) and by XLM-RoBERTa (95%). These results have been further improved by various ensembles of Transformer-based language models (Results and approaches can be found in the GLUE website: https://gluebenchmark.com, accessed on 7 October 2020).
2.2. Social Media Analysis in the Urban Transport Area
The field of research on modes of transportation has attracted the interest of researchers who already used social, demographic, and sentiment analysis techniques.
Seliverstov et al. [53] developed a method of automatic review classification based on a sentiment classifier to analyze traffic safety in Russia, according to the reviews published in different transport Internet resources, such as websites that contain new and constantly updating reviews of road conditions, Twitter channels, and VK communities. They used the Naïve Bayes algorithm and a linear classifier model with stochastic gradient descent optimization and obtained a classification accuracy of 71.94%. Ali et al. [54] propose an ontology and Latent Dirichlet allocation (OLDA)-based topic modeling and word embedding approach for sentiment classification. The proposed approach offers a text classification system that identifies the most relevant transportation texts in social media and analyses them to examine traffic control management and transportation services. It integrates lexicons into a pretrained word embedding model that increases the accuracy of sentiment classification, obtaining 90% accuracy and 88% F1-score.
Serna et al.’s research [17] focuses on one of the most sustainable transport modes, the bicycle. A statistical model that assesses the connection between public bike share (PBS) use and certain characteristics of the PBS systems is proposed. Their system includes sociodemographic, climate, and positive and negative opinion data (based on SentiWordNet) extracted from social media comments (Facebook, Twitter, and TripAdvisor). In previous works, Serna et al. [15,16] demonstrate empirically the feasibility of the automatic identification of the Sustainable Urban Mobility problems by leveraging the SUMO ontology and SentiWordNet in several social media, such as, Minube [15] and TripAdvisor Traveller Social Network [16], for two languages (English and Spanish).
Previously, Ruiz Sánchez et al. [55] propose to collect high quality data from social media that may be used for Transport Planning. Furthermore, Grant-Muller et al. [13] demonstrate that User Generated Content can complement, improve, and even replace conventional data. They also stress the need to develop automated methods to gather and analyze transport-related data from social media.
Gitto and Mancuso [56] use sentiment analysis to extract information from blogs with the objective of measuring the level of customer satisfaction on various airports using various software services: KNIME (https://www.knime.com/, accessed on 7 October 2020), designed for the analysis of web forums and social networks, and Semantria (https://www.lexalytics.com/semantria, accessed on 7 October 2020).
Twitter data has also gained the interest of researchers. Effendy et al. [57] use a trained SVM for sentiment analysis to determine which factors are the main cause of the ineligibility and eligibility of public transport use. Their model scores 78.12% in word accuracy. Anastasia and Budi [58] aim to measure customer satisfaction for online transportation services providers through sentiment analysis of Twitter data using three algorithms, namely Naïve Bayes, SVM, and Decision Trees. In addition, they manually preprocess the tweets and label them, obtaining a sentiment score that correlates with client satisfaction.
Summarizing, both supervised techniques and lexicon-based methods have been used for analyzing opinions about modes of transportation automatically. However, as far as we know no previous approach exists that has experimented with the latest advances in NLP, such as the Transformer models. Furthermore, previous works did not make the datasets used in their research available, which means that we cannot compare our approach with respect to the state of the art. In order to address this issue, we will generate a new dataset for Sentiment Analysis in the transport domain which we will then use to evaluate the robustness of an unsupervised method based on the SentiWordNet lexicon with respect to the supervised classifiers obtained by fine-tuning XLM-RoBERTa.
3. Methodology
In this section we describe the methodology employed to achieve the objectives of the research work. In order to replicate and build the experiments the process is detailed step-by-step, following the Knowledge Discovery in Databases process [59].
This approach is used to find knowledge in data and it consists of 9 phases: (1) stage abstraction, (2) data selection, (3) cleaning and preprocessing, (4) data transformation, (5) choice of Data Mining tasks, (6) choice of algorithm, (7) application of the algorithm, (8) evaluation and interpretation and finally, (9) understanding of knowledge.
Phases of the Methodology
Phase 1—Stage abstraction. In this phase, the case study and goals are defined. In the case study we analyze the different modes of transport in Croatia from TripAdvisor reviews written in English (117,458 sentences) from 2007 to 2020. Two different data analysis methods will be used and compared to assess the performance and accuracy of the both alternatives.
Phase 2—Data selection. It consists of searching through the different sections, capturing, downloading, and selecting the reviews of the different modes of transport as well as their original 1–5 ratings (see User Generated Content (UGC) described in Section 4.1).
Phase 3—Cleaning and preprocessing. We proceed to the cleaning and preprocessing of the sentences rated with 1 and 5 stars to generate the Gold Standard Corpus (GSC) used for the experiments (see Section 4.2).
Phase 4—Data transformation. Creation of the GSC with manually labelled polarity information. In order to do this, the numerical values of the TripAdvisor scale (1–5) are transformed to categorical values: 1 and 2 scores are mapped into negative, 3 into neutral, whereas 4 and 5 correspond to a positive polarity (see Section 4.4).
Phase 5—Choosing the Data mining task. The task defined is phrase-level data classification in which we need to assign one of the three polarity labels defined in the previous point to each of the sentences in the corpus.
Phase 6—Choice of algorithm. Two Sentiment Analysis approaches have been selected: a lexicon-based unsupervised approach which leverages SentiWordNet to individually tag polarity expressing words and a second approach based on fine-tuning XLM-RoBERTa for text classification at sentence level.
Phase 7—Application of algorithms. The algorithms depend on different settings and hyperparameters for optimal performance. While the SentiWordNet approach benefits from text preprocessing, tokenization, POS tagging, and Word Sense Disambiguation, XLM-RoBERTa performs best when the data is left untouched (see Section 5.1 and Section 5.2).
Phase 8—Evaluation and interpretation. Evaluation is performed against a manually annotated test set used to report only the final results. We chose a F1 macro metric to address any possible skewness among the distribution of classes in the GSC’s testing data (see Section 6).
Phase 9—Understanding the knowledge. We try to understand the behavior of the systems in the different evaluation settings proposed by virtue of graphical plots, providing an overview across systems and evaluation scenarios (see Section 6.2 and Section 6.3).
4. Datasets
In this section we introduce our new manually annotated dataset used for training and evaluation Sentiment Analysis classifiers for the transport domain. In the following we will describe the data collection, annotation, as well as the generation of Gold Standard Corpus (GSC) and the Noise Corpus (NC). We also evaluate the quality the annotations by measuring Cohen’s Kappa metric for interannotator agreement.
4.1. User Generated Content
The User Generated Content (UGC) is automatically obtained from TripAdvisor reviews about traveling in Croatia. TripAdvisor is the world’s largest travel platform with more than 859 million comments of accommodations, restaurants, experiences, and means of transport. The comments are rated according to a 1–5 stars scale. We carried out a manual procedure to find sections in TripAdvisor that contain transport modes of interest. These sections include public and private transport, such as electric tram, funicular railway, ferries and taxi boats, shuttle, bicycle, walking, etc. After that, we collected the data from the corpus by gathering reviews from TripAdvisor under those sections. Specifically, for the UGC corpus we selected reviews written in English from 2007 to 2020, containing sentences in total. By choosing such a long temporal range, we hoped to mitigate the problem of concept drift or, in other words, of opinions getting outdated.
According to Litman and Burwell [4], to facilitate sustainable transportation analysis, some evaluations use a set of indicators using relatively easily available data. For instance, the following aspects of sustainable transport are better the lower they are: transportation fossil fuel consumption and CO emissions, vehicle pollution emissions, per capita motor vehicle mileage, consumption of land transport, injuries and deaths from traffic accidents, use of transport property, and roadway aesthetic conditions (people seem to be more likely to take care of places they consider beautiful and meaningful).
Based on these indicators, we have created a transport classification in which the most sustainable means of transport will be ranked first. Table 1 shows the classification of different modes of transport according to their sustainability indicators. As it can be seen, the most sustainable means are walking, cycling, and public transport. Within public transport, the best is the metro, then the tram, etc. In general, the means of transport that use a motor, depending on the type of motor, can be more or less sustainable. For example, buses, cars, shuttles, and so on may be powered by electric, hybrid, or combustion engines. Depending on it, for this particular category the electric ones will be more sustainable, then hybrids and finally those with a combustion engine. Finally, motorcycles are more polluting than cars. The metro is more sustainable than the tram, because it has greater capacity and the impact per traveler is more distributed. A traveler who moves by diesel bus spreads his ecological footprint with the rest of the bus passengers making public transport more sustainable [2,60].
Table 2 lists the transportation modes found in the UGC corpus collected from TripAdvisor based on the sustainable classification provided in Table 1, including the number of reviews made by travellers about each transport type. Analysing the modal distribution reveals that the representation of the most sustainable modes of transport is higher by a percentage of . In fact, the distribution of the different modes of transport shows that of the transport types correspond to sustainable modes such as walking, bicycle, and public transport. Furthermore, a of the reviews refer to private transport modes such as taxis, shuttles, ferries, boats, and buses.
In general, a high use of public transport is observed and, in addition, various tours offer healthy alternatives such as journeys on foot or by bicycle.
Travel on foot accounts for of the reviews, and it is often combined with travelling by bike at . Finally, tram and funicular with occupy the first place (in order of importance).
4.2. The Gold Standard Corpus
For the creation of the Gold Standard Corpus (GSC), we only considered reviews in the UGC dataset with the most extreme ratings of 5 stars (the maximum score) and 1 star (minimum score), since, arguably, these extreme cases may be more trustable and should contain most positive and negative reviews [61,62,63]. We then manually checked every sentence to detect true positive and true negative cases. In this process we found many cases where the original TripAdvisor star rating did not correspond with the real polarity of the sentence. This means that the original 5 core ratings cannot directly be used to perform sentiment analysis at sentence level.
We performed a manual revision to correct the polarity of the sentences whenever the original score was deemed not to be correct. Table 3 shows examples of sentences whose sentiment were not clear, and were thus removed from the dataset.
Moreover, as a consequence of splitting the reviews into sentences, some of those sentences, taken in isolation, made no sense or, even, were grammatically incorrect. During the manual annotation we discarded those sentences. Additionally, once the identification is made, those sentences considered to be incorrectly classified sentences are discarded until a balanced dataset of 1000 positive and 1000 negative sentences was obtained.
4.3. Interannotator Agreement
After manual annotation we computed the Cohen’s Kappa interannotator agreement between our manually labeled sentences with respect to the original scores obtained from TripAdvisor.
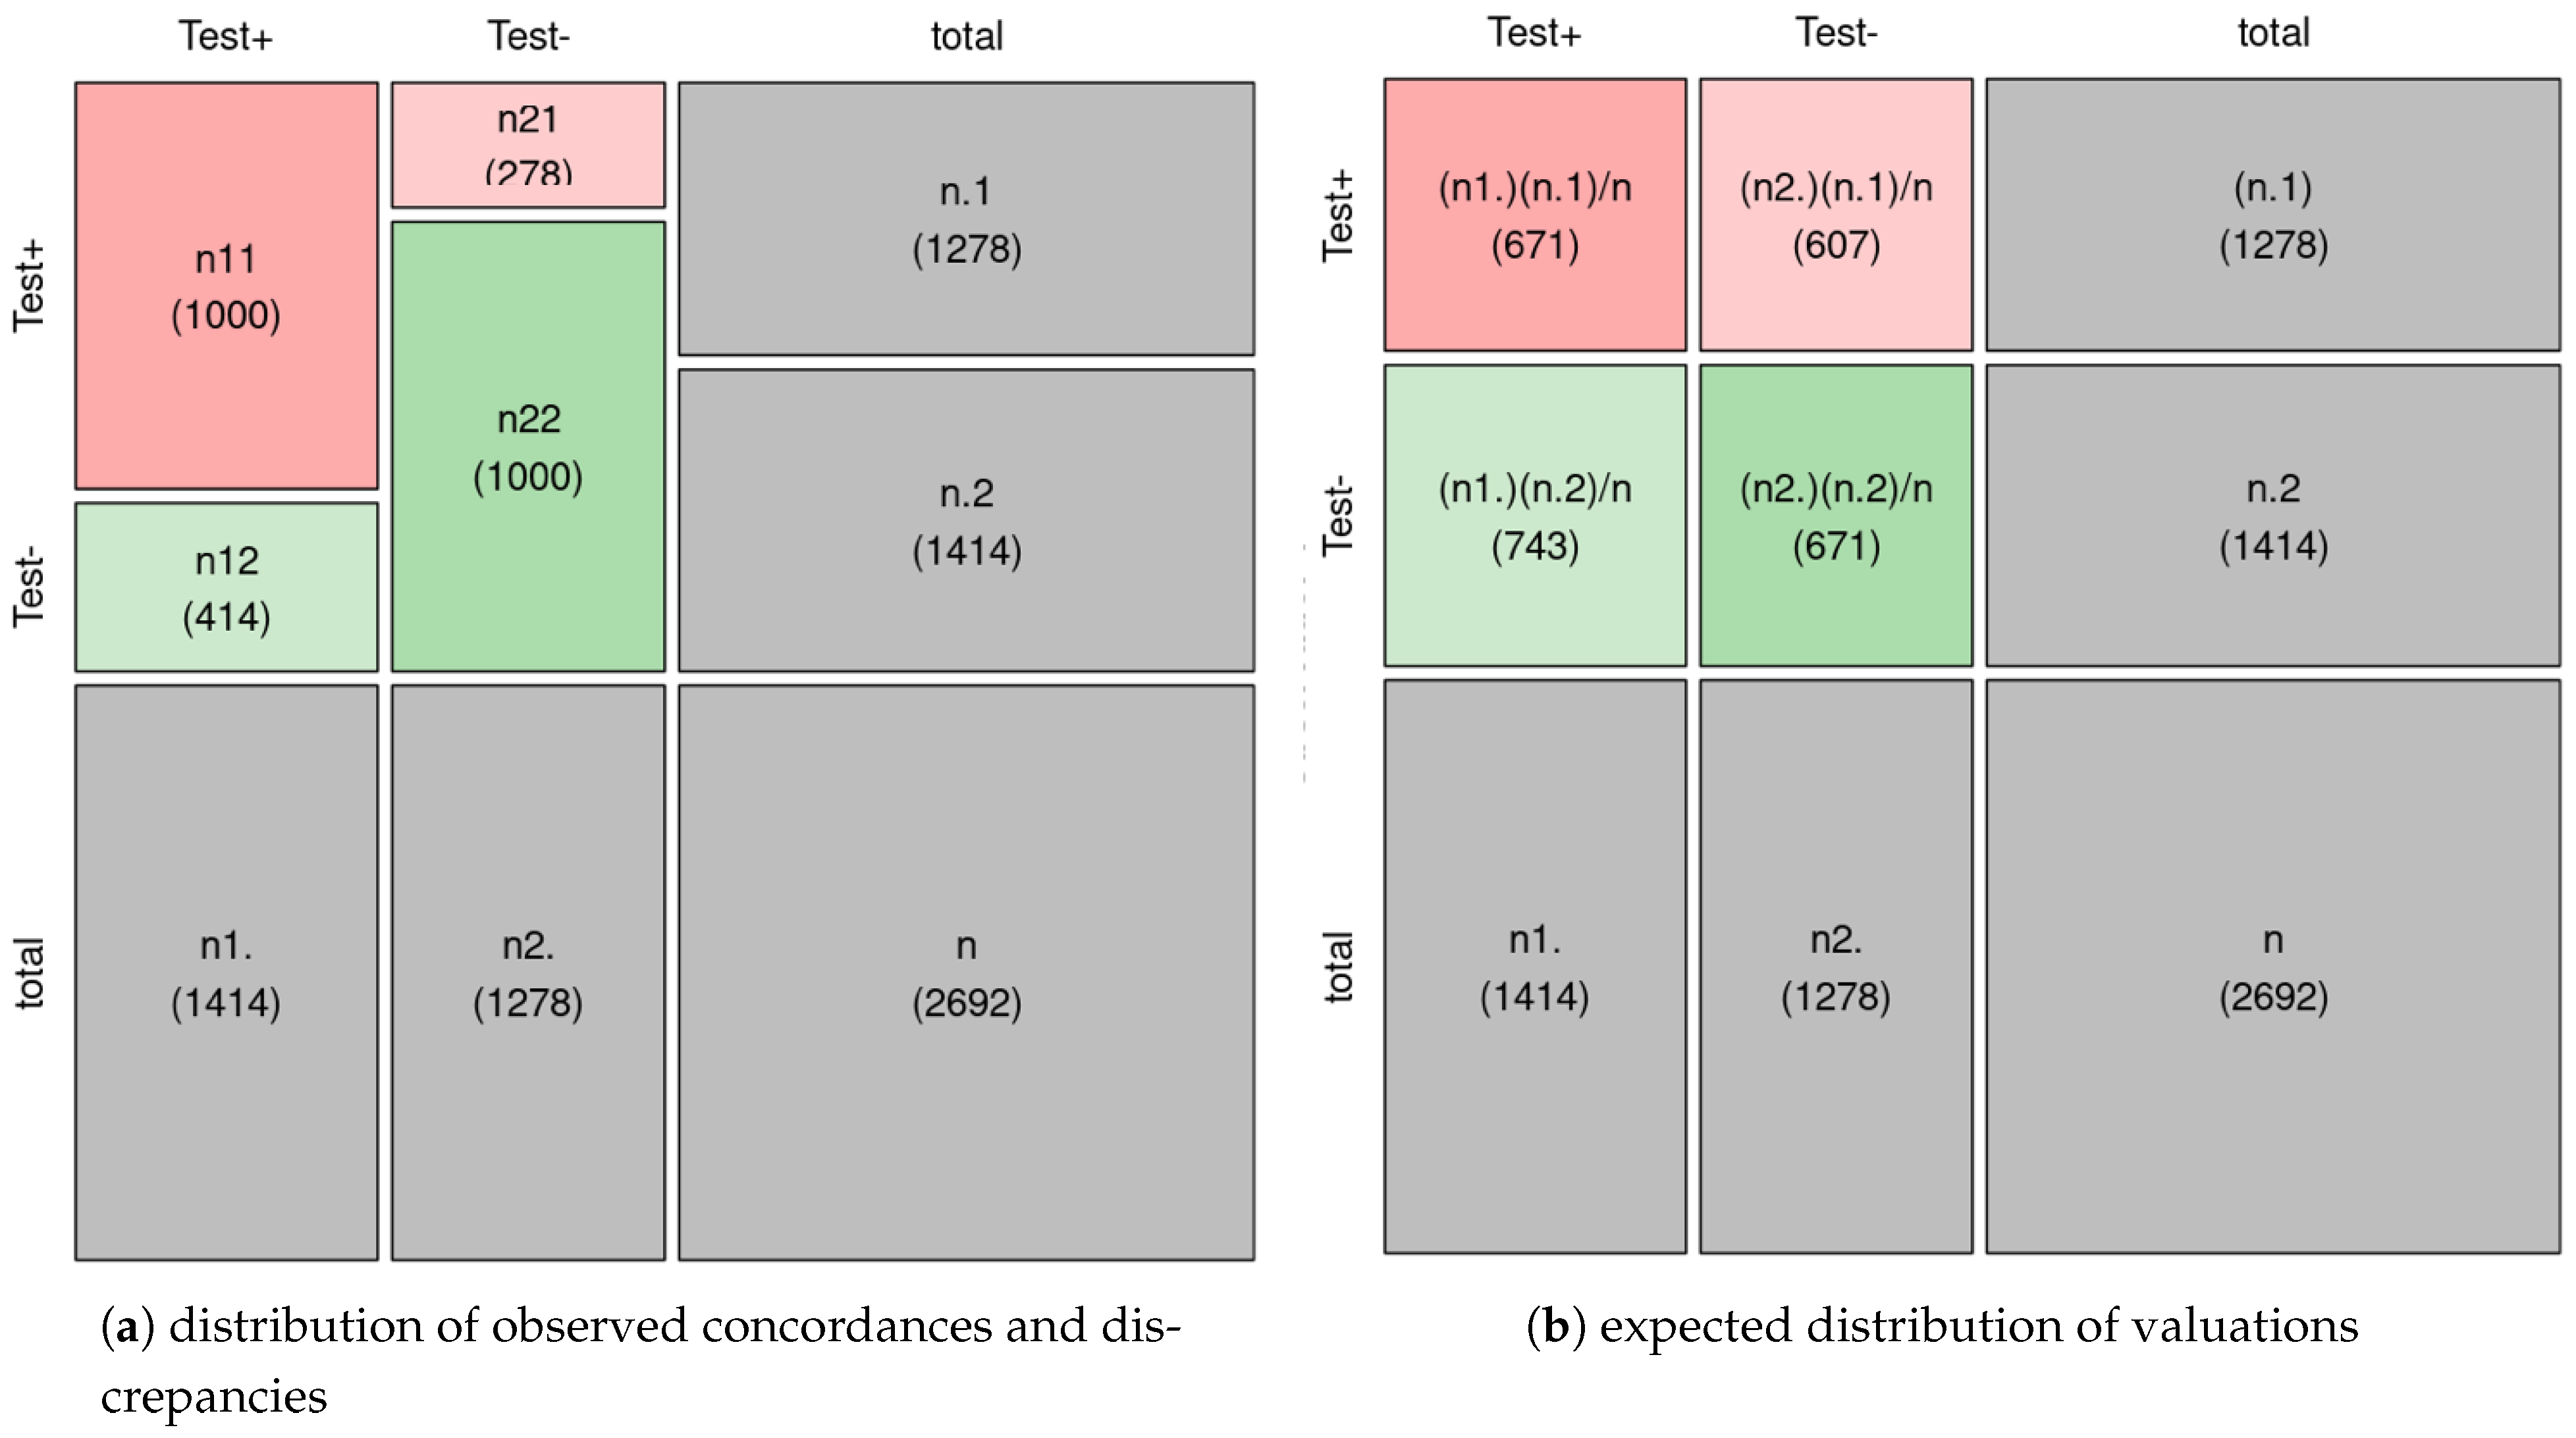
During the annotation process, we needed 1414 sentences from the 5-star dataset to obtain 1000 positive sentences, so that 414 sentences were discarded for being merely informative, neutral, or negative. With respect to the negative polarity, we needed 1278 sentences from the 1-star set of sentences to get 1000 negative sentences, which indicates that, overall, low rating reviews seemed to be less error prone. In total, 19.97% of sentences were labeled as having neutral orientation.
In any case, these numbers let us calculate an agreement factor between the original dataset and the annotated one, which in this case was % ( = 0.743).
Figure 1a shows the distribution of observed concordances and discrepancies in the corpus, whereas Figure 1b shows the expected distribution of ratings if both observers scored independently. The expected agreement that independent observers would obtain due to random coincidences is is 50% . An observed quantity higher than would indicate agreement, and a lower one, discrepancy. As in this case , we find more agreement than expected by chance. Cohen’s Kappa index is a measure of the agreement between the two annotators; it is calculated as the ratio between the observed and expected agreement at random and the maximum possible agreement (100%) and that expected at random, that is:
Thus, the result obtained from the Cohen’s Kappa index is a moderate degree of agreement, which justifies the need of the manual annotation process. Such an annotation effort takes time, but as we will see, has a favorable direct impact in the performance of the Sentiment Analysis models.
4.4. The Noise Corpus
As we mentioned in the introduction, one of the important goals of the paper is to analyze the robustness of the proposed methods when dealing with noisy data. With this aim in mind, we have created a set of datasets where noise is incrementally added in the training set of the GSC dataset described in the last section. The noisy data comes directly from the TripAdvisor corpus. Specifically, we included reviews rated with 2 and 4 stars, which we considered negative and positive, respectively. All in all, we created five datasets for our experiments, the Gold Standard Corpus (GSC) plus 4 variants containing a different percentage of noisy data: 25, 50, 75, and 100%.
It should be noted that with “noisy data” we do not refer to sentence we know that are wrongly labelled but to those that come directly from the User Generated Content, without revision. In fact, we can extrapolate the interannotator agreement figures obtained in Section 4.3 to get an estimation of the real error rate introduced in the dataset. The real noise is calculated by manually analyzing the sentences of the noise corpus, to later calculate the real noise through the Kappa coefficient. This process is performed for both 100% noise and 50%. For the calculation of the remaining noise levels such as 25% and 75%, the linear regression estimation is used.
The results obtained give us that for the 100% noise level, the real noise is 26%; and for the 50% noise level it corresponds to % of real noise. For the 25% and 75% noise level, the estimate over the complete training dataset obtained would be around % and %, respectively. Therefore, the range of real noise over the entire training dataset ranges from % to 26%.
5. Sentiment Analysis Systems
In this section we describe the two systems used in our experiments about Sentiment Analysis in the transport domain with the Gold Standard Corpus described in the previous section. The first method is a lexicon-based system that classifies the reviews according to the individual polarity of the words that compose the sentence. For the second system we fine-tune a Transformer-based large pretrained language model, XLM-RoBERTa, on the GSC training in a text classification setting.
5.1. SentiWordNet Approach
In the SentiWordNet (SWN) lexicon [20,40], each word is associated with an a priori sentiment value ranging between 0 and 1, being their sum 1.0 for each synset. SWN can be therefore used as a basis for polarity classification by aggregating the polarity scores of the words composing the sentence.
To aggregate the scores of the words, we have manually created a set of rules to adapt the polarity of common expressions to the transport domain. To do this, a process of identifying badly annotated expressions is automatically carried out. Next, a qualitative analysis is performed, with the aim of identifying terms and multiword expressions that produce prediction errors. We provide more details of this method in the following sections.
Preprocessing
As we need to match either words or word senses into the SWN lexicon, a number of careful preprocessing steps are required. First, comments are divided into sentences and spell checked using Aspell [64], which we customize with localisms and abbreviations. Abbreviations are often used instead of their full name equivalents, so we perform acronym disambiguation. A proper matching between the multiword expressions and/or abbreviations and the right word is crucial. Finally, stopwords are removed. Table 4 and Table 5 shows the changes in meaningful words for Sentiment Analysis after normalization.
Once the text is corrected and normalized it is processed using the Freeling [65] NLP tool to obtain the following annotations: lemmatization, POS tagging, multiword detection, Named Entity Recognition and Classification and Word Sense Disambiguation, as depicted in Figure 2 and Figure 3. The second row is the result of MWE detection and lemmatization; the third row (in red) specifies the Part-of-Speech (POS) tag for each word and, finally, the last row (in green) specifies the word sense automatically disambiguated [66] with respect to the WordNet 3.0 inventory of word senses [39].
Word Sense Disambiguation (WSD) is based on all the previously obtained annotations (lemmas, POS tags) and it is required to perform the mapping between the original text to the entries in the SWN lexicon at synset level. Of course, if any of the linguistic processing steps produces a wrong prediction, then the output of the Word Sense Disambiguation (in itself a very challenging task) module will be either incorrect or null.
This phenomena is illustrated by comparing the annotations obtained in the two Figure 2 and Figure 3, respectively. We can see that, thanks to the preprocessing and normalization processes previously performed, the NLP output obtained in Figure 3 is correct which will help to match any existing word senses into the SWN lexicon. More specifically, Figure 2 shows that the misspelled words are not recognized correctly. For example, the words “compnay” and “aplogising” cannot be disambiguated by the WSD module. In contrast, Figure 3 shows that after normalization the NLP processes output a current linguistic analysis.
As the lexicon-based approach works by labeling individual words matched with respect to the SWN lexicon, POS tagging is also used to work only with content words (nouns, adjectives, adverbs, verbs) which are the words that usually convey polarity information. Therefore, after POS tagging we remove all words not belonging to these categories. An example of the final linguistic analysis obtained for a sentence is depicted by Table 6.
We also performed a domain-specific analysis by adapting the polarity of some expressions and/or words to the context of transport domain. Furthermore, we also target negation detection by finding negative pronouns and adverbs (not, never, etc) that may reverse the polarity of the expression or sentence within their scope.
Finally, the polarity of each word or MWE, which have been assigned a polarity score via the SWN lexicon, are aggregated to obtain an overall score for a sentence. This is done by adding the the positivity and negativity scores of each word i in each sentence divided by the number n of words contained in that particular sentence, as defined in Equation (2). In order to be considered positive or negative, a sentence has to be considered subjective. To find out if a given sentence is subjective, the SWN objectivity formula specified in Equation (3) is applied. Thus, if the result is greater than , then the sentence is considered objective, otherwise it is considered subjective.
5.2. XLM-RoBERTa
XLM-RoBERTa is a state-of-the-art multilingual masked language model trained in 100 languages with 2.5 Terabytes of clean Common Crawl content [21]. We use the model via the Huggingface API (https://huggingface.co/, accessed on 7 October 2020) to fine-tune XLM-RoBERTa for polarity classification at sentence level. As for any other standard text classification task, the input of XLM-RoBERTa for training is a sentence and its manually labeled polarity. At prediction time, it outputs the most probable polarity label for an input sentence.
In order to do this, a contextual representation (embedding) of the special token (CLS) at the beginning of the sentence is used as a representation of the whole sentence, which is then fed as input to a single layer perceptron with outputs the prediction polarity labels for the whole sentence.
6. Experimental Results
In this section we describe the experiments conducted within this work and report the main results and conclusions. Two types of experiments have been designed.
The first set of experiments proposes a binary classification task (positive vs. negative) to compare the classifier based on XLM-RoBERTa with respect to the unsupervised SWN-based approach. Furthermore, we also analyze their robustness by gradually increasing the noise level on the dataset using the Noise Corpus (NC).
In a second experiment we adapt the XLM-RoBERTa model to a multiclass setting where the task is to predict the original 1–5 star rating of the review.
6.1. Experimental Setup
For the binary classification task both systems are tested against GSC dataset described in Section 4, which is used as common testbed. We partitioned the dataset into training (), development () and test sets (), containing 1460, 180 and 360 sentences, respectively. For the noise experiments, noise is gradually introduced in the train split of the GSC dataset, while the development and test splits are kept untouched. As mentioned in Section 4.4, the percentage of noise will range between 25, 50, 75, and .
For the multiclass classification task, we augmented GSC with reviews from the UGC corpus which were rated with 2, 3, and 4 stars. These newly inserted reviews were manually checked. The resulting corpus is also balanced, and for each partition there is the same number of sentences of each score (from 1 to 5). For example, in the testing data there would be 72 sentences of each score, totaling 360 sentences.
The fine-tuning of XLM-RoBERTa was performed as follows. Instances from the training set are used to fine-tune the language model and fit the parameters of the perceptron built on top of it, while keeping the rest of the weights frozen. The development dataset is used to tune the hyperparameters of the classifier and perform model selection, so that the best configuration on the development dataset is tested in the test set. The final hyperparameter configuration was 10 epochs using a learning rate, 16 as batch size and a maximum context length of 128.
With respect to the evaluation metrics, we follow common practice in other classification tasks [67] and report accuracy, the F1 score of each class (negative, positive), as well as the averaged F1 across the classes. While accuracy provides a general view of performance regardless of how well the systems perform for each class, F1 requires that systems score well for every class.
For F1 score for each class in the dataset is calculated as usual:
For the binary classification task the class set is equal to class = {positive, negative} whereas for the multiclass task the set of labels correspond to class = {1, 2, 3, 4, 5}. Accordingly, the F1 in the binary case is calculated as:
while in the multiclass case the metric is computed as follows:
6.2. Binary Classification Task
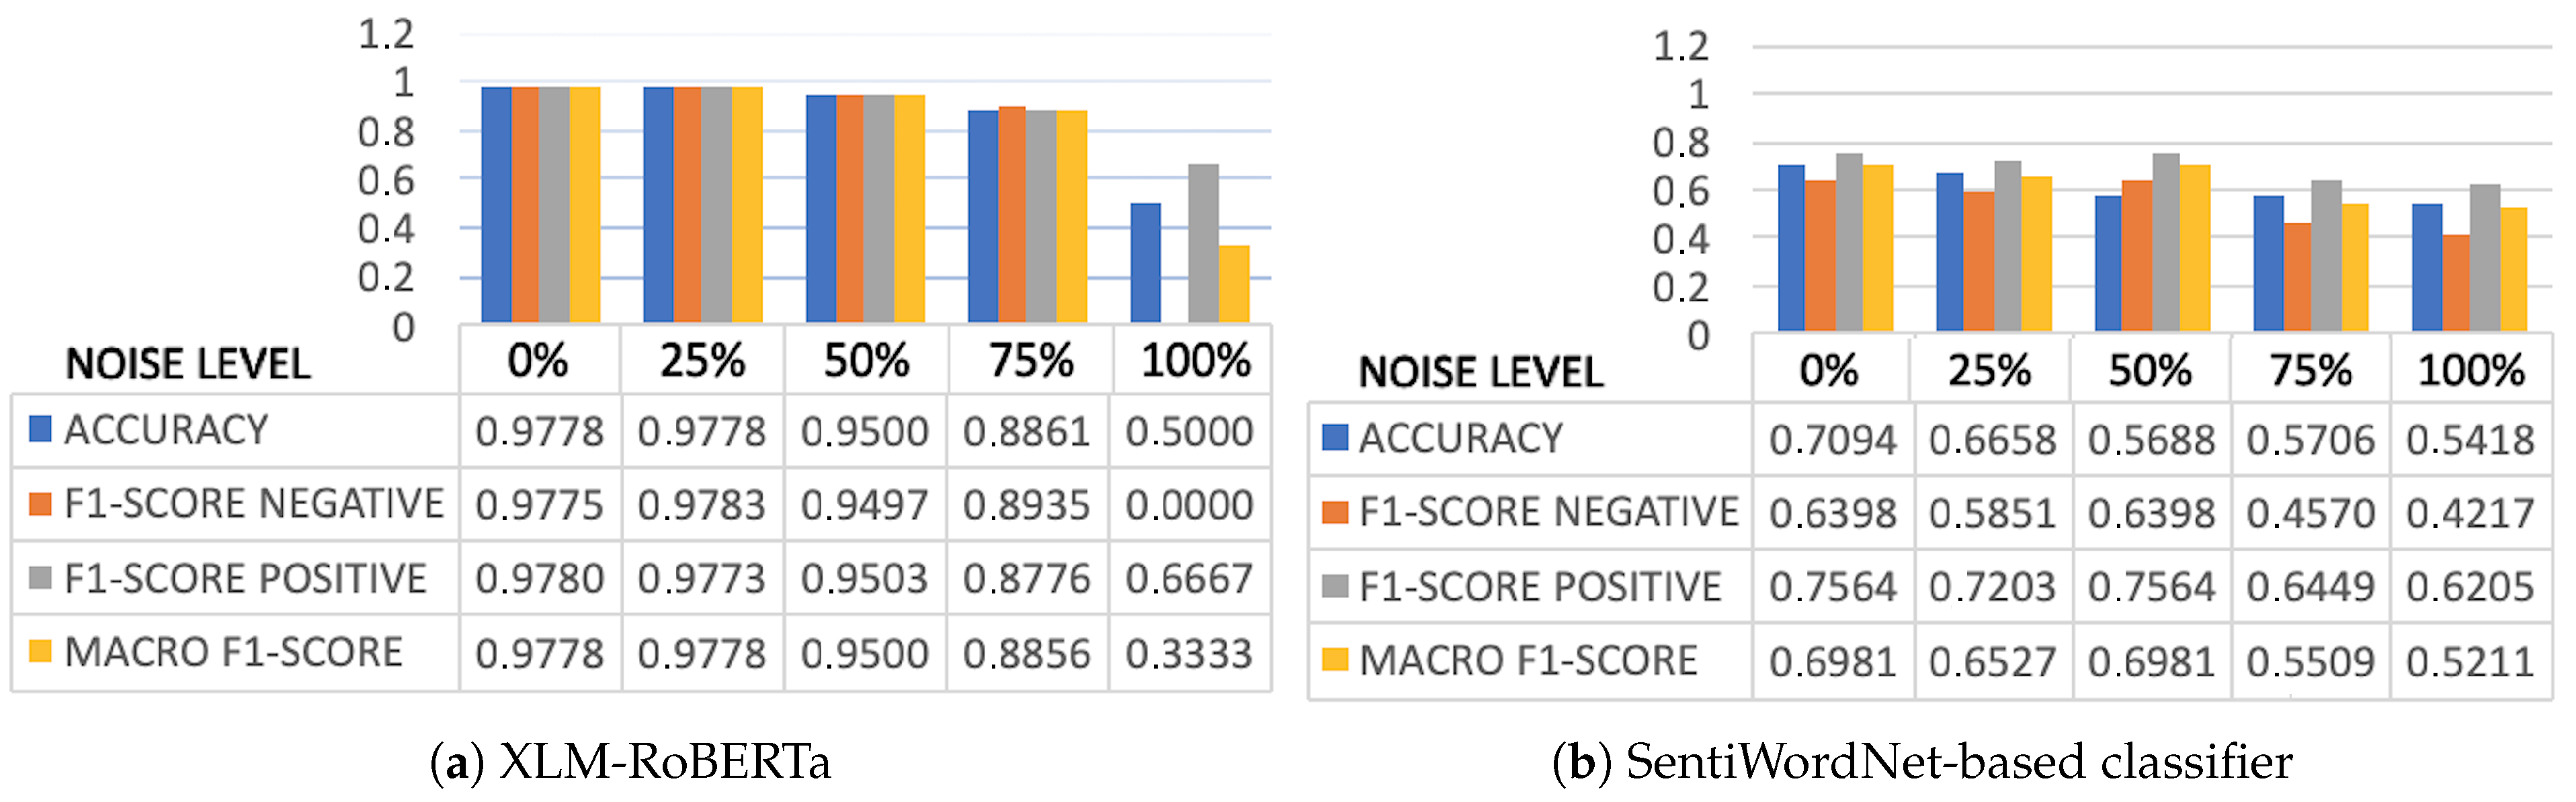
Figure 4 shows the results of the XLM-RoBERTa and SWN-based systems when tested in the binary classification task. The first column of each Figure corresponds to the noise level or, in other words, to the evaluation using the Gold Standard Corpus (GSC), whereas in the rest of the columns we report the results when gradually incrementing noise in the GSC’s training data.
As it was expected, XLM-RoBERTa obtains excellent results. Evaluated at the and noise levels, the performance is above for all metrics. The performance slightly degrades when noise is introduced but only when the noise level is increased up to (which would correspond to a real error rate of , see Section 4.4) do the results start dropping significantly. However, when the noise level reaches the system is not able to learn the negative class and outputs a positive label for every sentence in the testset. At other noise levels, the error rate is evenly distributed among the positive and negative classes.
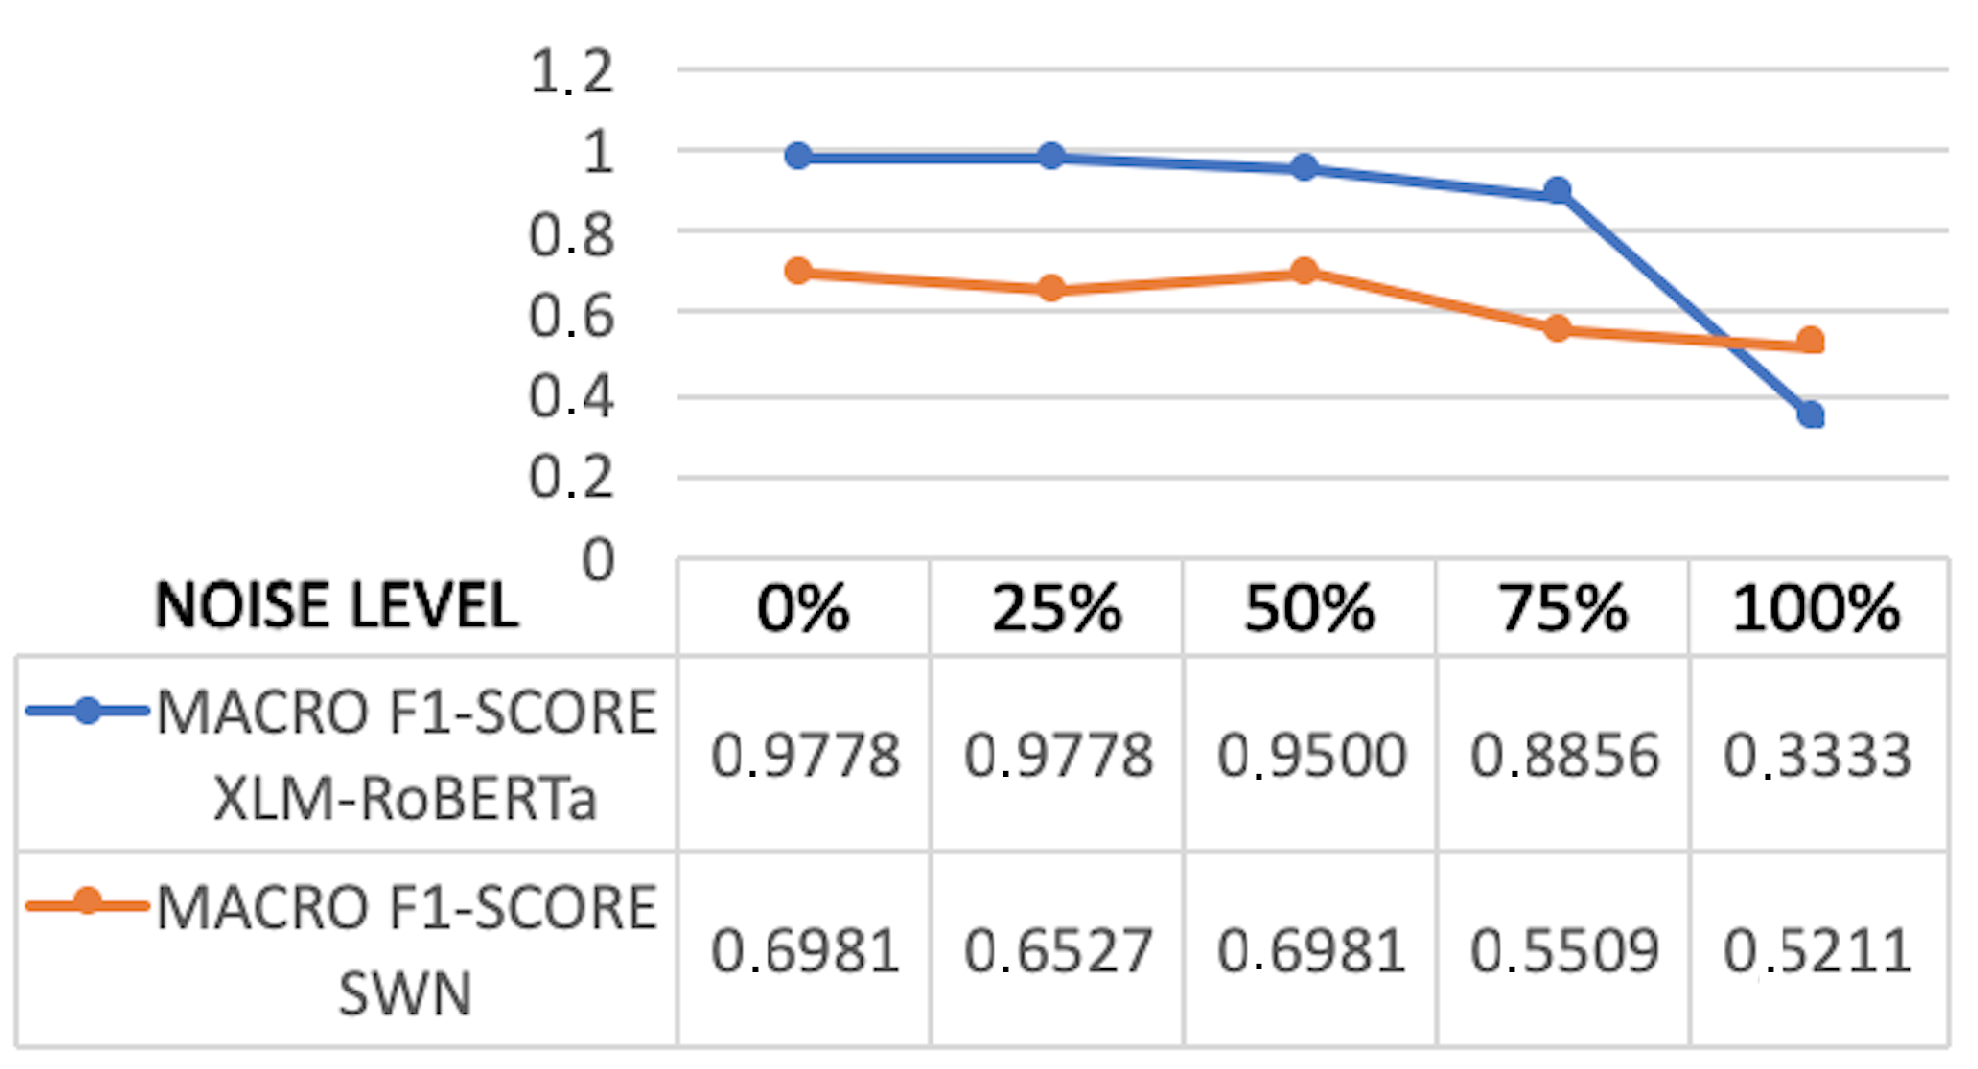
Figure 5 visualizes the comparison between XLM-RoBERTa and SWN. XLM-RoBERTa outperforms SWN by a large margin in all settings except when the noise level is set to . Still, XLM-RoBERTa yields an average improvement of 34 percentage points. While the results obtained by SWN are quite good, the unsupervised method shows its usefulness especially when training on noisy data. In any case, it is particularly remarkable the robustness of XLM-RoBERTa to the presence of noise, even when set to 75%.
6.3. Multiclass Classification
Table 7 shows the results obtained by XLM-RoBERTa in the multiclass experiments (using 1–5 rating scores). Overall, the system is able to perform fine-grained classification, even when trained with binary labels, and yields of accuracy. The table also suggests that the system has a tendency to classify sentences as negative or neutral and is less leaned towards assigning maximum scores.
7. Availability
The Gold Standard Corpora dataset created with sentence-level sentiment annotations in the transport domain is available on the https://github.com/ixa-ehu/sustainable-transport-sentiment-corpus (accessed on 12 February 2021) repository under the Creative Commons license (CC-BY-NC-ND) (https://creativecommons.org/licenses/by-nc-nd/4.0/, accessed on 22 February 2021).
8. Concluding Remarks and Future Work
The paper’s primary aim is to present a method of processing user generated content to obtain a high accuracy and robust sentiment analysis model about transport modes at review level. In order to do so, we present the Gold Standard Corpus (GSC), a new dataset containing 2000 reviews from the transport domain, manually annotated as positive or negative. This corpus is the first of its kind for the transport domain that is publicly available. The annotation process showed that the original classification of TripAdvisor comments according to a scale of 1–5 stars does not necessarily correspond with the real polarity. When manually reviewing these comments, we found that around of the rates had to be manually corrected. Therefore, this moderate agreement rate is not sufficient to directly use an unannotated corpus such as TripAdvisor to train the model.
Furthermore, we present a set of novel experiments on Sentiment Analysis to assess transportation modes. We experiment with the a large pretrained language model (XLM-RoBERTa) and compare its results with respect to an unsupervised lexicon-based approach (SentiWordNet). As expected, the results on the GSC corpus show that the supervised approach outperforms the lexicon-based one by a large margin. These results show the huge benefits that can be obtained by using large language models when the amount of training data is very small (1460 sentences).
We also report on different experiments to assess the robustness of the two classifiers in the presence of noisy or incorrect samples in the training set, which is a usual case if we use existing rates from portals such as TripAdvisor. The results show that both methods are quite robust, and particularly surprising are the high scores obtained by XLM-RoBERTa with high rates of noise (up to 75%). However, the experiments also show that XLM-RoBERTa requires some manual annotation in order to perform competitively.
Summarizing, our study suggests that spending some resources on annotating a small amount of data and using it to fine-tune a pretrained language model such as XLM-RoBERTa is an effective strategy to produce a system that obtains results which are good enough to be deployed in production systems to automatically process massive amounts of opinions about transport.
Finally, we have also provided a classification of transport types according to its sustainability which has been applied to the modes of transport found in the User Generated Content (UGC). Analyzing the modal distribution, we found that the representation of the most sustainable modes of transport (walking, cycling, and public transport) is higher by a percentage of .
It should be noted that our work does not aim to address the temporal evolution of opinions with respect to a specific transport mode. Thus, issues such as concept drift, seasonality bias, tourist background, and modeling user profiles constitute interesting future research avenues. Other future research includes exploring the multilingual capabilities offered by XLM-RoBERTa given that it can be applied to 100 languages. In fact, we could use the model generated in the binary classification task to automatically annotate in a zero-shot setting reviews written in the top five most common languages referring to the modes of transport on TripAdvisor.
All the material developed within this work, including the program scripts and the dataset itself, will be publicly made available under free licenses.
Author Contributions
Conceptualization, A.S. (Aitor Soroa), R.A. and A.S. (Ainhoa Serna); methodology, A.S. (Aitor Soroa), R.A. and A.S. (Ainhoa Serna); software, R.A. and A.S. (Ainhoa Serna); validation, A.S. (Aitor Soroa), R.A. and A.S. (Ainhoa Serna); formal analysis A.S. (Ainhoa Serna); investigation, A.S. (Aitor Soroa), R.A. and A.S. (Ainhoa Serna); resources, A.S. (Aitor Soroa), R.A. and A.S. (Ainhoa Serna); data curation, A.S. (Ainhoa Serna); writing—original draft preparation, A.S. (Ainhoa Serna); writing—review and editing, A.S. (Aitor Soroa), R.A. and A.S. (Ainhoa Serna); visualization, A.S. (Aitor Soroa), R.A. and A.S. (Ainhoa Serna); supervision, A.S. (Aitor Soroa) and R.A.; project administration, A.S. (Aitor Soroa) and R.A.; funding acquisition, A.S. (Aitor Soroa) and R.A. All authors have read and agreed to the published version of the manuscript.
Funding
This work has been partially funded by the Spanish Ministry of Science, Innovation and Universities (DeepReading RTI2018-096846-B-C21, MCIU/AEI/FEDER, UE), Ayudas Fundación BBVA a Equipos de Investigación Científica 2018 (BigKnowledge), DeepText (KK-2020/00088), funded by the Basque Government and the COLAB19/19 project funded by the UPV/EHU. Rodrigo Agerri is also funded by the RYC-2017-23647 fellowship and acknowledges the donation of a Titan V GPU by the NVIDIA Corporation.
Institutional Review Board Statement
Not applicable.
Informed Consent Statement
Not applicable.
Data Availability Statement
The data presented in this study are available in https://github.com/ixa-ehu/sustainable-transport-sentiment-corpus (accessed on 12 February 2021) Data citation: Ainhoa Serna, Aitor Soroa, Rodrigo Agerri. 2021. sustainable-transport-sentiment-corpus; Version (1).
Conflicts of Interest
The authors declare no conflict of interest.
Abbreviations
The following abbreviations are used in this manuscript:
| BERT | Bidirectional Encoder Representations from Transformers |
| Carbon dioxide | |
| DNRR | Depletion of Nonrenewable Resources |
| DT | Determining article |
| GSC | Gold Standard Corpora |
| IAA | Interannotator Agreement |
| KDD | Knowledge Discovery in Databases |
| KNIME | Konstanz Information Miner |
| mBERT | Multilingual Bidirectional Encoder Representations from Transformers |
| ML | Machine Learning |
| MLP | MultiLayer Perceptron |
| MW | MultiWord |
| MWE | MultiWord Expressions |
| NB | Naïve Bayes |
| NLI | Natural Language Inference |
| NLP | Natural Language Processing |
| OLDA | Online Latent Dirichlet Allocation |
| POS | Part Of Speech |
| PRP | Possessive Pronoums |
| SUMO | Suggested Upper Merged Ontology |
| SVM | Support Vector Machine |
| SWN | SentiWordNet |
| UGC | User Generated Content |
| XLM-RoBERTa | Multilingual Robustly Optimized BERT Pretraining Approach |
| XLM-R | XLM-RoBERTa |
References
- Eva, M.; Mihai, F.C.; Munteanu, A.V. Sustainability of the transport sector during the last 20 years: Evidences from a panel of 35 countries. In Proceedings of the International Multidisciplinary Scientific GeoConference on Ecology, Economics, Education and Legislation-SGEM 2019, MISC, Albena, Bulgaria, 28 June–6 July 2019; pp. 687–694. [Google Scholar]
- Gudmundsson, H.; Marsden, G.; Josias, Z.; Hall, R.P. Sustainable Transportation: Indicators, Frameworks, and Performance Management; Springer: Berlin/Heidelberg, Germany, 2016. [Google Scholar]
- Castillo, H.; Pitfield, D.E. ELASTIC–A methodological framework for identifying and selecting sustainable transport indicators. Transp. Res. Part D Transp. Environ. 2010, 15, 179–188. [Google Scholar] [CrossRef] [Green Version]
- Litman, T.; Burwell, D. Issues in sustainable transportation. Int. J. Glob. Environ. Issues 2006, 6, 331–347. [Google Scholar] [CrossRef]
- Liu, Q.; Han, Y.; Liddawi, S. Key Factors of Public Attitude towards Sustainable Transport Policies: A Case Study in Four Cities in Sweden. Ph.D. Thesis, Blekinge Institute of Technology, Karlskrona, Sweden, 2015. [Google Scholar]
- Enoch, M.P.; Taylor, J. A worldwide review of support mechanisms for car clubs. Transp. Policy 2006, 13, 434–443. [Google Scholar] [CrossRef] [Green Version]
- Seidel, M.; Loch, C.H.; Chahil, S. Quo vadis, automotive industry? A vision of possible industry transformations. Eur. Manag. J. 2005, 23, 439–449. [Google Scholar] [CrossRef]
- Mont, O. Institutionalisation of sustainable consumption patterns based on shared use. Ecol. Econ. 2004, 50, 135–153. [Google Scholar] [CrossRef]
- Hamelinck, C.N.; Faaij, A.P. Outlook for advanced biofuels. Energy Policy 2006, 34, 3268–3283. [Google Scholar] [CrossRef]
- Romm, J. The car and fuel of the future. Energy Policy 2006, 34, 2609–2614. [Google Scholar] [CrossRef]
- Solomon, B.D.; Banerjee, A. A global survey of hydrogen energy research, development and policy. Energy Policy 2006, 34, 781–792. [Google Scholar] [CrossRef]
- Bregman, S. Uses of Social Media in Public Transportation; TCRP Synthesis of Transit Practice; The National Academies Press: Washington, DC, USA, 2012. [Google Scholar]
- Grant-Muller, S.M.; Gal-Tzur, A.; Minkov, E.; Nocera, S.; Kuflik, T.; Shoor, I. Enhancing transport data collection through social media sources: Methods, challenges and opportunities for textual data. IET Intell. Transp. Syst. 2014, 9, 407–417. [Google Scholar] [CrossRef]
- Grant-Muller, S.M.; Gal-Tzur, A.; Minkov, E.; Kuflik, T.; Nocera, S.; Shoor, I. Transport Policy: Social Media and User-Generated Content in a Changing Information Paradigm. Soc. Media Gov. Serv. 2015, 325–366. [Google Scholar] [CrossRef]
- Serna, A.; Gerrikagoitia, J.K.; Bernabé, U.; Ruiz, T. Sustainability analysis on Urban Mobility based on Social Media content. Transp. Res. Procedia 2017, 24, 1–8. [Google Scholar] [CrossRef]
- Serna, A.; Gasparovic, S. Transport analysis approach based on big data and text mining analysis from social media. Transp. Res. Procedia 2018, 33, 291–298. [Google Scholar] [CrossRef]
- Serna, A.; Ruiz, T.; Gerrikagoitia, J.K.; Arroyo, R. Identification of Enablers and Barriers for Public Bike Share System Adoption using Social Media and Statistical Models. Sustainability 2019, 11, 6259. [Google Scholar] [CrossRef] [Green Version]
- Serna, A.; Gerrikagoitia, J.K. Discovery of Sustainable Transport Modes Underlying TripAdvisor Reviews With Sentiment Analysis: Transport Domain Adaptation of Sentiment Labelled Data Set. In Natural Language Processing for Global and Local Business; IGI Global: Hershey, PA, USA, 2020; pp. 180–199. [Google Scholar]
- Liu, B. Sentiment analysis and opinion mining. Synth. Lect. Hum. Lang. Technol. 2012, 5, 1–167. [Google Scholar] [CrossRef] [Green Version]
- Baccianella, S.; Esuli, A.; Sebastiani, F. Sentiwordnet 3.0: An Enhanced Lexical Resource for Sentiment Analysis and Opinion Mining. In Proceedings of the LREC 2010, Valletta, Malta, 17–23 May 2010; Volume 10, pp. 2200–2204. [Google Scholar]
- Conneau, A.; Khandelwal, K.; Goyal, N.; Chaudhary, V.; Wenzek, G.; Guzmán, F.; Grave, E.; Ott, M.; Zettlemoyer, L.; Stoyanov, V. Unsupervised Cross-lingual Representation Learning at Scale. In Proceedings of the 58th Annual Meeting of the Association for Computational Linguistics, 5–10 July 2020; pp. 8440–8451. [Google Scholar]
- San Vicente, I.; Agerri, R.; Rigau, G. Simple, Robust and (almost) Unsupervised Generation of Polarity Lexicons for Multiple Languages. In Proceedings of the 14th Conference of the European Chapter of the Association for Computational Linguistics (EACL 2014), Gothenburg, Sweden, 26–30 April 2014; pp. 88–97. [Google Scholar]
- Vaswani, A.; Shazeer, N.; Parmar, N.; Uszkoreit, J.; Jones, L.; Gomez, A.N.; Kaiser, L.u.; Polosukhin, I. Attention Is All You Need; Advances in Neural Information Processing Systems; Guyon, I., Luxburg, U.V., Bengio, S., Wallach, H., Fergus, R., Vishwanathan, S., Garnett, R., Eds.; Curran Associates, Inc.: New York, NY, USA, 2017; Volume 30, pp. 5998–6008. [Google Scholar]
- Sanh, V.; Wolf, T.; Ruder, S. A hierarchical multi-task approach for learning embeddings from semantic tasks. In Proceedings of the AAAI Conference on Artificial Intelligence, Honolulu, HI, USA, 27 January–1 February 2019; Volume 33, pp. 6949–6956. [Google Scholar]
- Devlin, J.; Chang, M.W.; Lee, K.; Toutanova, K. Bert: Pre-training of deep bidirectional transformers for language understanding. arXiv 2018, arXiv:1810.04805. [Google Scholar]
- Pereira, J.F.F. Social media text processing and semantic analysis for smart cities. arXiv 2017, arXiv:1709.03406. [Google Scholar]
- Pang, B.; Lee, L.; Vaithyanathan, S. Thumbs up? Sentiment Classification using Machine Learning Techniques. In Proceedings of the 2002 Conference on Empirical Methods in Natural Language, Philadelphia, PA, USA, 6–7 July 2002; Association for Computational Linguistics: Portland, OR, USA, 2002; pp. 79–86. [Google Scholar]
- Pang, B.; Lee, L. Seeing Stars: Exploiting Class Relationships for Sentiment Categorization with Respect to Rating Scales; ACL: Ann Arbor, MI, USA, 2005; Volume 43, pp. 115–124. [Google Scholar]
- Maas, A.L.; Daly, R.E.; Pham, P.T.; Huang, D.; Ng, A.Y.; Potts, C. Learning Word Vectors for Sentiment Analysis. In Proceedings of the 49th Annual Meeting of the Association for Computational Linguistics: Human Language Technologies, Portland, OR, USA, 19–24 June 2011; Association for Computational Linguistics: Portland, OR, USA, 2011; pp. 142–150. [Google Scholar]
- Socher, R.; Perelygin, A.; Wu, J.; Chuang, J.; Manning, C.D.; Ng, A.; Potts, C. Recursive Deep Models for Semantic Compositionality Over a Sentiment Treebank. In Proceedings of the 2013 Conference on Empirical Methods in Natural Language, Seattle, WA, USA, 18–21 October 2013; Association for Computational Linguistics: Portland, OR, USA, 2013; pp. 1631–1642. [Google Scholar]
- Pontiki, M.; Galanis, D.; Papageorgiou, H.; Androutsopoulos, I.; Manandhar, S.; AL-Smadi, M.; Al-Ayyoub, M.; Zhao, Y.; Qin, B.; De Clercq, O.; et al. SemEval-2016 Task 5: Aspect Based Sentiment Analysis; SemEval: San Diego, CA, USA, 2016. [Google Scholar]
- Liu, B. Sentiment Analysis: Mining Sentiments, Opinions, and Emotions; Cambridge University Press: Cambridge, UK, 2015. [Google Scholar]
- Stone, P.; Dunphy, D.; Smith, M.; Ogilvie, D. The General Inquirer: A Computer Approach to Content Analysis; MIT Press: Cambridge, UK, 1966. [Google Scholar]
- Taboada, M.; Brooke, J.; Tofiloski, M.; Voll, K.; Stede, M. Lexicon-based methods for sentiment analysis. Comput. Linguist. 2011, 37, 267–307. [Google Scholar] [CrossRef]
- Hu, M.; Liu, B. Mining and Summarizing Customer Reviews. In Proceedings of the Tenth ACM SIGKDD International Conference on Knowledge Discovery and Data Mining, Seattle, WA, USA, 22–25 August 2004; pp. 168–177. [Google Scholar]
- Riloff, E.; Wiebe, J. Learning Extraction Patterns for Subjective Expressions. In Proceedings of the International Conference on Empirical Methods in Natural Language Processing (EMNLP), Sapporo, Japan, 11–12 July 2003. [Google Scholar]
- Turney, P.; Littman, M. Measuring praise and criticism: Inference of semantic oreintation from association. ACM Trans. Inf. Syst. 2003, 21, 315–346. [Google Scholar] [CrossRef] [Green Version]
- Choi, Y.; Cardie, C. Adapting a polarity lexicon using integer linear programming for domain-specific sentiment classification. In Proceedings of the 2009 Conference on Empirical Methods in Natural Language, Singapore, 6–7 August 2009; Volume 2, pp. 590–598. [Google Scholar]
- Fellbaum, C.; Miller, G. WordNet: An Electronic Database; MIT Press: Cambridge, MA, USA, 1998. [Google Scholar]
- Esuli, A.; Sebastiani, F. Sentiwordnet: A Publicly Available Lexical Resource for Opinion Mining; LREC. Citeseer: University Park, PA, USA, 2006; Volume 6, pp. 417–422. [Google Scholar]
- Mohammad, S.; Dunne, C.; Dorr, B. Generating high-coverage semantic orientation lexicons from overtly marked words and a thesaurus. In Proceedings of the 2009 Conference on Empirical Methods in Natural Language, Singapore, 6–7 August 2009; Volume 2, pp. 599–608. [Google Scholar]
- Agerri, R.; García-Serrano, A. Q-WordNet: Extracting polarity from WordNet senses. In Proceedings of the Seventh Conference on International Language Resources and Evaluation (LREC), Valletta, Malta, 17–23 May 2010. [Google Scholar]
- Berger, A.; Della Pietra, S.A.; Della Pietra, V.J. A maximum entropy approach to natural language processing. Comput. Linguist. 1996, 22, 39–71. [Google Scholar]
- Joachims, T. Text categorization with support vector machines: Learning with many relevant features. In Proceedings of the European Conference on Machine Learning, Chemnitz, Germany, 21–23 April 1998; pp. 137–142. [Google Scholar]
- Wang, S.I.; Manning, C.D. Baselines and bigrams: Simple, good sentiment and topic classification. In Proceedings of the 50th Annual Meeting of the Association for Computational Linguistics (Volume 2: Short Papers), Jeju, Korea, 8–14 July 2012; pp. 90–94. [Google Scholar]
- Mikolov, T.; Chen, K.; Corrado, G.; Dean, J. Efficient Estimation of Word Representations in Vector Space. In Proceedings of the 1st International Conference on Learning Representations, ICLR 2013, Scottsdale, AR, USA, 2–4 May 2013; Volume abs/1301.3781, pp. 1–12. [Google Scholar]
- Grave, E.; Bojanowski, P.; Gupta, P.; Joulin, A.; Mikolov, T. Learning Word Vectors for 157 Languages. In Proceedings of the Eleventh International Conference on Language Resources and Evaluation, LREC 2018, Miyazaki, Japan, 7–12 May 2018; pp. 3483–3487. [Google Scholar]
- Wang, A.; Singh, A.; Michael, J.; Hill, F.; Levy, O.; Bowman, S. GLUE: A Multi-Task Benchmark and Analysis Platform for Natural Language Understanding. In Proceedings of the 2019 EMNLP Workshop BlackboxNLP: Analyzing and Interpreting Neural Networks for NLP, New Orleans, LA, USA, 7–9 May 2019; pp. 353–355. [Google Scholar]
- Liu, G.; Guo, J. Bidirectional LSTM with attention mechanism and convolutional layer for text classification. Neurocomputing 2019, 337, 325–338. [Google Scholar] [CrossRef]
- Tang, D.; Qin, B.; Liu, T. Document modeling with gated recurrent neural network for sentiment classification. In Proceedings of the 2015 Conference on Empirical Methods in Natural Language Processing, Lisbon, Portugal, 17–21 September 2015; pp. 1422–1432. [Google Scholar]
- Wang, Y.; Feng, S.; Wang, D.; Zhang, Y.; Yu, G. Context-aware chinese microblog sentiment classification with bidirectional LSTM. In Proceedings of the Asia-Pacific Web Conference, Suzhou, China, 23–25 September 2016; pp. 594–606. [Google Scholar]
- Vaswani, A.; Shazeer, N.; Parmar, N.; Uszkoreit, J.; Jones, L.; Gomez, A.N.; Kaiser, L.; Polosukhin, I. Attention is All you Need. In Proceedings of the Advances in Neural Information Processing Systems 30: Annual Conference on Neural Information Processing Systems 2017, Long Beach, CA, USA, 4–9 December 2017; pp. 5998–6008. [Google Scholar]
- Seliverstov, Y.; Seliverstov, S.; Malygin, I.; Korolev, O. Traffic safety evaluation in Northwestern Federal District using sentiment analysis of Internet users’ reviews. Transp. Res. Procedia 2020, 50, 626–635. [Google Scholar] [CrossRef]
- Ali, F.; Kwak, D.; Khan, P.; El-Sappagh, S.; Ali, A.; Ullah, S.; Kim, K.H.; Kwak, K.S. Transportation sentiment analysis using word embedding and ontology-based topic modeling. Knowl.-Based Syst. 2019, 174, 27–42. [Google Scholar] [CrossRef]
- Ruiz Sánchez, T.; Mars Aicart, M.d.L.; Arroyo-López, M.R.; Serna, A. Social networks, big data and transport planning. Transp. Res. Procedia 2016, 18, 446–452. [Google Scholar] [CrossRef]
- Gitto, S.; Mancuso, P. Improving airport services using sentiment analysis of the websites. Tour. Manag. Perspect. 2017, 22, 132–136. [Google Scholar] [CrossRef]
- Effendy, V.; Novantirani, A.; Sabariah, M.K. Sentiment Analysis on Twitter about the Use of City Public Transportation Using Support Vector Machine Method. Intl. J. ICT 2016, 2, 57–66. [Google Scholar] [CrossRef] [Green Version]
- Anastasia, S.; Budi, I. Twitter sentiment analysis of online transportation service providers. In Proceedings of the 2016 International Conference on Advanced Computer Science and Information Systems (ICACSIS), Depok, Indonesia, 15–16 October 2016; pp. 359–365. [Google Scholar]
- Fayyad, U.; Piatetsky-Shapiro, G.; Smyth, P. From data mining to knowledge discovery in databases. AI Mag. 1996, 17, 37. [Google Scholar]
- Greene, D.L.; Wegener, M. Sustainable transport. J. Transp. Geogr. 1997, 5, 177–190. [Google Scholar] [CrossRef]
- Pavlou, P.A.; Dimoka, A. The nature and role of feedback text comments in online marketplaces: Implications for trust building, price premiums, and seller differentiation. Inf. Syst. Res. 2006, 17, 392–414. [Google Scholar] [CrossRef]
- Lak, P.; Turetken, O. Star ratings versus sentiment analysis–a comparison of explicit and implicit measures of opinions. In Proceedings of the 2014 47th Hawaii International Conference on System Sciences, Waikoloa, HI, USA, 6–9 January 2014; pp. 796–805. [Google Scholar]
- Forman, C.; Ghose, A.; Wiesenfeld, B. Examining the relationship between reviews and sales: The role of reviewer identity disclosure in electronic markets. Inf. Syst. Res. 2008, 19, 291–313. [Google Scholar] [CrossRef]
- Atkinson, K. Gnu aspell. 2003. Available online: http://aspell.sourceforge.net/ (accessed on 7 October 2020).
- Padró, L.; Stanilovsky, E. Freeling 3.0: Towards wider multilinguality. In Proceedings of the LREC2012, Istanbul, Turkey, 21–27 May 2012. [Google Scholar]
- Agirre, E.; López de Lacalle, O.; Soroa, A. Random Walks for Knowledge-Based Word Sense Disambiguation. Comput. Linguist. 2014, 40, 57–84. [Google Scholar] [CrossRef]
- Mohammad, S.; Kiritchenko, S.; Sobhani, P.; Zhu, X.; Cherry, C. SemEval-2016 Task 6: Detecting Stance in Tweets. In Proceedings of the 10th International Workshop on Semantic Evaluation (SemEval-2016), San Diego, CA, USA, 16–17 June 2016; pp. 31–41. [Google Scholar] [CrossRef]
Figure 1.
Cohen’s Kappa index.

Figure 2.
Wrongly tagged sentence before normalization and correction.

Figure 3.
Correctly tagged sentence after normalization and correction.

Figure 4.
Experiments on binary classification.

Figure 5.
XLM-R vs. SWN.


Table 1.
Classification according to sustainable transport.
| Transport Mode | Sustainable Transport Classification |
|---|---|
| Walking | 1 |
| Bike | 2 |
| Underground | 3 |
| Tramways | 4 |
| Funicular Railway | 5 |
| Bus | 6 |
| Ferries | 7 |
| Boat | 8 |
| Shuttles | 9 |
| Car | 10 |
| Motorbike | 11 |
Table 2.
Sustainable transport classification by TripAdvisor transport modes.
| TripAdvisor Transport Modes | # Sentences | Sustainable Transport Classification |
|---|---|---|
| Tramways | 35,327 | 4 |
| Taxis & Shuttles | 30,803 | 10 & 9 |
| Walking | 18,120 | 1 |
| Boat | 9059 | 8 |
| Bus | 8722 | 6 |
| Bike and Mountain bike | 7217 | 2 |
| Walk and Bike | 6256 | 1 & 2 |
| Ferries | 1668 | 7 |
| Funicular Railway | 855 | 5 |
Table 3.
Example of phrases removed from the 5 stars dataset (positive).
| Sentence | Manual Annotation |
|---|---|
| Getting on to the cable car was stressful because of some elderly tourists trying to push far into the queue. | negative |
| We thought and had been told that going to this during the day would not be good. | negative |
| Maybe a secret passage? | neutral |
| We went up for sunset and stayed til 8. | neutral |
| Hard to believe Bosnia is just a few miles away. | neutral |
| In fact we were the only 2 in the cable car going up! | neutral |
| It can get a bit chaotic at the base station as it is not clear where the ticked and boarding queues are when there are large cruise groups in. | negative |
| When I first visited the fortress 14 years ago, the cable car was not an option and the fort was a derelict ruin picked-mocked by shells absorbed in the Homeland War. | negative |
| The wind is strong on top so be prepared for that. | negative |
Table 4.
Aspell spell checker.
| Misspelled Word | Corrected Word |
|---|---|
| enjoty | enjoy |
| Fantasic | Fantastic |
| slpooy | sloppy |
| recomend | recommend |
| aplogising | apologising |
| incosiderate | inconsiderate |
| compnay | company |
Table 5.
Multiword expressions (MWE).
| MWE | Substitute Word |
|---|---|
| cable car | cable-car |
| tuk tuk | tuk-tuk |
| think twice before | think-twice-before |
| must do | must-do |
| never again | never-again |
| pick pocket | pick-pocket |
| not to be missed | recommend |
Table 6.
Linguistic analysis for polarity classification with SentiWordNet.
| MW Identificaton | Lowercase and Lemmatization Process | POS Tagging | POS Explanation | WordNet Identification |
|---|---|---|---|---|
| Instead_of | instead_of | IN | pos = preposition | - - |
| aplogising | aplogising | NN | pos = noun|type = common|num = singular | - - |
| , | , | Fc | pos = punctuation|type = comma | - - |
| the | the | DT | pos = determiner | - - |
| compnay | compnay | NN | pos = noun|type = common|num = singular | - - |
| tried | try | VBD | pos = verb|vform = past | -02530167-v |
| to | to | TO | pos = particle|type = to | - - |
| use | use | VB | pos = verb|vform = infinitive | -01158872-v |
| our | our | PRP$ | pos = pronoun|type = possessive | - - |
| card | card | NN | pos = noun|type = common|num = singular | -06627006-n |
| again | again | RB | pos = adverb|type = general | -00040365-r |
| . | . | Fp | pos = punctuation|type = period | - - |
Table 7.
XLM-RoBERTa results on multiclass classification.
| Accuracy | Stars | F1-Score | Macro F1-Score |
|---|---|---|---|
| 0.5472 | 1 | 0.6457 | 0.5418 |
| 2 | 0.5632 | ||
| 3 | 0.5691 | ||
| 4 | 0.5455 | ||
| 5 | 0.3853 |
Publisher’s Note: MDPI stays neutral with regard to jurisdictional claims in published maps and institutional affiliations. |
© 2021 by the authors. Licensee MDPI, Basel, Switzerland. This article is an open access article distributed under the terms and conditions of the Creative Commons Attribution (CC BY) license (http://creativecommons.org/licenses/by/4.0/).
Share and Cite
MDPI and ACS Style
Serna, A.; Soroa, A.; Agerri, R. Applying Deep Learning Techniques for Sentiment Analysis to Assess Sustainable Transport. Sustainability 2021, 13, 2397. https://0-doi-org.brum.beds.ac.uk/10.3390/su13042397
AMA Style
Serna A, Soroa A, Agerri R. Applying Deep Learning Techniques for Sentiment Analysis to Assess Sustainable Transport. Sustainability. 2021; 13(4):2397. https://0-doi-org.brum.beds.ac.uk/10.3390/su13042397
Chicago/Turabian StyleSerna, Ainhoa, Aitor Soroa, and Rodrigo Agerri. 2021. "Applying Deep Learning Techniques for Sentiment Analysis to Assess Sustainable Transport" Sustainability 13, no. 4: 2397. https://0-doi-org.brum.beds.ac.uk/10.3390/su13042397
Note that from the first issue of 2016, this journal uses article numbers instead of page numbers. See further details here.