
Mobility Styles and Car Ownership—Potentials for a Sustainable Urban Transport


Institute for Transport Studies, Karlsruhe Institute of Technology (KIT), 76131 Karlsruhe, Germany
*
Authors to whom correspondence should be addressed.
Sustainability 2021, 13(5), 2968; https://0-doi-org.brum.beds.ac.uk/10.3390/su13052968
Submission received: 5 February 2021
/
Revised: 27 February 2021
/
Accepted: 5 March 2021
/
Published: 9 March 2021
(This article belongs to the Special Issue Urban Transport Sustainability)
Abstract
:Decision-makers in cities worldwide have the responsibility to contribute to the reduction of greenhouse gas emissions in urban transport. Therefore, effective measures and policies that allow for a change in people’s mobility towards sustainable mobility must be derived. To understand how different people respond to measures and policies, and to increase the effectiveness of such policies, individual mobility needs and mobility determinants have to be considered. For this, the definition of individual mobility styles as holistic descriptions considering travel behavior, attitudes, as well as life stages is useful. This study presents a segmentation approach that identifies eight urban mobility styles by using data from a multidimensional survey conducted in Berlin and San Francisco. We applied a cluster analysis with both behavioral and attitudinal characteristics as segmentation criteria. By analyzing the characteristics, we identified a mobility style—the Environmentally Oriented Multimodals—that is environmentally oriented, but not yet all people in this cluster are sustainable in their mobility. Thus, they are the group with the highest potential to accept and use sustainable mobility. Additionally, we found that within the Environmentally Oriented Multimodals, the change from one life stage to another is also likely to be accompanied by a car acquisition.
1. Introduction
Given the persistently high level of car traffic in cities, decision-makers have the responsibility to make an important contribution to the reduction of greenhouse gas emissions in the transportation sector in accordance with the Paris Declaration. Restrictions, such as road pricing and parking management, are intended to limit car ownership as well as car use and instead promote multimodal behavior with bicycle and public transit use. Beyond car restrictions to induce a shift to other modes of transportation, the powertrain technology transformation to battery electric vehicles (BEV) is a promising development for unavoidable car use. Regulatory frameworks, such as subsidies, stimulate demand for BEVs. In addition, cities are planning to restrict the registration and use of conventional vehicles. For example, Paris is planning a ban on conventional vehicles for 2030 [1]. This raises the question of how residents react to such restrictions and how dependent they are on private cars. To understand how different people respond to interventions and to increase the efficiency of environmental interventions, a suitable segmentation of people from urban areas should be targeted. Mobility styles provide an appropriate and holistic approach to understanding different target groups. Depending on the application and the objective of the studies, the focus of mobility styles is on travel behavior, attitudes or life stages. Among them, however, is no approach that combines everyday and long-distance travel behavior with psychographic characteristics, such as motives for car use and environmental concerns, to identify potentials for sustainable travel behavior. Especially car ownership also depends on long-distance travel and represents a key challenge for electric mobility.
Mobility styles, resulting from such a holistic approach, would result in answers to the following research questions:
- Which mobility styles have an increased potential for accepting and using sustainable mobility solutions due to an ecological norm orientation?
- How do people with a sustainable mobility style, who own a car, differ from those who have the same mobility style, but do not own a car?
A comprehensive database is required to answer the diverse questions and to form multidimensional mobility styles. To meet this requirement, the concept of the travel skeleton was used, which focuses only on typical behavior in a “pseudo-longitudinal” approach instead of a travel diary. As the travel skeleton approach has a lower respondent burden, it allows to collect further detailed information (e.g., psychographic characteristics). As part of the study, 1200 people were surveyed in the two cities, San Francisco (U.S.) and Berlin (Germany), using face-to-face interviews. To derive two-dimensional mobility styles, we used a principal axis factoring in combination with a two-step cluster analysis. The life stage of people is used as a cluster-describing variable to explain differences between the mobility styles.
The following sections describe the outcome and conclusions of our analysis and are structured as follows: after a literature review and outline of the survey approach, we describe our methodology to identify urban mobility styles. The explanation of the cluster analysis follows. Based on the cluster solution, we identify and investigate a segment with a high potential of sustainable travel behavior through a car-less lifestyle in the future. Finally, we discuss our results and draw a conclusion.
2. Literature Review
Market segmentation is required to increase the efficiency of environmental interventions instead of using a “shotgun approach” and spread them across the whole population in urban areas [2]. Segmentation approaches have been used in transportation research since the 1970s. Fundamental work in this area goes back to Kutter [3,4], Pas [5] and Schmiedel [6]. By now, there is a large number of segmentation studies in travel behavior research and in the interdisciplinary fields of transportation. The segmentation criteria used in existing studies can be divided into three main categories in terms of content, following Stegmüller [7]: external (spatial, socio-demographic, socio-economic), behavioral and psychographic criteria.
2.1. Behavioral Typologies
Grouping individuals of similar behavior together is the most common one-dimensional approach, which has long been used in transportation research as well as planning. The purpose of the segmentation is not to explain the behavior of individuals on the basis of group formations. It is rather to simplify the complex reality so that other relationships can be recognized more easily [8]. Each segmentation of travel behavior is based, at its core, on Kutter’s [3] assumption that the variety of individual daily routines can be reduced to a few typical activities and patterns, given the present social structure. In the existing literature, behavioral segmentations in transportation have different objectives and include various characteristics, such as mode choice and activities. One focus of research are activity types. Various theories assume that the emergence of activity patterns does not depend solely on an expected utility. Moreover, the freedom of action is restricted by constraints (space and time) [8]. As a result, activity types are defined by activity patterns, which are characterized by trip purposes, schedule, duration and travel distance [9]. These types are used for complexity reduction and for realistic representation of differences in space-time behavior of individuals [10]. To identify activity patterns, one-day [9,11] and multi-day [8,10,12,13] travel diaries are mainly used. However, longitudinal surveys are preferable for their ability to capture intrapersonal variance [9]. In addition to activity-based segmentation, there are also approaches that focus only on mode choice. Their object is to study modality types [14,15] or the use of specific modes such as car use [16,17].
These approaches (activity and mode choice) focus mainly on indicators of everyday travel. In general, the consideration of long-distance travel plays a minor role in the segmentation of travel behavior. However, the consideration is reasonable, since a high proportion of the kilometers traveled is caused by long-distance travel, e.g., in Germany it is 45% [18]. Especially, when analyzing sustainable travel behavior of people, it is required to also capture their long-distance travel behavior. Segmentation studies show that there are discrepancies between everyday and non-everyday travel behavior of individuals in terms of sustainable mobility and environmental concerns [19,20].
Another limitation in behavioral segmentations is the lack of information on motives, attitudes and preferences. In recent years, studies by Anable [21] or Hunecke et al. [22] have shown the potential for combining psychological theory and market segmentation, using constructs from the Theory of Planned Behavior [23]. These constructs are considered in more holistic approaches, such as mobility styles.
2.2. Mobility Style Typologies
The multidimensional research concept of mobility styles is about combining methods of lifestyle research with those of travel behavior and relating them to problems of sustainability [24]. Proposed definitions of lifestyle range from quantitative to conceptual ones [25]. Early empirical frameworks operationalized the concept of lifestyles with socio-economic variables and life stages as indictors for lifestyle [26]. Sharp [27] defines lifestyle in terms of household size, age and the social roles as a concept for broad characterization of households. In general, the existing literature provides evidence that life stages have an influence on behavior. Kuhnimhof et al. [28] point out such differences as individuals experience an increase in mobility due to the formation of long-term configurations with regard to residential and work location as well as social networks and habits. Janke et al. [15] also highlight the influence of life stages on travel behavior in their study. Especially, life events (e.g., retirement, having children) trigger changes in travel behavior.
Götz and Ohnmacht [26] argue that lifestyle or mobility styles can be measured even better with orientations. This is also in accordance with the work of Weber [29] as well as Bourdieu and Russer [30], who see lifestyles as attitudes, orientations or preferences. Following Götz et al. [24], mobility styles only emerge through the relationship between orientations and behavior. Götz [31] describes this approach as closing the gap in transportation research through linking the micro-level of psychology with the macro-level of social theory. Attitudinal, motivational and lifestyle dimensions can provide an additional contribution towards explaining variance in travel behavior [26]. One of the early approaches was done by Götz et al. [32] in an urban ecological study on mobility concepts in two German cities in 1998. Redmond [33] performs a segmentation based on psychographic characteristics, such as stress or convenience, with six clusters on the one hand, and a segmentation based on a combination of personality and lifestyle with eleven clusters on the other hand. Both clustering solutions are compared in terms of socio-demographic characteristics. Haustein [34] segments elderly people into four different groups based on car availability, income, facilities (e.g., shopping facilities) within walking distance, social network and five psychological factors. Based on the obtained groups, differences in travel behavior are investigated and, in particular, differences in car use are demonstrated. Further relevant contributions to the mobility style approaches with a partly strong focus on leisure mobility can be found in the study of Ohnmacht et al. [35].
Besides the mentioned studies about mobility styles, there are also studies in which attitudes and behavior were used as constituent variables simultaneously. These studies have the advantage that emerging segments can reveal dissonances between attitudes and behavior. The emerging segments are not always termed mobility styles. They are called urban mobility types, car dependence types or mobility cultures in the specific studies. However, these approaches are similar to the mobility styles described above. Why it is preferable to use attitudes and behavior simultaneously is also shown by Anable’s [21] findings. She mentions that the same behavior can occur for different underlying motivations and that the same attitudes can result in different behaviors. The following studies use attitudes and behavior simultaneously to identify dissonances. Among five different segments of car owners, von Behren et al. [36] identified the “Car Captives”, who are objectively dependent on the car, but at the same time have a low affective motive. Haustein and Nielsen [2] use motives for mode choice, such as speed, convenience and price, as well as the revealed use of different modes, to find eight mobility styles at the country level in Europe. Consistent segments have emerged, such as the “Green Cyclists” or the “Convenience Drivers”. When considering subjective and objective dimensions, mobility styles with strong contradictions are also revealed. One such mobility style is represented by the “Busy Green Drivers”, of which 96% use cars in everyday life because of speed advantages. At the same time, however, they are concerned about the environment due to traffic pollution. Ramos et al. [37] use a similar two-dimensional approach to investigate differences between car sharing users and non-users in Sweden and Italy. Besides car and public transit use, the authors also consider environmental concern and personal norm as cluster-forming variables. The car sharing users named “Active Public Transit Green” have high environmental concerns and mainly use active modes and public transit. This segment consists of people with a higher income compared to the other four identified segments.
2.3. Theoretical Background for the Analysis
Based on the literature presented, we derive a methodological approach to identify mobility styles as target groups for sustainable urban transport. From the literature, it is known that symbolic-affective or instrumental motives for car use in combination with environmental concerns can explain frequent car use and car ownership in urban areas [38,39]. Further, attitudes were found to show an impact on modal switch [40], which is important for deriving sustainable mobility solutions. Considering the study of Götz and Ohnmacht [26], the inclusion of attitudes and orientations allows to consider lifestyles, which provide insights into understanding travel behavior. This is linked to the findings of Anable [21] that the inclusion of behavioral characteristics simultaneously to attitudinal characteristics allows for the identification of dissonances between both dimensions. Further, Prillwitz and Barr [41] suggest a comprehensive approach with including different aspects of individual mobility and attitudinal characteristics in segmentation to account for contrasting influences. Based on these findings, a segmentation approach that includes aspects of travel behavior and of psychographic characteristics jointly is promising to find distinct mobility styles. However, even if this two-dimensional approach is conducted, it remains unclear, in the context of sustainable urban transport, if there are still differences between car owners and non-car owners within the resulting mobility styles. This leads to our hypothesis for our study: People with a car have a lower ecological norm compared to people without a car. This hypothesis is tested in our study by applying a factor analysis on an item set to identify motives for car use and car ownership and a factor describing ecological norm as well as by selecting behavioral characteristics as cluster-forming variables in a segmentation approach. The resulting mobility styles are then analyzed and described by their specific characteristics. Differences between mobility styles with high car ownership compared to mobility styles with low car ownership will be discussed and implications for the potentials of electric vehicles are given. In addition, we present an in-depth analysis of the mobility style with the highest ecological norm regarding differences between car owners and non-car owners. The results of the segmentation of mobility styles and of the in-depth analysis provide insights on how to find and to address distinct target groups in order to improve a more sustainable urban transport.
3. Survey Design, Data Collection and Sample Description
In this section, we first introduce our study design to capture different aspects for identifying mobility styles in urban areas. Second, we describe our data collection and the sample used for our analysis.
3.1. Survey Design
The analysis of mobility styles requires extensive information (e.g., behavior, sociodemographic and psychographic characteristics). For capturing travel behavior, longitudinal travel surveys with travel diaries are usually used. However, these are expensive, highly time-consuming and result in a high respondent burden and subsequent low response rates [42]. An alternative to travel diaries is the concept of the travel skeleton. The idea of this concept is derived from the longitudinal travel survey of the German Mobility Panel (MOP). Instead of surveying every single trip within a random week by means of a diary, we ask the respondents about relevant activities, trips to these activities and their mode choice in a “typical week” as a “pseudo-longitudinal” approach. The everyday travel is captured through the relevant activities: work, leisure, chauffeuring, errands and shopping. Besides everyday travel, this approach also captures long-distance travel. Surveying travel behavior by means of such a less complicated approach reduces respondent burden considerably and thus allows to integrate psychographic item sets. Including both dimensions (behavior and psychology) allows for an improved understanding of the determinants of mobility [38]. The concept of the travel skeleton has already been tested in various international studies in the U.S., China and Germany [20,38,43,44,45,46].
To survey the psychographic characteristics to understand motives, attitudes and norms, we use two standardized item sets that are based on Likert scales. For high validity of the research instrument, we did not develop the used psychological items ourselves. To identify psychological constructs, we integrated comprehensively tested item sets from Hunecke et al. [47] and Steg [39] into our travel skeleton approach. Hunecke’s item set on the intrapersonal evaluation of mode use was drawn from the Theory of Planned Behavior [23] and other mobility-related attitudinal dimensions [22]. One of the constructs that emerges is the ecological norm orientation, which shows a strong relationship with sustainable mode use [47]. Steg’s item set is derived from Dittmar’s model of material possessions [48] and distinguishes the psychological functions of the car into three motive classes: instrumental, affective and symbolic. Steg’s research on motives for car use serves as the basis for numerous studies [38,49]. The three motive classes in relation to car use cannot always be completely separated, e.g., “affective-symbolic” factors also arise [39,49,50]. In summary, both item sets are well established in transport psychology and have been sufficiently validated.
3.2. Data Collection
This study is based on data collected by means of the travel skeleton in surveys with face-to-face interviews conducted in the urban areas of Berlin (Germany) and San Francisco (U.S.) between October 2016 and January 2017. Both cities are comparable by their similar urban mobility culture according to Priester et al. [51] who segmented 41 international cities into six different urban mobility cultures. San Francisco and Berlin are considered as “hybrid cities”, with dense, public transit-oriented urban cores with high levels of public transit and non-motorized transportation use, and are surrounded by low-density, car-oriented suburban areas [52]. In both cities, public transit has a share of more than 25%, walking more than 23%. However, also, a relevant share of car use is observable [53,54]. Differences can only be seen in cycling, as San Francisco has a hilly topography. The hybrid character is favored by sufficient transport infrastructure development, which can be described as a “push-and-push” policy. These cities have invested in both road infrastructure and public transit [51].
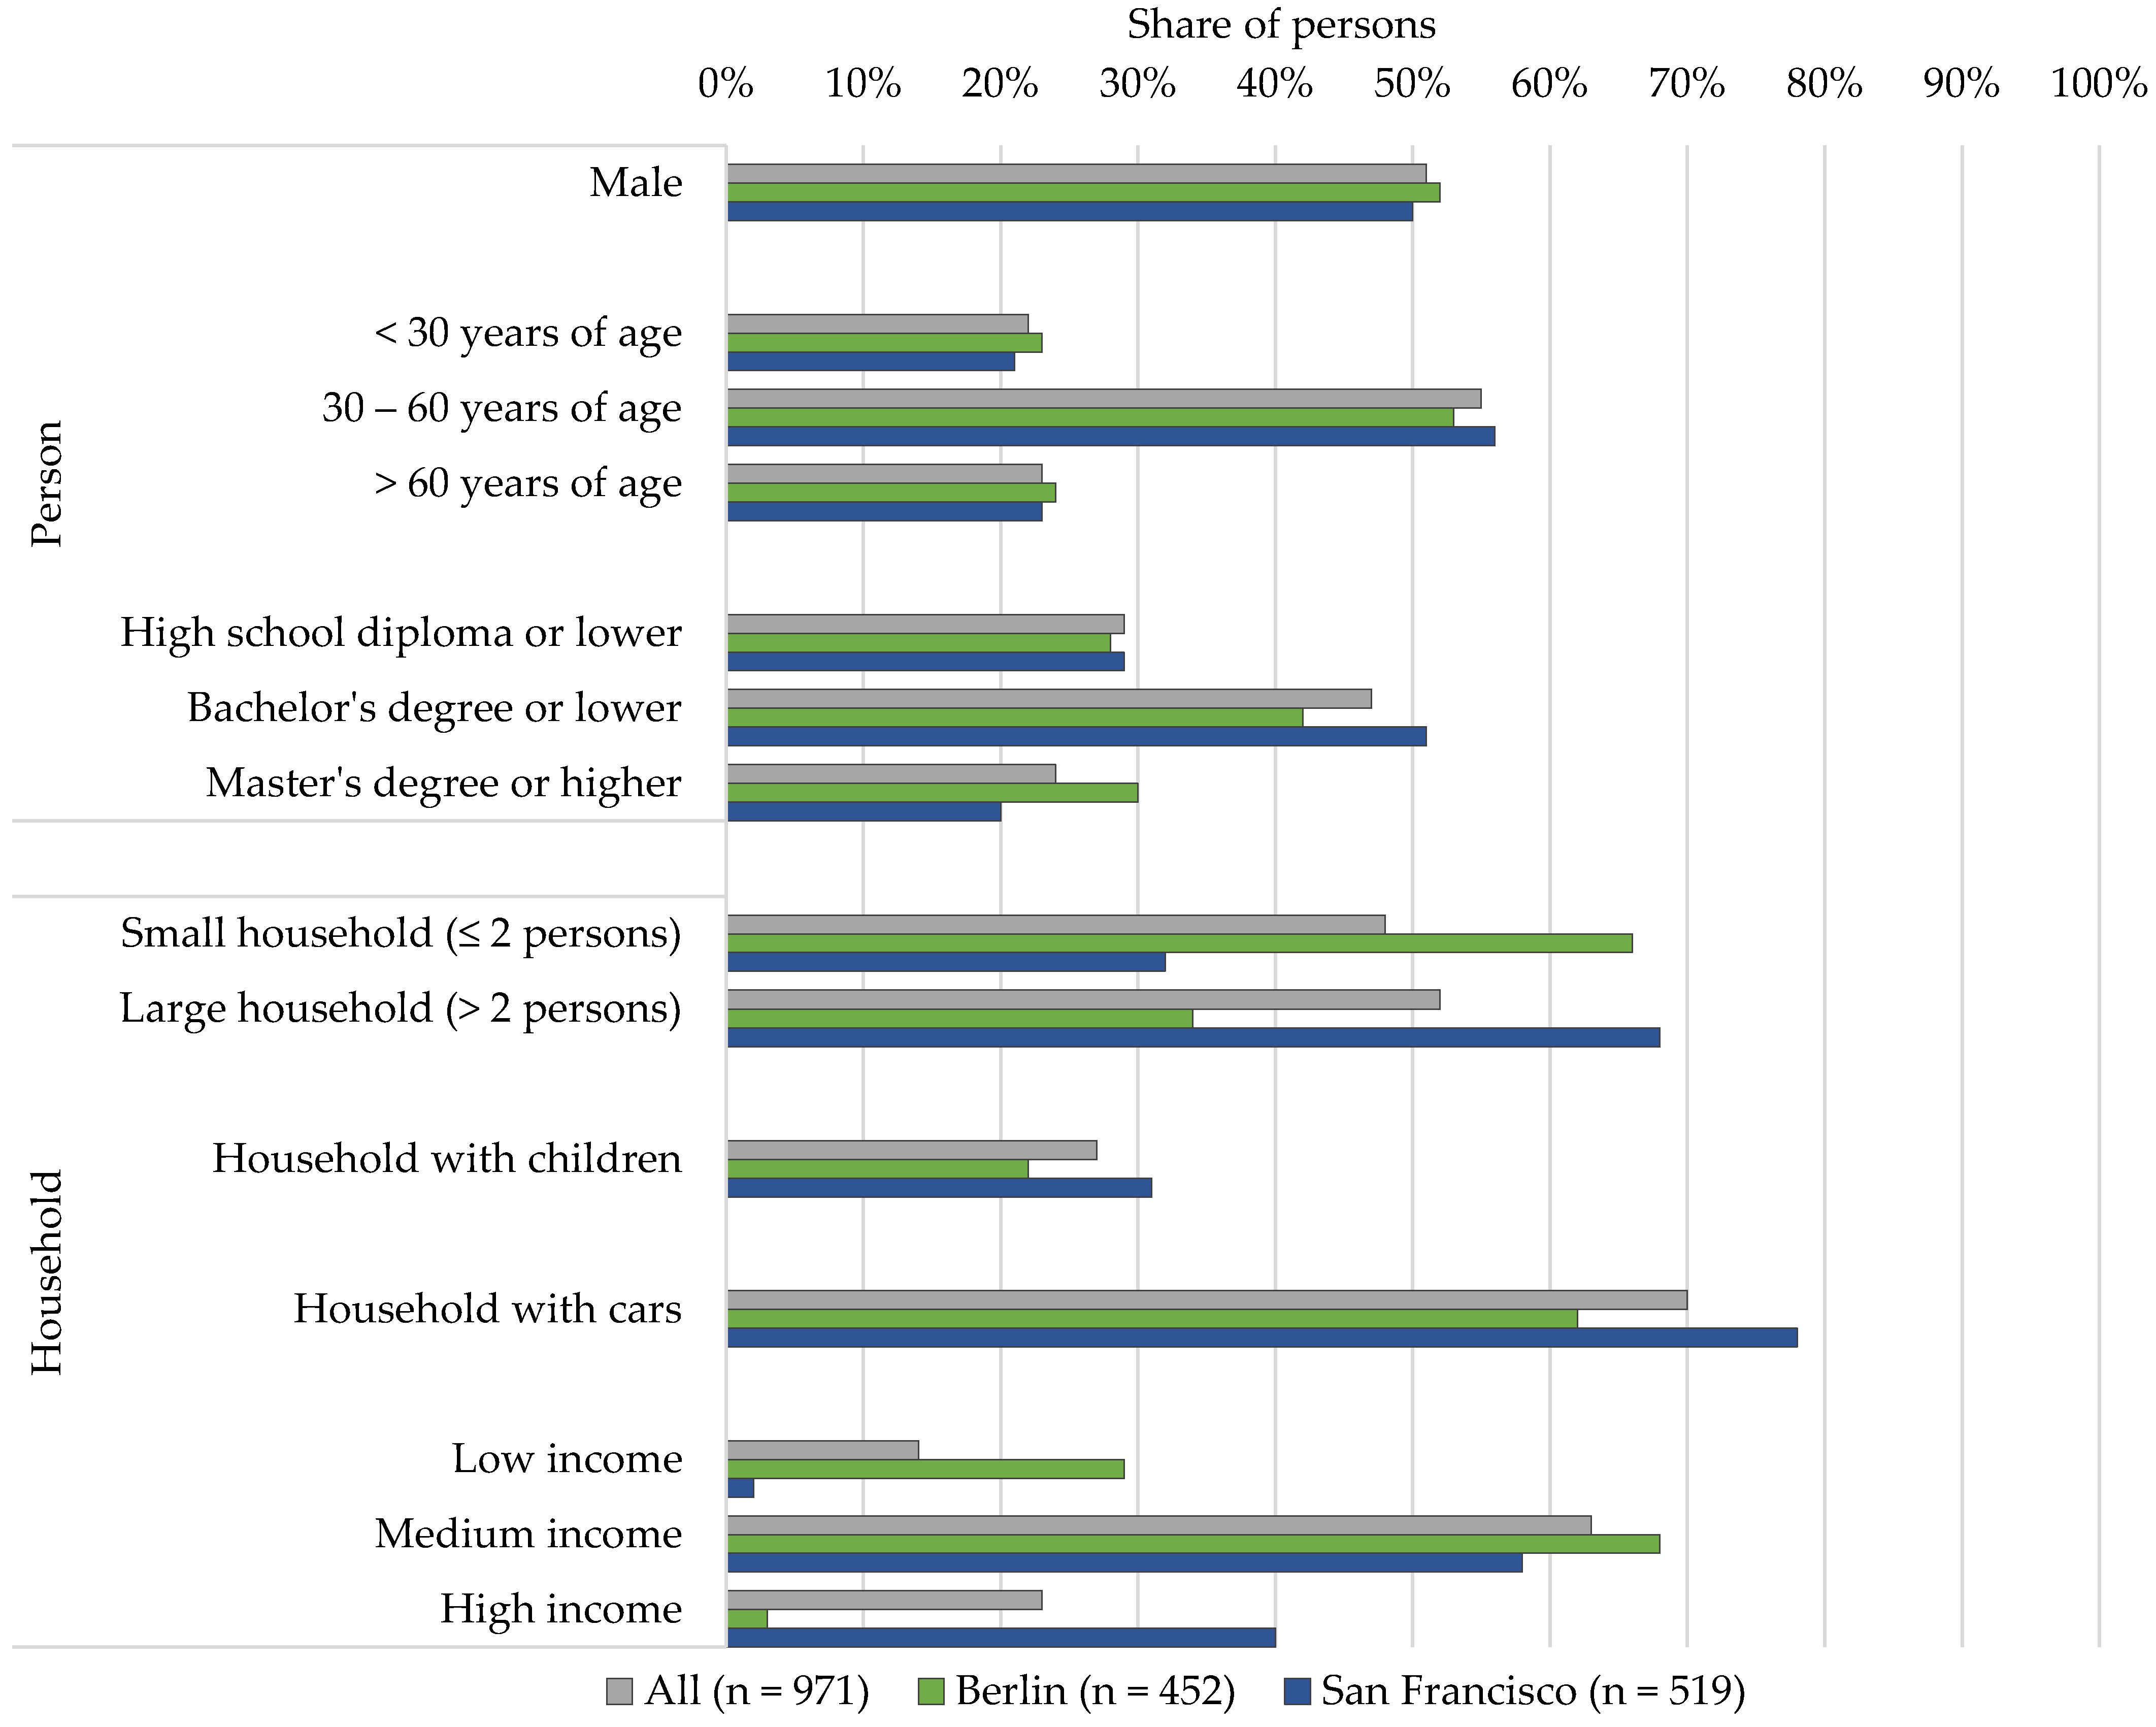
The survey had a focus on capturing the mobility-determining characteristics of urban living people in the course of market research. The survey instrument had the aim to provide comprehensive data for various use cases so that it allows to investigate different aspects of mobility. The total sample size from both cities is 1200 people, with 600 respondents from each city. The sampling approach of the professional market research firm in charge of data collection was based on age, gender, household size, spatial type of residence and net income. The distribution of the sample characteristics is also shown in Figure 1. The resulting sample shows an underrepresentation of single-person households. The other characteristics, such as the distribution of gender and of the younger and middle age groups, are well met. In Berlin, we have a slightly lower share of people in the oldest age group (22%) compared to the external statistics (29%).
In addition, we verified relevant travel indicators from our sample with travel statistics of both cities to validate our survey instrument. In our sample from Berlin (BER) and San Francisco (SFO), the indicator trips per day is slightly lower (BER: 3.0/SFO: 2.4) than the values from travel statistics (BER: 3.5/SFO: 3.0) [55,56]. This was expected due to the exclusion of random trips by using the travel skeleton approach. The modal shares of our sample in Berlin is nearly identical with the official statistics of Mobilities in Cities 2018 [55]. In our sample from San Francisco, we have a slightly higher share of car use than in the Travel Decisions Survey 2017 [53].
3.3. Sample Description
For the analysis, individuals with missing data were eliminated and a subsample of 971 individuals remained (see Figure 1): 47% of the individuals from the subsample live in Berlin and 53% in San Francisco. In each city, roughly half of the respondents are male. Further, age is equally distributed in both cities in our sample. The figure also shows that 40% of respondents in San Francisco live in a household with high income, whereas in Berlin, this is only the case for 3%. Accordingly, in our sample from Berlin, a higher share of respondents live in households with low income.
4. Methodology
In this section, we present our methodological approach to identify mobility types. First, we prepare and select input variables for our segmentation. Second, we perform a clustering to segment individuals.
4.1. Data Pre-Analysis
A key challenge in segmentation lies in the selection of input variables (segmentation criteria), as these significantly influence the subsequent allocation in the segmentation process. In this study, we include input variables, both attitudinal and behavioral characteristics, to identify mobility styles that differ from each other in both dimensions.
4.1.1. Behavioral Characteristics
The travel indicators used as segmentation criteria are intended to address different aspects of mobility behavior (e.g., everyday and long-distance travel mobility). The selection of indicators describes four important aspects:
- Traffic volume
- Mode choice (multimodal behavior/importance of the private car)
- Choice of activities in everyday life
- Long-distance travel behavior
Five travel indicators were calculated to represent these different aspects. The selection of these behavioral indicators is adapted from previous studies [20,46]. First, we calculated the average number of trips per day, based on the given information about trips in a typical week. The second indicator captures the monomodal or multimodal behavior, which describes how many different modes are used. To calculate a measure of mode stability (monomodal behavior), we used the Herfindahl-Hirschman-Index (HHI), as used by Mallig and Vortisch [57]. This indicator has a range between 0 (high multimodal behavior) and 1 (monomodal behavior). The third indicator is the share of car use and includes all trips made by car (driver, passenger) and car-related on-demand services. This indicator represents the share of car use in the individual modal split in a typical week and shows the importance of the car. This indicator has a range between 0 (no car use) and 1 (car is the only mode used). The fourth indicator, share of mandatory trips, describes the share of trips to work or school out of all trips in a typical week. This distinction is adapted from Hilgert et al. [58]. The last indicator used was the calculated number of long-distance trips (overnight and daily trips with distances > 100 km) within a year. Since all five indicators showed some interpersonal variation across all participants, they were considered as cluster-forming variables for the following segmentation.
4.1.2. Psychographic Characteristics
Apart from behavioral characteristics, psychographic characteristics were also chosen as segmentation criteria. As a preliminary analysis to our segmentation and to reduce the complexity, we used a principal axis factoring (PAF) method based on selected attitudinal indicators. Before performing the PAF, we conducted Bartlett’s test of sphericity (<0.001) which indicates that the data is suitable for the factor analysis as it proves if the correlation matrix, which underlies the analysis, is statistically significant [59,60]. Table 1 shows the results of the PAF with varimax rotated patterns. Based on the scree plot (elbow criterion) and the Kaiser’s criterion, three factors were extracted: one describing the symbolic-affective motive and one describing the instrumental motive for car use and car ownership—these two factors correspond to the psychological constructs identified by Steg [39]—and in addition, we identified a third factor regarding the ecological norm of the people, which corresponds to the ecological norm orientation measured by Hunecke et al. [47].
The factor “symbolic-affective motive” describes whether people like to drive and whether the car can have a symbolic function. The factor “instrumental motive” describes whether people only use the car as a tool to fulfill their mobility needs. The factor “ecological norm” represents the social and personal norm concerning the choice of environmental-friendly transport modes. All three factors were found to have sufficient internal consistency (reliability) with a Cronbach’s alpha of 0.86 (“symbolic-affective motive”), 0.80 (“ecological norm”) and 0.73 (“instrumental motive”), respectively. The low value for Cronbach’s alpha of “instrumental motive” (0.73) only shows an acceptable reliability due to the number of attitudinal indicators for the measure. While this is sufficient overall, it must be considered in further analysis.
4.1.3. Life Stages
An individual life course can be divided into life stages. These stages describe periods with different life circumstances (e.g., having children, retirement) that influence behavior and attitudes [21]. However, in the existing literature, the definition of life stages is not uniform [61], as linear and non-linear approaches exist. Within linear approaches, the life stages are roughly in an age-dependent order. The stages are further distinguished by occupation, relationship status and parenthood. A common linear definition is given by Gilly and Enis [62], who define childhood, young adulthood, living with a partner, early career, marriage, parenthood and retirement as distinct life stage. More complex distinctions are non-linear approaches, which are less age-dependent and also include divorce and re-marriage [15]. In our study, we use a linear approach and define life stage groups depending on household structure, job situation and age. Therefore, we adapted the mentioned life stages from Gilly and Enis [62]. The more advanced distinction of life stages such as marriage, divorce or re-marriage is not possible due to lack of data. The following six life stages were defined: younger people without children (currently aged under 40 years) and not employed (people are independent and mainly students), younger people without children but employed (currently aged under 45 years in their early career), large household with children (obligations due to children under 18 years and job), large households without children aged under 18 years (obligations due to family and job), middle-aged people (currently aged between 45 and 65 years) with employment (e.g., children left home) and elderly people without employment (e.g., retirement).
For the following segmentation, eight variables are used from the behavioral and psychographic characteristics (five behavioral and three attitudinal). The information about the life stages is not included in the segmentation process. This information is later used to explain differences between the identified segments.
4.2. Clustering
Segmentation approaches are basically divided into the two categories, supervised (a priori) and unsupervised (post hoc) methodologies [21]. The supervised methodologies are used when the segments are known or predefined and the main objective is to classify new observations into these segments. Unsupervised methodologies are used when the objective is to find homogeneous groups in multivariate data. Among the different methods of cluster analysis, hierarchical and partitioning cluster analyses are most common in transportation. To utilize the advantage of both methodologies, the hierarchical Ward’s method is combined with the partitioning method of k-means in a two-step cluster analysis in transportation [12,20,21,60,63,64]. This two-step approach is also used in our study. To ensure that the eight cluster-forming variables do not have different weights, a linear transformation is performed with the procedure ACECLUS (Approximate Covariance Estimation for Clustering) in the software SAS [65]. Including the cluster-forming variables in our two-step cluster analysis, we first calculated the optimal number of clusters with the minimum variance method (Ward’s method) [66]. Based on the Cubic Cluster Criterion (CCC) and Pseudo t2, we obtained an 8-cluster solution [65]. In the second step, the cluster centroids were then used as starting points in the following k-means clustering to improve the overall solution. This is because the k-means algorithm allows for a modified allocation or exchange of observations between the clusters [20].
5. Results
As a result of the selection of cluster-forming variables in combination with the two-step cluster analysis, we identified eight clusters. Each cluster represents a mobility style with distinctive characteristics that reflects a group of people from our survey. In the following, we statistically analyze the mobility styles by identifying significant differences between the means of the cluster characteristics through Welch analysis of variance (ANOVA) and Tukey post-hoc tests. For categorical characteristics, we applied chi-square tests. Based on the specific characteristics, we name the eight mobility styles. Subsequently, we conduct an in-depth analysis of the largest and (from a sustainability standpoint) most interesting group for future mobility solutions.
5.1. Cluster Description
Table 2 contains the mean values of different variables for all clusters. Significant differences in means to other clusters are given by superscripted numerals.
CL 1 and CL 4 show the lowest number of trips per day and a small share of mandatory trips. However, CL 1 has a significantly higher share of car use than CL 4. Furthermore, people from CL 4 do not perceive any instrumental or symbolic-affective motives in association with cars. CL 2 and CL 3 have a similar symbolic-affective motive for car use. However, they are significantly different in mode stability and their share of car use. People in CL 2 have a significantly higher share of car use than CL 3. Despite also using other means of transportation, people in CL 3 still have a high share of car use of 0.69. CL 5 and CL 7 both have a low share of car use. Interestingly though, they are significantly different regarding their ecological norm. Moreover, CL 7 is by far the largest cluster in our study and contains people with multimodal behavior. Lastly, CL 8 mainly distinguishes itself from the other clusters through its high number of long-distance trips per year, even if there is no significant difference of the ecological norm to CL7.
The further cluster-describing variables in Table 2 allow for the analysis of additional cluster aspects. CL 2 and CL 3 show the highest car ownership and the highest mean travel distance per day. For people in CL 5, it is specific that they rather live in the suburbs. The frequencies of use of different transport modes highlight further significant differences between the clusters. People in CL 2 and CL 3 drive cars more often than all other clusters. In contrast, people from CL 7 and CL 8 cycle more frequently than other clusters. CL 5 and CL7 are the most frequent public transit users among the mobility styles.
Table 3 highlights the socio-economic characteristics of the clusters. An important variable for interpreting mobility styles is the life stage. Since mobility needs change with each life stage with specific circumstances [28], it can help to understand why people have a certain mobility style. For example, it reveals that CL 1, CL 4 and CL 6 primarily consist of elderly and retired people. This explains why people from these clusters have few mandatory activities and are thus making the least trips per day. In contrast to this, CL 7 mainly contains young, independent people with a comparatively low income and a high ecological norm. This cluster is particularly relevant to the topic of sustainability, as it evidently represents the environmentally oriented generation of the future. It is therefore considered in more detail in the following Section 5.2. CL 2, CL 3 and CL 5 can be identified as mostly middle-aged families. Work obligations and chauffeuring of children explain their high need for mobility in everyday life.
CL 2 and CL 3 have the highest shares of people with high household income and these people can thus afford owning several cars (see Table 2). In combination with their strong symbolic-affective motive, this leads to them using cars for the majority of their trips. Lastly, CL 8 stands out as 88% of its people have a university degree and people in this cluster are from almost all life stages. Despite the high education, people from this cluster show a strong symbolic-affective motive and take the most long-distance trips by far. Thus, in this cluster, many peoples’ symbolic-affective motive for car use seems to outweigh their environmental concerns.
Based on the analysis of the cluster-forming, cluster-describing and socio-economic variables, we can summarize each cluster’s characteristic features (see Table 4). In addition, each cluster is given a concise name, to simplify the understanding of the clusters as mobility styles.
5.2. In-Depth Analysis of Cluster 7 (Environmentally Oriented Multimodals)
In the previous section, CL 7 was identified to likely include the environmentally oriented generation of the future as it mainly consists of environmentally oriented young people with multimodal behavior. They have the most progressive mobility style in terms of sustainability. However, in our subsample, half of these people own a car. This raises the question, what causes so many urban people with a high ecological norm to own a car they rarely use. To investigate this issue and our hypothesis presented in Section 2.3, we differentiate people from CL 7 who own a car from those who do not and analyze the differences between the two groups.
Table 5 presents the descriptive characteristics of both groups within the cluster. It shows that car ownership is not explained by a lower environmental norm. In addition, no significant difference regarding the instrumental motive is revealed. Instead, people without a car have a significantly lower symbolic-affective motive for car use. Accordingly, they make very frequent use of walking or public transit in order to be mobile. However, even the car owners in this cluster walk and use public transit more frequently than they use their car. This explains the small share of car use of only 0.17 for this group’s everyday travel.
The socio-demographic characteristics of the two different groups within the cluster are illustrated in Table 6. It becomes clear that for the Environmentally Oriented Multimodals, education has no apparent relation with car ownership. On the contrary, household income is related to car ownership. Nearly half of the people that do not own a car have a low income, whereas this is only the case for 13% of people that own a car.
Furthermore, the results indicate an impact of the life stage on car ownership: 55% of people without a car are young, while among car owners, 55% live in families and only 21% are young people. This indicates that even among Environmentally Oriented Multimodals, many families feel the necessity to own a car, which they only rarely use for certain mobility needs such as weekend excursions not accessible by public transit. Further, the results indicate that the additional consideration of life stages reveals differences within a mobility style, even if attitudinal characteristics were considered in the segmentation process.
6. Discussion
The analysis of the mobility style characteristics has yielded insights which allow for the research questions to be answered. The Car-averted Low Mobiles (CL 4) and the Multimodal Travelers (CL 6) are identified and described as people who, if they are mobile, already use public transit or other sustainable means of transportation such as walking and cycling. For the further discussion, we focus on the other identified clusters that have higher levels of mobility or car use. However, we underline that policy measures can also have an effect on CL 4 and CL 6, and, above all, care must be taken so that the attractiveness for these people to use public transit is not reduced. Low Mobile Car Users (CL 1), Car Addicts (CL 2), Car-oriented Everyday Performers (CL 3), Public Transit Enthusiasts (CL 5), Environmentally Oriented Multimodals (CL 7) and Travel Addicts (CL 8) can be identified as the main target groups to improve the sustainability of urban mobility due to their high mobility needs or car ownership. In total, 80% of the people we analyzed are assigned to these mobility styles. Car Addicts (CL 2) and Car-oriented Everyday Performers (CL 3) are by far the most frequent car users. Thus, these clusters are the least sustainable in terms of emissions in everyday travel. In contrast to this, Public Transit Enthusiasts (CL 5) mainly use public transit and are relatively independent from the car. Apart from being car-independent, most of these people still have a car in the household, which can consequently take up urban public space. However, it must also be considered that car ownership is often a decision on household-level. It is likely that other household members and their mobility needs are the reason for the car ownership and not the individual assigned to the Public Transit Enthusiasts (CL 7) in our analysis. The high car ownership of Low Mobile Car Users (CL 1) brings about the same problem regarding the use of public space. Similar to CL 5, half of the Environmentally Oriented Multimodals (CL 7) live in households with a car, although they mainly rely on the multimodal use of other means of transportation. Travel Addicts (CL 8) behave unsustainably in terms of emissions, considering their high number of long-distance trips.
To determine their potential for accepting and using sustainable mobility solutions, the identified mobility styles can be divided into four groups:
- Mobility styles with little potential
- Mobility styles that are already sustainable, but not due to their norms
- Mobility styles that are already sustainable due to their norms
- Mobility styles that are unsustainable, even though they have a high ecological norm
Low Mobile Car Users (CL 1) have a high share of car use in combination with a low symbolic-affective motive for car use. This shows their dependency on the car. Car Addicts (CL 2) and Car-oriented Everyday Performers (CL 3) mainly use a car because of their strong symbolic-affective motive. Thus, all three mobility styles have little potential to respond to sustainable mobility solutions due to their fixed motives for car use and their low ecological norm. Two appropriate measures to improve the sustainability in the mobility of these clusters might be financial incentives to switch to a BEV or restrictive regulation for cars with combustion engines in urban areas.
Public Transit Enthusiasts (CL 5) are already relatively sustainable in their mobility as they primarily use public transit and have a low share of car use. The reason for this behavior is that they neither have symbolic-affective nor instrumental motives for car use. However, since the ecological norm is also not strong, other motivations must play a role. These might be financial restrictions or the socialization with the use of public transit. This cluster thus represents the group of people who are already largely sustainable in their mobility, but not due to their ecological norms. A problem with this group is the relatively high car ownership in comparison to the low share of car use in everyday travel, though it is likely that other household members and their mobility needs are the reason for the car ownership. One possible measure to motivate people to give up their unused cars might be higher parking fees in combination with the provision of a car-sharing system. As people in this cluster also rather live in suburbs, the provision of an electric bike sharing system as presented by Bieliński et al. [67] enhances the public transit services and thus could further support the use of public transit.
The in-depth analysis of CL 7 revealed that even among Environmentally Oriented Multimodals, there are differences in the sustainability of people’s mobility. Half of the people with this mobility style do not own a car and make trips almost exclusively by foot, by bike or with public transit. They account for 13% of our subsample and can be identified as the only truly sustainable group in their everyday mobility. From the particularly high ecological norm and the low symbolic-affective motive for car use, it can be concluded that this behavior is caused by conviction.
The other half of Environmentally Oriented Multimodals (CL 7) are mainly people having families, who feel the necessity to own a car, because of certain obligations. They can be described as people who are environmentally oriented, but are not yet sustainable in their mobility. Thus, they have the biggest potential to accept and use sustainable mobility solutions. Although the Travel Addicts (CL 8) do not show a high environmental norm, we see potential to address them with sustainable mobility systems such as electric shared mobility systems as an alternative of car ownership, as they have a medium share of car use in daily travel and are rather multimodal. However, such systems have to be reliable and improved, as described by Turoń et al. [68], to meet the mobility needs of this cluster as it is primarily described by a high number of long-distance travel events.
7. Limitations of the Approach
The methodology applied and the discussion of the results presented led to a better understanding of mobility styles in urban areas. With our segmentation, we are able to identify different potentials for a more sustainable mobility for each mobility style. Nevertheless, the limitations of our study should not be overlooked. We see two limitations that need to be considered. Firstly, in this study, we examined people from Berlin and San Francisco only. However, it is likely that in other cities, for example in other cultures or cities with potentially other qualities of public transport infrastructure and services, we find other mobility styles and discover other potentials for sustainable mobility. Secondly, we only captured mobility at one point in time with our study. Our results show that people in different life stages are assigned to different mobility styles. However, we do not see whether people stay in their mobility style during their life cycle or whether they change to other mobility styles as they change into other life phases. This would require more in-depth studies of socialization and cohort effects, which cannot be answered with the provided data, since the survey did not follow a panel approach.
8. Conclusions
This study identified eight urban mobility styles by using data from a multidimensional survey approach and by applying a cluster analysis with both behavioral and attitudinal characteristics as segmentation criteria. The resulting segments describe the diversity of mobility of individuals in urban areas with their specific mobility-determining characteristics. For example, we found mobility styles who choose a particular mode of transportation out of conviction, and other mobility styles, who are led to the use of a particular mode of transportation by “external” constraints. These findings allow for a deeper understanding of mobility and thus the derivation of potentials for influencing these mobility styles with the goal of a more sustainable mobility in cities. The following conclusions can be drawn for the different steps presented in this study.
Our presented segmentation approach has many advantages. Since both attitudinal characteristics and behavioral characteristics were included in the segmentation at the same time, we found clusters that are similar in one dimension, but different in another. Furthermore, the descriptive analysis of the clusters made it possible to identify and describe the specific characteristics of each cluster. In this context, the examination of life stages is to be highlighted. We identified a link between the life stages and the mobility styles since certain life stages are overrepresented in some mobility styles. By considering life stages, we broadened our view from the person level to the household context and gained a better understanding of mobility. In this context, it also became apparent that a more in-depth analysis of mobility styles, as opposed to the usual mean-value approach, provides further insights into characteristics that influence mobility. Through our in-depth analysis of the cluster Environmentally Oriented Multimodals, we found that within this mobility style, the change from one life stage to another is also likely to be accompanied by a car acquisition. Against our hypothesis, the in-depth analysis of this cluster revealed that car owners are different to non-car owners primarily because of their symbolic-affective motive rather than because of a lower environmental norm.
By analyzing the characteristics of all mobility styles, we were able to identify the target groups for improving the sustainability of urban mobility: 80% of the people within our analyzed sample are assigned to one of these mobility styles. To answer the question of which of these mobility styles has an increased potential for accepting and using sustainable mobility solutions, we divided them into four groups. Two of the groups are already sustainable in their mobility and one group has little potential for adopting sustainable mobility solutions. The last group of people are environmentally oriented but are not yet sustainable in their mobility. People from the Environmentally Oriented Multimodals show these characteristics, and thus, they can be identified as the group with the highest potential to accept and use sustainable mobility solutions due to their ecological norm orientation.
The results presented in this study are based on an analysis from survey data from Berlin (Germany) and San Francisco (U.S.). Further research should address the question of what mobility styles exist in other cities. It should also investigate the influence of the built environment, especially the public transport infrastructure, and the influence of culture on mobility styles. In addition, further research should place a stronger focus on life stages. Of interest is whether individuals switch between mobility styles within their life cycle, or whether there is stability due to the habits and socialization of the individuals. This aspect can only be answered by surveying individuals at different points in time and thus potentially in different lifecycle stages, i.e., by means of a panel survey. However, existing panels, as far as to the authors’ knowledge, do not have comprehensive information on attitudes and behavior, which would be necessary for the identification and description of mobility styles.
Author Contributions
Conceptualization, M.M. and S.v.B.; methodology, M.M., S.v.B. and L.B.; software, M.M., S.v.B. and L.B.; validation, M.M. and S.v.B.; formal analysis, M.M. and L.B.; investigation, M.M., S.v.B. and L.B.; resources, B.C.; writing—original draft preparation, S.v.B., L.B. and M.M.; writing—review and editing, S.v.B., L.B., M.M. and B.C. visualization, L.B.; supervision, B.C. All authors have read and agreed to the published version of the manuscript.
Funding
This study presents results based on the data of the project Urban Travel Monitor (UTM) funded by BMW AG. We acknowledge support by the KIT-Publication Fund of the Karlsruhe Institute of Technology.
Institutional Review Board Statement
Not applicable.
Informed Consent Statement
Not applicable.
Data Availability Statement
The data are not publicly available due to legal reasons.
Conflicts of Interest
The authors declare no conflict of interest.
References
- Love, B. Paris Plans to Banish All but Electric Cars by 2030. Energy & Environment. Reuters [Online]. 2017. Available online: https://www.reuters.com/article/us-france-paris-autos/paris-plans-ban-on-combustion-engine-cars-by-2030-idUSKBN1CH0SI (accessed on 28 January 2021).
- Haustein, S.; Nielsen, T.A.S. European Mobility Cultures: A Survey-Based Cluster Analysis across 28 European Countries. J. Transp. Geogr. 2016, 54, 173–180. [Google Scholar] [CrossRef] [Green Version]
- Kutter, E. Demographische Determinanten Städtischen Personenverkehrs; Inst. f. Stadtbauwesen; Techn. Univ. Braunschweig: Braunschweig, Germany, 1972. [Google Scholar]
- Kutter, E. Aktionsbereiche des Stadtbewohners: Untersuchungen zur Bedeutung der territorialen Komponente im Tagesablauf der städtischen Bevölkerung. Arch. Für Kommunalwiss 1973, 12, 69–85. [Google Scholar]
- Pas, E.I. Towards the Understanding of Urban Travel Behavior trough the Classification of Daily Urban/Activity Patterns; Northwestern University: Evanston, IL, USA, 1980. [Google Scholar]
- Schmiedel, R. Bestimmung Verhaltensähnlicher Personenkreise für die Verkehrsplanung; Inst. für Städtebau u. Landesplanung d. Univ. Karlsruhe (TH): Karlsruhe, Germany, 1983. [Google Scholar]
- Stegmüller, B. Internationale Marktsegmentierung als Grundlage für Internationale Marketing-Konzeptionen; Zugl.: Göttingen, Univ., Diss., 1994; Eul: Bergisch-Gladbach, Germany, 1995; ISBN 389012433X. [Google Scholar]
- Schlich, R. Verhaltenshomogene Gruppen in Längsschnitterhebungen; Diss. Nr. 15565 techn. Wiss.; ETH Zürich: Zürich, Switzerland, 2004. [Google Scholar]
- Allahviranloo, M.; Regue, R.; Recker, W. Pattern Clustering and Activity Inference. In Proceedings of the Transportation Research Board 93rd Annual Meeting, Washington, DC, USA, 12–16 January 2014. [Google Scholar]
- Berger, M. Typologiebildung und Erklärung des Aktivitäten-(Verkehrs-)Verhaltens–ein Multimethodenansatz unter Verwendung der Optimal Matching Technik; Bauhaus-Universität Weimar: Weimar, Germany, 2004. [Google Scholar]
- Ectors, W.; Kochan, B.; Knapen, L.; Janssens, D.; Bellemans, T. A Generic Data-Driven Sequential Clustering Algorithm Determining Activity Skeletons. Procedia Comput. Sci. 2016, 83, 34–41. [Google Scholar] [CrossRef] [Green Version]
- Wittwer, R. Zwangsmobilität und Verkehrsmittelorientierung Junger Erwachsener: Eine Typologisierung; Zugl.: Dresden, Techn. Univ., Fak. Verkehrswiss., Diss., 2014; Inst. für Verkehrsplanung und Straßenverkehr: Dresden, Germany, 2014. [Google Scholar]
- Von Behren, S.; Hilgert, T.; Kirchner, S.; Chlond, B.; Vortisch, P. Image-based activity pattern segmentation using longitudinal data of the German Mobility Panel. Transp. Res. Interdiscip. Perspect. 2020, 8, 100264. [Google Scholar] [CrossRef]
- Oostendorp, R.; Nieland, S.; Gebhardt, L. Developing a User Typology Considering Unimodal and Intermodal Mobility Behavior: A Cluster Analysis Approach Using Survey Data. Eur. Transp. Res. Rev. 2019, 11. [Google Scholar] [CrossRef] [Green Version]
- Janke, J.; Thigpen, C.G.; Handy, S. Examining the effect of life course events on modality type and the moderating influence of life stage. Transportation 2020. [Google Scholar] [CrossRef] [Green Version]
- Eisenmann, C.; Buehler, R. Are cars used differently in Germany than in California? Findings from annual car-use profiles. J. Transp. Geogr. 2018, 69, 171–180. [Google Scholar] [CrossRef]
- Niklas, U.; von Behren, S.; Eisenmann, C.; Chlond, B.; Vortisch, P. Premium Factor–Analyzing Usage of Premium Cars Compared to Conventional Cars. Res. Transp. Bus. Manag. 2019, 33, 100456. [Google Scholar] [CrossRef]
- Frick, R.; Grimm, B. Long-Distance Mobility-Current Trends and Future Perspectives. 2014. Available online: https://www.ifmo.de/files/publications_content/2014/ifmo_2014_Long_Distance_Mobility_en.pdf. (accessed on 28 January 2021).
- Magdolen, M.; von Behren, S.; Chlond, B.; Vortisch, P. Traveling Long-Distance with Bad Conscience? Discrepancies between Everyday and Long-Distance Travel of Urbanites [in press]. In Proceedings of the 99th Transportation Research Board Annual Meeting, Washington, DC, USA, 12–16 January 2020. [Google Scholar]
- Magdolen, M.; von Behren, S.; Chlond, B.; Hunecke, M.; Vortisch, P. Combining attitudes and travel behavior-A comparison of urban mobility types identified in Shanghai, Berlin and San Francisco. In Proceedings of the Transportation Research Board 98th Annual Meeting, Washington, DC, USA, 13–17 January 2019. [Google Scholar]
- Anable, J. ‘Complacent Car Addicts’ or ‘Aspiring Environmentalists’? Identifying travel behaviour segments using attitude theory. Transp. Policy 2005, 12, 65–78. [Google Scholar] [CrossRef] [Green Version]
- Hunecke, M.; Haustein, S.; Böhler, S.; Grischkat, S. Attitude-Based Target Groups to Reduce the Ecological Impact of Daily Mobility Behavior. Environ. Behav. 2010, 42, 3–43. [Google Scholar] [CrossRef] [Green Version]
- Ajzen, I. The Theory of Planned Behavior. Organ. Behav. Hum. Decis. Process. 1991, 50, 179–211. [Google Scholar] [CrossRef]
- Götz, K.; Deffner, J.; Klinger, T. Mobilitätsstile und Mobilitätskulturen–Erklärungspotentiale, Rezeption und Kritik. In Handbuch Verkehrspolitik; Schwedes, O., Canzler, W., Knie, A., Eds.; Springer Fachmedien Wiesbaden: Wiesbaden, Germany, 2016; pp. 781–804. ISBN 978-3-658-04692-7. [Google Scholar]
- Kitamura, R. Life-Style and Travel Demand. Transportation 2009, 36, 679–710. [Google Scholar] [CrossRef] [Green Version]
- Götz, K.; Ohnmacht, T. The Research on Mobility and Lifestyle–What Are The Results? In Mobilities: New Perspectives on Transport and Society; Grieco, M., Urry, J., Eds.; Routledge: London, UK, 2012; pp. 95–108. ISBN 9781315595733. [Google Scholar]
- Sharp, D.P. Projections of Automobile Ownership and Use Based on Household Life-Style Factors; SciTech Connect: Oak Ridge, TN, USA, 1979. [Google Scholar]
- Kuhnimhof, T.; Nobis, C.; Hillmann, K.; Follmer, R.; Eggs, J. Veränderungen im Mobilitätsverhalten zur Förderung einer Nachhaltigen Mobilität, Dessau-Roßlau. 2019. Available online: https://elib.dlr.de/133798/1/2019-08-29-texte_101-2019_mobilitaetsverhalten.pdf (accessed on 20 August 2020).
- Weber, M. Die Protestantische Ethik I: Eine Aufsatzsammlung; Gütersloher Verlagshaus: Gutersloh, Germany, 1994. [Google Scholar]
- Bourdieu, P.; Russer, A. Die feinen Unterschiede: Kritik der Gesellschaftlichen Urteilskraft; Suhrkamp: Frankfurt am Main, Germany, 2018; ISBN 9783518282588. [Google Scholar]
- Götz, K. Mobilitätsstile. In Handbuch Verkehrspolitik; Schöller, O., Canzler, W., Knie, A., Eds.; VS Verlag für Sozialwissenschaften: Wiesbaden, Germany, 2007; pp. 759–784. ISBN 978-3-531-14548-8. [Google Scholar]
- Götz, K.; Jahn, T.; Schultz, I. Mobilitätsstile. Ein Sozial-ökologischer Untersuchungsansatz; Arbeitsbericht; Subprojekt 1: Mobilitätsleitbilder und Verkehrsverhalten; Öko-Inst: Freiburg Breisgau, Germany, 1998; ISBN 3928433679. [Google Scholar]
- Redmond, L. Identifying and Analyzing Travel-Related Attitudinal, Personality, and Lifestyle Clusters in the San Francisco Bay Area; Dissertation; Institute of Transportation Studies: UC Davis, Davis, CA, USA, 2000. [Google Scholar]
- Haustein, S. Mobility Behavior of the Elderly: An Attitude-Based Segmentation Approach for a Heterogeneous Target Group. Transportation 2012, 39, 1079–1103. [Google Scholar] [CrossRef]
- Ohnmacht, T.; Götz, K.; Schad, H. Leisure Mobility Styles in Swiss Conurbations: Construction and Empirical Analysis. Transportation 2009, 36, 243–265. [Google Scholar] [CrossRef] [Green Version]
- Von Behren, S.; Minster, C.; Esch, J.; Hunecke, M.; Vortisch, P.; Chlond, B. Assessing car dependence: Development of a comprehensive survey approach based on the concept of a travel skeleton. Transp. Res. Procedia 2018, 32, 607–616. [Google Scholar] [CrossRef]
- Ramos, É.M.S.; Bergstad, C.J.; Chicco, A.; Diana, M. Mobility styles and car sharing use in Europe: Attitudes, behaviours, motives and sustainability. Eur. Transp. Res. Rev. 2020, 12. [Google Scholar] [CrossRef] [Green Version]
- Von Behren, S.; Bönisch, L.; Niklas, U.; Chlond, B. Revealing Motives for Car Use in Modern Cities—A Case Study from Berlin and San Francisco. Sustainability 2020, 12, 5254. [Google Scholar] [CrossRef]
- Steg, L.; Vlek, C.; Slotegraaf, G. Instrumental-Reasoned and Symbolic-Affective Motives for Using a Motor Car. Transp. Res. Part F Traffic Psychol. Behav. 2001, 4, 151–169. [Google Scholar] [CrossRef]
- Carrese, S.; Giacchetti, T.; Nigro, M.; Patella, S.M. An Innovative Car Sharing Electric Vehicle System: An Italian Experience. In Proceedings of the Urban Transport XXIII, URBAN TRANSPORT 2017, Rome, Italy, 5–7 September 2017; Brebbia, C.A., Ricci, S., Eds.; WIT Press: Southampton, UK, 2017; pp. 245–252. [Google Scholar]
- Prillwitz, J.; Barr, S. Moving towards Sustainability? Mobility Styles, Attitudes and Individual Travel Behaviour. J. Transp. Geogr. 2011, 19, 1590–1600. [Google Scholar] [CrossRef]
- Nakamya, J.; Moons, E.; Koelet, S.; Wets, G. Impact of Data Integration on Some Important Travel Behavior Indicators. Transp. Res. Rec. 2007, 1993, 89–94. [Google Scholar] [CrossRef]
- Von Behren, S.; Schubert, R.; Chlond, B. International comparison of psychological factors and their influence on travel behavior in hybrid cities. Res. Transp. Bus. Manag. 2020, 36, 100497. [Google Scholar] [CrossRef]
- Von Behren, S.; Kirn, M.; Heilig, M.; Bönisch, L.; Chlond, B.; Vortisch, P. The role of attitudes in on-demand mobility usage–An example from Shanghai. In Mapping The Travel Behavior Genome; Elsevier: Amsterdam, The Netherlands, 2020; pp. 103–124. ISBN 9780128173404. [Google Scholar]
- Magdolen, M.; Wörle, T.; Hilgert, T.; von Behren, S. Influences of Norm and Excitement on Bike Use Behavior of High-Income People in China. In Proceedings of the 99th Transportation Research Board Annual Meeting, Washington, DC, USA, 12–16 January 2020. [Google Scholar]
- Von Behren, S.; Minster, C.; Magdolen, M.; Chlond, B.; Hunecke, M.; Vortisch, P. Bringing Travel Behavior and Attitudes Together: An Integrated Survey Approach for Clustering Urban Mobility Types. In Proceedings of the Transportation Research Board 97th Annual Meeting Compendium of Papers, Washington, DC, USA, 7–11 January 2018. [Google Scholar]
- Hunecke, M.; Haustein, S.; Grischkat, S.; Böhler, S. Psychological, sociodemographic, and infrastructural factors as determinants of ecological impact caused by mobility behavior. J. Environ. Psychol. 2007, 27, 277–292. [Google Scholar] [CrossRef]
- Dittmar, H. The Social Psychology of Material Possessions: To Have Is to Be; Harvester Wheatsheaf: Hemel Hempstead, UK, 1992; ISBN 978-0745009568. [Google Scholar]
- Belgiawan, P.F.; Schmöcker, J.-D.; Abou-Zeid, M.; Walker, J.; Lee, T.-C.; Ettema, D.F.; Fujii, S. Car Ownership Motivations Among Undergraduate Students in China, Indonesia, Japan, Lebanon, Netherlands, Taiwan, and USA. Transportation 2014, 41, 1227–1244. [Google Scholar] [CrossRef] [Green Version]
- Bergstad, C.J.; Gamble, A.; Hagman, O.; Polk, M.; Gärling, T.; Olsson, L.E. Affective–Symbolic and Instrumental–Independence Psychological Motives Mediating Effects of Socio-Demographic Variables on Daily Car Use. J. Transp. Geogr. 2011, 19, 33–38. [Google Scholar] [CrossRef]
- Priester, R.; Kenworthy, J.; Wulfhorst, G. The Diversity of Megacities Worldwide: Challenges for the Future of Mobility. Chapter 2. In Megacity Mobility Culture-How Cities Move on in a Diverse World; Institute for Mobility Research, Ed.; Springer: Berlin/Heidelberg, Germany, 2013; pp. 23–54. ISBN 978-3-642-34734-4. [Google Scholar]
- Institute for Mobility Research. Urban Mobility in China, München. 2017. Available online: https://www.bmwgroup.com/content/dam/grpw/websites/bmwgroup_com/company/downloads/de/2017/2017-BMW-Group-IFMO-Publikation-Juni.pdf (accessed on 27 June 2020).
- San Francisco Municipal Transportation Agency. Travel Decisions Survey: Summary Report; San Francisco Municipal Transportation Agency: San Francisco, CA, USA, 2017.
- Senatsverwaltung für Umwelt, Verkehr und Klimaschutz. Mobilität der Stadt: Berliner Verkehr in Zahlen 2017; Senatsverwaltung für Umwelt, Verkehr und Klimaschutz: Berlin, Germany, 2017.
- Gerike, R.; Hubrich, S.; Ließke, F.; Wittig, S.; Wittwer, R. Mobilitätssteckbrief für Berlin “Mobilität in Städten (SrV) 2018”. Dresden. 2019. Available online: https://www.berlin.de/sen/uvk/verkehr/verkehrsdaten/zahlen-und-fakten/mobilitaet-in-staedten-srv-2018/ (accessed on 20 August 2020).
- Corey, Canapary & Galanis Research. Travel Deicions Survey 2017-Summary Report; Corey, Canapary & GalanisResearch: San Francisco, CA, USA, 2017. [Google Scholar]
- Mallig, N.; Vortisch, P. Measuring Stability of Mode Choice Behavior. Transp. Res. Rec. 2017, 2664, 1–10. [Google Scholar] [CrossRef]
- Hilgert, T.; von Behren, S.; Eisenmann, C.; Vortisch, P. Are Activity Patterns Stable or Variable? Analysis of Three-Year Panel Data. Transp. Res. Rec. 2018, 2672, 46–56. [Google Scholar] [CrossRef]
- Davison, L.; Littleford, C.; Ryley, T. Air travel attitudes and behaviours: The development of environment-based segments. J. Air Transp. Manag. 2014, 36, 13–22. [Google Scholar] [CrossRef] [Green Version]
- Haan, M.; Konijn, E.A.; Burgers, C.; Eden, A.; Brugman, B.C.; Verheggen, P.P. Identifying Sustainable Population Segments Using a Multi-Domain Questionnaire: A Five Factor Sustainability Scale. Soc. Mar. Q. 2018, 24, 264–280. [Google Scholar] [CrossRef] [PubMed]
- Frey, R.M.; Xu, R.; Ilic, A. Mobile app adoption in different life stages: An empirical analysis. Pervasive Mob. Comput. 2017, 40, 512–527. [Google Scholar] [CrossRef]
- Gilly, M.C.; Enis, B.M. Recycling the Family Life Cycle: A Proposal for Redefinition. Adv. Consum. Res. 1982, 9, 271–276. [Google Scholar]
- Beirão, G.; Cabral, J. Market Segmentation Analysis Using Attitudes Toward Transportation-Exploring the Differences Between Men and Women. Transp. Res. Rec. J. Transp. Res. Board 2008, 2067, 56–64. [Google Scholar] [CrossRef]
- Klinger, T.; Kenworthy, J.R.; Lanzendorf, M. Dimensions of Urban Mobility Cultures–A Comparison of German Cities. J. Transp. Geogr. 2013, 31, 18–29. [Google Scholar] [CrossRef] [Green Version]
- SAS Institute Inc. SAS/STAT®13.1 User’s Guide; SAS Institute Inc.: Cary, NC, USA, 2013. [Google Scholar]
- Eszergár-Kiss, D.; Caesar, B. Definition of user groups applying Ward’s method. Transp. Res. Procedia 2017, 22, 25–34. [Google Scholar] [CrossRef]
- Bieliński, T.; Dopierała, Ł.; Tarkowski, M.; Ważna, A. Lessons from Implementing a Metropolitan Electric Bike Sharing System. Energies 2020, 13, 6240. [Google Scholar] [CrossRef]
- Turoń, K.; Kubik, A.; Chen, F.; Wang, H.; Łazarz, B. A Holistic Approach to Electric Shared Mobility Systems Development—Modelling and Optimization Aspects. Energies 2020, 13, 5810. [Google Scholar] [CrossRef]
Figure 1.
Sample characteristics.


Table 1.
Principial Axis Factoring (PAF) based on 13 attitudinal indicators.
| Questions\Attitudinal Indicators | Symbolic-Affective Motive | Ecological Norm | Instrumental Motive |
|---|---|---|---|
| 0.790 | ||
| 0.775 | ||
| 0.727 | ||
| 0.702 | ||
| 0.670 | ||
| 0.636 | ||
| 0.725 | ||
| 0.707 | ||
| 0.704 | ||
| 0.661 | ||
| 0.752 | ||
| 0.690 | ||
| 0.617 |
Table 2.
Descriptive cluster characteristics.
| Cluster | All | 1 | 2 | 3 | 4 | 5 | 6 | 7 | 8 | ||
|---|---|---|---|---|---|---|---|---|---|---|---|
| Number of observations | 971 | 85 | 134 | 133 | 51 | 80 | 146 | 258 | 84 | p | |
| in % | 100% | 9% | 14% | 14% | 5% | 8% | 15% | 27% | 9% | ||
| Cluster-forming variables | Trips per day | 2.54 | 1.03 235678 | 2.64 13467 | 3.32 12456 | 1.17 23578 | 2.73 13467 | 1.47 123578 | 3.24 12456 | 3.03 146 | |
| Mode stability | 0.55 | 0.94 3678 | 0.94 3678 | 0.36 12457 | 0.92 3678 | 0.91 3678 | 0.35 12457 | 0.32 123456 | 0.34 1245 | ||
| Share of mandatory trips | 0.33 | 0.01 23578 | 0.55 134678 | 0.44 12456 | 0.00 23578 | 0.53 134678 | 0.01 23578 | 0.43 12456 | 0.37 12456 | ||
| Share of car use | 0.44 | 0.94 345678 | 0.93 345678 | 0.69 1245678 | 0.14 12368 | 0.09 12368 | 0.37 123457 | 0.12 12368 | 0.37 123457 | ||
| Long-distance trips p.a. | 2.04 | 0.75 23678 | 1.81 1458 | 1.52 18 | 0.96 2678 | 0.91 2678 | 1.76 1458 | 1.74 1458 | 7.63 1234567 | ||
| Symbolic-affective motive | 0.01 | −0.43 238 | 0.49 14567 | 0.64 145678 | −0.62 23678 | −0.26 238 | −0.10 234 | −0.22 2348 | 0.19 13457 | ||
| Ecological norm | 0.01 | −0.80 2345678 | −0.37 135678 | −0.03 127 | 0.01 17 | 0.02 127 | 0.07 127 | 0.41 123456 | 0.15 12 | ||
| Instrumental motive | 0.01 | 0.11 45 | −0.15 47 | −0.07 4 | −0.62 123678 | −0.30 1678 | 0.13 45 | 0.20 245 | 0.21 45 | ||
| Socio-demographic characteristics | |||||||||||
| Cluster-describing variables | Urbanity Index * | 2.26 | 2.23 5 | 2.29 5 | 2.25 5 | 2.24 5 | 2.50 1234678 | 2.26 5 | 2.17 5 | 2.28 5 | |
| Cars in household | 1.00 | 1.07 2347 | 1.57 145678 | 1.53 145678 | 0.41 123568 | 0.89 234 | 0.88 2347 | 0.62 12368 | 0.98 2347 | ||
| Transit pass owners | 40% | 6% | 5% | 20% | 53% | 80% | 40% | 63% | 45% | <0.0001 | |
| Km per day | 21.47 | 7.11 23 | 44.34 145678 | 37.48 14567 | 6.58 23 | 14.48 23 | 7.32 23 | 19.07 23 | 21.80 2 | ||
| Male | 51% | 46% | 54% | 55% | 49% | 43% | 49% | 53% | 55% | 0.578 | |
| From Berlin | 47% | 13% | 16% | 28% | 31% | 33% | 60% | 75% | 71% | <0.0001 | |
| Mean frequency of use of transport modes | |||||||||||
| Walk ** | 3.52 | 6.28 2345678 | 5.43 134678 | 3.54 125678 | 3.96 12678 | 4.76 13678 | 2.71 123457 | 1.96 123456 | 2.40 12345 | ||
| Bike ** | 5.14 | 6.87 35678 | 6.52 3678 | 5.44 1278 | 6.27 678 | 5.96 178 | 5.18 1278 | 3.54 123456 | 4.05 123456 | ||
| Car as driver ** | 4.21 | 5.01 2348 | 1.99 145678 | 2.37 145678 | 6.47 123678 | 5.73 2368 | 4.26 23457 | 5.28 23468 | 3.63 123457 | ||
| Car as passenger ** | 4.65 | 4.04 2457 | 4.88 13 | 3.36 245678 | 5.55 1368 | 5.34 136 | 4.32 3457 | 5.21 136 | 4.61 34 | ||
| Public transi t ** | 4.09 | 6.69 345678 | 6.48 345678 | 5.34 1245678 | 4.37 12357 | 2.14 123468 | 4.04 12357 | 2.06 123468 | 3.69 12357 | ||
| Carsharing ** | 5.22 | 5.00 | 5.57 | 5.29 | 5.33 | 6.00 | 5.07 | 5.15 | 5.18 | ||
| Ridesharing ** | 4.52 | 5.00 | 4.03 | 3.77 57 | 5.00 | 5.39 3 | 4.63 | 4.96 3 | 4.40 | ||
* 1 = super urban, 2 = urban, 3 = suburban; ** 1 = daily, 2 = several times a week, 3 = once a week, 4 = several times a month, 5 = once a month, 6 = less than once a month, 7 = never. Significance of differences have been tested by chi-square tests or Tukey post-hoc test where noted with superscript numerals (p < 0.05). For example, the notation 1.03 235678 (first cell) indicates that trips per day of Cluster 1 significantly differs from the other clusters. Individual percentages have been rounded up or down, so may not sum to 100.
Table 3.
Socio-economic cluster characteristics.
| Cluster | All | 1 | 2 | 3 | 4 | 5 | 6 | 7 | 8 | ||
|---|---|---|---|---|---|---|---|---|---|---|---|
| Number of observations | 971 | 85 | 134 | 133 | 51 | 80 | 146 | 258 | 84 | p | |
| in % | 100% | 9% | 14% | 14% | 5% | 8% | 15% | 27% | 9% | ||
| Life stage | 1—Young, independent | 7% | 0% | 1% | 2% | 2% | 11% | 4% | 16% | 5% | <0.0001 |
| 2—Young, employed | 13% | 0% | 10% | 14% | 8% | 9% | 8% | 22% | 23% | ||
| 3—Household with children | 27% | 13% | 37% | 39% | 6% | 34% | 21% | 29% | 18% | ||
| 4—Large HH * w/o children | 22% | 31% | 33% | 26% | 25% | 24% | 19% | 13% | 20% | ||
| 5—Middle-aged, employed | 14% | 2% | 18% | 14% | 0% | 18% | 5% | 16% | 30% | ||
| 6—Elderly, not employed | 17% | 54% | 1% | 5% | 59% | 5% | 43% | 4% | 4% | ||
| Education | High School Diploma or lower | 29% | 36% | 22% | 21% | 43% | 36% | 23% | 37% | 12% | <0.0001 |
| Bachelor’s Degree or lower | 47% | 49% | 50% | 51% | 43% | 43% | 58% | 38% | 49% | ||
| Master’s Degree or higher | 24% | 14% | 28% | 28% | 14% | 21% | 18% | 25% | 39% | ||
| Income | Low | 15% | 0% | 1% | 6% | 14% | 14% | 17% | 30% | 14% | <0.0001 |
| Medium | 63% | 79% | 57% | 56% | 67% | 73% | 68% | 56% | 66% | ||
| High | 23% | 21% | 43% | 38% | 20% | 14% | 15% | 14% | 20% |
* HH = Household. Significance of differences have been tested by chi-square tests. Individual percentages have been rounded up or down, so may not sum to 100.
Table 4.
Cluster (CL) names and brief descriptions.
| CL | Mobility Style | Frequency | Brief Description |
|---|---|---|---|
| 1 | Low Mobile Car Users | 9% | Low mobile well-off pensioners; car-only albeit little symbolic-affective motive for car use with low ecological norm |
| 2 | Car Addicts | 14% | Highly mobile well-off families; car-enthusiasts with low ecological norm and little multimodal behavior |
| 3 | Car-oriented Everyday Performers | 14% | Highly mobile (rather younger) well-off families; primarily use of car, but also multimodal behavior |
| 4 | Car-averted Low Mobiles | 5% | Low mobile elderly with low car ownership; if mobile, then by public transit or on foot |
| 5 | Public Transit Enthusiasts | 8% | Mobile younger people and families from the suburbs; public transit use and little multimodal behavior |
| 6 | Multimodal Travelers | 15% | Middle-aged and elderly people with multimodal behavior; low car use and everyday mobility, but active in long-distance travel |
| 7 | Environmentally Oriented Multimodals | 27% | Highly mobile young urban people with high ecological norm and multimodal use of eco-modes |
| 8 | Travel Addicts | 9% | Highly mobile well-off professionals with many long-distance trips; multimodal behavior and average car use |
Individual percentages have been rounded up or down, so may not sum to 100.
Table 5.
Descriptive characteristics of Cluster 7.
| Cluster 7 | With Car | W/o Car | |
|---|---|---|---|
| Number of observations | 129 | 129 | p |
| in % of total subsample | 13% | 13% | |
| Share of car use | 0.17 | 0.07 | <0.0001 |
| Symbolic-affective motive | −0.03 | −0.42 | <0.0001 |
| Ecological norm | 0.34 | 0.48 | 0.1722 |
| Instrumental motive | 0.19 | 0.22 | 0.8069 |
| Urbanity Index * | 2.23 | 2.11 | 0.0119 |
| Cars in household | 1.25 | 0.00 | |
| Walk frequency ** | 2.37 | 1.51 | <0.0001 |
| Bike frequency ** | 3.56 | 3.53 | |
| Car as driver frequency ** | 4.22 | 6.34 | <0.0001 |
| Car as passenger frequency ** | 4.81 | 5.63 | <0.0001 |
| Public transit frequency ** | 2.28 | 1.84 | 0.0117 |
* 1= super urban, 2 = urban, 3 = suburban; ** 1 = daily, 2 = several times a week, 3 = once a week, 4 = several times a month, 5 = once a month, 6 = less than once a month, 7 = never. Significance of differences have been tested by Welch analysis of variance (ANOVA).
Table 6.
Socio-economic characteristics of Cluster 7.
| Cluster 7 | With Car | W/o Car | ||
|---|---|---|---|---|
| Number of observations | 129 | 129 | p | |
| in % of total subsample | 13% | 13% | ||
| Life stage | 1—Young, independent | 6% | 26% | <0.0001 |
| 2—Young, employed | 15% | 29% | ||
| 3—Household with children | 35% | 23% | ||
| 4—Large HH * w/o children | 20% | 6% | ||
| 5—Middle-aged, employed | 20% | 11% | ||
| 6—Elderly, not employed | 4% | 5% | ||
| Education | High School Diploma or lower | 39% | 36% | 0.8119 |
| Bachelor’s Degree | 38% | 38% | ||
| Master’s Degree or higher | 23% | 26% | ||
| Income | Low | 13% | 47% | <0.0001 |
| Medium | 63% | 50% | ||
| High | 24% | 4% |
* HH = Household. Significance of differences have been tested by chi-square tests. Individual percentages have been rounded up or down, so may not sum to 100.
Publisher’s Note: MDPI stays neutral with regard to jurisdictional claims in published maps and institutional affiliations. |
© 2021 by the authors. Licensee MDPI, Basel, Switzerland. This article is an open access article distributed under the terms and conditions of the Creative Commons Attribution (CC BY) license (http://creativecommons.org/licenses/by/4.0/).
Share and Cite
MDPI and ACS Style
Magdolen, M.; von Behren, S.; Burger, L.; Chlond, B. Mobility Styles and Car Ownership—Potentials for a Sustainable Urban Transport. Sustainability 2021, 13, 2968. https://0-doi-org.brum.beds.ac.uk/10.3390/su13052968
AMA Style
Magdolen M, von Behren S, Burger L, Chlond B. Mobility Styles and Car Ownership—Potentials for a Sustainable Urban Transport. Sustainability. 2021; 13(5):2968. https://0-doi-org.brum.beds.ac.uk/10.3390/su13052968
Chicago/Turabian StyleMagdolen, Miriam, Sascha von Behren, Lukas Burger, and Bastian Chlond. 2021. "Mobility Styles and Car Ownership—Potentials for a Sustainable Urban Transport" Sustainability 13, no. 5: 2968. https://0-doi-org.brum.beds.ac.uk/10.3390/su13052968
Note that from the first issue of 2016, this journal uses article numbers instead of page numbers. See further details here.