
Bill Hillier’s Legacy: Space Syntax—A Synopsis of Basic Concepts, Measures, and Empirical Application


1
Department of Spatial Planning and Environment, Faculty of Spatial Sciences, University of Groningen, 9747 AD Groningen, The Netherlands
2
Department of Civil Engineering, Western Norway University of Applied Sciences, 5020 Bergen, Norway
3
Department of Urbanism, Faculty of Architecture, Delft University of Technology, 2628 CD Delft, The Netherlands
4
Department of Civil and Environmental Engineering and Architecture, University of Cagliari, 09123 Cagliari, Italy
*
Author to whom correspondence should be addressed.
Sustainability 2021, 13(6), 3394; https://0-doi-org.brum.beds.ac.uk/10.3390/su13063394
Submission received: 23 February 2021
/
Revised: 15 March 2021
/
Accepted: 16 March 2021
/
Published: 19 March 2021
(This article belongs to the Special Issue Space Syntax and the Sustainable City: Theory, Methods and Applications)
Abstract
:Bill Hillier’s space syntax method and theory enables us to describe the spatial properties of a sustainable city. Empirical testing of the space syntax method over time has confirmed the capacity and innovativeness of analyzing spatial relationships with the purpose of understanding and explaining the socio-spatial organization of built environments. However, the conceptual framework of space syntax elements is scattered around in various academic writings. This article, therefore, gives a holistic and compact overview of the various concepts that are used in space syntax, from its basic elements to various analytical techniques and theories. To achieve this compact overview, we reviewed all space syntax literature accessible since the 1970s for finding core references to various concepts used in space syntax. Following a short description of its foundation and evolution through the work of Bill Hillier, we explain its basic concepts and measures in the form of an extended glossary. Explanations are enriched with various space syntax analyses and scenario testing on various scales that were applied to the city of Rotterdam in the Netherlands. We conclude with a discussion about the advantages and limitations of space syntax and about how this method adds value to the creation of sustainable cities.
1. Introduction to Space Syntax
Bill Hillier (1937–2019) was the pioneer of space syntax. His contribution to understanding the built environment through an operational method to analyze spatial relationships between built objects allowed for a new refined knowledge about the relationship between space and society. In contrast to other techniques for the analysis of space, it combines tangible factors (movement and land use) with intangible factors (cognition and behavior). The first approach of the space syntax method originated from the 1970s. Over the years, Bill Hillier and his colleagues at the Bartlett School of Architecture, University College London, contributed to the improvement of the space syntax theory and method. At present, space syntax is applied worldwide in research and in practice. Space syntax provides precision with reference to spatial concepts and to various analytical techniques that facilitate the description of the spatial features of a sustainable city. The concepts and the analytical techniques already exist. The current challenge is to apply these tools to planning practice to improve sustainable built environments [1,2].
The space syntax method builds upon graph theory from discrete mathematics for the calculation of configurative spatial relationships between streets in the built environment [3,4]. In its wider context, space syntax is a set of techniques that can be applied individually and in various combinations with one another.
Bill Hillier and Julienne Hanson [5] understood early on that space syntax allows an understanding of the social organization of a settlement through a spatial setup. Whereas Hanson, in her later writings, mostly focused on the socio-spatial arrangements inside buildings [6], Hillier focused on the development of methods and theories related to space-society relationships between buildings [3,7,8,9,10]. Hillier summarized the importance of the spatial layout as follows: “How the urban system is put together spatially is the source of everything else.” [11] (p. 126). Therefore, the arrangement of buildings and following how the street network is set up play a role in social relationships and in people’s further socioeconomic activities. Consequently, in the space syntax method, the term ‘space’ appears as an active matrix of settlement processes in which the physical layout of the city is closely connected to its social and cultural relations. In this sense, as suggested by Cutini [12], the term syntax—as it is perceived as that set of “rules for the construction of a discourse”—therefore means attributing a specific structural essence to the space, whose constitutive rules can be investigated through the study of relationships between the individual elements that comprise it [12] (p. 17).
Space syntax’s international achievement is based on four aspects: first, a concise definition of space and the spatial elements that are used in the analysis are given [4]. Secondly, space syntax consists of a set of analytical techniques for the calculation of spatial inter-relationships in the built environment. By applying mathematics to spatial relationships of the built environment, new phenomena were discovered that called for the refinement of concepts and new terminologies. Thirdly, space syntax offers a set of techniques to correlate the results from spatial analyses with various socioeconomic data. And fourthly, through systematic research, space syntax consists of a set of theories about the relationships between space, spatial relationships, and society [8].
Regarding precision with reference to spatial elements, Hillier distinguished extrinsic and intrinsic properties of space. Intrinsic properties of space are related to shape, form, texture, materiality, and patterns of spaces. These properties are easy to describe with words such as ‘an open square’ or ‘a narrow street’ because they are easy to observe. Conversely, extrinsic properties of space concern invisible spatial relationships. Size and form of objects do not matter. Space syntax works solely with extrinsic properties since it only takes into account how each space is related to all other spaces in terms of directional changes and angular deviation within a spatial system [13].
Applying the logic of extrinsic spatial properties, space syntax works with the basic elements of convex space, isovist fields, and the axial line (see the glossary in Section 2 for a more detailed explanation). An axial line is a sightline that indicates movement paths and forms in its minimal set, the axial map. The axial map represents Hillier’s invention, as he considered, through the axial map, the whole length of a street (axial line) as a node in a network that is linked to the other streets that cross it. This allowed Hillier to overcome the limitations of conventional transport models where a street system is described as a network of nodes at street intersections that are linked by segments of streets between these intersections [14]. Hillier used pedestrian and vehicular data to prove that his approach made sense. Space syntax works with the idea of centrality, measuring to-movement (or closeness), and through-movement (or betweenness) potentials of every public street segment in relation to all other street segments [9]. Since 2012, major developments and improvements in space syntax analytical techniques have led to the refinement of the spatial calculations of the street network configuration for cities and regions [9].
Through the systematic application of space syntax in research worldwide, influential theories for the built environment have been developed and some socio-spatial and socioeconomic phenomena could be generalized. The most well-known theory is the ‘theory of natural movement’ [15,16]. The developed theories in space syntax research contributed to the realization that this method is a useful tool for comparing ‘before’ and ‘after’ conditions of spatial changes that result from restructuring. The methodological capability of an urban diagnosis and prognosis accommodates an indication of future socioeconomic impacts of urban design proposals. The predictive capacity of space syntax analysis renders it an attractive methodology for urban planning and design. It contributes to an evaluation of spatial effects on locations of economic activity and the degree of vitality of urban centers [17,18,19,20,21,22,23]. It further allows an insight into complex spatial realities as part of a city’s self-organizing process [24]. Yet, aside from its predictive capability, it can be applied to indicate how an urban system functions in retrospect, for ‘postdicting’ certain social aspects of past urban configurations [25,26,27,28,29,30].
The robust methodological foundation of space syntax is the existence of a correlation between pedestrian movement, vehicular movement, and the configuration of the spatial layout [15,16]. Space syntax is applied at many scales, from the arrangement of interior spaces [3,6,31,32,33] to large metropolitan areas [34,35,36,37,38]. Space syntax research ranges from anthropology and cognitive and social sciences to applied mathematics and informatics and has even touched upon philosophical issues. Examples on disciplines where space syntax has been applied are: anthropology, archaeology, architecture, urban planning and design, geography, psychology (wayfinding and perception of safety), sociology, criminology, real estate development, road engineering, and philosophy.
Hillier’s Engagement in Research, Education, and Practice
Bill Hillier was not only pioneering the space syntax method, he also actively contributed to its further development, to the education of students and to practice. As the successor of John Musgrove at The Bartlett, he established the new Advanced Architectural Studies (AAS) Master’s program in 1973, now the Space Syntax: Architecture & Cities MSc program. Hillier was an advocate of research-led education and he was in favor of letting his students experience first-hand that space is something active, as demonstrated by his popular walking lectures in the city of London. Over the years, these walking lectures were also offered to the wider public as part of events such as the Architecture Festival London. Hillier was able to clearly illustrate his ideas to make them accessible to anyone who was interested.
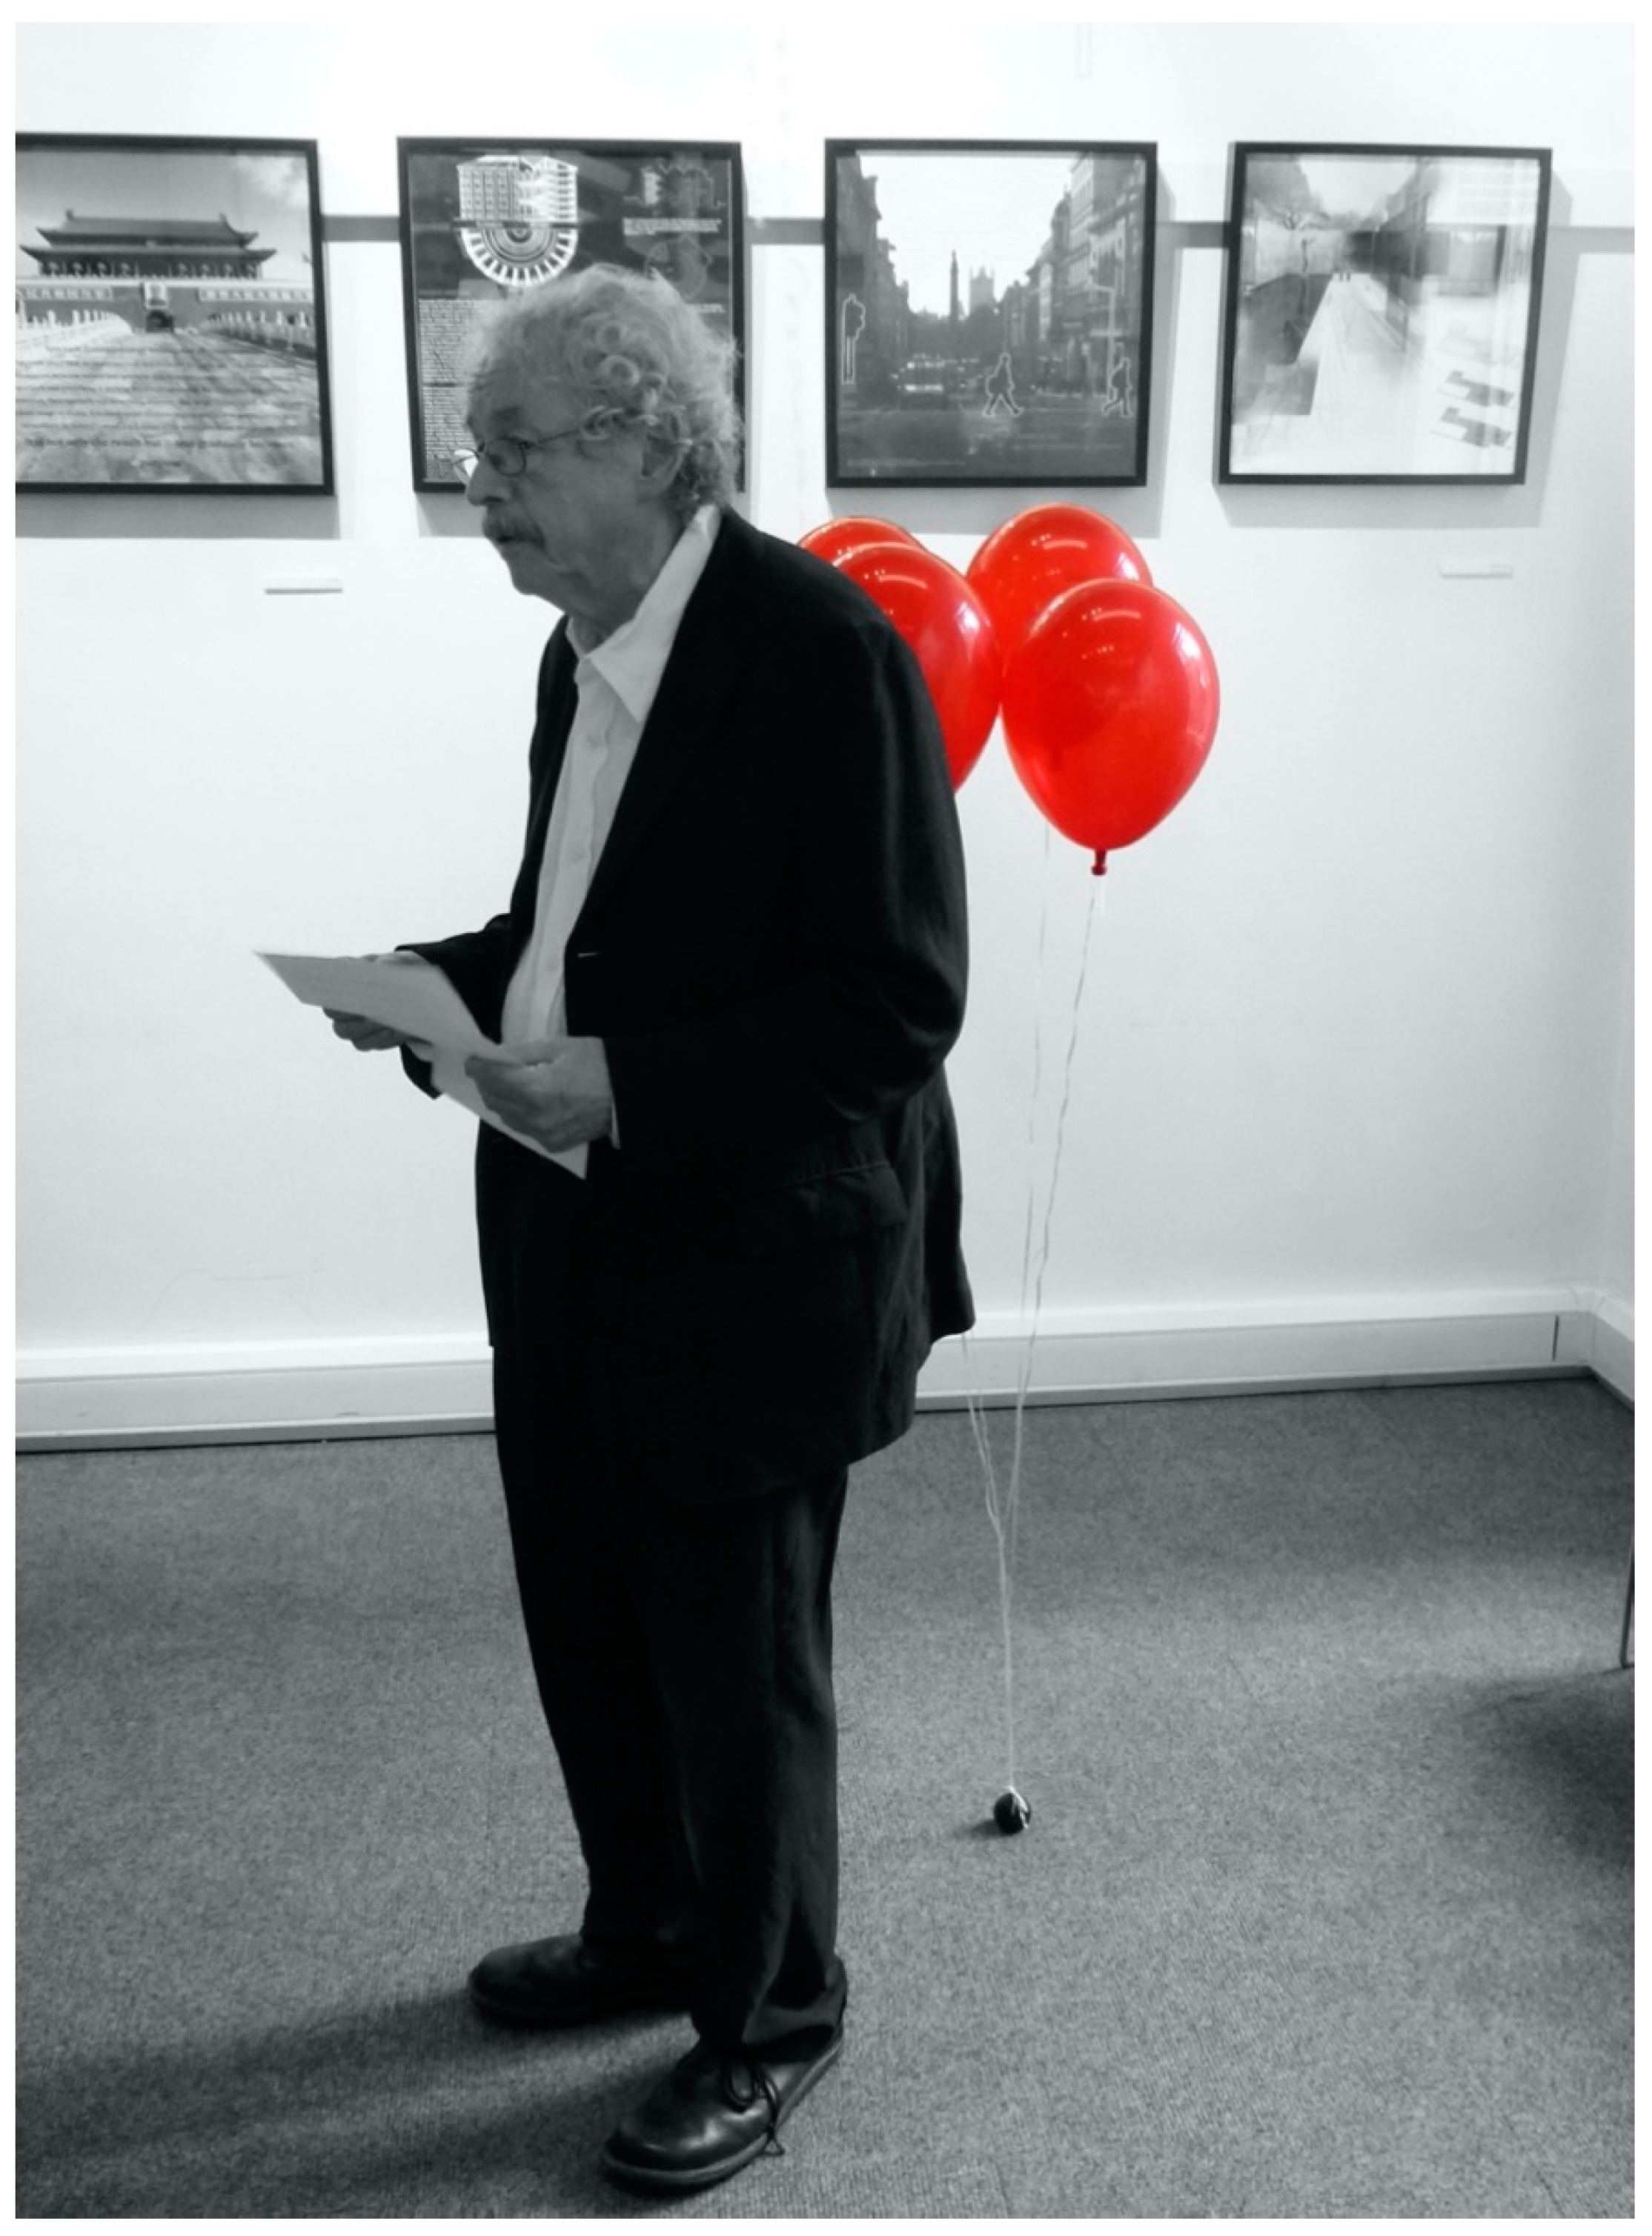
When, around the turn of the millennium, he was working on the concept of centrality, Hillier introduced the example of the balloons at eye height that were attached to a string with a weight. He used this example to demonstrate how these balloons were located in the most central location in a room to illustrate how an object can block visibility. He borrowed this idea from his then three-year-old grandson, who was playing with balloons at a family gathering, positioning them in such a way that family members could not see each other. Every time an adult brushed the balloons away, Bill’s grandson would put them back in place as part of his game. At AAS’s 40th anniversary event, the balloons were a central element of the celebration decorations (Figure 1).
In 1989, after 15 years of research and teaching, Bill Hillier, together with his colleagues, founded Space Syntax Limited London (https://spacesyntax.com, accessed on 24 January 2021). Since then, his theories and methods have been applied in practice worldwide. One of the most successfully realized urban renewal projects is Trafalgar Square in London. In addition, international space syntax symposia have been held since 1997, in alternate years, with increasing global interest. The original reason for organizing the first symposium was to keep in contact with international and British AAS alumni. The increasing integration and application of space syntax in research, education, and practice shows that space syntax has become a well-recognized method of urban analysis and contributes to an understanding of the relationship between socioeconomic effects and the analytical design of the built environment.
In this article, we present the various concepts and terms that are used in space syntax, given that most of them are scattered among various academic and professional writings. These concepts are very useful for the development of precise operational analytical techniques, which have contributed to precise descriptions of the built environment’s spatial properties. The space syntax concepts that are used for further clarification and illustration have been applied to the city of Rotterdam in the Netherlands. Some readers may already be familiar with the case study of Rotterdam since it was used as a test case by some authors in various space syntax workshops over the years.
Consequently, this article is structured as follows. In Section 2, we present basic concepts through the logic of a glossary. These concepts have been used in various space syntax analyses that have been developed throughout the years. The explanations are supplemented by an application of these concepts to the city of Rotterdam. Furthermore, prominent techniques for gathering useful primary data for verification, triangulation, or correlation of space syntax results will be presented. Subsequently, in Section 3, we present theories and accompanying understandings of space and society that developed through space syntax research. In Section 4, we demonstrate how space syntax can be applied as a tool in urban analytical design for scenario development and option testing. In Section 5, we discuss the advantages and limitations of space syntax. The paper concludes by explaining the added value of, and therefore recommending, space syntax analysis for the creation of sustainable cities.
2. Method and Data: Basic Concepts in Space Syntax Analysis and Primary Data Collection
In this section, an overview and an explanation of main space syntax concepts are presented in the form of a glossary. The organization of this glossary is not alphabetical but follows the logic of how the space syntax method developed. We reviewed all space syntax literature accessible since the 1970s for finding core references to various concepts used in space syntax. We first explain the classic space syntax concepts and measures as applied solely until 2005. Software development, increasing computational power, and further developed mathematical applications led to new discoveries and the understanding of additional phenomena that yielded new concepts and terms.
Research on metropolitan cities and regions in particular have undergone the biggest improvements since the millennium. This glossary extends and updates the work of Klaqvist [39] and Vaughan [40], in line with the seminal open access textbook on space syntax from van Nes and Yamu [4] (free download: https://0-www-springer-com.brum.beds.ac.uk/gp/book/9783030591397, accessed on 24 February 2021). Furthermore, we provide an overview of the most useful primary data for verification, triangulation and correlation of space syntax results.
2.1. Concepts and Measures from ‘Classic’ Space Syntax Analysis
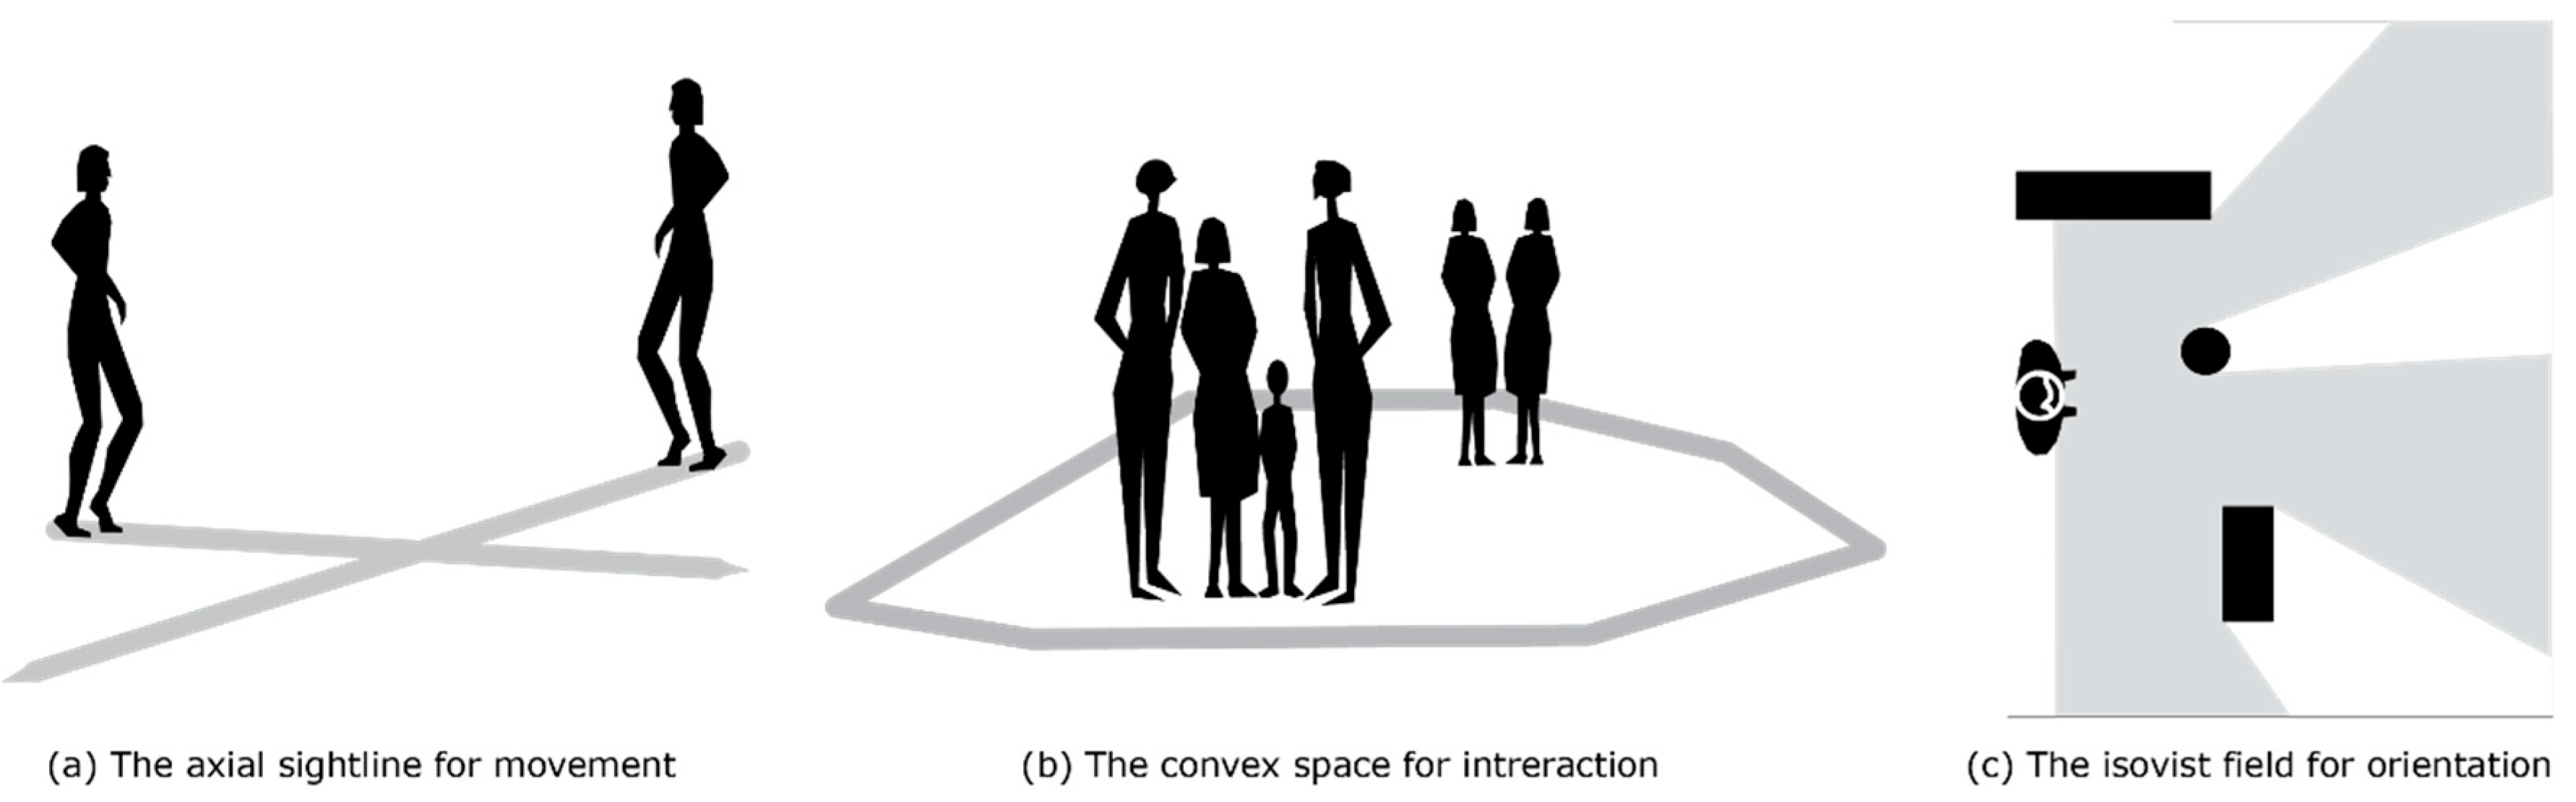
- Convex space: A convex space is defined as a space that covers “all points (locations) within that space can be joined to all others without going outside the boundary of that space.” [5] (p. 68). In other words, two people can see each other when they are located in any spot within a particular convex space. Intervisibility is essential for identifying a convex space. Convex space is mostly occupied by place-bound functions and human activities such as standing and sitting.
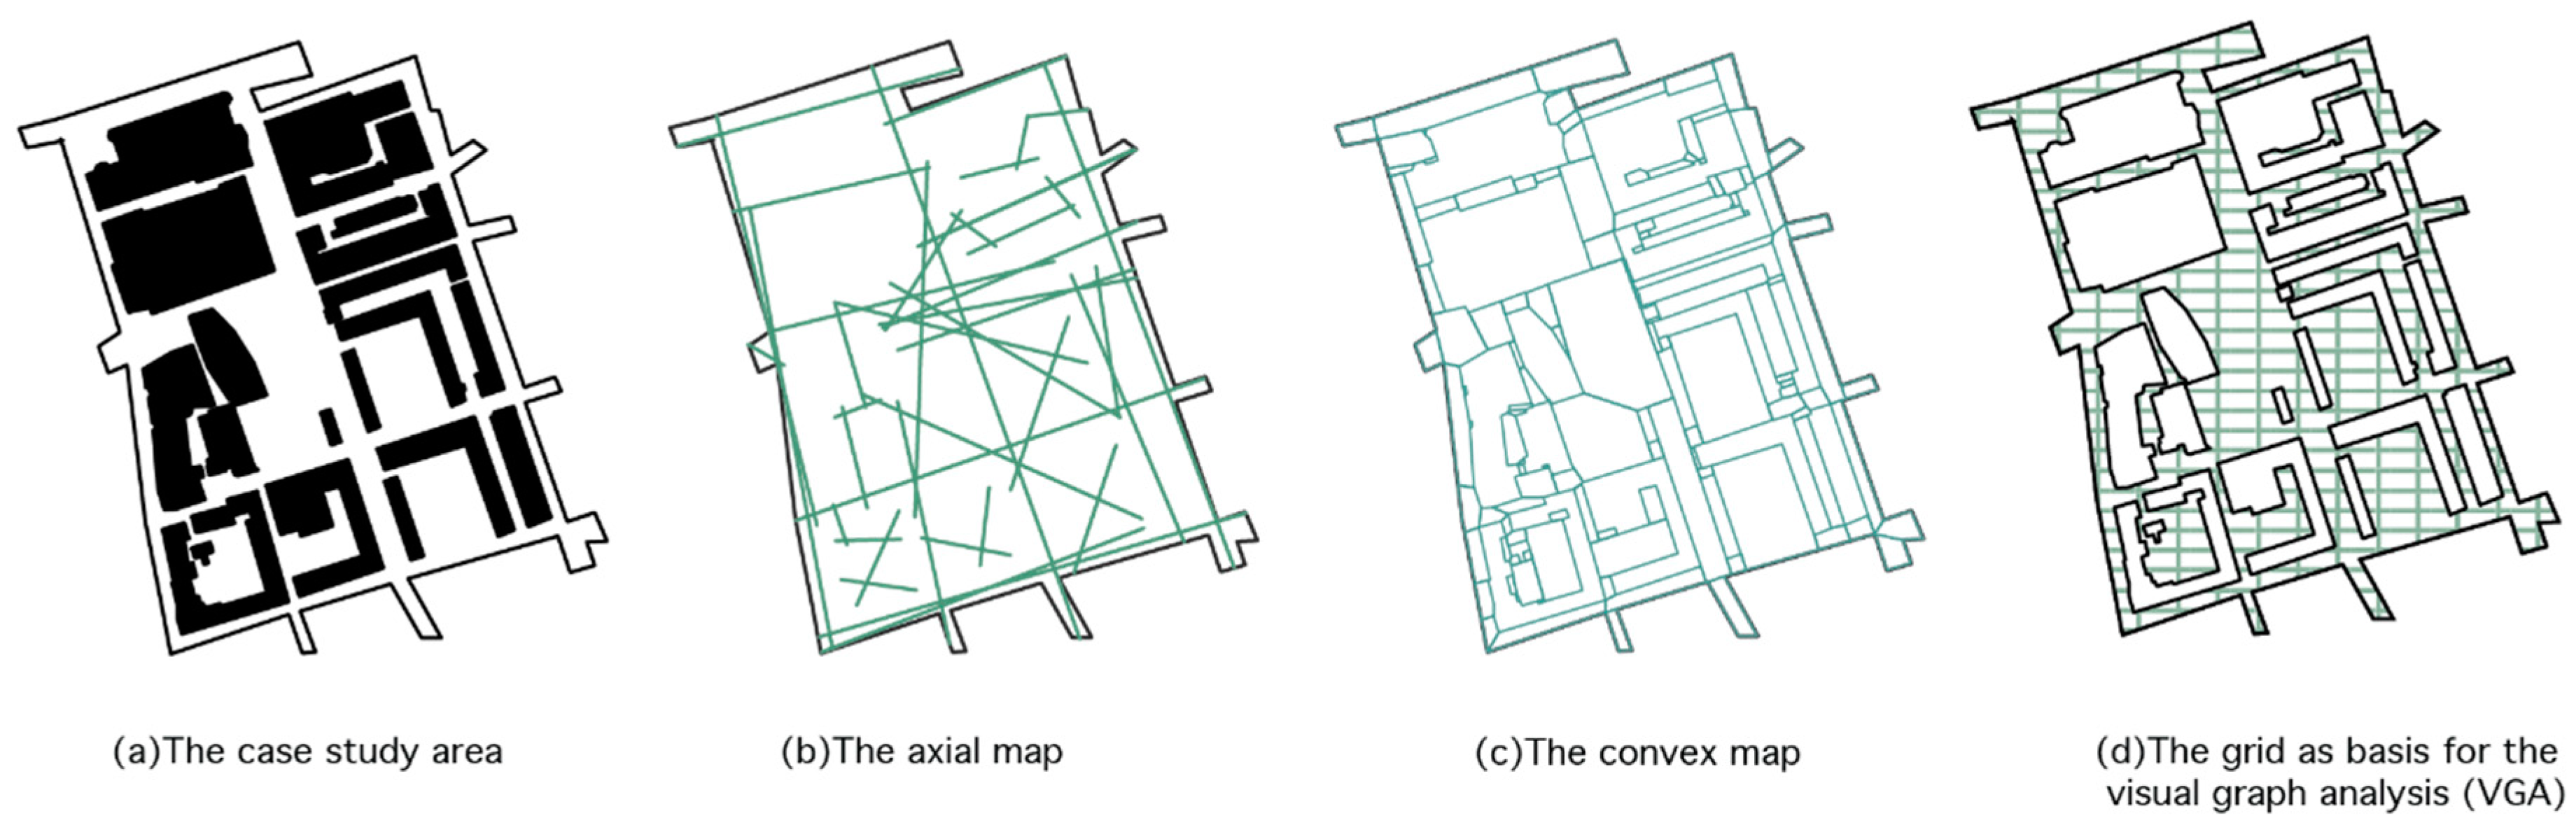
- Convex map: For spatial analysis, convex maps are used to analyze spaces inside buildings and the public spaces between groups of buildings in a neighborhood or a small village. The analytical scale ranges from architectural space to a neighborhood’s public realm. The convex map is replaced by the axial map in urban studies; simply because an axial map can be generated and drawn much faster than a convex map. Moreover, the analytical results of a convex analysis comply with those from an axial analysis [5] (p. 68). Regarding buildings and small urban neighborhoods, a grid-based map to compute visual graph analysis (VGA; see Section 2.2) replaced the convex map.
- Axial line: An axial line is the longest sightline that indicates a movement path in a certain space within the built environment. In urban studies, each axial line represents a public urban space that connects to other public urban spaces [5] (p. 97).
- Axial map: An axial map of a built environment is the set of the longest and the fewest axial lines [5] (pp. 17, 91, 97), [41]. An axial map can be of different resolutions: low, medium or high. A low-resolution model, or strategic model, includes only the major relationships between aspects of the built environment. A medium-resolution model is an extension to which more pragmatic relations of built-up and non-built-up features are added. A high-resolution model, or pedestrian model, involves the study of the precise paths of pedestrian movement. The major difference between the high-resolution model and the other two models is that the pavement will be the focal point for drawing an axial map. Furthermore, hybrid models exist, which combine different resolutions for different areas in a city.
- Isovist field: An isovist field is a visualization of the panoptic view of a viewer from a particular point in the built environment [42]. It is a field of vision [43]. An isovist field can be explained as a visual record of what can be seen in a 360-degree or a 180-degree view from a given point [17].
Figure 2 shows the three basic elementary spatial units that are used in space syntax. Figure 3 shows three different types of basic maps that are used in computational space syntax analyses. Convex maps (Figure 3c) are drawn by hand and this can be time-consuming and is not free from individual judgement. Generating an axial map manually also requires training and experience to model the least and the longest axial lines possible in a neighborhood or a city (Figure 3b). Therefore, the raster-based map (Figure 3d) that is applied to all public spaces turns out to be the least time-consuming to apply compared to a convex map or an axial map [44].
- Urban grid: This is the pattern of public spaces that links the buildings of a settlement, regardless of its degree of geometric regularity [45] (p. 02.1).
- Justified graph (j-graph): A justified graph illustrates the spatial relationships or connections between various spaces as a directional graph. Each space is represented by a node (=vertex or point; in space syntax this is the street itself), while a connection between two nodes is represented by an edge (=line) [46]. In order to generate a justified graph, only the spatial configurational relationship is taken into consideration. A j-graph does not display geometric properties. An axial map is the geometric model of an urban street network that can translate into a j-graph.
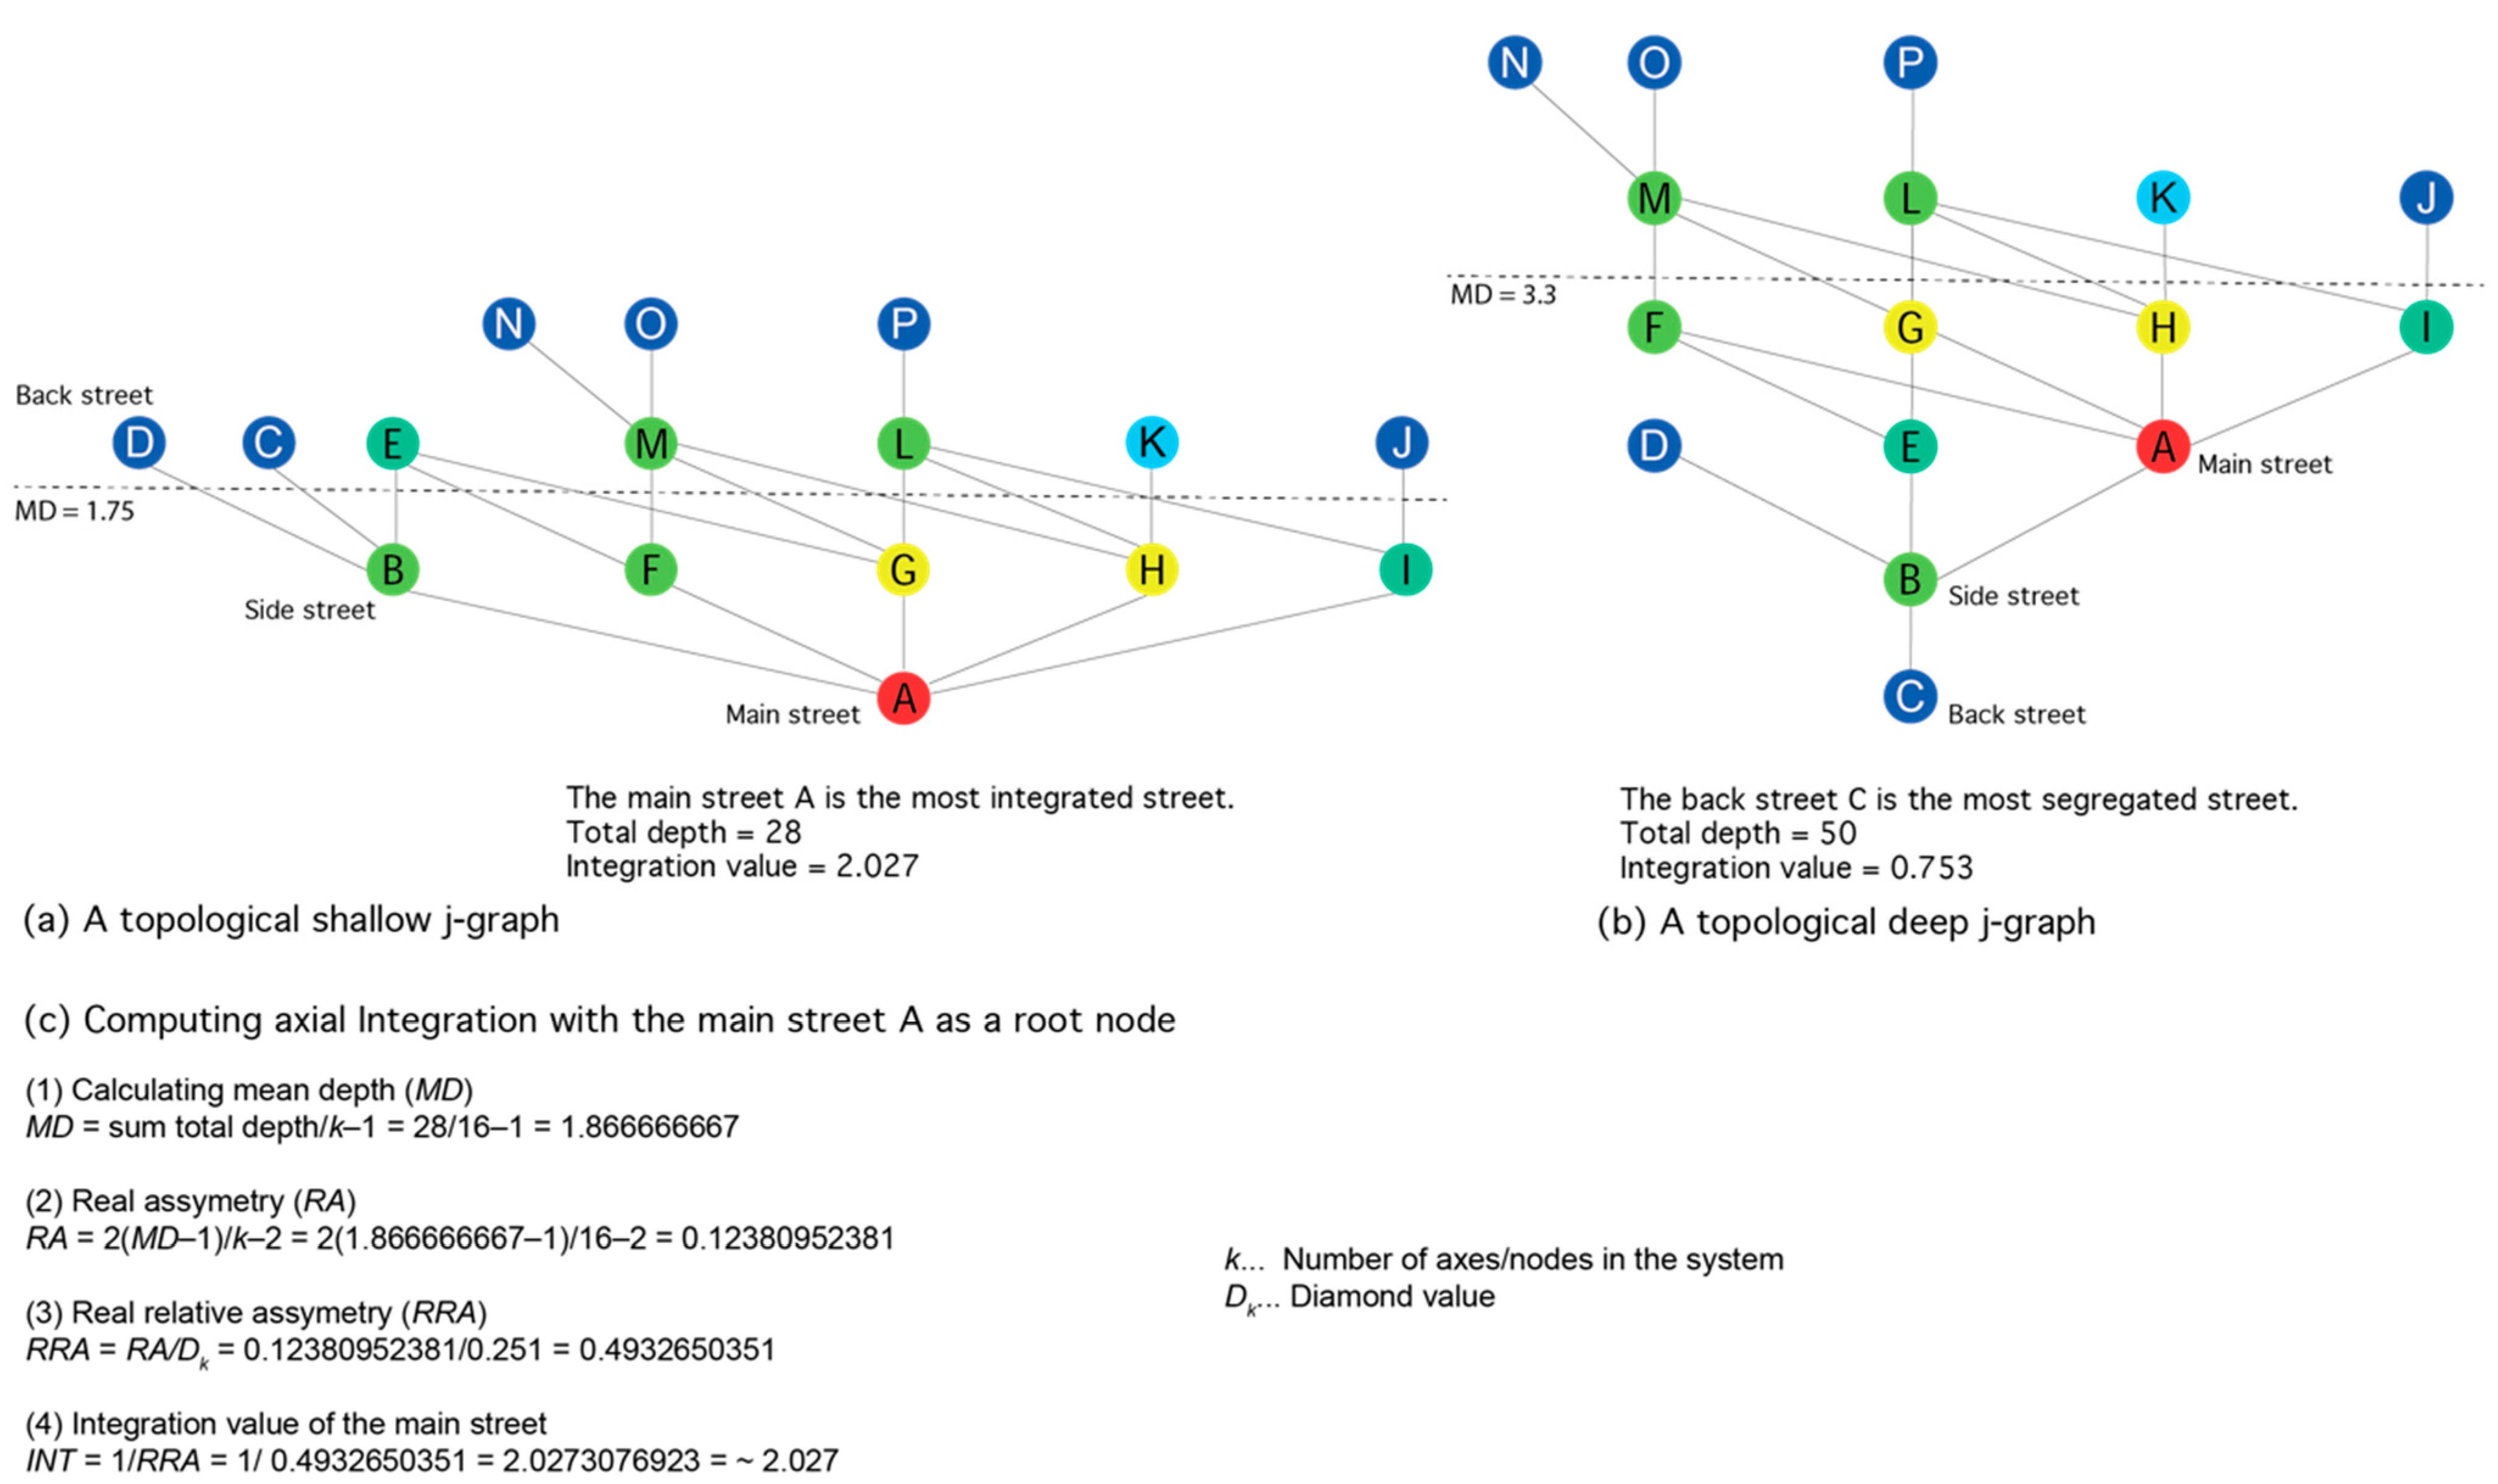
- Depth: The depth of a node in a j-graph is the number of edges in the path from the root node to the chosen node. For instance, the depth of the root is 0 and the depth of any one of its adjacent nodes is 1 [46]. A path that has a high number of nodes from the root node to the final node is topologically deep and, vice versa, a path that has a low number of nodes is topologically shallow.
- Total depth (TD): This is defined by the number of spaces to pass through from a chosen or a given starting point in the system. The total depth of a system is the sum of all possible steps from a given starting point. The depth value, when combined with the actual shape of the system itself, provides important information for the interpretation and analysis of an urban space. The terms ‘shallow’ and ‘deep’ are most commonly used with regard to the depth of a system. A shallow system has a low total depth value, whereas a deep system has a high total depth value. The j-graph of a shallow system is bush-like and for a deep system it is tree-like [5] (p. 94).
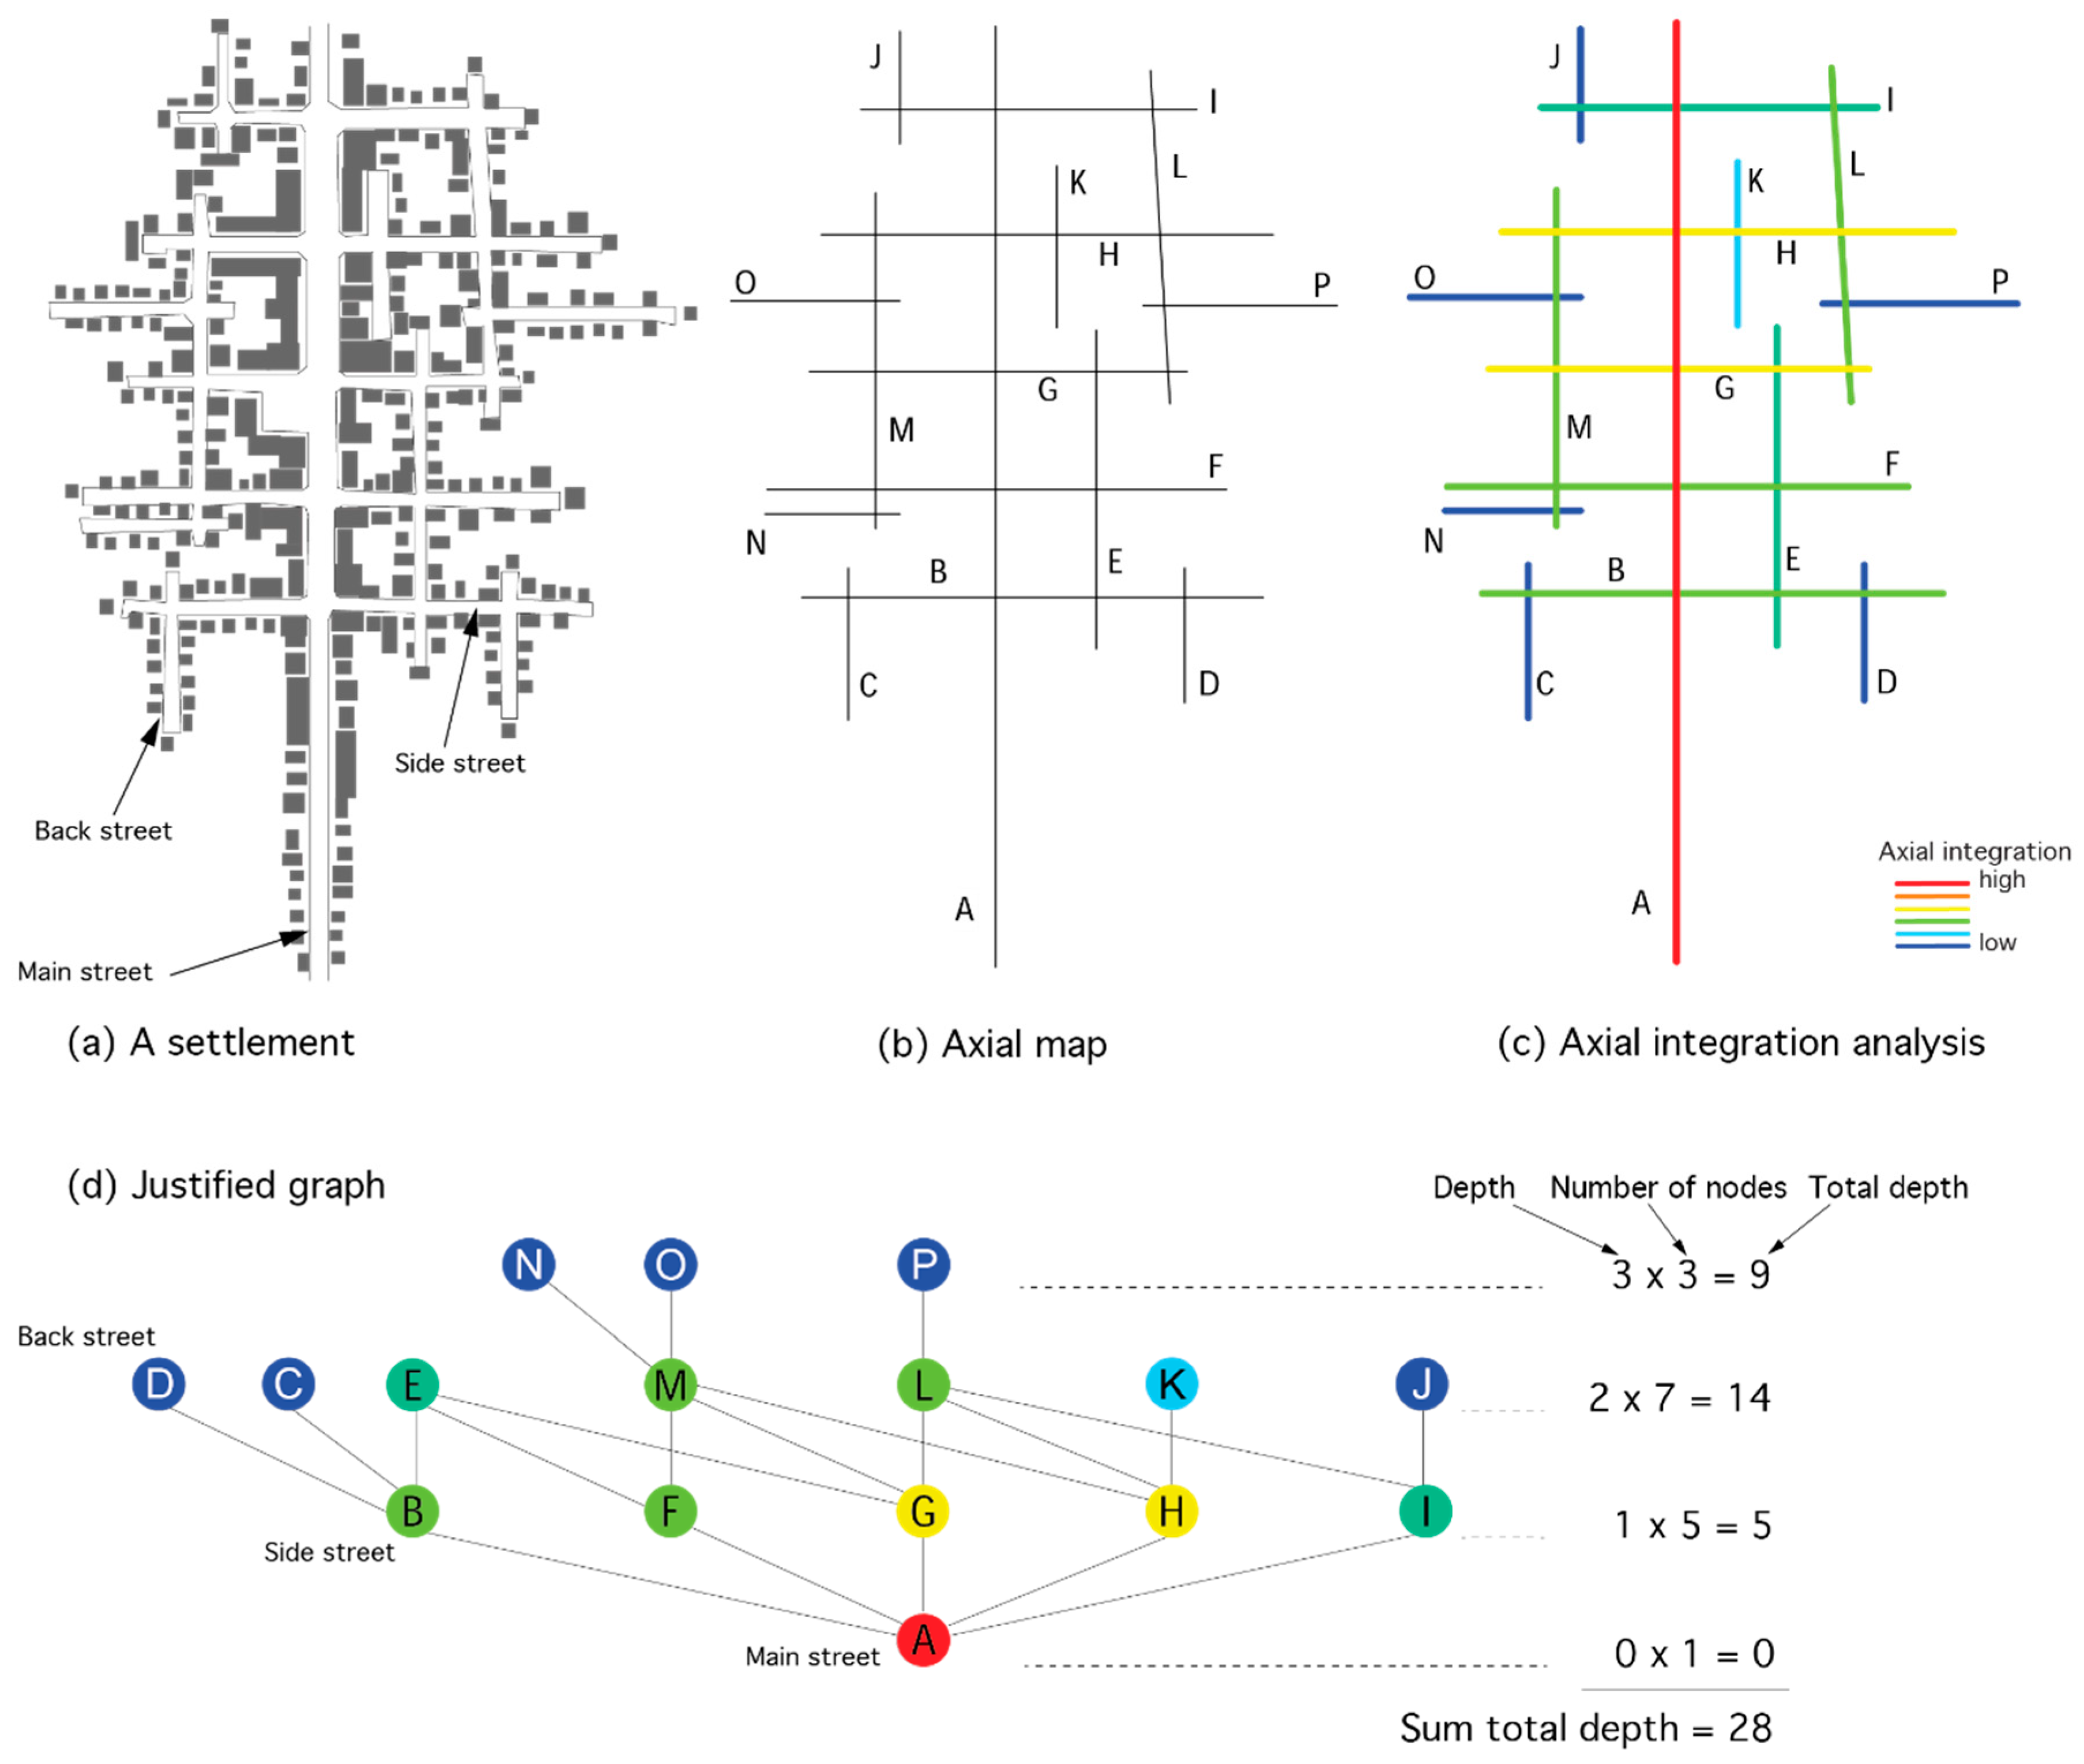
Figure 4 depicts how public spaces are abstracted as axial lines and make up an axial map 4 (b) of a settlement 4 (a). The spatial analysis 4 (c) presents the visualization of a global integration analysis of the axial map of the settlement. Below in Figure 4d, a j-graph (justified graph) is shown, using the main street as the root node A.
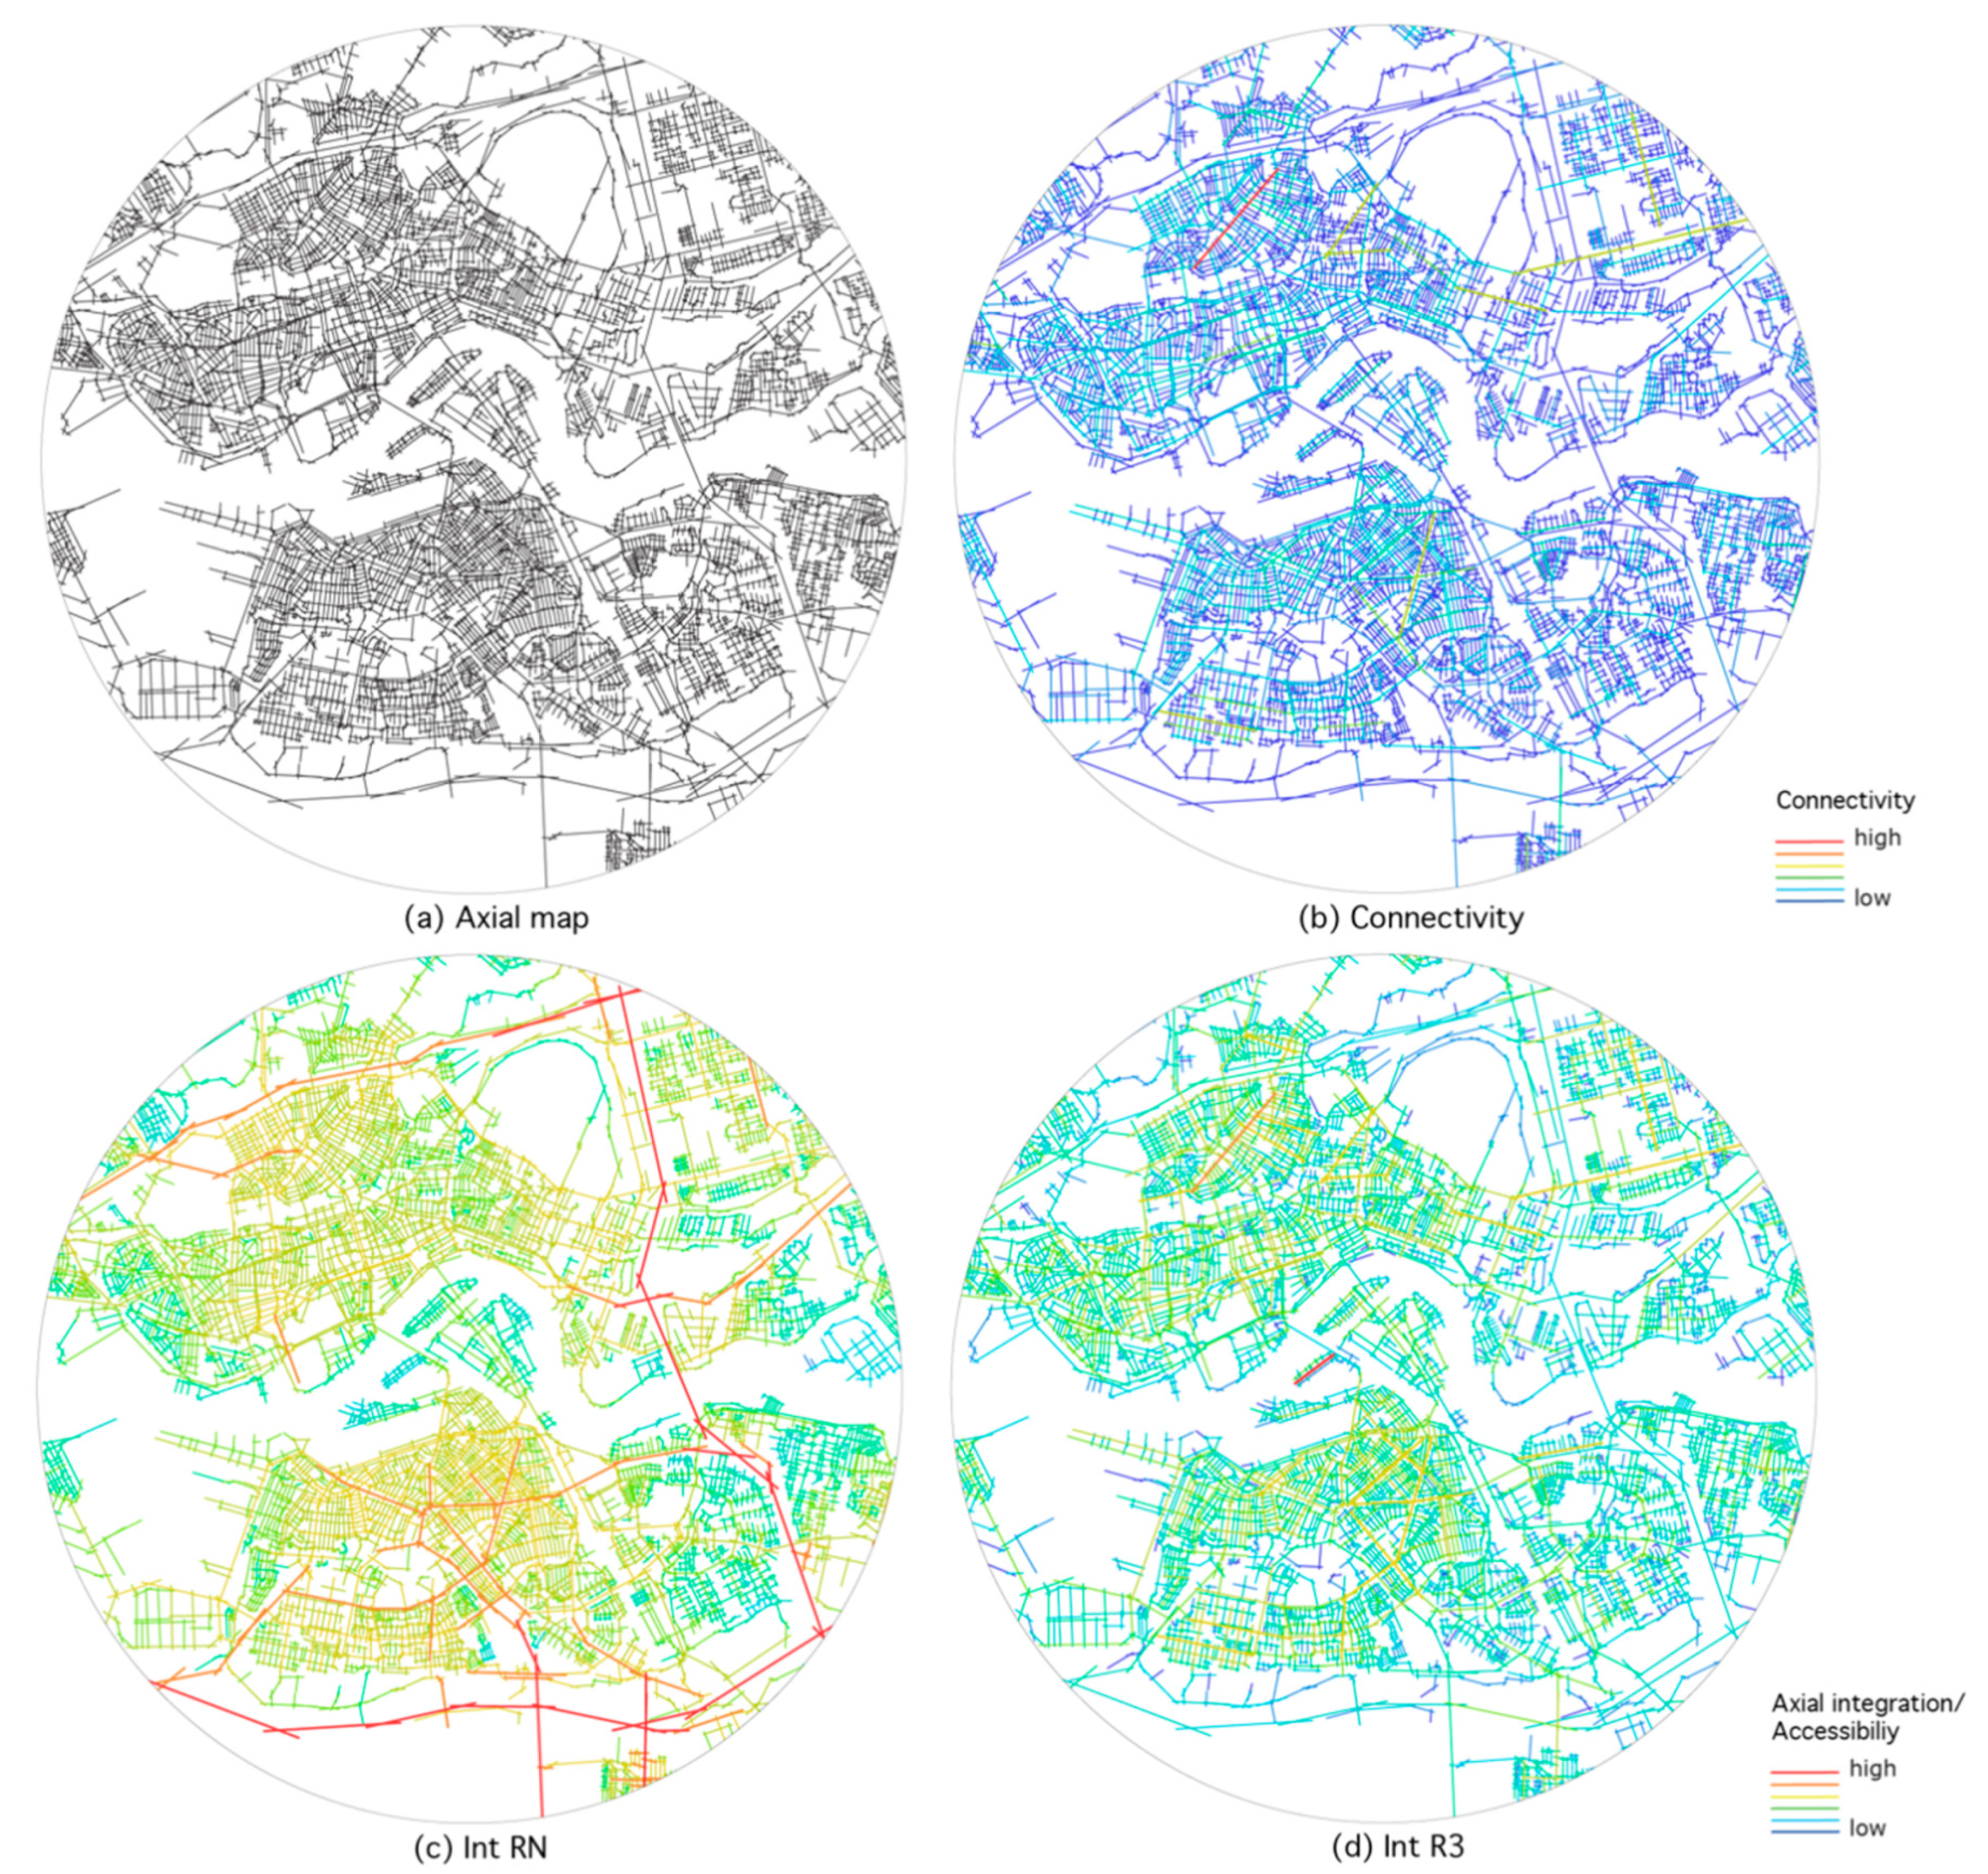
- Connectivity: Connectivity is a static local measure and explains the number of connections that each street has to its direct neighboring streets. In mathematics, connectivity is one of the basic concepts of graph theory. A street with many connections to its side streets has a high connectivity value, whereas a street with few connections has a low connectivity value [5] (p. 103), [39].
- Axial integration (Int): This measure considers to-movement and estimates the degree of accessibility that a street has to all other streets in the urban system, taking into consideration the total number of direction changes (syntactic steps) of an urban entity [5] (p. 104). Axial integration is strongly related to connectivity. The fewer the direction changes of a certain street to all other streets in the system, the higher its integration, hence its inter-accessibility. In short, the longer the axial line in an urban area, the higher its connectivity to other lines and the higher its integration value and vice versa.
- Global and local radii: Classic space syntax analyses generally use a topological radius, which refers to the number of direction changes. For the ‘global’ integration analysis (as coined in space syntax jargon), a radius of n is applied, whereas in the local integration analysis, radii of 3 or 5 are generally applied [7]. Global axial integration analysis, also referred to as citywide integration analysis, calculates how every axial line is connected to all others in a built environment in terms of the total number of direction changes to all other axial lines [3] (p. 135). In contrast, local axial integration analysis calculates how every axial line is connected to its neighboring streets in a built environment in terms of the given number of direction changes. It is important to note that the local radius was originally calculated by taking the root node into consideration. That means, for example, that a radius of 3 was calculated with two direction changes from the root node (=two syntactic steps + the root node). This changed after 2005, when the root node was no longer included. Consequently, a radius of 3 currently equals three direction changes (=three syntactic steps). Local integration analysis contributes to reducing the edge effect that appears in a global integration analysis.
Figure 5 explains how to calculate axial integration for topologically shallow and deep systems using the example of the settlement from Figure 4. We demonstrate how axial integration is computed. The bush-like j-graph with the main street as the root node is topologically shallower compared to the drawn-out j-graph with the back street as the root node. The main street can reach all streets with a low total number of direction changes, whereas the back street can reach all streets with a high number of direction changes.
To illustrate the application of basic space syntax concepts we used the case study of Rotterdam. Rotterdam is a major port city in the province of South Holland and the second largest city in the Netherlands. It has a population of approximately 650,000 and is known for its multi-ethnic mix. The near-complete destruction of the historic city center in WWII led to Rotterdam’s current urban landscape with modern architecture and skyscrapers.
Figure 6 shows three different types of axial analyses of Rotterdam. The global integration analysis (Figure 6c) shows where the most spatially integrated streets are located. For Rotterdam, the most integrated streets and roads are located on the ring road’s eastern sections. The red and orange axial lines show the 5% score of the most highly integrated streets. The local integration with a radius of 3 (Figure 6d) depicts the most integrated streets locally. In this analysis, the various local shopping streets are indicated by yellow and orange lines. The connectivity map (Figure 6b) shows how many direct connections each axis has to its direct neighboring axes. The dark blue lines have one to two connections, whereas the yellow and red lines have up to 32 connections.
- A syntactic step: This refers to a single direction change in an urban system. For example, two syntactic steps mean two direction changes. Three syntactic steps mean three direction changes [46].
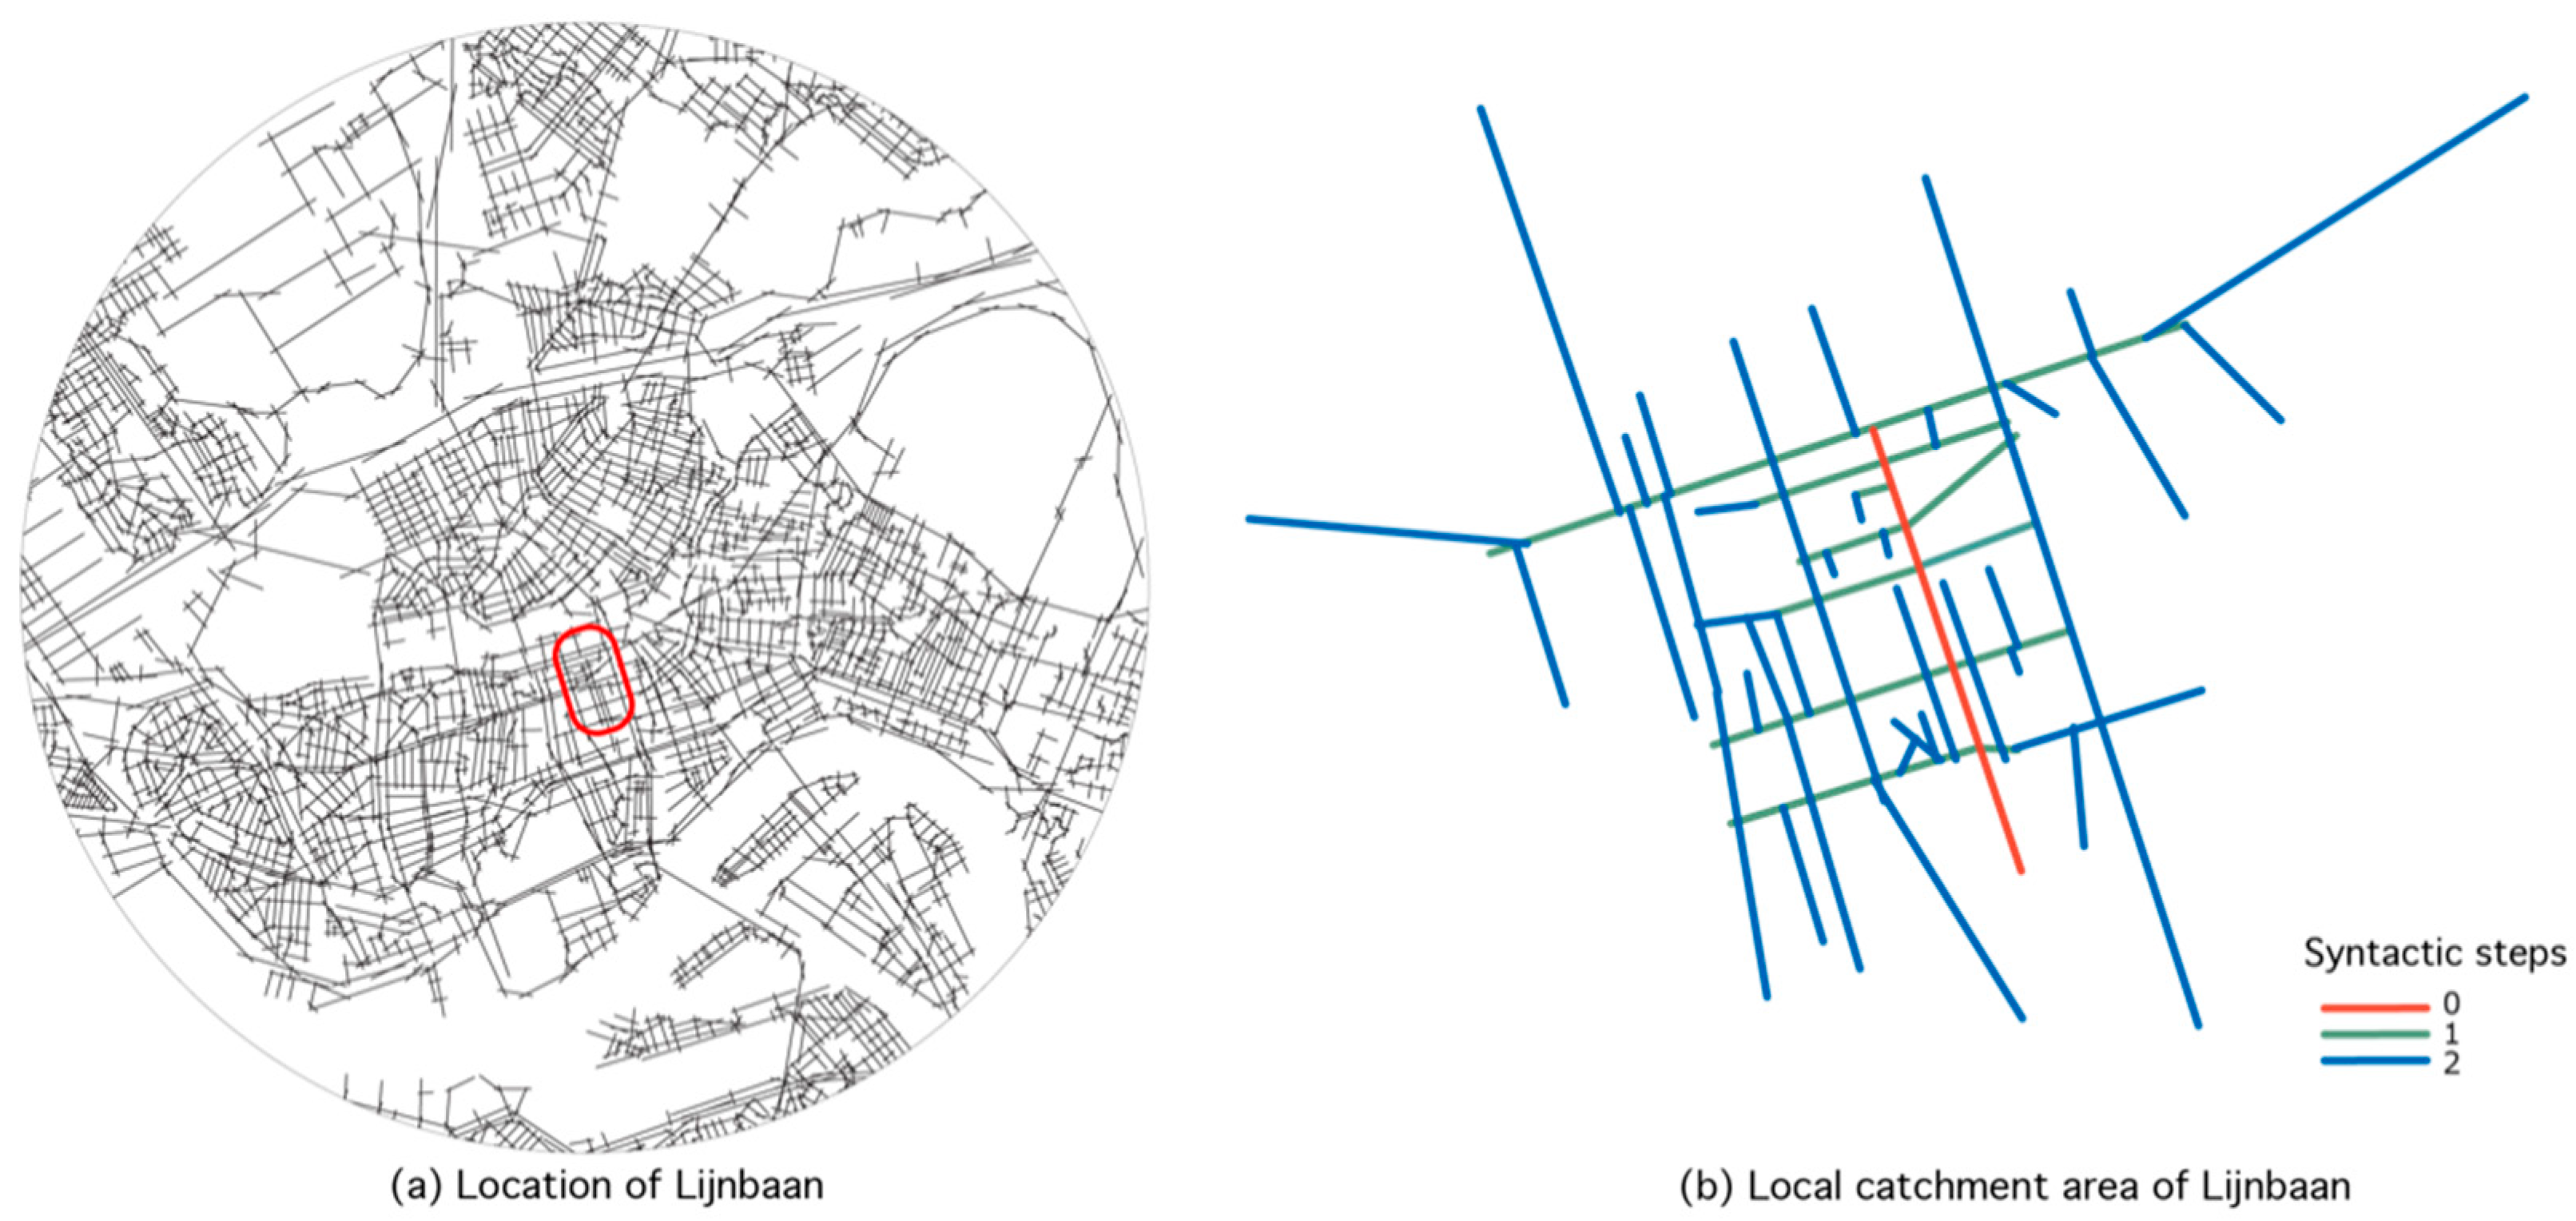
- Two-step analysis: This type of analysis illustrates how many streets can be reached within two direction changes from a particular street or road or from a chosen set of streets and roads. This analysis method is mostly used to find out about a shopping street’s local catchment area [46].
- N-step analysis or point depth analysis: This type of analysis shows how topologically deep all streets and roads are in relation to one particular street or several particular streets in terms of number of direction changes. The higher the number of direction changes from a chosen street or a set of chosen streets, the topologically deeper an area is [47].
Figure 7 shows a two-step analysis of the Lijnbaan, one of the main shopping streets in the center of Rotterdam. The red axial line (Figure 7b) indicates the starting point for the analysis. The two-step analysis visualizes how many streets can be reached within two direction changes from the origin of the Lijnbaan and depicts the Lijnbaan’s local catchment area. Shopping streets often have high numbers of streets that are located within two direction changes [20,46]. Even though the Lijnbaan’s location is spatially ‘hidden’ (Figure 7a), its connectivity within its local catchment area is high.
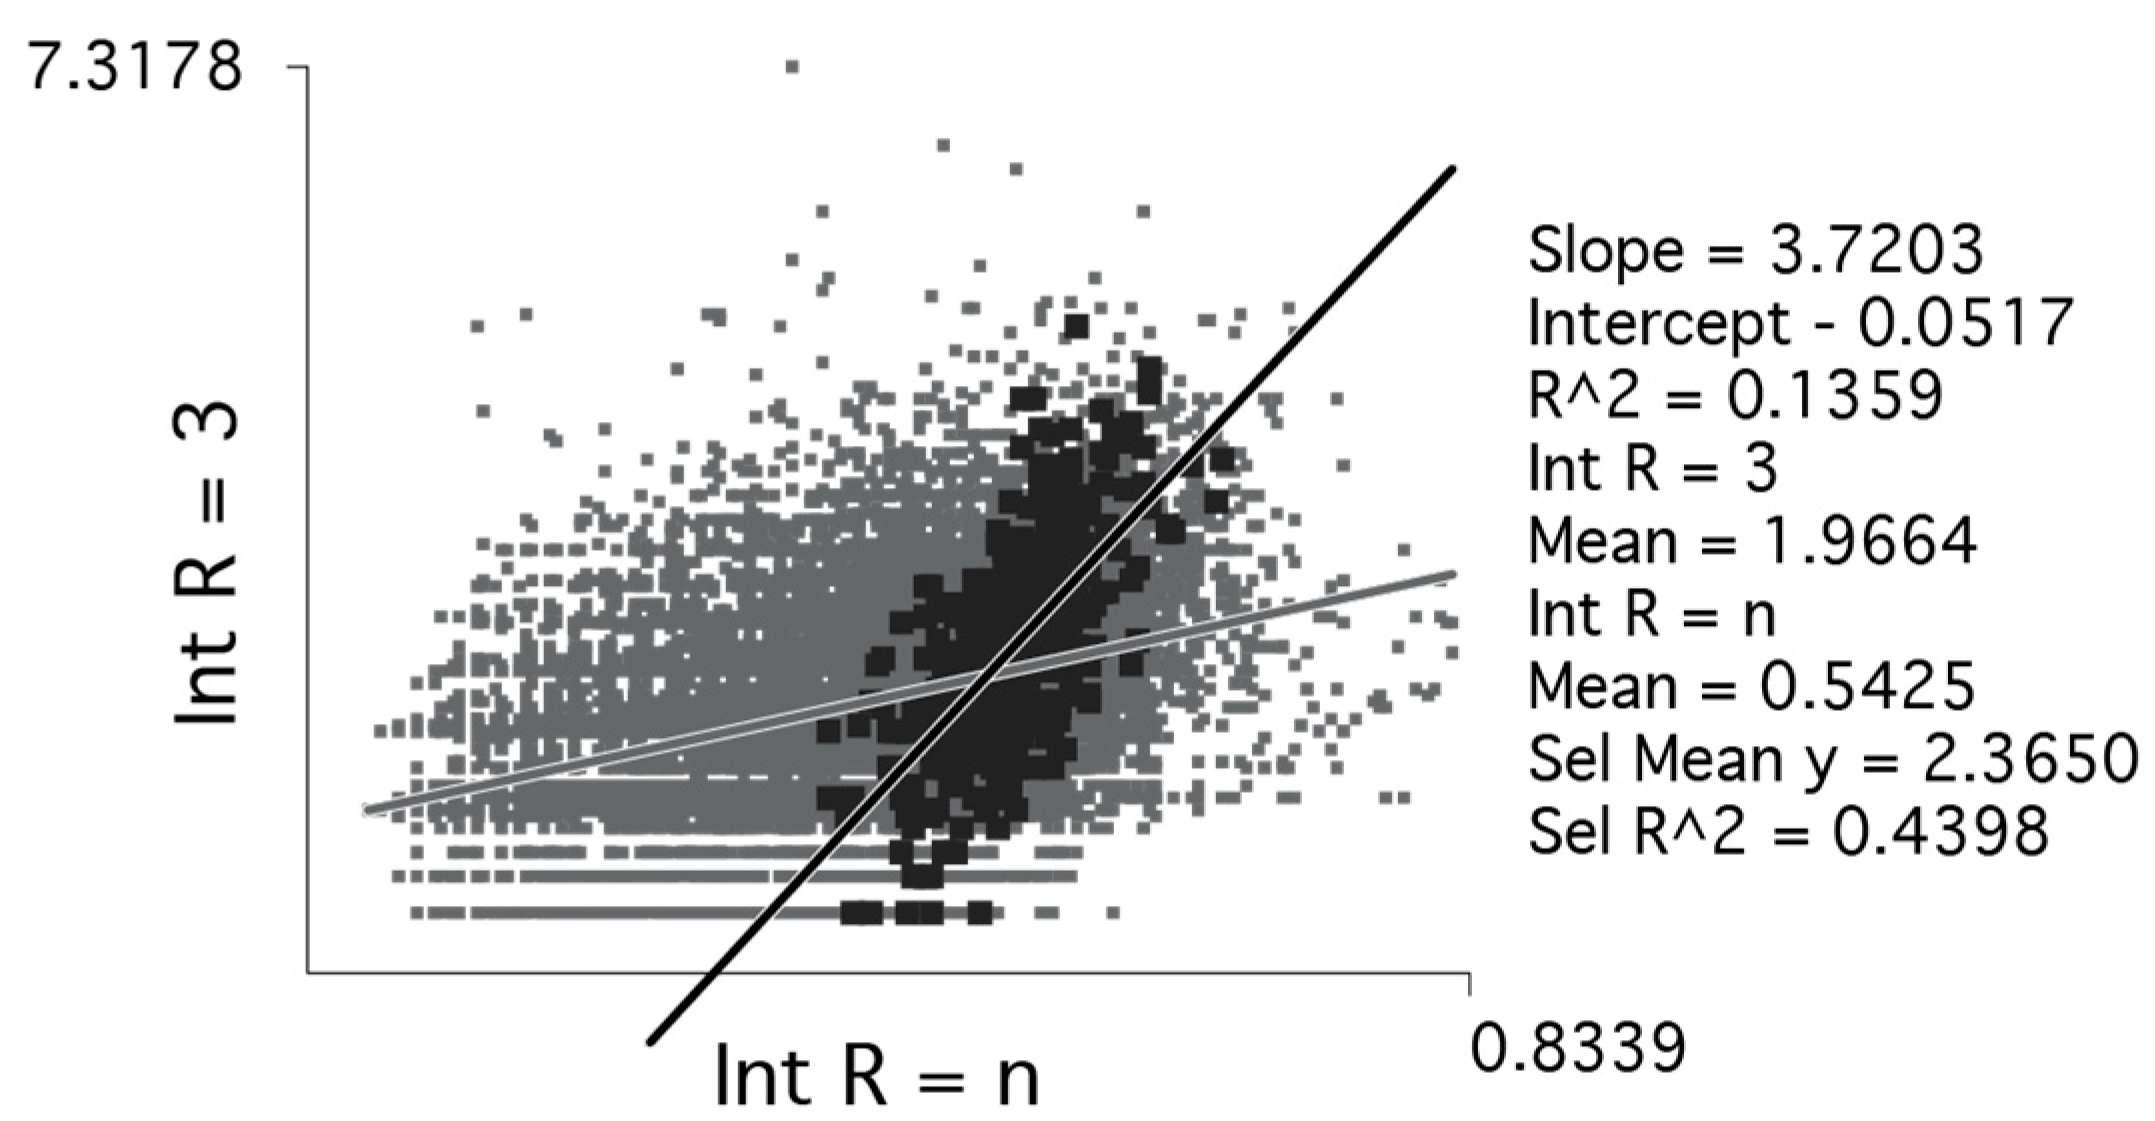
- Intelligibility: This is a measure of the correlation between citywide integration and connectivity values [48,49], or, more generally, the correlation between global and local integration values [14], that indicates how comprehensible an urban system is. The closer the correlation coefficient (R2) is to 1.0, the higher a system’s level of intelligibility. This means that, based on the street pattern logic of a local area, an entire city can be understood. The concept of intelligibility also refers to cognitive mapping, which is connected to Kevin Lynch’s concept of legibility [50].
Figure 8 shows the scatter plot of the local integration (Int r = 3) versus the global integration (Int r = n) of Rotterdam. The black pixels represent the streets (=axial lines) in the main center of Rotterdam. Even though Rotterdam’s center was heavily bombed in World War II, the original street pattern was kept during the rebuilding of the city center. The correlation coefficient (R2) for the whole city is 0.1359, which is low. The correlation coefficient (R2) for the city center is average with 0.4398.
- Radius-radius (RadR): The radius-radius measure was set up to minimize the edge effect for a whole spatial system. Radius-radius calculations, which were popular in the past, work with mean depth in the sense that this represents the real-life character of a utilization pattern. Radius-radius analysis is an axial integration analysis that uses the mean of the mean depth values of the most globally integrated axial lines in the system, using this as the maximum radius. This is done to reduce the edge effect [3] (p. 120).
- Integration gradient: This was a first attempt at drawing up an equation for the identification of main routes in a city. It takes the local integration into account in the calculation. An integration gradient of r = 3 with real relative asymmetry (RRA) is calculated as follows: (RRA3)/average{average{RRA3}} [51]. Angular choice analysis (see Section 2.2) replaced the integration gradient calculations.
- Constituted and unconstituted street and urban spaces: When a street or urban space has entrances that are directly connected to it from adjacent buildings, the street or urban space is constituted. An unconstituted street or urban space has no entrances connected to it [5] (p. 105).
- Edge effect: An edge effect exists for global axial integration. Local measures, such as a radius of 3, minimize the edge effect but do not eliminate it. It is, therefore, important to have an adequate spatial buffer around the nodes (or area) to produce correct and ‘clean’ results. Axial maps that do not take a spatial buffer into consideration with axial integration produce artificially low results in those areas that do not have an accurate buffer zone around them [3] (p. 120). A spatial buffer handles the size of the contextual area. Different research approaches lead to different answers to this issue. As a rule of thumb that is used in practice, a 30-min test is most commonly applied. This test equals a 30-min walk (approximately 2000 m), if pedestrian movement is examined. Similarly, the Agora Technology Platform report [52] mentions that a vehicular axial map would select an area encompassing a 30-min drive from the area of interest. Consequently, vehicular maps are quite large and often depict the whole city under investigation.
2.2. More Recent Concepts and Measures
In 2004, Carlo Ratti published an article on some inconsistencies in the space syntax method [53]. Ratti criticized the lack of metric properties in space syntax in particular. In 2005, some of these inconsistencies were resolved and the results were presented at the 5th International Space Syntax Symposium. The late Alasdair Turner presented an updated version of the Depthmap software, which incorporated an angular analysis that was formulated and presented at the 3rd International Space Syntax Symposium [54]. In addition, Nick Dalton contributed to the angular weighting of the axial map in the test software Meanda [55]. The solution for successful computational angular analysis with various local radii was to break down the axial map into a segment map and to incorporate segment length into the calculations [17]. This operation can be performed with the Depthmap software. Later, in 2012, Hillier, Yang, and Turner presented the equation for normalizing two principal measurements in space syntax: angular choice and segment integration analyses [9]. They are referred to as normalized angular choice (NACH) and normalized angular integration (NAIN), respectively.
- Segment map: To create a segment map, the axial map is broken down into segments at each street intersection [17]. In recent years, the use of georeferenced road-center lines became more popular for the generation of a street network model. Turner proved that a georeferenced street network model that uses road-center lines can be used when calculating segment angular choice and integration. The computed values for each street segment differ within an acceptable range between a segment map that is derived from a road-center line and an axial map [56].
- Topological distance: The lowest number of direction changes from each street segment to all others [8].
- Geometric distance: The lowest number of angular deviations from each street segment to all others [8].
- Metric distance: The shortest distance from a street segment to all others [8].
- Topological radius: A set number of direction changes from each street segment to all others [57].
- Geometric radius: A given number of angular deviations (in degrees) from each street segment to all others [57].
- Metric radius: A given number of metric distances (in meters) from each street segment to all others [57].
- Angular segment integration: This shows how integrated each street segment is in relation to all others in terms of the total number of direction changes. The segment length is included in the calculations to be able to analyze local segment integrations with various metric radii [9]. The angular segment integration analysis shows the to-movement potentials in an urban system.
- Angular choice: This shows how integrated each street segment is in relation to all others in terms of the lowest total number of angular deviations. Here again, the segment length is included in the calculations to enable local choice analyses with different metrical radii [7]. The angular choice analysis shows the through-movement potentials in an urban system.
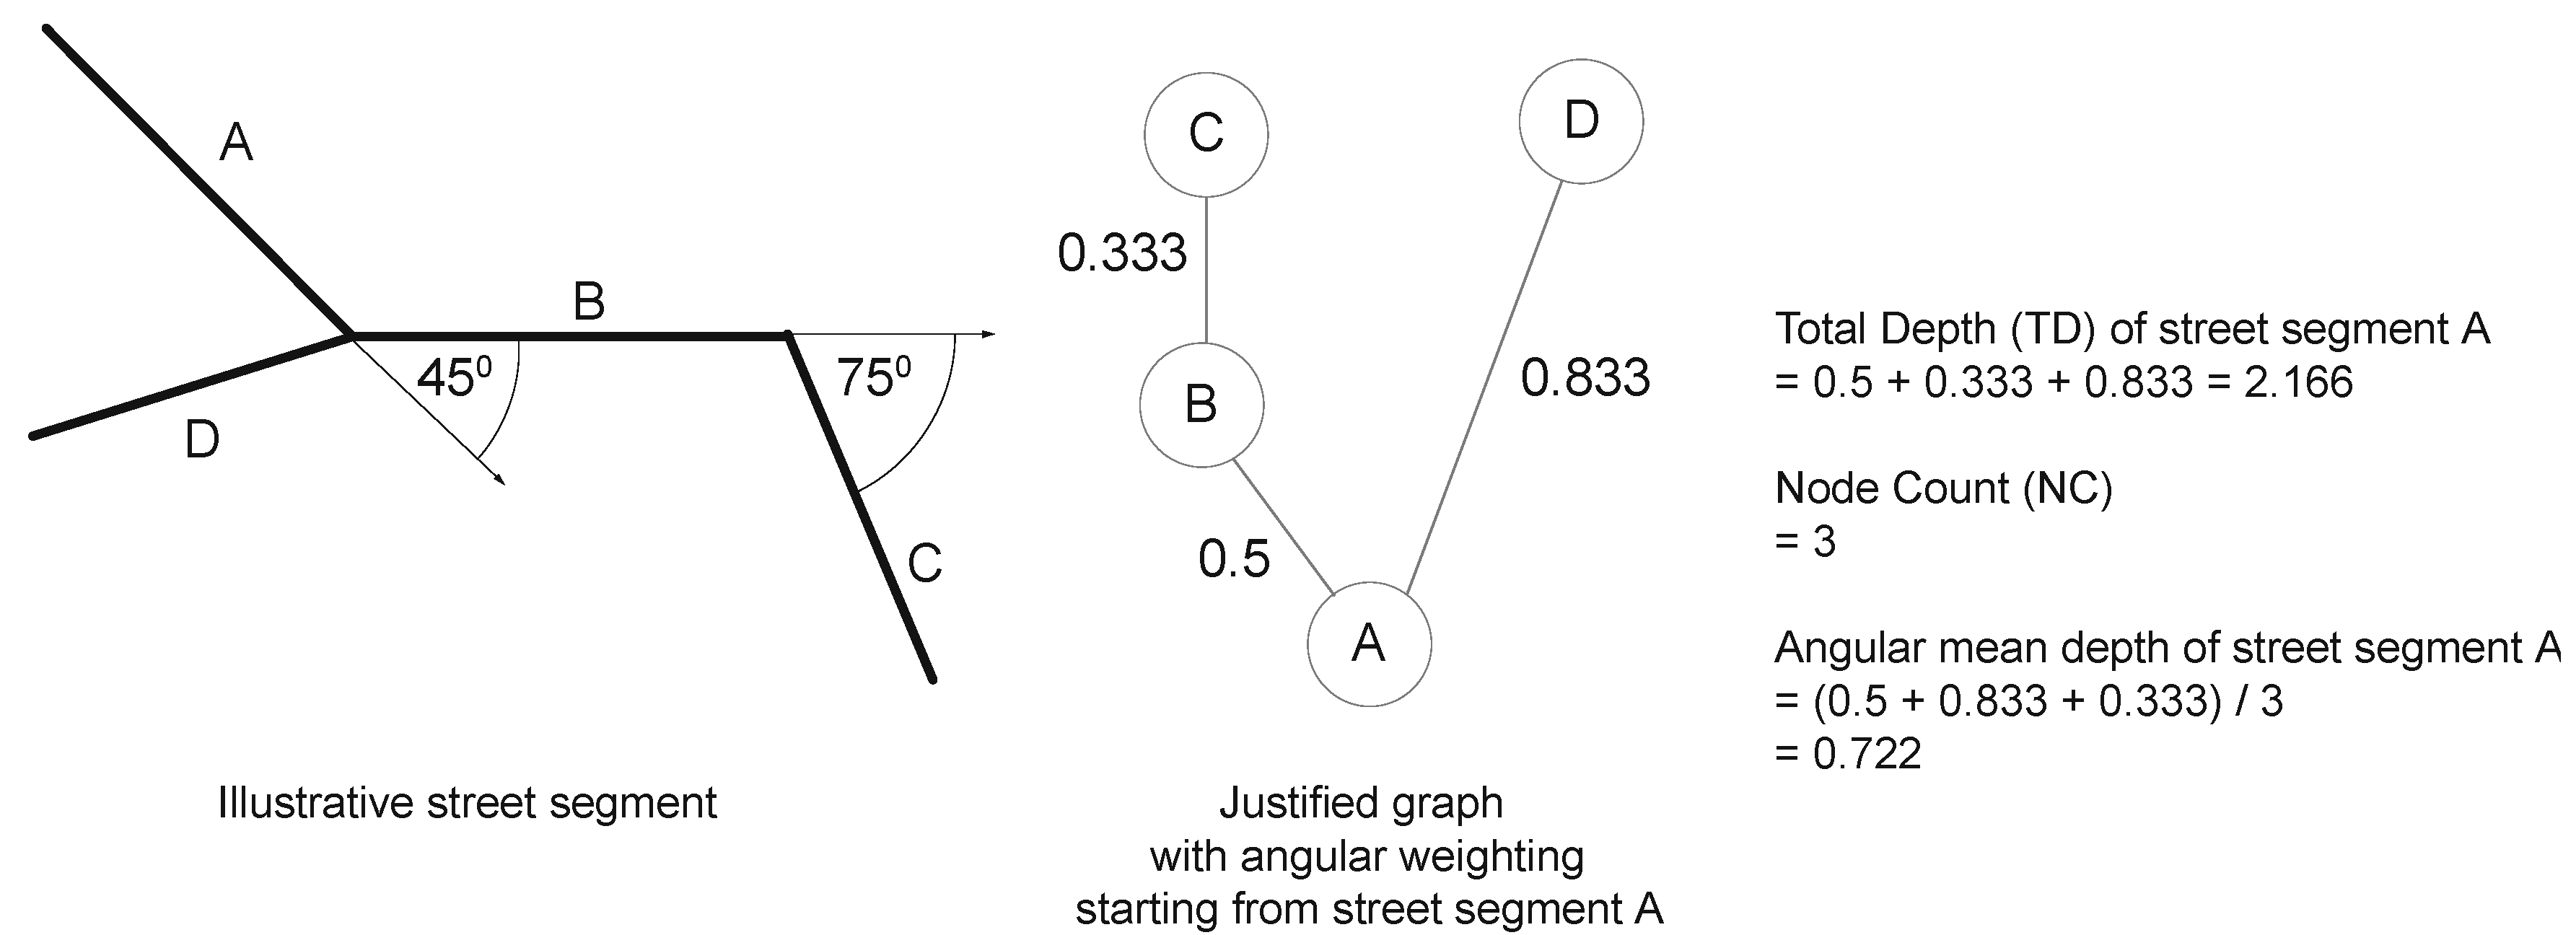
Figure 9 shows how the angular total depth (TD) and the angular mean depth (MD) are calculated for street segment A. Figure 9 shows the angular weighting that affects the nodes of the j-graph to the left.
- Angular total depth: The total number of angular deviations from each street segments to all others [54].
- Angular mean depth: The mean depth, based on the total depths of all calculated street segments in a system [54].
- Normalized angular integration (NAIN): Angular segment integration measures to-movement potentials. Segment connectivity forms the basis for calculating angular integrations. It differs from axial integration in that it is more ‘fine-tuned’ and therefore depicts reality in greater detail. Normalized angular integration normalizes angular total depth by comparing the system to the urban average [9].
- Normalized angular choice (NACH): Angular choice analysis depicts the potential through-movement and, therefore, an urban route hierarchy. Angular choice is an angle-weighted graph that is computed by using a segment map. Normalized angular choice is calculated by dividing the total choice by the total depth for each segment in the system. A metric radius is often applied to angular choice. Radii of 400, 800, or 1200 m refer to a 5-, 10-, or 20-min walk, respectively. Therefore, by applying more local radii, main routes are highlighted that run through or between neighborhoods in a city [9]. Normalized angular choice adjusts choice values and allows a solution to the paradox that a segregated design adds more total (and average) choice to the system than an integrated one [9].
NAIN and NACH yield:
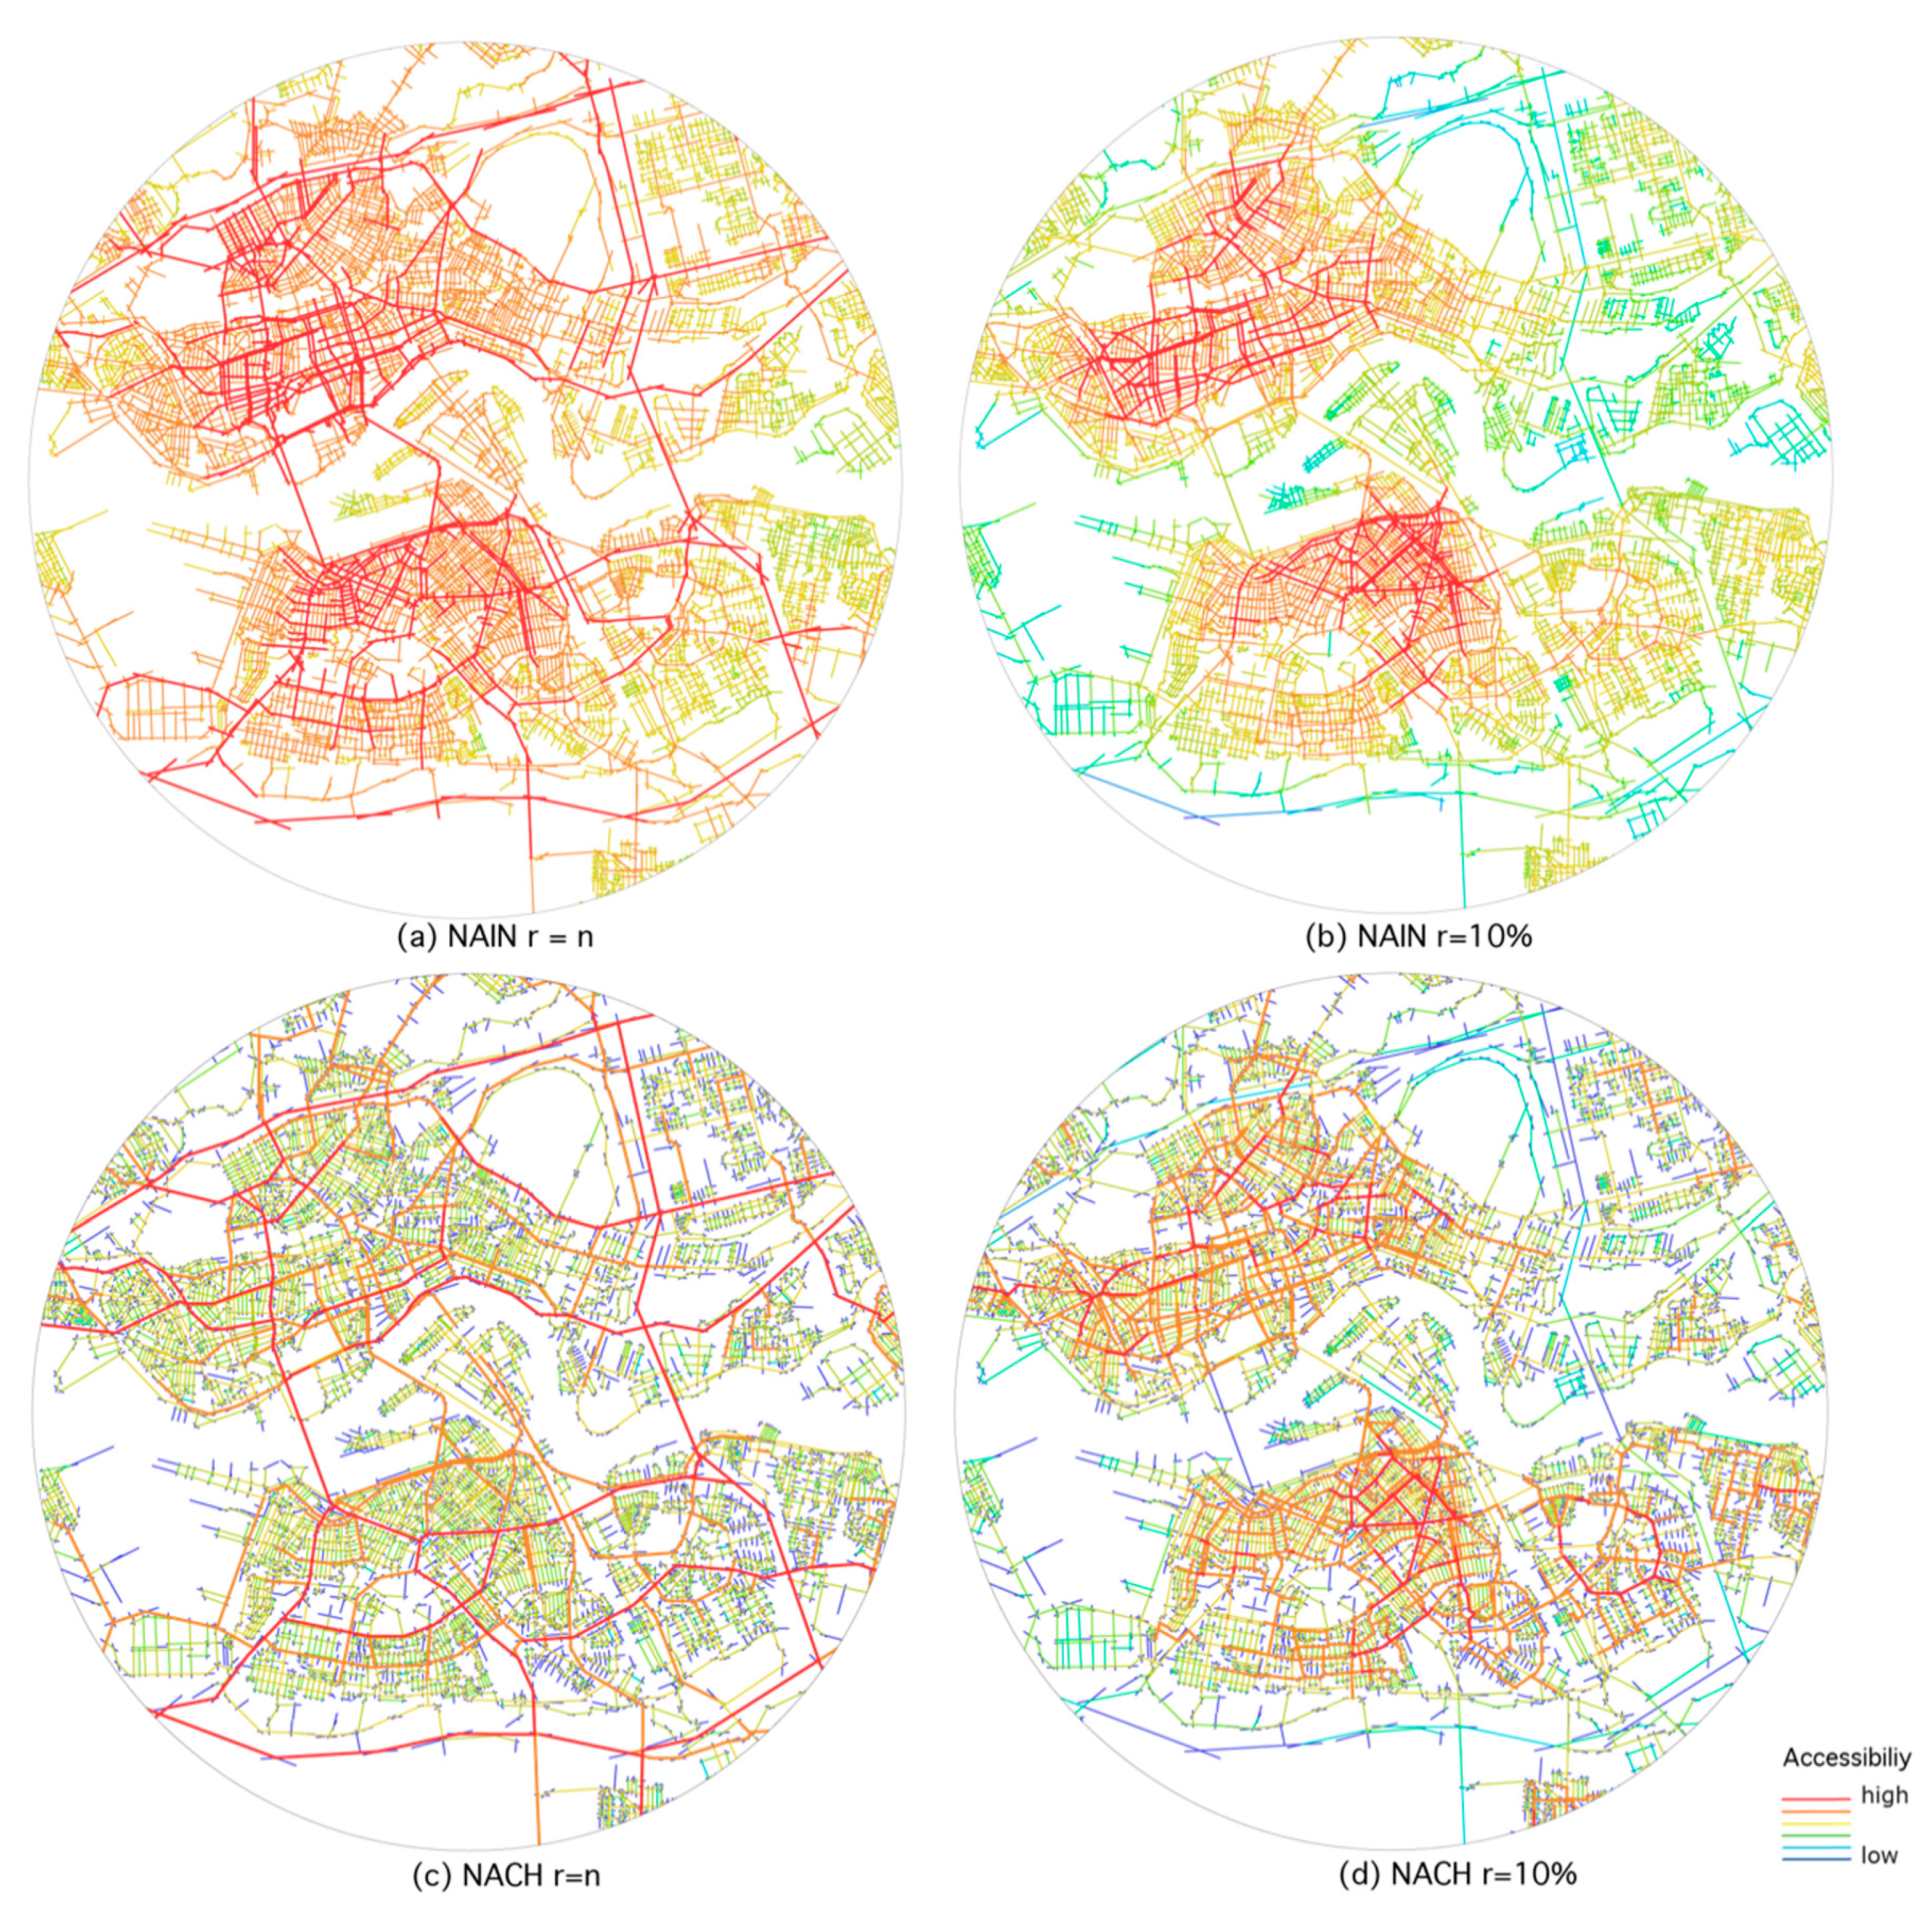
Figure 10 shows the normalized angular integration (NAIN) and the normalized angular choice (NACH) analyses of Rotterdam with both low and high metric radii. NB: Not-georeferenced maps work with a local radius of 10% of the whole urban system size. In cases where the axial and the segment maps were georeferenced for Rotterdam, a radius of between 400 and 600 meters was used for the local scale and a radius of between 4000 and 6000 meters was used for a city or a metropolitan scale. Figure 10a,b show the citywide and the local to-movement potentials, respectively. For the citywide to-movement, the two centers of Rotterdam on each side of the river are highlighted. In addition, the local radius analysis depicts the various local shopping streets. The analyses in Figure 10c,d highlight the streets with the highest through-movement potentials citywide and locally, respectively. This shows that the citywide NACH analysis highlights the main route network, whereas the most vital pedestrian-based main routes are highlighted in the local NACH analysis.
Regarding the analysis of small neighborhoods and public squares, the following concepts are used in the two-dimensional analytical approach.
- Isovist map: An isovist map is the sum of isovist fields for a public space. The spatial boundary for each individual isovist field is given [58].
- Visual graph analysis (VGA): This is a method for the intervisibility of urban spaces. It builds upon the logic of an isovist analysis; it is different in that a visual graph analysis is derived from all the roots of each isovist field from each cell on a given raster. The VGA is applied on an at-eye level (what people can see) and on an at-knee level (where people can move) [59].
- Agent-based modelling (ABM): In the space syntax arena, agent-based modelling uses simple agents with visual fields and syntactic steps [60].
- Through-vision: This is the longest possible continuous view [61].
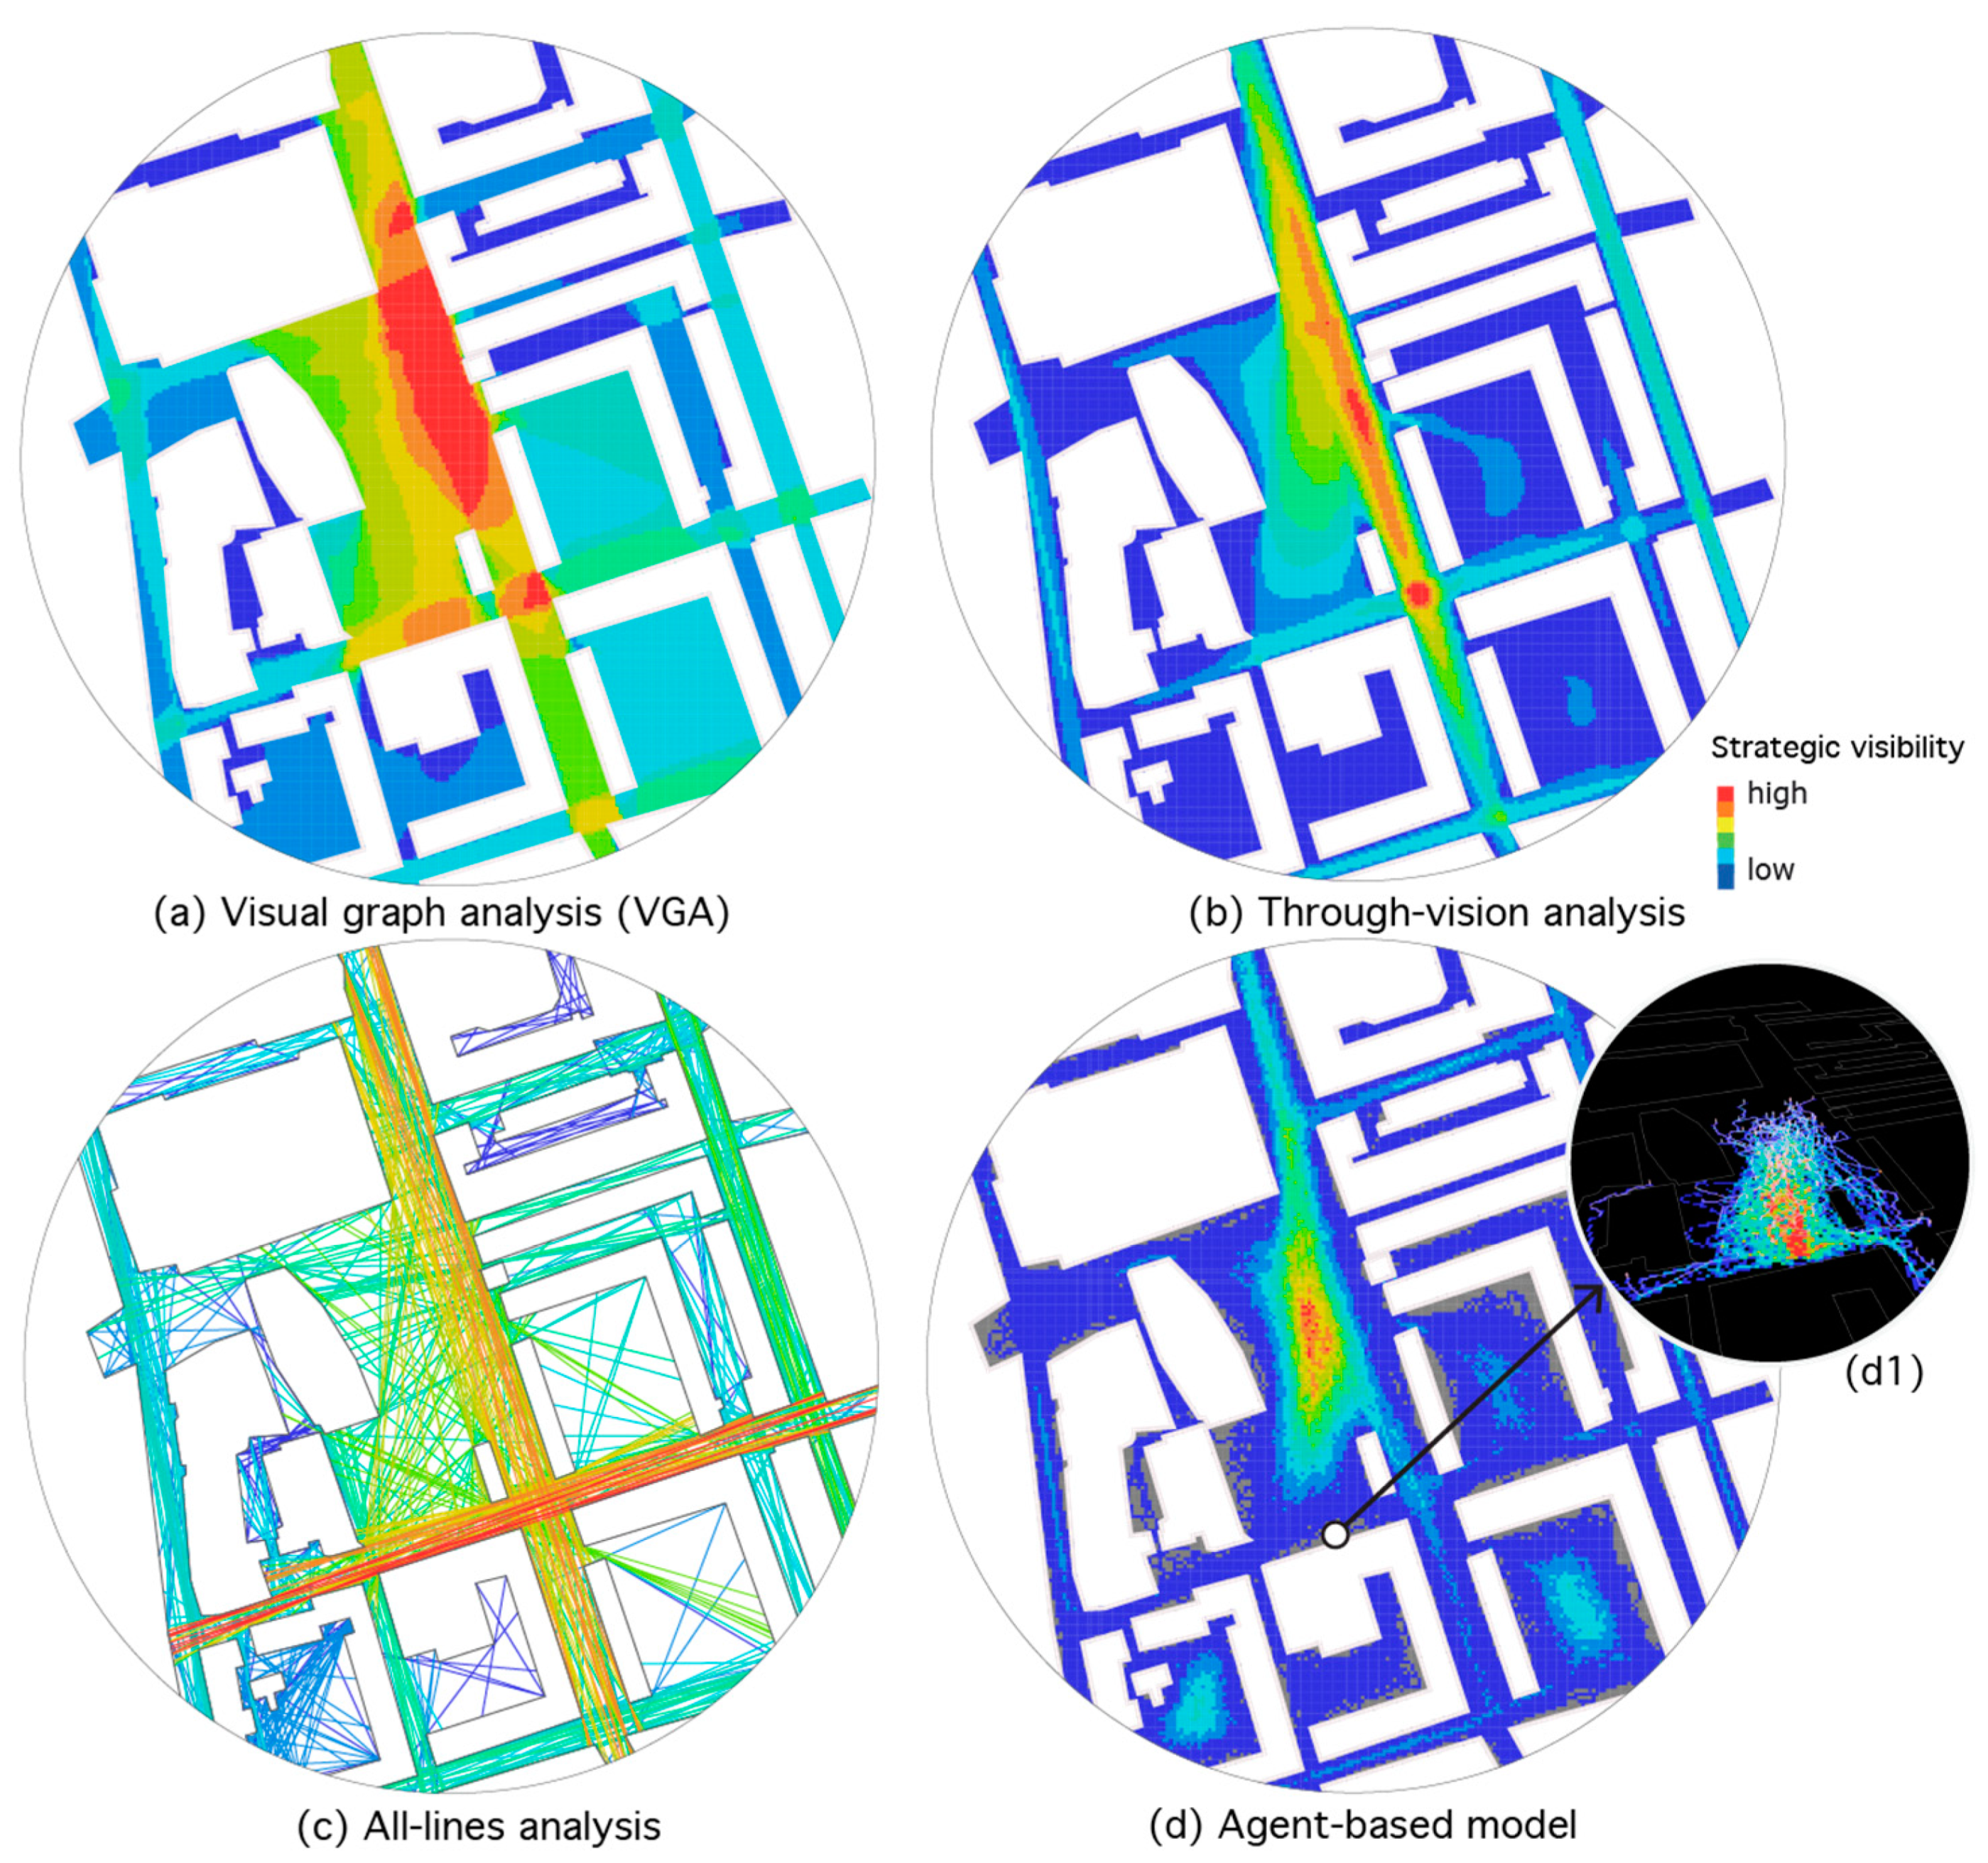
Figure 11 shows a visual graph analysis 11(a), a through-vision analysis 11(b), an all-lines analysis 11(c), and an agent-based model 11(d) of Rotterdam’s modernistic squares ‘De Doelen’ and ‘Schouwburgplein’. The largest through-vision is in the street that is perpendicular to the square, whereas the highest visual connectivity is inside the square (see the VGA analysis). Stationary activity of people tends to be highest at these two locations. Areas with the lowest visibility are frequented by only a few people. The all-lines axial map differs slightly from the results obtained from the visual graph and the through-vision analyses because it represents all the lines that are drawn to vertices that can see each other [62]. In the agent-based model, where agents are released from all locations in the simulation, agents gather mostly in the square itself. In contrast, releasing agents from a specific location in this simulation—in our case the theatre entrance/exit—demonstrates how agents orient themselves in the built environment one minute after leaving the theatre on foot (d1).
We complete this section with some recently developed spatial concepts that are based on constituedness of streets from Hillier and Hanson [5]. The concepts below were developed from a research project on space and crime [47].
- Topological depth between private and public spaces: The number of semi-private or semi-public spaces between private spaces inside buildings and public streets [47].
- Street intervisibility: A street with buildings that have both entrances and windows that are oriented towards the street on both sides of the street have high intervisibility. Streets with buildings that only have windows on the ground floor but that lack entrances are not taken into account. Similarly, streets with buildings that have entrances and windows only on the ground floor on one side of the street lack intervisibility [47].
- Entrance density: This is the density of entrances and windows on the ground floor. Entrance density is often defined as low, medium, or high. Streets with buildings that only have entrances on the ground floor, but no windows are taken into account [47].
2.3. Primary Data Collection with Observation Techniques
Primary data collection for the analysis of socioeconomic factors allows testing of socio-spatial hypotheses and the development of models that predict spatial effects that influence socioeconomic life in cities. Throughout the years, three different methods for the collection of primary data concerning human behavior in the public realm were established as part of the space syntax analysis. Academic literature on these approaches is limited.
- Pedestrian, bicycle, and car movement—‘gate counts’: Counting the flow of human movement at certain locations in a neighborhood over the course of a day provides quantitative data that can be used for comparison with various spatial integration values [4,40,48]. This method has been applied to provide evidence that central streets have high rates of human movement, while spatially segregated streets have low numbers of people frequenting them [15,16]. The gate count method is an observation technique that records pedestrian, bicycle, and vehicular movement flow in an urban area. A gate is an imaginary line across the street where all passing pedestrians, cyclists and motorized vehicles are counted.
- Pedestrian route traces—‘snail trailing’: With this pedestrian-following technique, quantitative data are collected by observing pedestrian movement that disperses from specific, strategic locations [4,40,48]. It allows the investigation of the pattern of movement from a specific location, the relationship of a particular route to other routes in the area and the average distance that people walk from that specific location, all of which can help to determine the pedestrian catchment area of a retail facility or a public square. Superimposing all observations (traces) provides an image of pedestrian movement throughout an area under investigation. This technique can be performed manually or by using global positioning system (GPS) tracking.
- Stationary activities—‘static snapshots’: This is an effective observation technique for the registration of people’s various stationary activities including social interactions in public squares and parks [3] (p. 248). Human behavior in a public space is registered for a very short period of time—a ‘snapshot’ so to speak. This method records the usage pattern of a public space for a specific time and by repeating the registration throughout a day, a behavioral pattern can be identified over the course of a day.
The results from the gate counts and snail trailing correlate well with numerical results from axial and segment analyses. Static snapshots correlate well with results from all types of space syntax analyses but most strongly with visual graph analysis and all-lines analysis.
3. Theoretical Foundation: Space and Functions of Cities
Through refining concepts, calculation methods, and empirical evidence, as well as through verification of the methodological interventions throughout the years, some generalizations were formulated and these contributed to the development of a theory on the relationship between space and society [4].
In his book ‘Space is the machine’, Hillier presented the theory of spatial combinatorics [3] (Chapter 8). Together with his colleagues, Hillier developed the theory of natural movement [11,15,16], also named the theory of the natural movement economic process [3]. Based on the latter, van Nes and Ye developed the theory of natural urban transformation [63]. The theory of natural movement influenced the understanding of the dual network logic, leading to the definition of foreground and background networks of cities. The theory of spatial combinatorics contributed to Hillier’s understanding of pervasive centrality, which states that in proximity to smaller centers there is always a much larger one. In the following sections, we will explain all three theories and their accompanying effects on the dual network and pervasive centrality.
3.1. The Theory of Spatial Combinatorics
This theory is based on the elementary principles of centrality, extension, contiguity and compactness. Since these spatial principles deal with the spatial aspects of the built environment, human intention, meaning or memories are not considered. The way in which public spaces are blocked or the way in which main routes are free from physical obstacles influences how city centers emerge or gradually decline [3] (p. 8).
Applying the principle of centrality, it can be demonstrated that the more central an object is placed within a defined space, the more it contributes to the overall segregation of this particular space. To illustrate this phenomenon, a building that is placed in the middle of a central square will add a higher overall segregation to the neighborhood than placing the same building at the edge of the square. In the latter case, the overall segregation of the neighborhood will be lower.
Furthermore, the principle of extension explains the partitioning of a long urban space, for example a long street. Blocking long main routes that connect a city’s center to its outskirts contributes to the overall segregation of the city more than blocking short, local streets.
However, the size of the urban blocks matter. Short urban blocks contribute to higher spatial integration than large ones. That is the principle of contiguity.
The principle of compactness states that straight long buildings segregate more than ‘curved’ long buildings.
The theory of spatial combinatorics forms the foundation for the understanding of urban centralities that is based on the spatial layouts of built environments. As Hillier claims, urban centrality is not a state but a process that is based on spatial inequalities in an urban network [46]. Therefore, growth as a dynamic process of settlements entails a reorganization of spatial systems, including the hierarchy of centers and sub-centers or centrality and periphery. The cascade of different-sized centers as well as center and periphery represent the hierarchical scale of accessibility within a system [24].
3.2. The Theory of Natural Movement or the Natural Movement Economic Process
The theory of natural movement, often referred to as the natural movement economic process [11,15,19,21,22], states that the spatial configuration of the street network influences the flow of human movement and the location of shops in the built environment. There is a causal relationship between space, movement, and economic activities. The more spatially integrated a street is, the higher the flow of people movement and the more attractive the land along that street is for economic activities [15]. This process is influenced and changed through urban interventions such as new street links [19,64]. This theory explains how the built environment functions independently of planning processes with regard to socioeconomic activities. It is interesting to note that it is not movement and urban attractors that influence the street network’s spatial configuration, but rather the street network’s spatial configuration that is decisive for movement and for the optimum location for economic activities [11].
3.3. The Theory of the Natural Urban Transformation Process
Building upon the theory of natural movement, van Nes and Ye [63] developed the theory of the urban transformation process. This states that the spatial configuration of the street and the road network influences the degree of building density and the degree of functional diversity of land use. The higher the overall spatial centrality of streets on various scales, the higher the building densities and the greater the diversity of land use. Seemingly, the spatial configuration of the street network, as the foundation for steering urban transformation, influences the degree of functional diversity of land use over time. The theory of the natural urban transformation process explains how a built environment functions independently of planning processes with regard to restrictive land use plans, including the requirements for density and mixed land use. This theory contrasts with the post-modernist and new town planning practices that are common in North America, in some European countries and in Asia [4,22,63].
3.4. Understanding and Explaining the Dual Network
The theory of natural movement has contributed to some general understandings about how cities are spatially built up. According to Hillier, cities have a dual nature that consists of a foreground and a background street network. The foreground street network links urban centers at all scales and levels. These are the main routes that are identified by the normalized angular choice analysis with a high metric radius. It gives a city’s street structure a ‘deformed wheel pattern’ that consists of radial and orbital main routes. This spatial structure can even be seen in cities that have a nearly orthogonal street network. These main routes are attractive for high levels of through-movement. The main route network that runs through and between neighborhoods shapes the deformed wheel’s spokes. This makes access from the city’s outskirts to its center and the natural interface of co-presence through movement efficient and possible. The foreground network is independent of cultures.
In a similar way, cities have a background network for residential areas, which is produced by and reflects cultural patterns. The background network is mostly shaped by the way in which different cultures influence urban space, including both the metric and the geometric properties of the network. However, local residential areas tend to also have a localized foreground structure [8] (p. 4).
However, we can see that all cities and towns are made up of a very large number of shorts streets and a very small number of long streets and roads [18]. This can be identified across scales and gives a city’s street networks and regional networks a clear fractal structure [24,64,65]. Hillier explained that the foreground network is largely composed of longer streets and roads that connect to other streets and roads at highly obtuse angles. The longer the street line, the more likely it is to end with a nearly straight connection. Main routes through cities on all scales tend to consist of a set of longer lines that are connected to each other at almost 180-degree angles [7]. Conversely, the background network is largely made up of short streets that tend to intersect with other streets at nearly right angles. The shorter the street, the more likely it is to end at a right angle. Most residential streets tend to be metrically short [8].
The theory of the natural movement economic process is able to explain and predict the economic effects and flow of movement that are based on the spatial configuration of the foreground network. The constitution of urban centers works through spatial configuration of a street network. This affects land use and location choices. What can be identified by space syntax analysis is the ‘attraction potential’ (proximity, centrality and route choice) of different spatial areas as part of a city’s self-organizing process [18]. Consequently, for each location in a city there is always a smaller and a much larger center nearby since overlapping neighborhoods are based on this proximity. Regarding the background network, the space syntax method can only be used to describe the spatial properties and help to understand the spatial features of various cultures [4].
4. Application: Space Syntax as a Tool in Analytical Urban Design
Over the last two decades, space syntax has gained popularity in the fields of architecture, urban planning, urban design, urban sociology, transport engineering, criminology, and archaeology. The space syntax toolbox provides techniques for the analysis, forecasting and postdiction of likely socioeconomic effects of the built environment.
To create a well-functioning built environment, we have to deal with space first and then with form. This means that planning and design of urban areas has to deal with the pathway network as the anchor of the city first [66]. In other words, it is highly important for the planning and design of a well-functioning space to acknowledge that the spatial structure is the determinant for functionality and therefore superior to form.
If the land use intensity is affected by the volume and the density of people in the streets, then space syntax assesses the effects on the future potentials of street life that are connected to land use. This means that for urban planning and design, space syntax is able to test the spatial effects of various urban design proposals and potentials of these. Thus, urban design proposals can be tested to give an indication of the potential degree of vital urban street life. Space syntax can support decision-making for well-functioning urban designs, allowing the creation of sustainable cities and communities. For testing and developing urban planning and urban design scenarios, it is appropriate to answer the ‘what happens if…?’ question.
In the following example, we demonstrate the likely effects of two different locations for a new bridge across the Nieuwe Maas River in Rotterdam. This scenario testing was originally conducted in 2011 for the municipality of Rotterdam [67] to improve the spatial integration of the southern part of Rotterdam. The aim was to revitalize the southern part of Rotterdam since it lacked social integration and had a high number of low-income inhabitants.
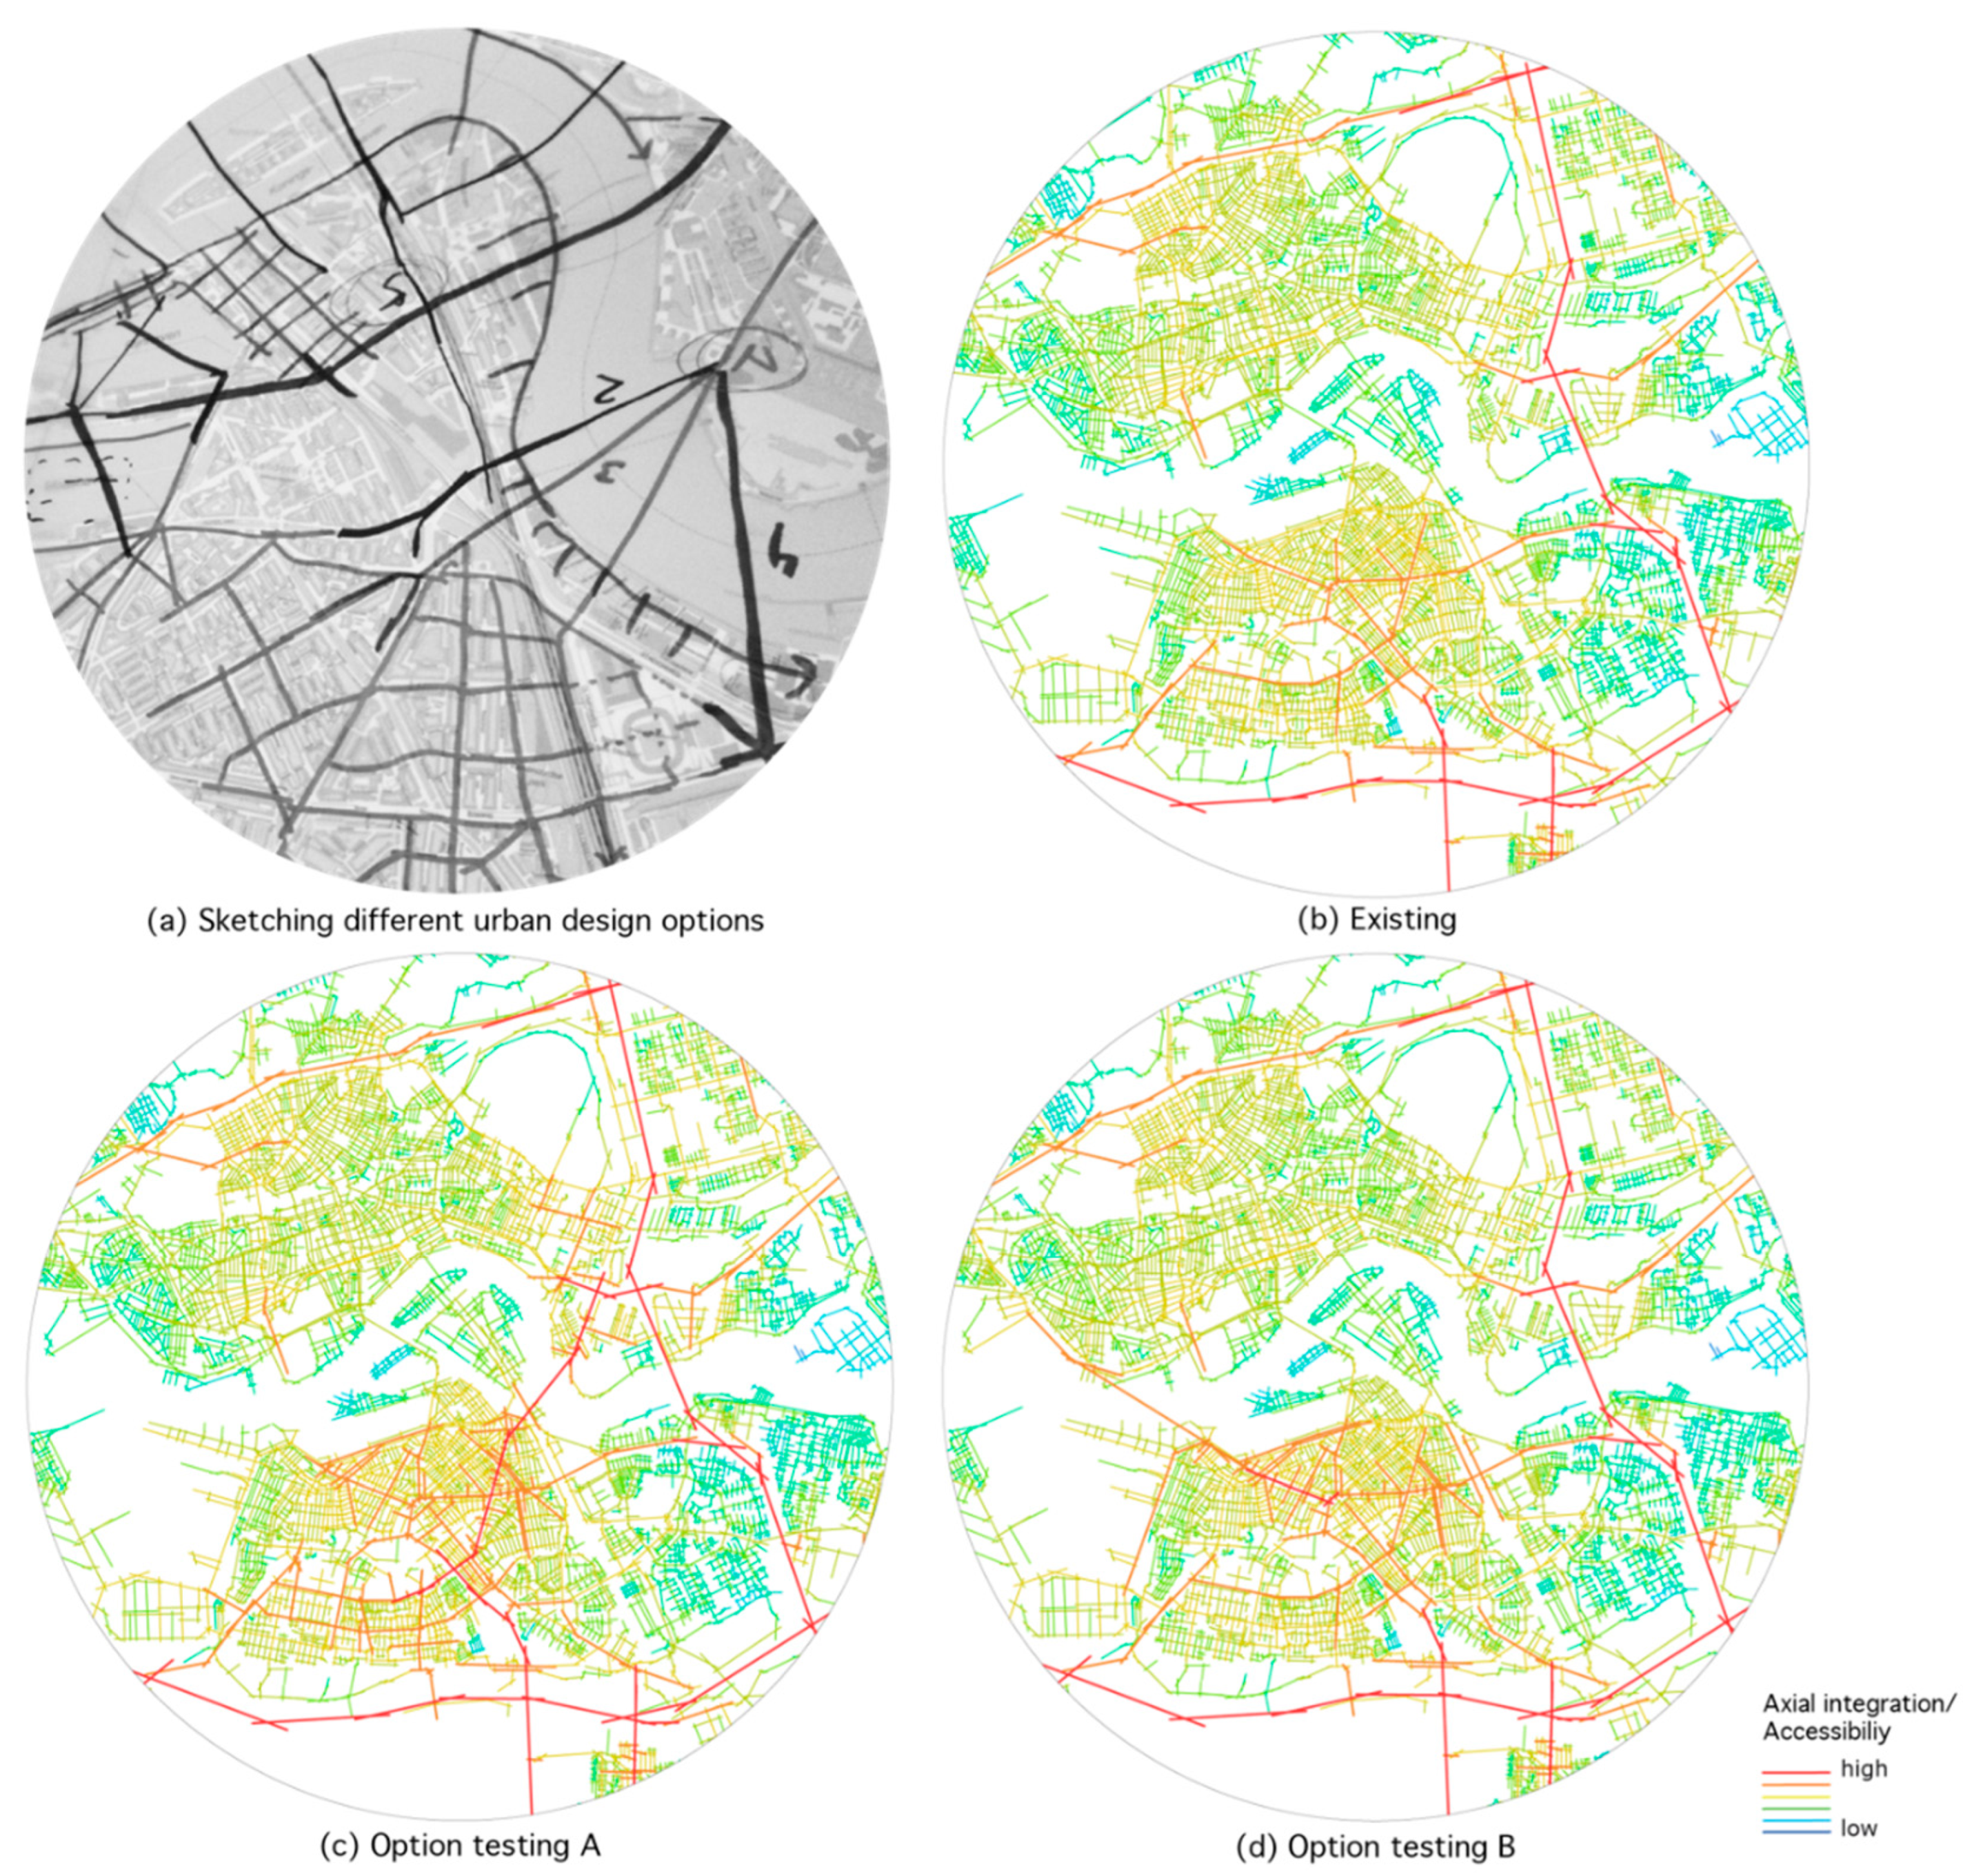
Figure 12 shows a space syntax analysis of two potential locations for a bridge. Option test A contributes to increasing the spatial integration of the southern centre of Rotterdam. In doing so, the centre will have the spatial potentials to become the main centre of Rotterdam. Option test B moves the main centre of Rotterdam towards the western part of Rotterdam south. Deriving conclusions from option testing in space syntax is rooted in the theory of the natural movement economic process and the theory of the natural urban transformation process.
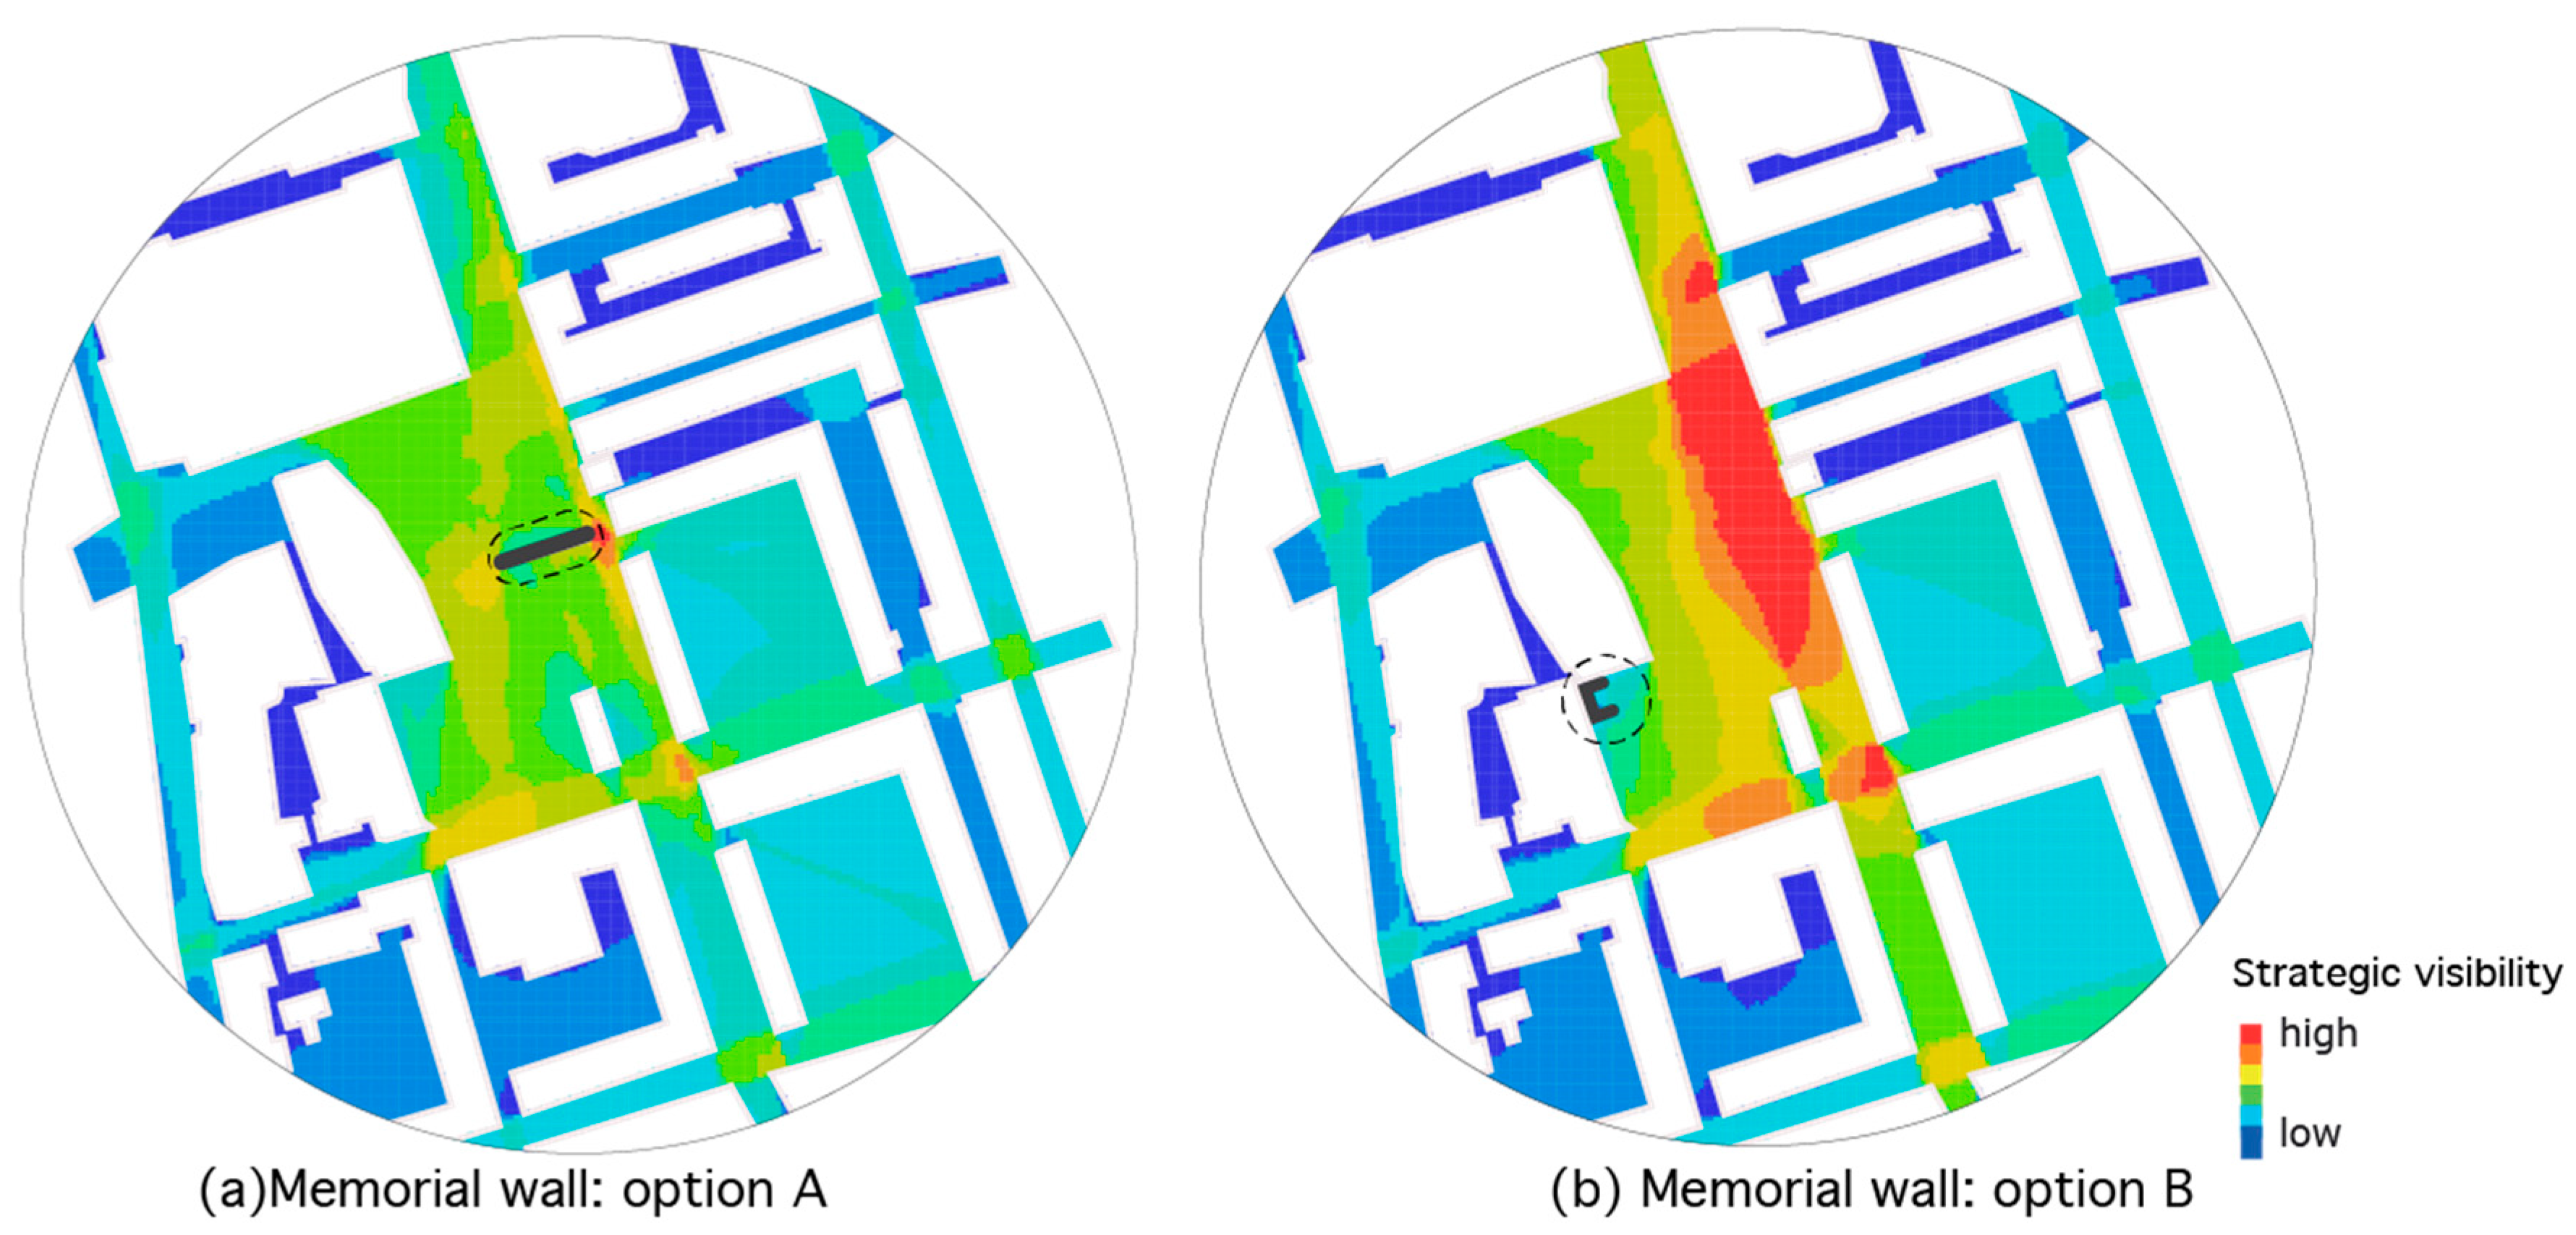
In our next example, we tested two scenarios for De Doelen and the Schouwburgplein. We considered that the municipality of Rotterdam wanted to erect a WWII memorial wall in this square. The wall is 8 m long and 2 m high. To support our decision, we tested two potential locations and shapes for the wall. We applied Hillier’s theory of spatial combinatorics to find out how the location and the shape of the wall would influence the spatial structure of the area.
Figure 13a shows the analytical results of the wall’s location and shape in a highly integrated area of the square. For this scenario, the wall has a linear shape and is blocking the maximum view of the square. Due to its prominent and highly visible location it will be seen immediately by all people entering the square. Figure 13b shows the analytical results of the memorial wall’s location in a highly segregated area of the square. Furthermore, the wall is U-shaped. This shape hardly blocks any view across the square. The analytical results for this scenario confirm that De Doelen and the Shouwburgplein keep their high level of visibility and spatial integration. From a spatial perspective, a visitor has to make some effort to find the memorial wall when entering the square.
However, applying space syntax analysis to urban planning and design has some limitations. First of all, how space syntax is applied to a project depends on the problem under investigation. Not all types of problems can be analyzed. Space syntax measures spatial relationships and not place identity, which means that built form and meaning [68] cannot be interpreted using space syntax analysis. Secondly, space syntax is not always applied correctly. Common misapplication and fallacies include the application of incorrect radius/radii, incorrect resolution of the axial map, limited knowledge of the combination and correlation of space syntax with other types of analysis and data and the lack of knowledge of the context. These lead to misinterpretations of the space syntax results, which will have implications for urban planning and design guidelines.
5. Discussion: Advantages and Limitations of Space Syntax
David Seamon skillfully summarized the advantages of space syntax by underlining following five points [69] (p. 6):
- (1)
- space syntax provides a conclusively established connection between the conceptual argument and real-world confirmation
- (2)
- space syntax provides a highly effective connection between theory and practice, whereby the ideas can readily be translated into practical application that includes effective evaluation of specific building and urban designs in terms of pathway movements and potential interpersonal encounters
- (3)
- space syntax provides quantitative procedures that almost certainly arose from the world of environmental and architectural experience and, unlike so many other quantitative methods and models, actually depict the real-life world structure
- (4)
- space syntax is a creative translation of these quantitative measures into vivid graphic and cartographic presentations that allow non-specialists to easily and quickly see spatial and environmental patterns and linkages
- (5)
- perhaps most important, space syntax powerfully demonstrates that the central way the physical environment contributes to human life is through spatial patterns.
Despite its advantages, space syntax has its limitations and was criticized for the absence of 3D information and its failure to take into account attractors, such as public transportation hubs [52,70,71] as important factors in influencing the urban configuration and wayfinding. The argument was that the intelligibility of the built environment in Lynch’s concept depends on 3D information. Suggestions for resolving these issues include a regression model [72]. Herein, Dalton et al. [73] proved that there was only a slight deviation between how people reported seeing specific content and places in real life (3D) and the results from a 2D visual graph analysis.
A further criticism of space syntax was that it does not take metric properties into account in the analysis of mobility networks [52] (p. 501). Indeed, space syntax originally only worked with topological distances (number of direction changes). Metric and geometric distances (degree or angular deviation) were added to the angular segment analysis after 2004. Joutsiniemi [74] highlighted that metric properties matter, especially on a local scale. At the 5th International Space Syntax Symposium, the introduction of the segment map, where segment length, angular deviation, and metric radii were added to the spatial calculations, managed to solve these shortcomings [7].
In addition, Batty [75] suggested a unifying framework of combining duals and primals, points and lines to overcome the limitations of the axial map and its representation as a planar graph. Batty stressed the fact that measuring the relative importance of the points, junctions, or intersections is equally important to measuring the streets as a node.
6. Conclusions: Space Syntax’ Added Value to the Sustainable City Debate
The aim of this work was to provide a holistic explanation of the conceptual framework and the methodological and theoretical basis for studying the built environment through spatio-syntactical analysis. To achieve this, we first revisited Bill Hillier’s fundamental contribution, both in scientific and didactic terms. We subsequently applied space syntax theories and concepts to the city of Rotterdam.
From these analyses, the following pressing question emerged: how can space syntax be used to describe the spatial features of sustainable urban areas? Some attempts at describing the physical features of urban sustainability were made during the late 1990s [76]. The compact city model and the compact decentralization approach [76,77] were proposals to counter urban sprawl with its high energy demand [64]. These proposals required an understanding of the link between urban compactness and sustainability. Most writings, however, lacked any suggestions on how spatial forces can generate sustainable urban processes. Space syntax allows spatial compactness, and therefore sustainable urban processes (i.e., pedestrian movement), to be understood through spatial configuration analysis. Space syntax analysis of urban compactness is possible since compactness depends on the urban environment’s topological spatial character [78]. As an illustration of this, the case study of Rotterdam shows how the potential location of a new bridge (Figure 12) may affect the existing centers and shift them spatially to different areas in the city, generating additional socioeconomic activities. In general, an urban street network that brings about movement and visibility, prompts urban restructuring and ‘street grid intensification’ over time. Pedestrian-friendly and cyclist-friendly cities have a relatively compact physical character. Street grid intensification is the process that leads to this compactness.
In contrast, urban sprawl is reinforced by a society that is dominated by motorized vehicles [79], which is the opposite of a compact pedestrian-friendly and cyclist-friendly city. Individual motorized transport in particular is creating high energy demands and is one of the basic environmental problems of modern cities, as stated in the 1987 Brundlandt report [80]. Car-dependence relates not only to a lack of available and efficient public transport, but also—mainly—to a dispersed and fragmented spatial street network. A city’s spatial structure, and therefore its physical form and spatial configuration, influences the way in which people move—either on foot, by bicycle, by public transport or by car. It is also responsible for the location of economic functions (see Hillier’s theory on the natural movement economic process in Section 3.2).
Furthermore, building density, mixed land use, and the mixture of activities primarily depend on the spatial structure of the street network. The relationship between building density and transportation is another key aspect for a sustainable city [81,82]. The higher the building density (which results in urban density), the greater the functional mix and the higher the per person energy savings for transport [1,83]. The lower all of the aforementioned factors are, the lower the overall compactness of the neighborhood and, consequently, the lower its walkability. This linear relationship results in high energy use and unsustainability of an area and vice versa.
Recent research [1,83] proved a correlation between the street network configuration and energy use for transport. Energy use for individual transport in neighborhoods with a potential for high local and citywide through-movement tends to be low. These kinds of spatial configurations enhance walking, cycling, and the use of public transport. Conversely, neighborhoods with low local and citywide or with high local and low citywide through-movement potential enhance car dependency. Hence, criteria for successful pedestrian-based urban centers include a high density of the street network within a short metric distance and interconnectivity between local streets and main routes across the entire city. A city’s spatial structure can support or hinder sustainable and active mobility. Interventions in the mobility network can affect the socioeconomic life in cities [4].
Although over the years some scholars demonstrated limitations in space syntax analysis, we advocate its strengths and advantages. Its strength is derived from the highly effective connection between theory and practice [84] at an architectural, urban, and regional scale. Therefore, it makes space syntax a robust tool that depicts the physical and the socioeconomic real-life world structure. In conclusion, space syntax offers, in a more practical way, powerful methods for the description of the spatial features of sustainable and unsustainable cities.
Author Contributions
This paper is the result of the joint work of the authors. The first draft was written by C.Y. and A.v.N. and the manuscript was reviewed and edited by all the authors. Specifically, ’Introduction‘ was written by all authors; C.G. wrote Hillier’s engagement in research, education and practice; C.Y. and A.v.N. wrote ’Basic concepts in space syntax analysis‘; C.Y. wrote ’Primary data collection‘; C.Y. and A.v.N. wrote ’Theoretical foundation‘; A.v.N. wrote ’Space syntax as a tool in urban analytical design‘; C.Y. wrote ’Discussion‘ and A.v.N. wrote ’Conclusions‘. All authors have read and agreed to the published version of the manuscript.
Funding
This research received no external funding.
Institutional Review Board Statement
Not applicable.
Informed Consent Statement
Not applicable.
Data Availability Statement
Data sharing not applicable.
Conflicts of Interest
The authors declare no conflict of interest.
References
- De Koning, R.E.; Roald, H.J.; van Nes, A. A scientific approach to the densification debate in Bergen centre in Norway. Sustainability 2020, 12, 9178. [Google Scholar] [CrossRef]
- Hidayati, I.; Yamu, C.; Tan, W. The Emergence of Mobility Inequality in Greater Jakarta, Indonesia: A Socio-Spatial Analysis of Path Dependencies in Transport-Land Use Policies. Sustainability 2019, 11, 5115. [Google Scholar] [CrossRef] [Green Version]
- Hillier, B. Space is the Machine; Cambridge University Press: Cambridge, UK, 1996. [Google Scholar]
- Van Nes, A.; Yamu, C. Introduction to Space Syntax in Urban Studies; Springer: Cham, Switzerland, 2021; ISBN 978-3-030-59140-3. [Google Scholar]
- Hillier, B.; Hanson, J. The Social Logic of Space; Cambridge University Press: Cambridge, UK, 1984. [Google Scholar]
- Hanson, J. Decoding Homes and Houses; Cambridge University Press: Cambridge, UK, 1998. [Google Scholar]
- Hillier, B.; Iida, S. Network effects and psychological effects: A theory of urban movement. In Proceedings of the 5th Space Syntax. 5th International Symposium, Delft, The Netherlands, 13–17 June 2005. [Google Scholar]
- Hillier, B.; Turner, A.; Yang, T.; Park, H.T. Metric and topo-geometric properties of urban street networks. In Proceedings of the 6th International Space Syntax Symposium, Istanbul, Turkey, 12–15 June 2007. [Google Scholar]
- Hillier, B.; Yang, T.; Turner, A. Normalising least angle choice in Depthmap and how it opens new perspectives on the global and local analysis of city space. J. Space Syntax 2012, 3, 155–193. [Google Scholar]
- Hillier, B. What are cities for? And how does it relate to their spatial form? J. Space Syntax 2016, 6, 199–212. [Google Scholar]
- Hillier, B. Cities as movement economies. Urban Des. Int. 1996, 1, 41–60. [Google Scholar] [CrossRef]
- Cutini, V. La Rivincita Dello Spazio Urbano. L’approccio Configurazionale Allo Studio e All’analisi Dei Centri Abitati; Plus—Pisa University Press: Pisa, Italy, 2010. [Google Scholar]
- Hillier, B. Space as Paradigm for understanding strongly relation systems. In Proceedings of the 2nd International Space Syntax Symposium, Brazilia, Brazil, 29 March–2 April 1999. [Google Scholar]
- Penn, A. Exploring the frontiers of space: Bill Hillier (1937–2019). Urban Morphol. 2020, 24, 224–229. [Google Scholar]
- Hillier, B.; Penn, A.; Hanson, J.; Grajewski, T.; Xu, J. Natural movement: Or, configuration and attraction in urban pedestrian movement. Environ. Plan. B 1993, 20, 29–66. [Google Scholar] [CrossRef] [Green Version]
- Hillier, B.; Penn, A.; Banister, D.; Xu, J. Configurational modelling of urban movement network. Environ. Plan. B Plan. Des. 1998, 25, 59–84. [Google Scholar]
- Hillier, B. The theory of the city as object or how spatial laws mediate the social construction of urban space. In Proceedings of the 3rd International Space Syntax Symposium, Atlanta, GA, USA, 7–11 May 2001. [Google Scholar]
- Hillier, B. The Genetic Code for Cities: Is It Simpler than We Think. In Complexity Theories of Cities Have Come of Age. An Overview with Implications to Urban Planning and Design; Portugali, J., Meyer, H., Stolk, E., Tan, E., Eds.; Springer: Berlin/Heidelberg, Germany, 2012; pp. 129–152. [Google Scholar]
- Van Nes, A. Road Building and Urban Change. The Effect of Ring Roads on the Dispersal of Shop and Retail in Western European Towns and Cities. Ph.D. Thesis, Department of Land Use and Landscape Planning, Agricultural University of Norway, Ås, Norway, 27 September 2002. [Google Scholar]
- Van Nes, A. Typologies of shopping areas in Amsterdam. In Proceedings of the 5th International Space Syntax Symposium, TU-Delft, The Netherlands, 13–17 June 2005. [Google Scholar]
- Van Nes, A. Centrality and development in the Rijnland region. In Proceedings of the 6th International Space Syntax Symposium, Istanbul, Turkey, 12–15 June 2007. [Google Scholar]
- Yamu, C. Emerging and shifting centralities: Evidence from Vienna, In Jahrbuch Raumplanung 2020; Dillinger, T., Getzner, M., Kanonier, A., Zech, S., Eds.; Neuer Wissenschaftlicher Verlag: Wien, Austria, 2020; pp. 543–559. [Google Scholar]
- Garau, C.; Annunziata, A.; Yamu, C. A walkability assessment tool coupling multi-criteria analysis and space syntax: The case study of Iglesias, Italy. Eur. Plan. Stud. 2020. [Google Scholar] [CrossRef]
- Yamu, C. It Is Simply Complex(ity). Modeling and simulation in the light of decision-making, emergent structures and a world of non-linearity. disP 2014, 50, 43–53. [Google Scholar]
- Griffiths, S. The Use of Space Syntax in Historical Research: Current Practice and Future Possibilities. In Proceedings of the 8th International Space Syntax Symposium, Santiago, Chile, 3–6 January 2012. [Google Scholar]
- Can, I.; Ince, I.; Yamu, C. The rationale behind growth patterns: Socio-spatial configuration of Izmir, Turkey 1700s–2010. In Proceedings of the 10th International Space Syntax Symposium, London, UK, 13–17 July 2015. [Google Scholar]
- van Nes, A. Measuring spatial visibility, adjacency, permeability and degrees of street life in excavated towns. Excavated towns viewed outside archaeology. In Rome, Ostia and Pompeii: Movement and Space; Laurence, R., Newsome, D.J., Eds.; Oxford University Press: Oxford, UK, 2011. [Google Scholar]
- Stöger, H. Clubs and Lounges at Roman Ostia. The Spatial Organisation of a Boomtown Phenomenon. In Proceedings of the 7th International Space Syntax Symposium at KTH, Stockholm, Sweden, 8–11 June 2009. [Google Scholar]
- Crane, M. The Medieval Urban ‘Movement Economy’ Using Space Syntax in the Study of Medieval Towns as Exemplified by the Town of ’s-Hertogenbosch, the Netherlands. In Proceedings of the 7th International Space Syntax Symposium at KTH, Stockholm, Sweden, 8–11 June 2009. [Google Scholar]
- Aleksandrowicz, O.; Yamu, C.; van Nes, A. Spatio-Syntactical Analysis and Historical Spatial Potentials: The Case of Jaffa-Tel Aviv. J. Interdiscip. Hist. 2018, 49, 1–28. [Google Scholar] [CrossRef]
- Tzortzi, K. Space. Interconnecting Museology and Architecture. J. Space Syntax 2010, 2, 26–53. [Google Scholar]
- Bafna, S.; Ramash, R. Designing the spatial syntax of office layouts. In Proceedings of the 6th International Space Syntax Symposium, Istanbul, Turkey, 12–15 June 2007. [Google Scholar]
- Penn, A.; Desyllas, J.; Vaughan, L. The Space of Innovation: Interaction and Communication in the Work Environment. Environ. Plan. B Plan. Des. 1999, 26, 193–218. [Google Scholar] [CrossRef] [Green Version]
- Van Nes, A. Analysing larger metropolitan areas. on identification criteria for middle scale networks. In Proceedings of the 7th International Space Syntax Symposium, Stockholm, Sweden, 8–11 June 2009. [Google Scholar]
- Ugalde, C.; Rigatti, D.; Zampieri, F.; Braga, A. Intelligibility in Large Spatial Systems. The case of Porto Alegre metropolitan region. In Proceedings of the 7th International Space Syntax Symposium, Stockholm, Sweden, 8–11 June 2009. [Google Scholar]
- Serra, M.; Pinho, P. Tackling the Structure of Very Large Spatial Systems—Space syntax and the analysis of metropolitan form. J. Space Syntax 2013, 4, 179–196. [Google Scholar]
- Hidayati, I.; Yamu, C.; Tan, W. Realised pedestrian accessibility of an informal settlement in Jakarta, Indonesia. J. Urban. 2020. [Google Scholar] [CrossRef]
- Hidayati, I.; Yamu, C.; Tan, W. You have to drive: Impacts of planning policies on urban form and mobility behaviour in Kuala Lumpur, Malaysia. J. Urban Manag. 2021. [Google Scholar] [CrossRef]
- Klarqvist, B. A Space Syntax Glossary. Nordisk Arkit. 1993, 2, 11–12. [Google Scholar]
- Vaughan, L. Space Syntax Observation Manual; University College London: London, UK, 2001. [Google Scholar]
- Turner, A.; Penn, A.; Hillier, B. An algorithmic definition of the axial map. Environ. Plan. B Plan. Des. 2005, 32, 425–444. [Google Scholar] [CrossRef]
- Benedikt, M.L. To take hold of space: Isovists and isovist fields. Environ. Plan. B Plan. Des. 1979, 6, 47–65. [Google Scholar] [CrossRef]
- Batty, M. Exploring isovists fields: Space and shape in architectural urban morphology. Environ. Plan. B 2001, 28, 123–150. [Google Scholar] [CrossRef] [Green Version]
- Van Nes, A. Isovists analysis. In The SAS Encyclopedia of Archaeological Sciences; John Wiley and Sons Inc.: Hoboken, NJ, USA, 2018. [Google Scholar]
- Hillier, B. A Theory of the City as Object. In Proceedings of the 3rd International Space Syntax Symposium, Atlanta, GA, USA, 7–11 May 2001. [Google Scholar]
- Hillier, B. Centrality as a process: Accounting for attraction inequalities in deformed grids. Urban Des. Int. 1999, 4, 107–127. [Google Scholar] [CrossRef]
- Van Nes, A.; López, M. Macro and micro scale spatial variables and the distribution of residential burglaries and theft from cars: An investigation of space and crime in the Dutch cities of Alkmaar and Gouda. J. Space Syntax 2010, 1. [Google Scholar]
- Grajewski, T. Space Syntax Observation Manual; University College London: London, UK, 1992. [Google Scholar]
- Hillier, B.; Burdett, R.; Peponis, J.; Penn, A. Creating Life: Or, Does Architecture Determine Anything? Archit. Comport. Archit. Behav. 1986, 3, 233–250. [Google Scholar]
- Lynch, K. The Image of the City; MIT Press: Cambridge, MA, USA, 1960. [Google Scholar]
- Read, S. Space syntax and the Dutch City. The supergrid. In Proceedings of the 1st International Space Syntax Symposium, Volume 3, University College London, London, UK, April 1997; Available online: https://www.spacesyntax.net/symposia/1st-international-space-syntax-symposium/ (accessed on 18 March 2021).
- Space Syntax Limited, Agora Cities for People, D3.1 Technology Platform Report; AGORA Consortium: London, UK, 2004.
- Ratti, C. Space syntax: Some inconsistencies. Environ. Plan. B Plan. Des. 2004, 31, 487–499. [Google Scholar] [CrossRef]
- Turner, A. Angular Analysis. In Proceedings of the 3rd International Space Syntax Symposium, Atlanta, GA, USA, 7–11 May 2001. [Google Scholar]
- Dalton, N. Fractional configurational analysis and a solution to the manhattan problem. In Proceedings of the 3rd International Space Syntax Symposium, Atlanta, GA, USA, 7–11 May 2001. [Google Scholar]
- Turner, A. From Axial to Road-Centre Lines: A New Representation for Space Syntax and a New Model of Route Choice for Transport Network Analysis. Environ. Plan. B 2007. [Google Scholar] [CrossRef] [Green Version]
- Turner, A. Getting Serious with DepthMap: Segment Analysis and Scripting; Lecture notes; University College London: London, UK, 2008. [Google Scholar]
- Turner, A.; Penn, A. Making Isovists Syntactic: Isovist Integration Analysis. In Proceedings of the 2nd International Space Syntax Symposium, University of Brasilia, Brasilia, Brazil, 29 March–2 April 1999; pp. 1–9. [Google Scholar]
- Turner, A.; Doxa, M.; O’Sullivan, D.; Penn, A. From Isovists to Visibility Graphs: A Methodology for the Analysis of Architectural Space. Environ. Plan. B 2001, 28, 103–121. [Google Scholar] [CrossRef] [Green Version]
- Penn, A.; Turner, A. Space syntax based agent simulation. In Proceedings of the 1st International Conference on Pedestrian and Evacuation Dynamics, University of Duisburg, Duisburg, Germany, 4–6 April 2001. [Google Scholar]
- Van der Hoeven, F.; van Nes, A. Improving the design of urban underground space in metro stations using the space syntax methodology. J. Tunn. Undergr. Space Technol. 2014, 40, 64–74. [Google Scholar] [CrossRef]
- Penn, A.; Conroy, R.; Dalton, N.; Dekker, L.; Mottram, C.; Turner, A. Intelligent architecture: New tools for the three dimensional analysis of space and built form. In Proceedings of the 1st International Symposium on Space Syntax; University College London: London, UK, 1997. [Google Scholar]
- Ye, Y.; van Nes, A. Quantitative tools in urban morphology: Combining space syntax, spacematrix and mixed-use index in a GIS framework. Urban Morphol. 2014, 18, 97–118. [Google Scholar]
- Yamu, C.; Frankhauser, P. Spatial accessibility to amenities, natural areas and urban green spaces: Using a multiscale, multifractal simulation model for managing urban sprawl. Environ. Plan. B Plan. Des. 2015, 42, 1054–1078. [Google Scholar] [CrossRef]
- Yamu, C.; van Nes, A. Integrated modelling approach combining multifractal urban planning with a space syntax perspective. Urban Sci. 2017, 1, 37. [Google Scholar] [CrossRef] [Green Version]
- Seamon, D. The life of the place. A phenomenological commentary on Bill Hillier’s theory of space syntax. Nord. J. Archit. Res. 1994, 1, 35–48. [Google Scholar]
- Van Nes, A.; Berghauser Pont, M.; Mashhoodi, B. Combination of space syntax with spacematrix and the mixed use index. In Proceedings of the 8th International Space Syntax Symposium, Santiago de Chile, Santiago, Chile, 3–6 January 2012. [Google Scholar]
- Marcus, L. Architectural Knowledge and Urban form. The Functional Performance of Architectural Urbanity. Ph.D. Thesis, KTH Royal Institute of Technology, Stockholm, Sweden, 2000. [Google Scholar]
- Seamon, D. Review of Bill Hillier’s Space is the Machine. Environ. Archit. Phenomenol. 2003, 14, 6–9. [Google Scholar]
- Wang, J.; Zhu, Q.; Qizhi, M. The three-dimensional extension of space syntax. In Proceedings of the 6th International Space Syntax Symposium, Istanbul, Turkey, 12–15 June 2007. [Google Scholar]
- Ascensão, A.; Costa, L.; Fernandes, C.; Morais, F.; Ruivo, C. 3D space syntax analysis: Attributes to be applied in landscape architecture projects. Urban Sci. 2019, 3, 20. [Google Scholar] [CrossRef] [Green Version]
- Hillier, B.; Penn, A. Rejoinder to Carlo Ratti. Environ. Plan. B Plan. Des. 2004, 31, 501–511. [Google Scholar] [CrossRef] [Green Version]
- Dalton, N.S.; Conroy Dalton, R.; Marshall, P.; Peverett, I.; Clinch, S. Three dimensional isovists for the study of public displays. In Proceedings of the 10th International Space Syntax Symposium, Space Syntax Laboratory, The Bartlett School of Architecture, UCL (University College London), London, UK, 13–17 July 2015. [Google Scholar]
- Joutsiniemi, A. The ajax project: New theory and new software for space syntax. In Proceedings of the 5th International Space Syntax Symposium, Delft, The Netherlands, 13–17 June 2005. [Google Scholar]
- Batty, M. A New Theory of Space Syntax, CASA Working Papers Series, 75. 2004. Available online: https://discovery.ucl.ac.uk/id/eprint/211/ (accessed on 18 March 2021).
- Jenks, M.; Burton, E.; Williams, K. The Compact City. A Sustainable Urban Form? E. & F.N. Spon: New York, NY, USA, 1996. [Google Scholar]
- Czerkauer-Yamu, C. Strategic Planning for the Development of Sustainable Metropolitan Areas using a Multiscale Decision Support System. The Vienna Case. Ph.D. Thesis, Université de Besançon/Université de Franche-Comté, Besançon, France, 2012. [Google Scholar]
- van Nes, A. The Configurable Urban Sustainability. In what ways a morphological or configurational approach contributes to our understanding of urban sustainability? In Proceedings of the Open Building Conference, Hong Kong University, Hong Kong, China, 13–17 October 2003. [Google Scholar]
- Newman, P.; Kenworthy, J. Sustainability and Cities. Overcoming Automobile Dependence; Islan Press: Washington, DC, USA, 1999. [Google Scholar]
- The Brundland Commission. Our Common Future. World Commission of Environment and Development. 1987. Available online: http://www.un-documents.net/wced-ocf.htm (accessed on 15 January 2021).
- Rådberg, J. Towards a theory of sustainability and urban quality; A new method for typological urban classification. In Proceedings of the 14th Conference of the International Association for People-Environment Studies, Stockholm, Sweden, 30 July–3 August 1996; pp. 384–392. [Google Scholar]
- Næss, P. Urban Structure Matters; Routledge: London, UK, 2006. [Google Scholar]
- de Koning, R.E.; Tan, W.; van Nes, A. Assessing spatial configurations and transport energy usage for planning sustainable communities. Sustainability 2020, 12, 8146. [Google Scholar] [CrossRef]
- Seamon, D. In Memoriam: Bill Hiller (1937–2019). Environ. Archit. Phenomenol. 2020, 31, 6–7. [Google Scholar] [CrossRef]
Figure 1.
Bill Hillier giving a speech at the 40th anniversary of the Advanced Architectural Studies (AAS) Master’s program at University College London in September 2013.
Figure 1.
Bill Hillier giving a speech at the 40th anniversary of the Advanced Architectural Studies (AAS) Master’s program at University College London in September 2013.

Figure 2.
The elementary spatial units that are used in space syntax.

Figure 3.
Three different types of maps that are used in space syntax analysis.

Figure 4.
An axial map (b) and a global axial integration analysis (c) of a settlement (a) and the justified graph (d), with the root node A representing the main street.
Figure 4.
An axial map (b) and a global axial integration analysis (c) of a settlement (a) and the justified graph (d), with the root node A representing the main street.

Figure 5.
(a) A topologically shallow j-graph of the main street and (b) a topologically deep j-graph of the back street; (c) explanation of how to compute ‘global’ axial integration for the shallow j-graph.
Figure 5.
(a) A topologically shallow j-graph of the main street and (b) a topologically deep j-graph of the back street; (c) explanation of how to compute ‘global’ axial integration for the shallow j-graph.

Figure 6.
(a) The axial map of Rotterdam and the (b) connectivity, (c) global, and (d) local axial integration analyses.
Figure 6.
(a) The axial map of Rotterdam and the (b) connectivity, (c) global, and (d) local axial integration analyses.

Figure 7.
(a) Location of Lijnbaan shopping street in Rotterdam and (b) the two-step analysis of idem.
Figure 7.
(a) Location of Lijnbaan shopping street in Rotterdam and (b) the two-step analysis of idem.

Figure 8.
A scatter plot of the intelligibility of Rotterdam, showing the correlation between local and global axial integration of Rotterdam.
Figure 8.
A scatter plot of the intelligibility of Rotterdam, showing the correlation between local and global axial integration of Rotterdam.

Figure 9.
The basic principles for normalized angular integration (NAIN) and normalized angular choice (NACH), [9].
Figure 9.
The basic principles for normalized angular integration (NAIN) and normalized angular choice (NACH), [9].

Figure 10.
Citywide and local NAIN (a,b) and NACH (c,d) analyses for Rotterdam.

Figure 11.
Analyses of De Doelen and the Schouwburgplein in Rotterdam using (a) a visual graph analysis (VGA), (b) a through-vision analysis, (c) an all-lines analysis, (d) an agent-based model (ABM), and (d1) an agent-based model where the agents are released from a specific location.
Figure 11.
Analyses of De Doelen and the Schouwburgplein in Rotterdam using (a) a visual graph analysis (VGA), (b) a through-vision analysis, (c) an all-lines analysis, (d) an agent-based model (ABM), and (d1) an agent-based model where the agents are released from a specific location.

Figure 12.
Option testing for a new bridge across the Nieuwe Maas River in the city of Rotterdam.

Figure 13.
Visual graph analysis for two different locations (a,b) of a memorial wall in De Doelen and the Shouwburgplein.
Figure 13.
Visual graph analysis for two different locations (a,b) of a memorial wall in De Doelen and the Shouwburgplein.

Publisher’s Note: MDPI stays neutral with regard to jurisdictional claims in published maps and institutional affiliations. |
© 2021 by the authors. Licensee MDPI, Basel, Switzerland. This article is an open access article distributed under the terms and conditions of the Creative Commons Attribution (CC BY) license (http://creativecommons.org/licenses/by/4.0/).
Share and Cite
MDPI and ACS Style
Yamu, C.; van Nes, A.; Garau, C. Bill Hillier’s Legacy: Space Syntax—A Synopsis of Basic Concepts, Measures, and Empirical Application. Sustainability 2021, 13, 3394. https://0-doi-org.brum.beds.ac.uk/10.3390/su13063394
AMA Style
Yamu C, van Nes A, Garau C. Bill Hillier’s Legacy: Space Syntax—A Synopsis of Basic Concepts, Measures, and Empirical Application. Sustainability. 2021; 13(6):3394. https://0-doi-org.brum.beds.ac.uk/10.3390/su13063394
Chicago/Turabian StyleYamu, Claudia, Akkelies van Nes, and Chiara Garau. 2021. "Bill Hillier’s Legacy: Space Syntax—A Synopsis of Basic Concepts, Measures, and Empirical Application" Sustainability 13, no. 6: 3394. https://0-doi-org.brum.beds.ac.uk/10.3390/su13063394
Note that from the first issue of 2016, this journal uses article numbers instead of page numbers. See further details here.