
Digital Divide in Advanced Smart City Innovations

1
Graduate School of Public Administration, Seoul National University, Seoul 08826, Korea
2
College of Staten Island, City University of New York, New York, NY 10314, USA
*
Author to whom correspondence should be addressed.
Sustainability 2021, 13(7), 4076; https://0-doi-org.brum.beds.ac.uk/10.3390/su13074076
Submission received: 1 March 2021
/
Revised: 21 March 2021
/
Accepted: 24 March 2021
/
Published: 6 April 2021
(This article belongs to the Special Issue Building Smart and Sustainable Cities: Emerging Technologies and Innovation for Digital-Era Governance and Long-Term Impacts)
Abstract
:A smart city aims to become a citizen-centered city where citizens actively engage in urban operation and share urban data within a high-tech ICT infrastructure. It premises ‘smart citizens’ who can understand and utilize digital technology to adapt well to the various infrastructure of smart cities. In reality, however, not only tech-savvy citizens but those who are not likely to coexist in a smart city. Disadvantaged groups with relatively insufficient awareness and the necessity of technologies might be excluded from smart cities’ various benefits. The smart city innovations need to encompass diverse social groups’ engagements to claim their legitimacy and sustainability from a long-term perspective. In this light, this study examines the potential digital divide in the advanced technologies used in the emerging 5G smart city era. Using survey data, we investigate if the smart citizens’ social and technical readiness in terms of the use experience and necessity of new technologies can predict the adoption and use of the emerging 5G smart city innovations. The empirical results from this study can inform the digital divide between the general public and technology-disadvantaged groups. The findings can also guide policymakers in prioritizing technologies that are accessible and beneficial to all potential residents of smart cities in the future. Finally, the results yield specific policy implications for practitioners who design more inclusive and sustainable smart cities in the 5G era.
1. Introduction
With the rapid growth in urban populations, national and local governments face various urban problems such as pollution, energy consumptions, traffic congestions, and public safety. Thus, the public sector has been paying attention to smart cities as an effective and sustainable approach to addressing urban challenges’ broad scope [1]. A smart city, conceptualized in diverse ways in the literature, can be generally understood as an innovative city that uses advanced technologies to improve the city’s services and operations, thereby, enhancing the quality of citizens’ lives [2]. Smart city infrastructure utilizes cutting-edge ICTs and seeks a citizen-centered city that necessitates collaborative governance-urban managers to engage citizens. Citizens have to engage in their governance for the truly thriving smart city [3]. Citizens act as actual customers of smart city services and co-producers to engage in urban issues by voting and producing, delivering, and monitoring [3,4,5]. Citizens are also regarded as a fundamental dimension of smart cities [6].
However, in smart cities where the city’s infrastructure and services depend on advanced technology with intense connectivity, will all residents become active citizens of the smart city? This question converges to the digital divide issue that has emerged alongside the notion of a digital society [7,8,9]. Citizen-centered smart city assumes proactive citizens with a high understanding of technology [10,11]. However, it is a fairly optimistic view that only tech-savvy citizens live in smart cities. Disadvantaged groups, with relatively insufficient awareness and experience with new technologies, might easily be excluded from the benefits and opportunities a smart city can bring [12].
Smart cities in the 5G network era rely on advanced technologies such as self-driving cars, smart buildings (equipped with numerous IoTs), AI tools, and mixed reality. Such technologies can provide citizens with automated decision-making services and deep experience-based interactive services [2]. These technologies generally deliver services through an interaction between the user and device rather than merely one-way delivery to the user [13]. Accordingly, smart city residents need a certain level of proficiency and basic knowledge of new technologies to use smart services properly. However, residents who are relatively vulnerable to new technologies naturally face the risk of being unable to use and engage in smart cities’ urban services. Suppose the smart city could not encompass the engagement of diverse social groups in using advanced innovations. In that case, it might widen the digital divide and fail to build a sustainable city from a long-term perspective. Thus, the smart city’s digital divide issue can be quite a conundrum to policy makers [14]. Although the smart project has been promoted with a huge budget, if it is unable to ensure the widespread use and engagement of urban services by its major users and to reflect the diverse demand from the citizens, the city policy will fail. Nam [15] asserted that many smart city projects concluded as unsuccessful failure cases in which the project’s effectiveness is somewhat reduced when the participation of various citizens does not support it. To be a sustainable and socially inclusive smart city, the digital divide issue needs to be considered, and its solution must be prepared in advance. To derive policy alternatives for the potential digital divide in a smart city, this study establishes the following research question (RQ).
RQ:What factors cause the digital divide in the 5G smart city?
This study examines the potential factors of the digital divide in the 5G smart city era. Using the survey data on the digital divide conducted by the South Korean government, our study examines citizens’ use experience with seven new technologies expected to be utilized in smart cities in the future: AI speaker, mixed reality, self-driving car, blockchain, smart home, drone, and biometrics. Furthermore, we explore the influencing factors of the digital divide discussed in the literature to examine the possibility of reappearance of the new digital divide in the smart city and simultaneously discuss how to accomplish the inclusive and sustainable smart city.
Our findings contribute to both theory and practice. In terms of theory, this study examines whether the antecedents of the digital divide, which have been discussed on the existing technologies, still affect the new technologies, thereby, deepening the understanding of the digital divide’s influencing factors. Concerning practice, the results of this research can be baseline data on the actual use of future smart city infrastructure and services of citizens. Our study’s empirical results predict the level of future use of new technologies that will be applied in a smart city, thereby, providing a clue for smart city policymakers to prioritize the introduction and application of new technologies. The influencing factors can help smart city practitioners identify policy alternatives that can proactively mitigate and prevent the digital divide in a future smart city. In summary, the specific objectives of our study are to:
- Discuss the digital divide issues as a risk of a sustainable smart city
- Explore the factors affecting the digital divide in a smart city in terms of 5G-based new technologies
- Suggest policy implications to become an inclusive and sustainable smart city using empirical results
The remainder of this article proceeds as follows. First, we review the literature on theories and antecedents of the digital divide and previous discussions on smart cities. We then develop research hypotheses to explore factors on the digital divide in a smart city. Next, we explain our study’s methodology, data, measurements, and analysis methods. We demonstrate the results of logistic regression and discuss the implications of the results. Finally, we present the conclusion.
2. Related Work on Smart Cities and Digital Divide
2.1. The Digital Divide
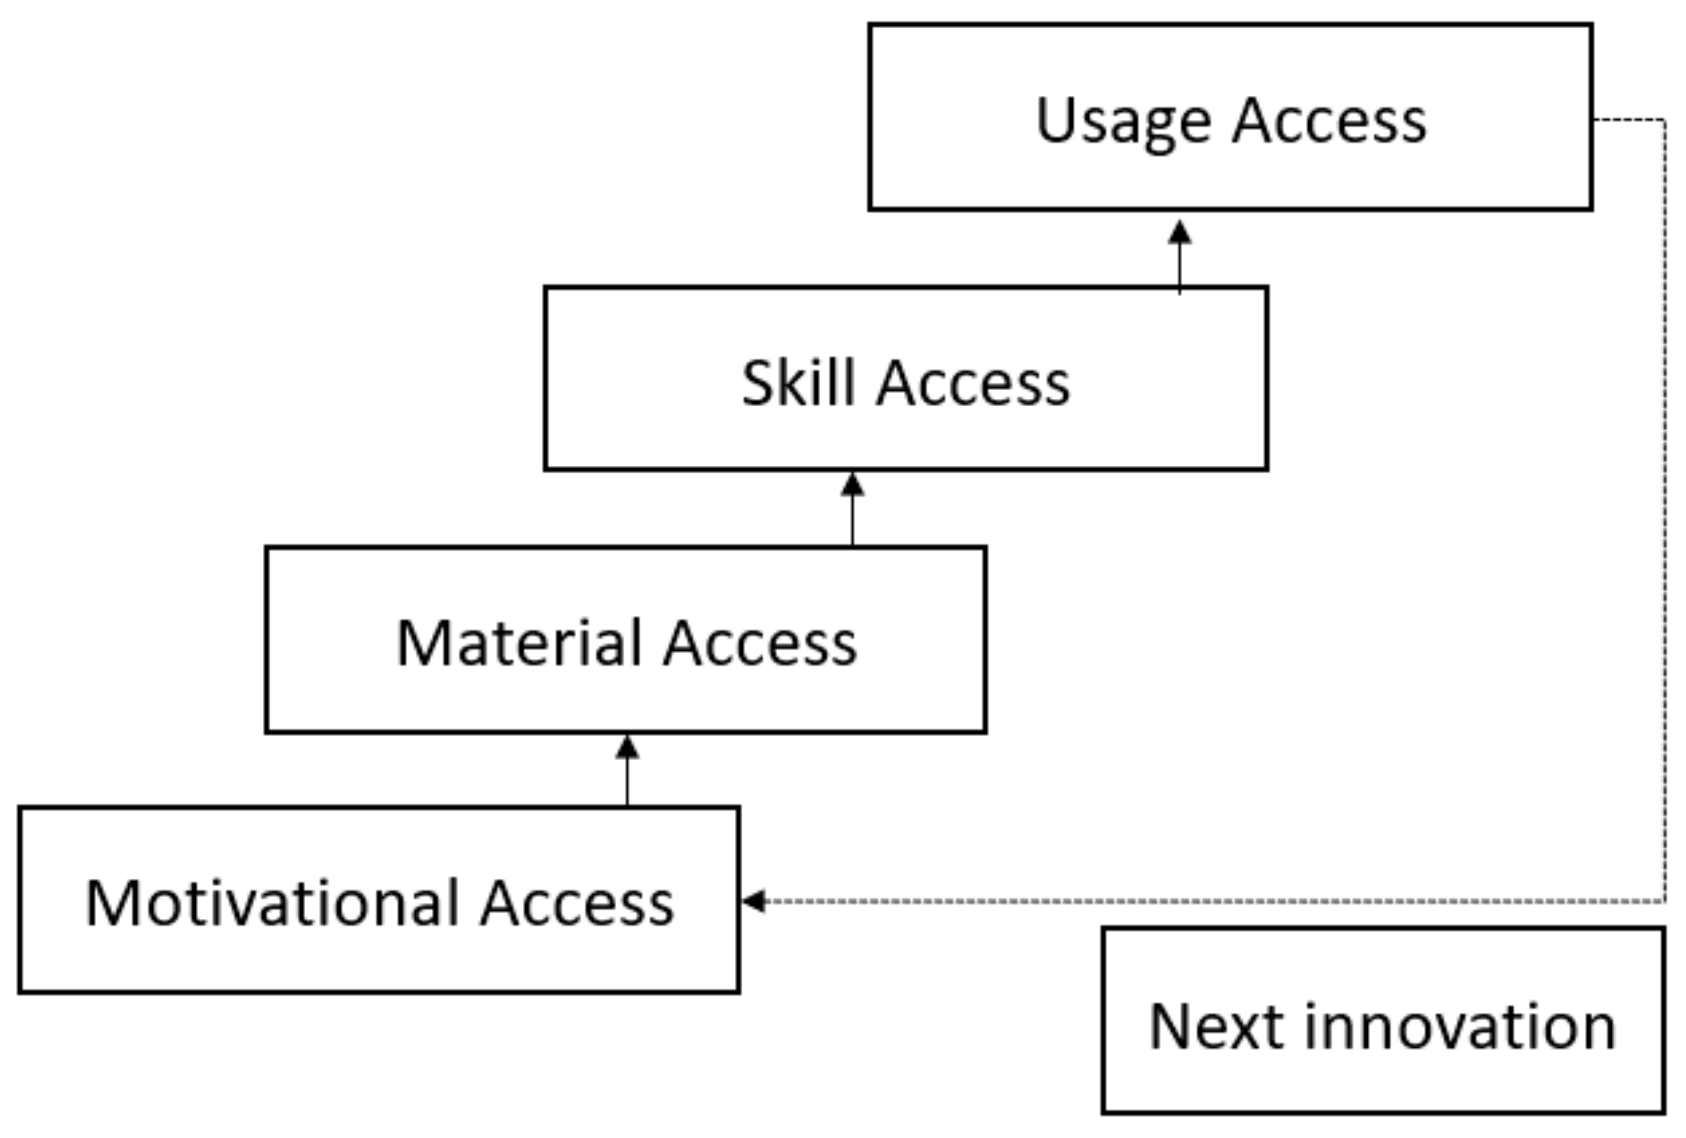
The concept of the digital divide continues to gain attention in the information society since it had introduced from the report of NTIA—“Falling Through the Net.” The report defined the digital divide as the gap between people who did or did not have access to the new technologies [16]. The initial approaches to conceptualizing the digital divide were dichotomously understood based on physical accessibility. However, subsequent studies have divided it into lower dimensions and viewed it with a hierarchical approach. For example, Hargittai [17] argued that the digital divide needs to be understood with an Internet access aspect and skills aspect. The former was named the first-level divide. The latter was named the second-level divide, indicating the difference between groups of individuals regarding the skills necessary to use the Internet [17,18]. Van Dijk [19] also developed the successive model by the types of access to digital technologies (See Figure 1). In the model, motivation access precedes material access, which is followed by skill access and usage access. Motivational access refers to motivation to use digital technology and material access. Skill access includes digital skills to operate and get information as well as use digital technology more strategically. Usage access refers to the diversity of application of technology and usage time [19]. This model is somewhat idealistic because, after a series of processes, the usage access phase creates another innovation, and it retakes this subsequent process [20].
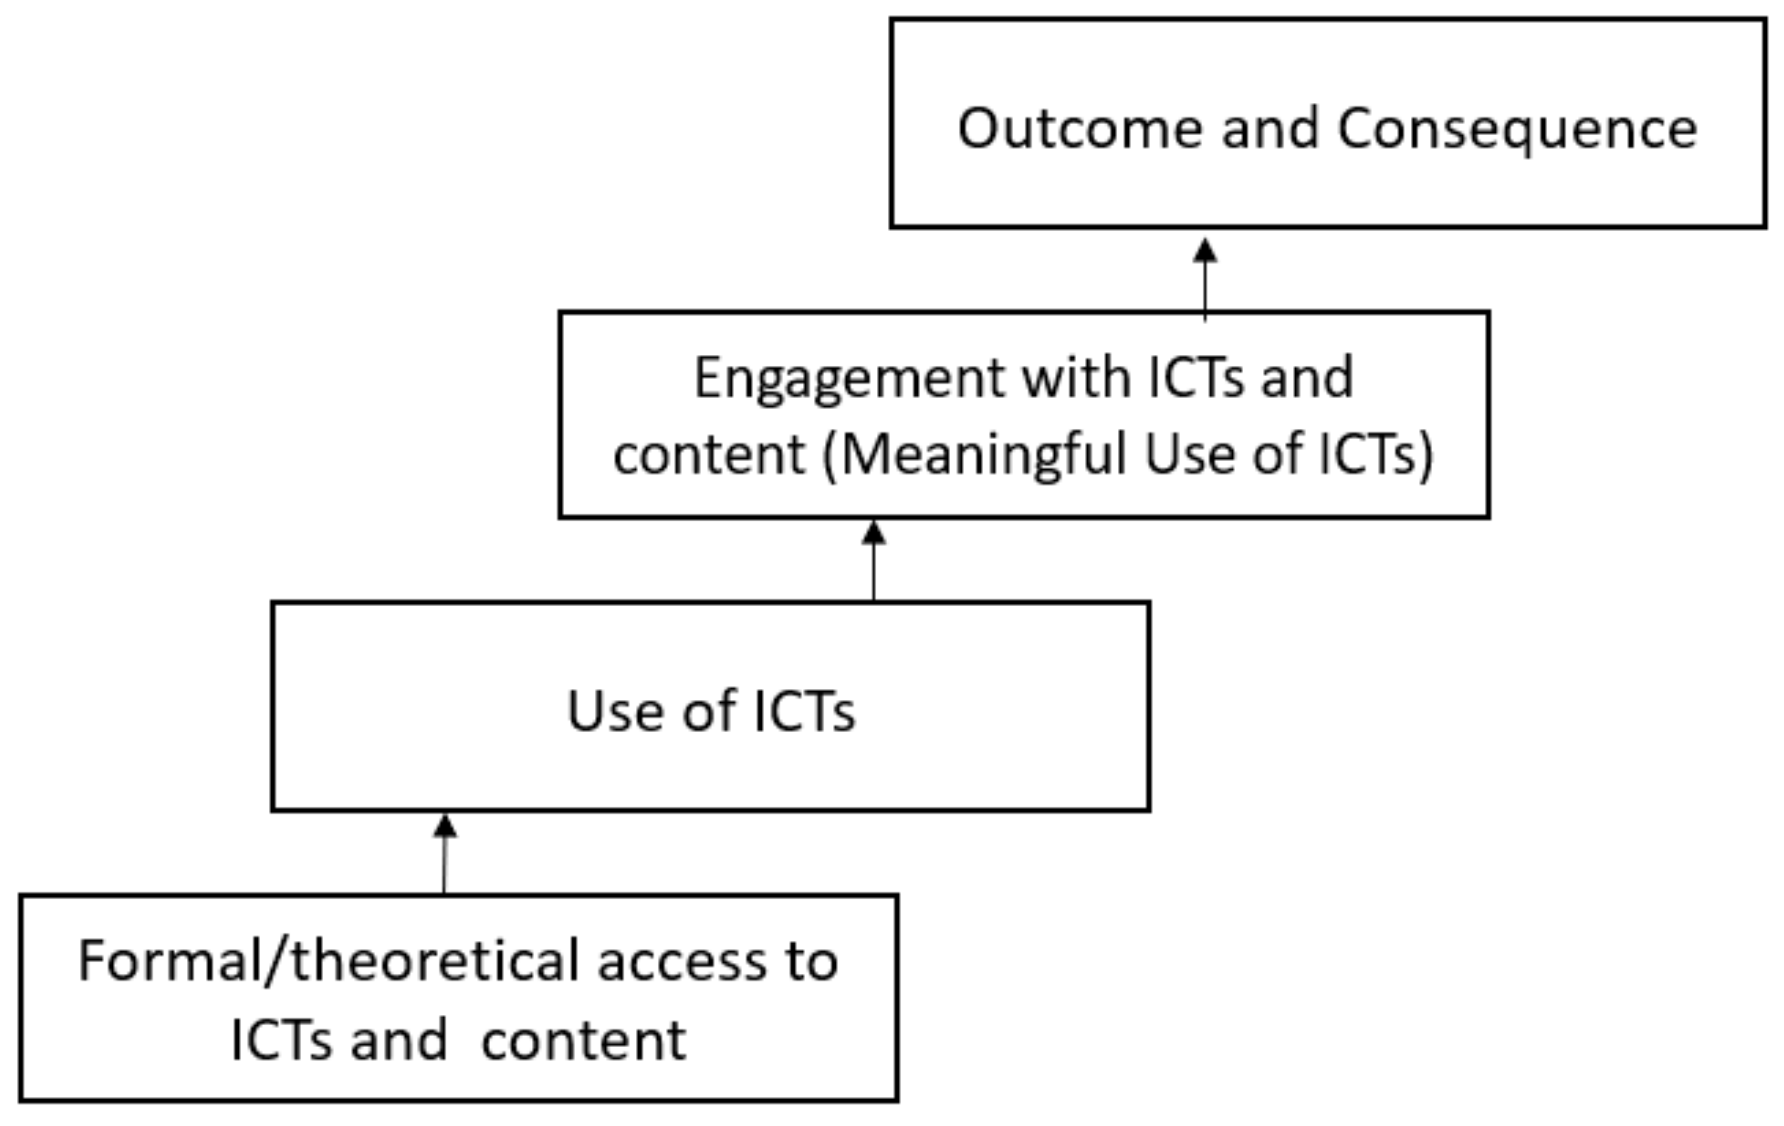
Selwyn [12] developed the digital divide stages, emphasizing the outcome of meaningful use of ICTs (See Figure 2). Concerning the model, the first stage is formal and theoretical access to ICTs and content, which is the same concept of physical (material) access. The second stage is effective access to ICTs and content, which refers to the primary and ordinary use of ICTs. The stage of engagement with ICTs is followed by the third stage, which indicates meaningful use of ICTs. If an individual exercises a degree of control and choice over technology and content, the individual can move to the last stage in which the individual can get a short-term and long-term outcome, including the production, political, and social activities. Specifically, Selwyn [12] focused on the engagement of ICTs (meaningful use of ICTs) in that it directly affects the actual and perceived outcome of users. Influenced by Selwyn [12], subsequent researches [21,22] understood the digital divide with the dimensions of physical access, quantitative use, and engagement. They have noted that the digital divide eventually results in substantial and actual differences in diverse aspects of individual life.
The digital divide has been studied as the gaps in physical access (devices or networks) and qualitative usage aspects of technology that create a social inequality phenomenon. It eventually brings about various and significant differences in the individual’s daily lives. In this article, we focus on the digital divide as a gap in user engagement with technologies [12], which is similar to the usage aspect of new technologies [19], rather than a mere technology access issue.
2.2. The Concept and Dimension of Smart Cities
With digital technologies, city and urban planners face exciting opportunities to provide an informative and engaging platform to enhance citizen’s lives and well-being via the concept of a smart city. There are numerous definitions of smart city in the literature, the current research of Colding et al. [23] defines smart city as a city where ICT is merged with the urban infrastructure, coordinated and integrated using new technologies. However, the concept of a smart city is flexible and depends on the purpose of the smart city projects and research studies or what each city seeks to emphasize [24]. For example, Giffinger et al. [25] defined it as “connecting the physical infrastructure, the IT infrastructure, the social infrastructure, and the business infrastructure to leverage the collective intelligence of the city.” Washburn et al. [26] elaborate that “the use of smart technologies to make the critical infrastructure components and services of a city, which include city administration, education, healthcare, public safety, real estate, transportation, and utilities, more intelligent, interconnected, and efficient”. These working definitions are viewed similarly to the existing concept of ‘digital city’ and ‘intelligent city’ [27]. Although the main focus is still on the role of ICT infrastructure, considerable research has emphasized human capital and social capital, and environmental interests as essential factors of urban growth in defining smart cities [27,28,29]. Given all these discussions on smart city definitions, this study defines a smart city as “a city where the urban infrastructures are highly connected to each other through advanced digital technologies and networks, thereby, providing various citizen-centered services.” This definition focuses on the hyper-connectivity of smart cities. In addition, it reflects the original and ultimate goal of smart cities: improving the quality of life of citizens.
Many studies have focused on identifying the components of a smart city [24,30,31]. According to Nam and Pardo [31], a smart city includes fundamental technological, human, and institutional factors. Technology factors indicate the infrastructure with smart, mobile, virtual technologies and digital networks. Human factors include human and social capital and education. Lastly, institutional factors refer to the support of government and policy for governance aspects. In a similar vein, Dameri [30] also suggested the four smart city components: the land, technologies, citizens, and governments. This classification is very close to Nam and Pardo [31], but it adds the land, which is a spatial component smart city.
Chourabi et al. [24] understood it with more granularity, including eight components: management and organization, technology, governance, policy, people and communities, the economy, built infrastructure, and the natural environment. Silva et al. [32] considered institutional, physical, social, and economic infrastructure as the four pillars of a smart city. These various perspectives try to capture the components of a smart city, including the technology, citizens, and institutional contexts and are considered backbones that form a smart city. However, these studies do not specify how these components need to work together for building the smart city platforms. Chun et al. [28] approach the smart city as a design problem of a complex platform system that includes multiple layers of decisions and risks to consider by different stakeholders, proposing a framework of design composition models.
3. Digital Divide in an Experience-Based Smart City
A smart city makes possible a wide array of urban services, from environmental monitoring to traffic control [14]. These services build upon a significant volume of data generated by many sensors. In addition, numerous sensors in the city can be adequately controlled when connected to sensors or device aggregators, which are further connected to wireline or wireless communication networking devices for controllers [2]. Mckinsey [33] viewed the high connectivity among physical infrastructure as the prerequisite for a smart city. The city would connect many IoT applications for remote computing, virtual reality, e-health services, self-driving cars, etc. In particular, the 5G wireless network technology opens the possibility of connecting billions of devices, machines, and people without suffering from performance, speeds, data capacity, and latency. As the distinction between 5G and existing communication technologies, Xiang et al. [34] presented four points: enhanced mobile broadband, massive machine-type communication, low latency, and ultra-reliable communications. 5G network-based intelligent smart cities implement advanced innovations, such as artificial intelligence-driven machines/devices, self-driving cars, drones, and surreal contents (VR, AR) for various domains of intelligent urban services like smart mobility, smart security, smart building, and smart education [35].
The innovations based on 5G and future wireless technologies push the new smart cities from information-driven society to more engagement-driven smart cities. Intelligent AI systems can predict or understand the user’s intent, needs, or emotions depending on the situation and automate various settings and tasks, not just the information needs. A deeper understanding of users implies deeper engagement in user’s daily routines and desires or preferences. VR/AR engages users in actions and experiences that may profoundly affect their emotional status, and drones or self-driving cars not only surveil the situations with sensors to alert but also take necessary actions. The textual information-oriented smart cities can change to audio/visual interactions in the future smart cities with 5G technology. As active DIY actors, citizens can design and provide new personalized services based on their in-depth experience and knowledge of 5G-based technologies. With this understanding, we compare the features of services provided by current smart cities and those of future smart cities based on the 5G network (See Table 1).
Although technology is the primary driver of a smart city [36], a smart city may not succeed or sustain without real engagement and willingness to collaborate between public/private organizations and citizens [31,37]. It is noted that the citizens are essential components that should not be overlooked [15]. Citizens play a crucial role as actual customers of smart city services and become co-producers to engage in urban issues by voting and producing, delivering, and monitoring [3,4]. Collective intelligence and social learning make a local community more attractive and sustainable [38]. “Smart citizens” are considered a significant pillar in smart cities and are demonstrated as “smart, engaged, and illuminated through mastering the technologies that help them express themselves, connect to others, share their resources and thoughts so they can decide the best course of actions” [10].
Unfortunately, it is improbable that all smart city residents are the smart citizens with a high level of understanding and proficiency of technologies. This risk can be considered the potential digital divide in smart cities. The possibility for this hazard was first mentioned in Odendaal [39]. It discussed smart cities as an example of ICTs incorporated into local governance, and ICTs are expected to facilitate inclusive governance. Odendaal [39] argued that if the city fails to encompass the technology-disadvantaged groups in governance because of the digital divide, it needs to address the government [39] directly. Chourabi et al. [24] also noted that smart cities’ technology contexts could also deepen inequalities and increase the digital divide.
In a smart city, an ICT infrastructure is a prerequisite [33], so the physical access dimension matters less. Access to urban infrastructure and services is indiscriminately provided to the citizens in general. However, differences in the ability to utilize advanced innovation services may divide citizens into one who can engage and experience the advanced technology services and the other groups that may not experience them. Demographic and sociological digital divide factors, such as age, education level, income, and regions, can result in different experiences and use of existing technologies like the Internet and mobile technologies [18,40,41,42], and may play a continued role as essential factors in the digital divide. Additionally, with the 5G-based smart city innovations, the digital divide has different dimensions to consider, like experience or engagement. These innovations demand the citizen not just interface but actually experience and play an active role in the experience.
4. Determinants of a Digital Divide in a Future Smart City
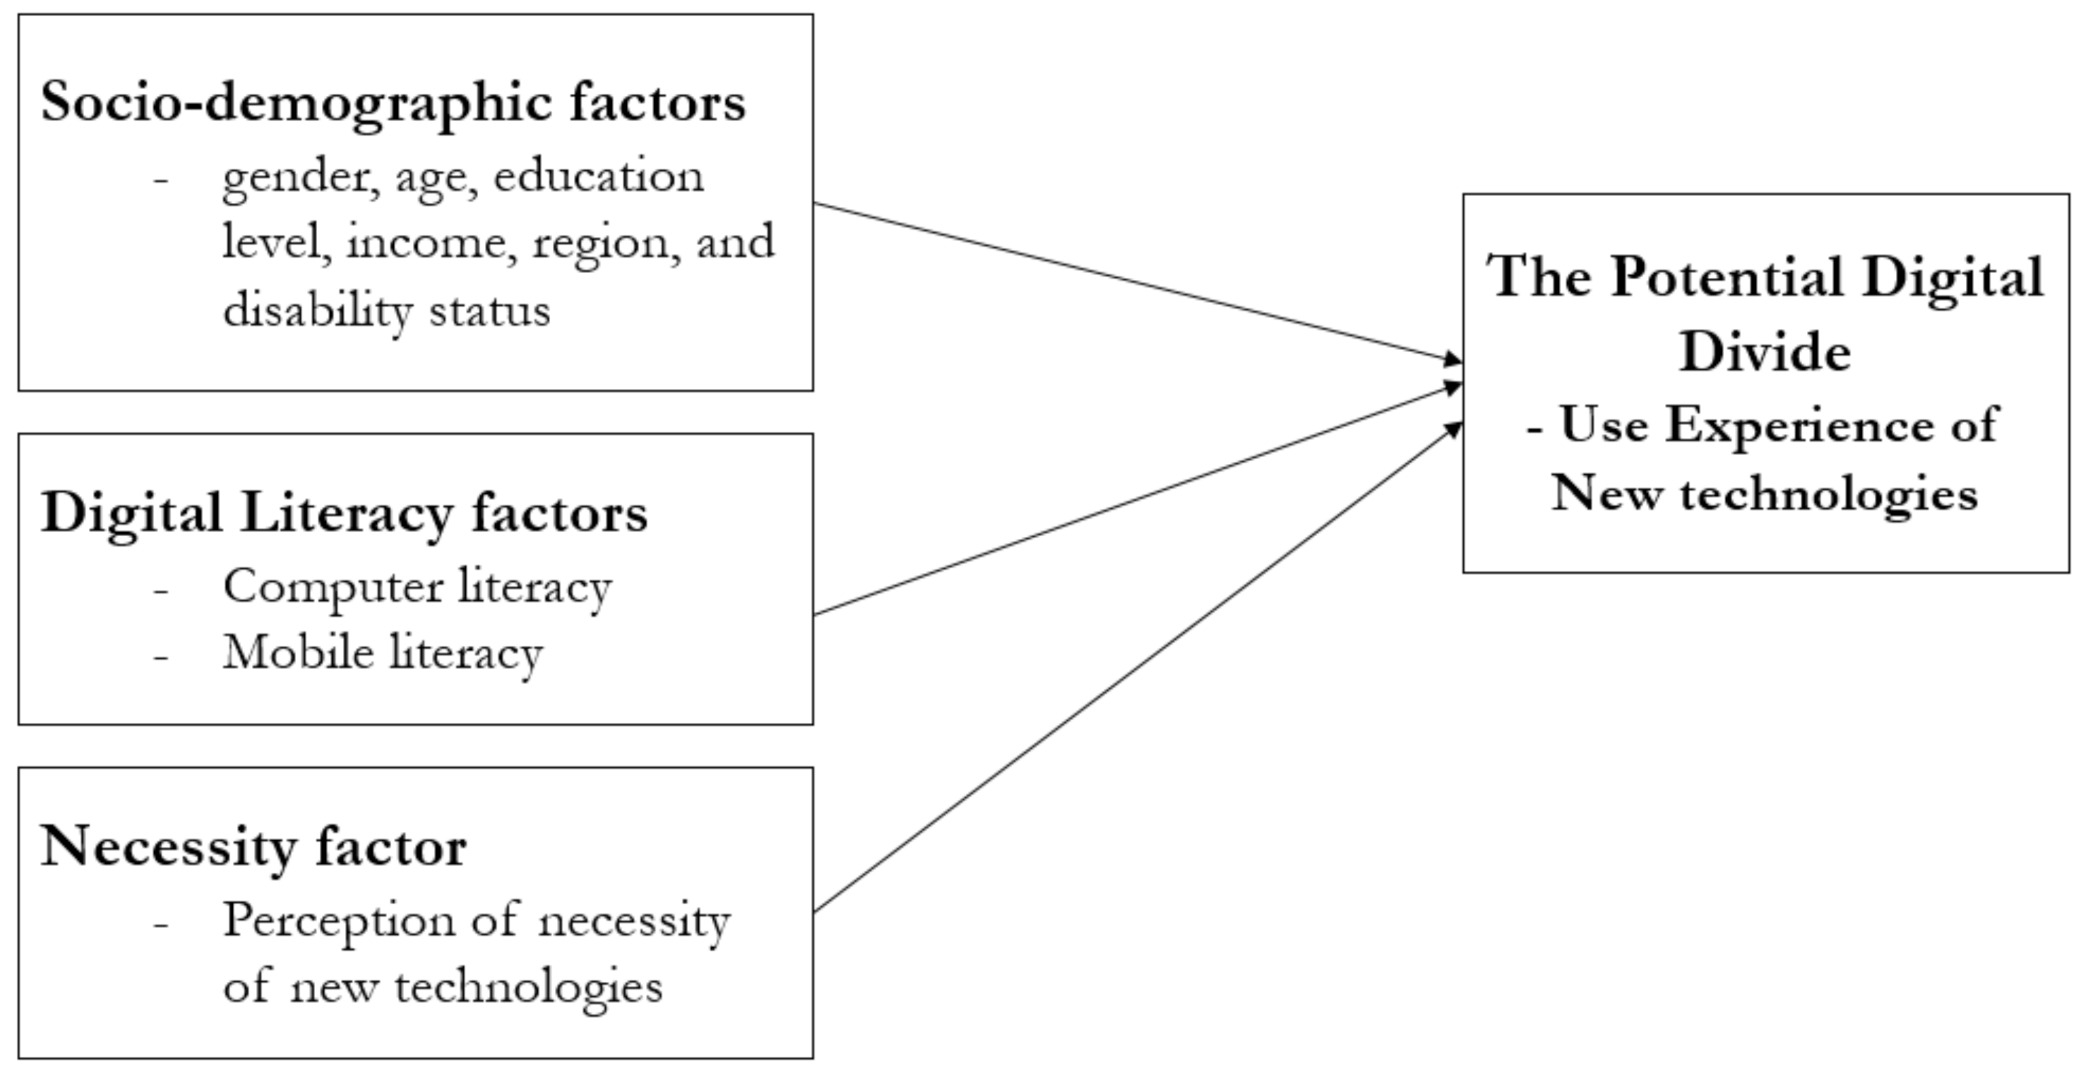
This study assumes that the factors known to affect the digital divide on existing technologies have a continuous influence on the future smart city’s digital divide. Accordingly, this study explores the influence of socio-demographic factors, digital literacy factors, and the necessity factor of the individual.
4.1. Socio-Demographic Factors
The most frequently discussed factors on the digital divide include gender, age, socio-economic status, and geography [18,22,43,44,45,46,47]. These factors are cited as significant factors based on the perspective that the digital divide is a subsequent and complex social disparity phenomenon [22]. Gender, which is a demographic factor, was once considered a digital divide determinant [48,49,50,51]. According to quite a few past studies, females had more negative attitudes toward ICT use than males [52,53,54]. According to Bannert and Arbinger [52], females are less exposed to computer use and have fewer computer-related motives than males. Broos [53] also identified the gender difference regarding the attitudes to the new ICTs, the extent of computer use, and computer experience. Males generally had more positive attitudes to the technologies and tended to have more computer experience. However, relatively recent research discussed that the gender difference in the digital divide has considerably decreased over the last decade and is very small [43,55,56]. In this study, we examine whether the influence of gender, which had been considered a significant factor resulting in the digital divide but has recently been reduced, affects the experience of using new technologies expected to apply to smart cities.
Contrary to gender, age is still being discussed as an influential explanatory factor for the digital divide [57,58,59,60]. Jones and Fox [61] elaborated that Internet use tends to be inversely proportional to age. There is a gap between younger generations and the other generations in terms of information production activity. Moreover, Hwang et al. [62] argued that age is considered an essential factor regarding the digital divide despite the emergence of new technologies. Simultaneously, the gap caused by gender and an income group is reduced as the information saturation period approaches [62]. Due to the consistent and significant impact of age on the digital divide, this phenomenon is called the “grey digital divide” [59]. Furthermore, the age effect has been discussed that there is an impact not only on computer-based technologies but on mobile technologies [60,63].
Education and income, which are positively correlated with education, are also considered influential factors in the digital divide. Van Dijk and Hacker [64] used Dutch and US data to analyze income and education levels as essential factors leading to the digital divide through empirical analysis and have drawn similar conclusions in many studies [65,66]. Some argue that computers and the Internet, in particular, are not of much interest to low-income and educational standards [67,68]. However, there has also been a recent debate that the impact of education or income levels has decreased relatively due to the high Internet penetration rate and the decrease in smartphone prices [51,69].
The region is often regarded as an influential factor in the digital divide [70,71,72,73]. Studies on the digital divide between urban and rural areas are especially notable. Rural areas have lower broadband availability [74], and individuals living in the area are relatively lower in wages and education than individuals living in the city [75,76]. Moreover, the aging population in rural areas is rapidly increasing [77]. As discussed above, age, education, and income are major influencing factors in the digital divide phenomenon. In these rural areas, the average number of individuals with these characteristics is likely to be lower in ICT use than in cities.
Lastly, disability status is also a factor that can affect the use of new technologies. Despite the potential for enhancing opportunities for people with disabilities being promising, there has been little evidence that people with disabilities are engaging in new technologies [78]. The various socio-economic constraints under which individuals with impairments typically live pose a considerable barrier to access and use. The primary user interface and usage method of ICT are not that friendly to individuals with physical and intellectual disabilities [79]. Hence, the disability status is expected to impact individuals’ experience with new technologies significantly.
Summing up the discussion above, we could establish the following hypotheses:
Hypothesis 1.
Citizens who are male are more likely to use the new technologies.
Hypothesis 1a.
Younger citizens are more likely to use the new technologies.
Hypothesis 1b.
Citizens with a higher education level are more likely to use the new technologies.
Hypothesis 1c.
Citizens with a higher income level are more likely to use the new technologies.
Hypothesis 1d.
Citizens living in a city are more likely to use the new technologies.
Hypothesis 1e.
Citizens who do not have a disability are more likely to use the new technologies.
4.2. Digital Literacy Factors
Digital literacy can be defined as a “range of complex and densely interwoven communicative forms that are digitally mediated, as well as the mechanical and navigational competence that is a prerequisite to working on a screen” [80]. With the rapid development of digital technologies, individuals are required to use various technical, cognitive, and sociological skills to work and solve problems in a digital environment [81]. These are often referred to in the literature as “digital literacy,” regarded as survival skills in the digital society [81]. Digital literacy is often viewed as a digital divide itself and often understood as skill access in the literature. According to Hargittai [17], digital literacy emphasizes skills in using digital technologies, representing another dimension of the digital divide (second-level digital divide), which differs from the first-level digital divide initially defined with material access (Figure 3).
Van Dijk [19] developed the cumulative and successive digital divide model, and he showed skill access must be satisfied to go to usage access. It explained that skill access consists of operational, information, and strategic skill. Operational skill refers to the capacity to work with devices, and it is the most general type of skill in digital technology in the literature and public opinion [19]. When the operational skill is fulfilled, the information skills, which means the skills to search and process the information, and the strategic skills, which can be defined as the capacity to use digital technologies to accomplish one’s goal, could be obtained. Consequently, the usage access is obtained when skill access is ensured. In this light, this study assumes the digital literacy could directly influence the use of digital technologies and establishes the following hypothesis.
Hypothesis 2.
Citizens with higher digital literacy are more likely to use the new technologies.
Hypothesis 2a.
Citizens with higher computer literacy are more likely to use the new technologies.
Hypothesis 2b.
Citizens with higher mobile literacy are more likely to use the new technologies.
4.3. Necessity Factor
The perception of necessity can be understood as a favorable attitude toward the use of the technology. Attitude toward a particular behavior can be defined as an individual’s positive or negative evaluation of performing the behavior [82]. It refers to the judgment of individuals that specific behavior is good or bad and leads to the intention of the behavior [83]. An attitude influences an individual’s behaviors by filtering information and shaping their perception [84]. In this regard, a user who holds a favorable attitude toward the technology could adopt and continuously use the technology. The attitude toward technology use is presented in Davis’s original Technology Acceptance Model (TAM) [85]. According to Davis [85], the attitude toward technology determined by the perceived usefulness and ease of use affects the behavioral intention, and the behavior intention finally affects the actual use of technology. In this light, we can find a clue for the critical influence on technology’s actual use by the attitude. Thus, we assume that the perception of the need for new technology could be understood as a favorable attitude toward technology that could affect the use of new technology.
Hypothesis 3.
Citizens with a strong necessity for new technologies are more likely to use new technologies.
5. Methodology
5.1. Data
This study used survey data from “The Report on the Digital Divide, 2019,” published by the National Information Society Agency (NIA) of the South Korean government. NIA has conducted this survey since 2002 to investigate vulnerable social groups concerning digital technologies. The survey items for 2019 include information of respondents on awareness, use experience, the necessity of new technologies (AI speakers, mixed reality, self-driving car autonomous cars, blockchain, smart homes, drones, and biometric devices), the digital literacy level of both PC and mobile devices, and various socio-demographic indicators. The survey was administered from September to December 2019 among the general public, disabled, low-income people, rural residents, North Korean defectors, and Korea’s marriage immigrants [86]. This study used the general public’s data of which the sample size is 7000, and the sample was selected by the proportionate stratified sampling method [86]. The full sample size was 7000 people, but, after the data-cleaning process, we could finally use the sample of 6790 people. Descriptive statistics of the sample appear in Table 2.
5.2. Measures
We set the use experience with new technologies as our dependent variable. The new technologies indicate seven new technologies expected to be applied in smart cities in the future. They include AI speakers, mixed reality, smart homes, drones, blockchain, self-driving cars, and biometrics, which have been selected as intelligent technologies by NIA of South Korea since 2018. In addition, this study set new technologies as the proxy for the potential digital divide because we notice the usage aspect of technologies. The level of usage of technologies might be more adequate in light of our study’s purpose. The usage levels are at a relatively low level until; now, and the experience level itself is also not that high. Thus, we concluded the use experience with technologies that could be the proxy for the potential digital divide in smart cities. In this research, seven technologies’ experience status is coded as dichotomous variables, indicating “Have experience” or “No experience.”
Socio-demographic factors, the first explanatory variables of our study, include gender, age, education level, monthly income, residential area, and disability status. Gender is coded as a binary and dummy variable, indicating “Male” or “Female.” Age of respondents is measured as a continuous variable. Education level refers to the highest level of schooling and is measured with four categorical variables: “elementary school graduated,” “middle school graduated,” “high school graduated,” and “above college graduated.” Income refers to the average monthly income of respondents represented by Korean Won (the monetary unit of Korea) and is measured in continuous variables. Residential area is divided into two categories: city (Si) and rural (Gun) and coded as dummy variables for the analysis. Disability status is also coded as binary and dummy variables indicating “have disability” or “no disability.”
Digital literacy factors have two sub-variables: computer and mobile literacy. Computer literacy refers to operating basic computer functions: OS and utility programs, word processor, spreadsheet, computer game, multimedia program, presentation program, computer graphic program, and homepage editing program. Mobile literacy indicates the ability to operate a mobile device such as a smartphone and tablet PC and measures the capability levels of mobile applications of the display, alarm, wi-fi setting, photo, and app store. The questionnaire asked respondents, “How much of the following activities can you do yourself with the device (computer and mobile, respectively)?” The respondents self-evaluated their computer and mobile literacy with four levels. We used a computer literacy self-evaluation score for seven items answered by the respondents. Similarly, mobile literacy scores seven items as arithmetic averages, respectively.
The necessity factor refers to the degree to which an individual feels the technology is necessary. The necessity level is measured on a four-point scale for seven technologies (AI speakers, mixed reality, smart homes, drones, blockchain, self-driving car, and biometrics). This questionnaire was measured as an ordinal scale, but we utilize it by converting it to a ratio scale in this study. The detailed information appears in Table 3.
5.3. Analysis Method
The purpose of the study is to identify the potential digital divide in the smart city and its significant determinants. Experience with new technologies is our dependent variable. Our explanatory variables include socio-demographic factors (gender, age, education level, monthly income, residential area, and a disability), digital literacy factors (computer and mobile literacy), and technology necessity factor (perception of necessity on the seven new technologies). In other words, we estimate the probability of experiencing new technology by the three factors above. For the estimation, a binary logistic regression, which is a type of log-linear analysis used with a binary dependent variable [87,88], was performed because our dependent variable is measured as a binary variable whether an individual has experience with new technology or not. The following binomial logistic regression equation was derived by summing up the discussion on our research model.
Before the primary analysis, we provide descriptive statistics for continuous variables of our model. We present the correlation matrix made up with Pearson’s correlation coefficients of the variables to analyze the correlation among variables in advance of the logistic regression analysis.
6. Results
6.1. Descriptive Statistics
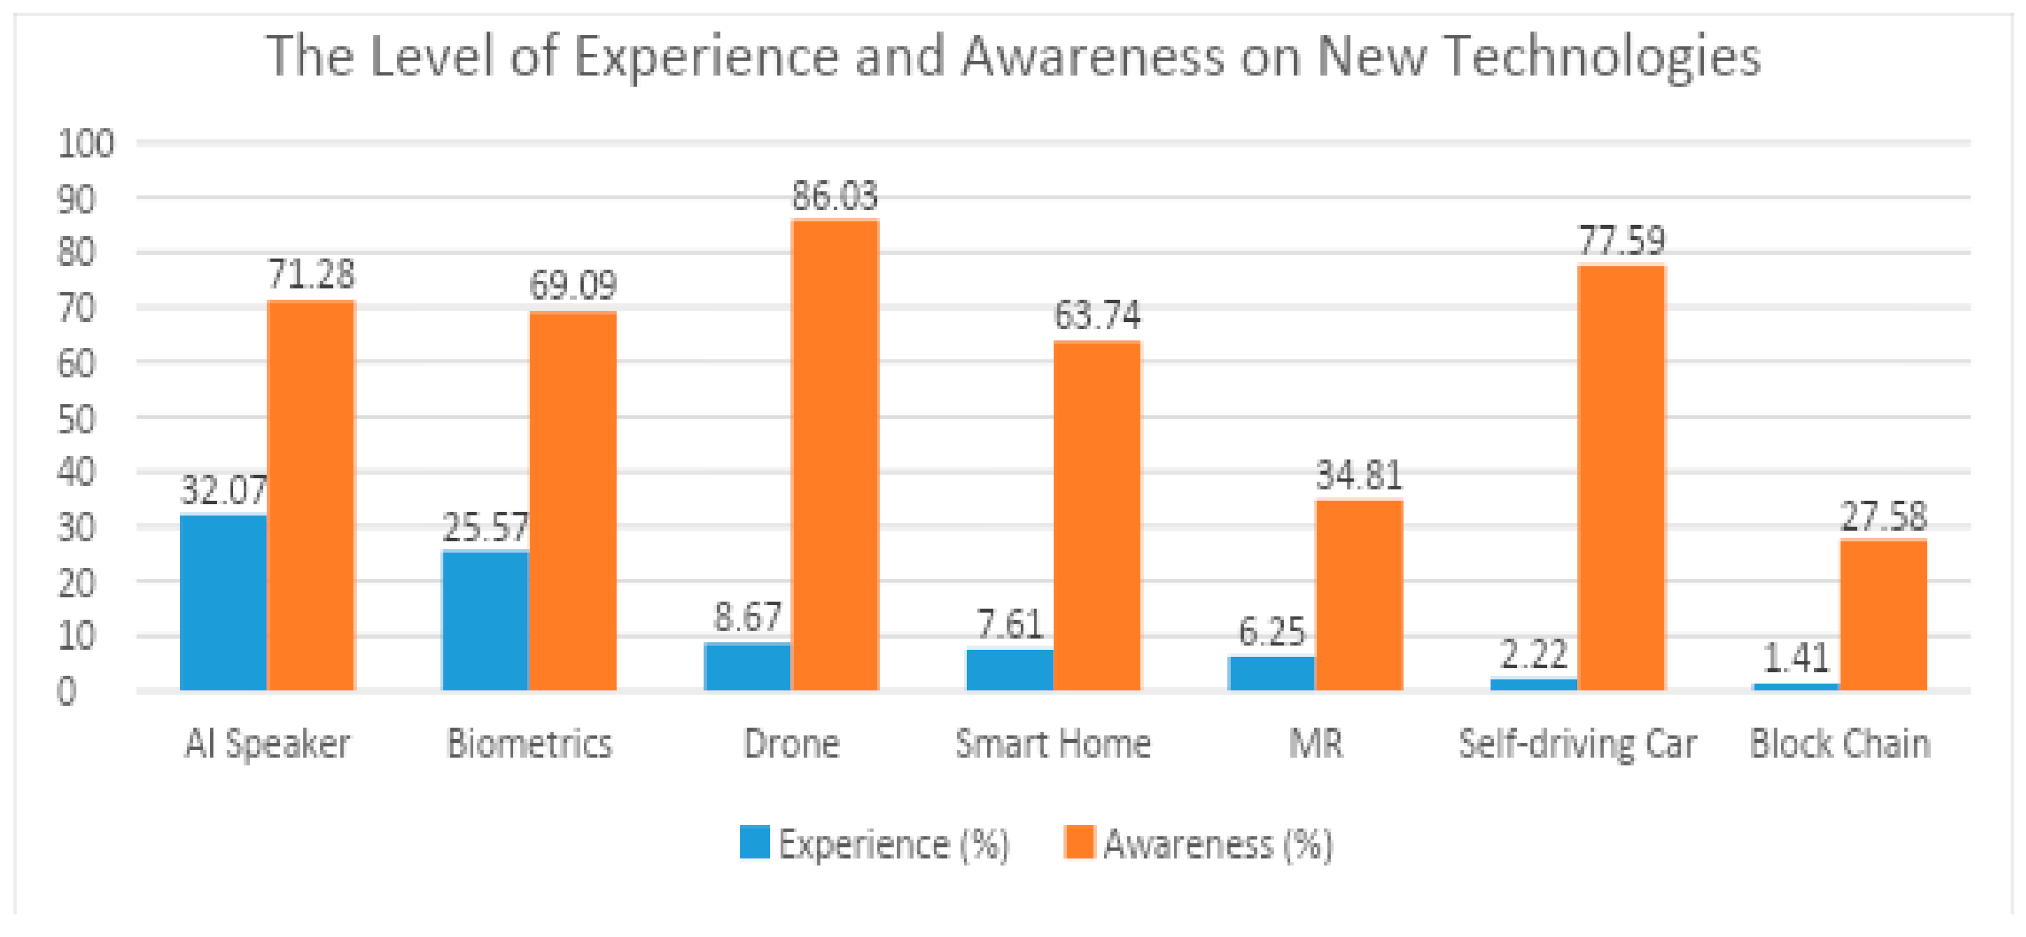
Descriptive statistics of the use experience with new technologies appear in Figure 4. Since the dependent variable in this study is a binary variable, it is more appropriate to describe the percentage of use experience for each technology than to derive the average value. We suggest the percentage of use experience with seven technologies. All seven technologies have relatively low levels of use. AI speakers ranked the highest among them with 32.07% of samples experiencing it, followed by biometrics, with 25.57% of the total samples experiencing it. Except for these two technologies, other values are extremely low at less than 10%. Approximately 8.67%, 7.61%, and 6.25% of the samples had experience using drones, smart homes, and mixed reality. Self-driving cars and blockchain had significantly lower experience rates with 2.22% and 1.41%, respectively.
In contrast to the low level of use experience, the technology awareness level is relatively high. Except for mixed-reality (34.81%) and blockchain (27.58%), more than half of the respondents have an awareness of the technologies. Drones (86.03%) and self-driving cars (77.59%) are well-known technologies, while the use experience level is relatively low. Conspicuously, blockchain technology has the lowest levels of both use experience (1.41%) and awareness (27.58%).
Table 4 shows descriptive statistics of independent variables. We have already presented the survey sample’s descriptive statistics in Table 1 in Section 5 concerning the socio-demographic factors. Digital literacy and necessity factors are included in Table 2. The mean value of mobile literacy (2.88) is slightly higher than that of computer literacy. Even if mobile devices became commercialized later than computers, mobile devices, such as smartphones, have recently become a daily necessity for most individuals. In South Korea, the smartphone penetration rate is close to 95%. For the necessity factor of each technology, drones (M = 2.838) have the highest value, followed by smart homes (M = 2.819), self-driving cars (M = 2.827), biometrics (M = 2.816), AI-speakers (M = 2.753), blockchain (M = 2.558), and mixed reality (M = 2.525). Similarly, the perceived level of necessity for blockchain and mixed reality is lower than for other technologies.
6.2. Correlation Analysis on Continuous Variables
Table 5 shows the correlation matrix on continuous variables of this research, which is made up with Pearson’s coefficients to analyze the correlation among variables. All coefficients were statistically significant, and we explain the results with the relatively strong correlation of over ±0.4. The correlation coefficient was the highest between the computer and mobile literacy (coef. = 0.87, p < 0.00). Both of these variables have a strong correlation with each other and belonged to the digital literacy factor. Socio-demographic factors, age, and income show a negative correlation (coef. = −0.47, p < 0.00), and education and income level correlated positively (coef. = 0.4, p < 0.00). Education, digital literacy, and income factors correlated positively at levels of 0.45~0.48 (p < 0.00). Notably, the necessity factors of seven technologies were in a significantly positive correlation. There were positive correlations between seven variables from a minimum of 0.46 (p < 0.00) to a maximum of 0.57 (p < 0.00). A possible interpretation of this finding is that if one perceives the necessity of particular technologies as high, one is likely to perceive a high necessity for other technologies.
6.3. Results of Logistic Regression Analysis
Table 6 shows the result of logistic analysis on use experience with new technologies. We have seven models for each technology: AI speakers, mixed reality, smart homes, drones, blockchain, self-driving cars, and biometrics. We examine the effects of independent variables in socio-demographic factors, digital literacy, and a necessity factor. The odds ratio (OR) and significance of each independent variable are shown in Table 6.
Regarding the socio-demographic factors, gender is not significant in every model. Gender was the important determinant of the digital divide in the past [48,50,51]. However, for new technologies, the effect of gender seems diminished. However, age has a significant negative effect in the model of AI speakers (OR = 0.963, p < 0.000), biometrics (OR = 0.963, p < 0.000), drones (OR = 0.961, p < 0.000), smart homes (OR = 0.979, p < 0.000), mixed reality (OR = 0.957, p < 0.000), and blockchain (OR = 0.981, p < 0.000). Except for self-driving cars, younger people are more likely to experience new technologies.
Education has a significant positive effect in every model: AI speakers (OR = 1.403, p < 0.000), biometrics (OR = 1.515, p < 0.000), drones (OR = 1.153, p < 0.000), smart homes (OR = 1.586, p < 0.000), mixed reality (OR = 1.386, p < 0.000), self-driving cars (OR = 1.351, p < 0.000), and blockchain (OR = 1.788, p < 0.000). These results indicate that the higher the education attainment level, the higher the possibility of using new technologies. Regarding the income, it has a significant positive effect in the model of AI speakers (OR = 1.104, p < 0.000), biometrics (OR = 1.082, p < 0.000), drones (OR = 1.122, p < 0.000), and smart homes (OR = 1.077, p < 0.008). Despite the fairly high correlation between the education level and income levels, income seems somewhat limited when compared to education.
The region has a significant effect in the model of AI speakers (OR = 0.636, p < 0.000), biometrics (OR = 0.541, p < 0.000), drones (OR = 0.492, p < 0.000), mixed reality (OR = 0.583, p < 0.034), and blockchain (OR = 0.266, p < 0.066). It means that people living in rural areas are less likely to use and experience new technologies, except for smart homes and self-driving cars. Disability status is significant only in the model of AI speakers (OR = 0.630, p < 0.033). The gap between the disabled and non-disabled regarding the experience possibility of new technologies was not particularly noteworthy.
Concerning the digital literacy factors, computer literacy has a positive effect in the model of AI speakers (OR = 1.266, p < 0.000), biometrics (OR = 1.200, p < 0.000), mixed reality (OR = 1.567, p < 0.000), self-driving cars (OR = 1.370, p < 0.061), and blockchain (OR = 1.477, p < 0.068). It indicates that people who have better computer operational skills are likely to have more experience with those technologies. Similarly, mobile literacy also has a positive effect in the model of AI speakers (OR = 1.477, p < 0.000), biometrics (OR = 1.428, p < 0.000), drones (OR = 1.352, p < 0.000), and smart homes (OR = 1.464, p < 0.002). Digital literacy factors significantly influence all technologies. However, except for AI speakers and biometrics, the different types of literacy variables (computer and mobile) affect the possibility of new technologies. For instance, drones and smart homes, which are based on mobile technologies such as mobile and IoT, are affected by mobile devices’ operational skills. Instead, in the case of self-driving cars, MR, and blockchains, the influence of mobile literacy has not been found, but only the effect of computer literacy has been verified.
The necessity factor positively influences the use experience with AI speakers (OR = 1.486, p < 0.000), biometrics (OR = 1.653, p < 0.000), smart homes (OR = 1.744, p < 0.000), mixed reality (OR = 1.617, p < 0.000), self-driving cars (OR = 1.319, p < 0.000), and blockchain (OR = 1.591, p < 0.002). Notably, except for the drone model, the necessity factor has a significantly positive effect on the new technologies. Like the education and age variables, the necessity factor is a consistent and vital factor for using a new technology. These results explain that the higher the need for each technology, the more likely it is to use the new technology. In other words, when there is a positive attitude and motivation toward the technology, the possibility of the experience with new technology could increase.
7. Discussion
A summary of the results is demonstrated in Table 7. Regarding the socio-demographic factors, gender turned out to be insignificant in every model. The effect of gender on the use of new technologies seems to be diminished, and this result is consistent with the discussion of previous studies [43,55,56]. Gender, once regarded as a strong influence of the digital divide, can no longer be a significant factor. Hence, only the effect of gender corresponding to hypothesis 1-1 has not been verified for all types of new technologies. Age was significant in all models except for self-driving cars. It can be inferred that the age effect is essential in the use experience with new technologies and is a primary factor in the potential digital divide in the future smart city. Education and income remain important factors in using new technologies, especially education, which significantly and positively affects all models. Income level turned out to be significant in the models of AI speakers, biometrics, drones, and smart homes. This is because these technologies require purchases of devices individually in the use of technology than others do. The region was also verified to be significant in multiple models. It can be interpreted as a result of the particular aspects of demographic and sociological factors of urban and rural areas. Prior research notes that individuals living in rural areas tend to have relatively lower income levels and education than individuals living in a city [75,76]. Additionally, aging in rural society has rapidly progressed [89]. Thus, the region’s effect results from a mixture of diverse influences.
Overall, digital literacy positively affected the possibility of using new technologies. However, depending on the characteristics of each technology, the types of digital literacy affecting the use of technologies were somewhat different. For example, the use experience for drones and smart homes, based on the mobile network and sensors, is only influenced by mobile literacy. Meanwhile, technologies related to financial investment, such as blockchain, are also used in mobile devices. However, so far, they are more likely to be utilized based on the PC. Hence, blockchain would be affected by computer operational skills rather than mobile literacy. Conversely, the effect of the necessity factor is relatively consistent and influential in the models except for drones. It refers to the perception of necessity for new technologies to play a crucial role in using technologies (Table 8).
These findings enable the following interpretations. First, most of the factors previously discussed as factors that cause the digital divide also affect the use of new technologies expected to be applied in smart cities. Among socio-demographic factors, age, education, income, and regions are significant in most models. It can be inferred that there would be a certain level of the digital divide in future smart cities depending on the characteristics of those factors. Especially in the case of new technologies, this digital divide may be even more prominent and deepen. Considering the characteristics of new technologies, users would not merely receive the information and services one-way from the device but interact with the device and benefit from it. For example, in smart homes, IoTs collect home environment data and autonomously adjust the surrounding situation. Users who receive this information would adjust a bit and provide feedback to the device. As such, users’ interactions and engagement in technology could be learned and made over a long period with the accumulation of their experience in technology rather than simply owning the device or learning operation skills. Hence, it is likely that citizens who have no experience using these technologies in smart cities will continue to be excluded from technologies’ use and engagement. It would adversely affect their quality of life in the long run. Policymakers who promote smart cities should consider these potential digital divide issues and adequately address these issues to ensure engagement of all social groups of citizens in smart cities with a long-term perspective.
Second, the digital literacy factor affecting the use of all new technologies would indicate that van Dijk’s [19] model is still relevant in new technologies. When the skill aspect of technology is fulfilled, it can proceed to technology usage [19]. Given the different types of literacy affecting the use of technology according to each technology’s characteristics, it would be more desirable if both types of digital literacy were resolved. However, it would be necessary to prioritize the kind of literacy that needs to be addressed. Based on the use experience level of technologies, AI speakers, biometrics, drones, and smart homes were at the top of the seven new technologies. According to our results, the use experience with these technologies is positively affected by mobile literacy. Considering that the urban infrastructure and services are connected to 5G-based wireless networks, enhancing mobile literacy can resolve the potential digital divide in smart cities rather than computer literacy. Therefore, policy support providing regular and proactive education to promote mobile literacy to citizens living in smart cities needs to be prepared.
Lastly, the effect of necessity on technology use is expected to play an essential role in determining new technologies’ use. Except for drones, perceived necessity regarding each technology is positively associated with the use experience. Considering the operational definition of our necessity factor is close to the positive attitude toward new technologies. These results align with Davis’s [85] model, which is a classical model of technology acceptance. According to Davis [85], the attitude toward technology eventually influences the real use of technology. Our empirical results can support this explanation of Davis’s [85] model, and we could discover that this relationship between necessity (positive attitude) and use of technology is still valid. Based on these findings, to implement new technologies in smart cities and increase citizens’ use, consistent efforts should be made. The efforts such as detailed and diligent explanation and widespread promotion on the necessity and usefulness of the technologies to citizens living in smart cities need to be made. Without these efforts, if citizens do not feel any need for them, it could negatively affect citizens’ engagement in new technology-based smart urban services and harm cities’ sustainability in a long-term perspective.
This research identified the risk of an experience-based digital divide issue in the upcoming smart city with 5G technologies. 5G-based technologies such as AI, VR/AR, and self-driving cars require users to immersive experience rather than merely receive one-way text-based information. For example, AI can incessantly require user’s daily and ongoing experience. Through automated data analysis and feedback on user’s experience, it can provide more advanced and customized services to users. Likewise, the use experience on AI is able to profoundly affect the quality of provided services and influence the daily life of users after all. Thus, alienation from the use of 5G-based technologies that can affect the quality of various customized services in a smart city might have a profound impact on the quality of daily lives of residents in smart cities. In particular, the fact that the digital divide is triggered by socio-demographic factors that inevitably exist in our society implies that it will persist in the future society. Therefore, rather than focusing only on the benefits of new technologies, smart city policymakers need to design and plan citizen-friendly services that can encompass the engagements of all social groups. At the same time, it will be necessary to provide ongoing education and effort on the digital literacy and usefulness of new technologies to the residents in smart cities. Based on our empirical findings, the following solutions could be possible to mitigate the future digital divide problems in smart cities.
- Opening booth for 5G technologies experience for citizens in smart cities
- Operating customized education programs for elderly, low-income families, and residents for rural areas
- Opening regular lecture for improving mobile literacy and sharing knowledge on 5G technologies
8. Conclusions
This study explored the potential digital divide as a risk to existing smart cities where many new technologies will be utilized based on the 5G network. Furthermore, this study viewed the digital divide as a usage aspect rather than material access and operational skills. In this perspective, we explored the factors that affect the seven new technologies’ use experience. The results indicated that most socio-demographic factors that affect the digital divide on existing technologies still affect the digital divide in new technologies. Although gender has significantly disappeared in the use of new technologies, the results showed that age, education level, and the region still significantly affect the probability of new technology use experience. Furthermore, digital literacy levels and perception of the necessity for new technologies are verified to have a significant positive effect.
These results corroborate that, despite the progress of the information society, the digital divide issue arises and reappears based on the new or evolving technology environment. To be a sustainable and inclusive smart city, thoughtful consideration of diverse social groups of age, education level, and region are needed in smart cities’ urban policies. Moreover, the results that digital literacy and necessity have positive influences on the use of new technologies imply that continuous and regular education of digital literacy and knowledge for new technologies will be needed in smart cities to encourage citizens’ engagement in smart cities.
The above results of our study can contribute to the literature on the digital divide and provide policy implications to practitioners of smart cities. The digital divide can reappear based on new technologies that emphasize technologies’ usage. Thus, the results of our study support that a sustainable smart city needs preemptive consideration of various social groups’ engagement in society. Smart city policymakers can refer to our study’s results to predict the characteristics of potential citizens and their engagement level of high-tech urban services before introducing advanced services and infrastructure to smart cities. Finally, we suggested policy directions directly drawn to mitigate or prevent potential digital divide problems in smart cities.
Despite these implications and contributions, this study has several limitations. First, we utilized one-year and survey-based data, so we could not control for the problems of a bi-directional causal relationship, omitted variables, and social desirability bias. Second, there were some limitations in the model estimation because the level of use experience in self-driving cars and blockchain was significantly low. Finally, the measurement of the dependent variable was binary, so it was interpreted as a probability of technology use. If the dependent variable had been measured with continuous variables, a more direct prediction and interpretation could be possible. These limitations will be supplemented and resolved in future research.
Author Contributions
Conceptualization, S.-Y.S. and S.A.C.; methodology, S.-Y.S. and S.A.C.; software, S.-Y.S.; validation, S.-Y.S. and S.A.C.; formal analysis, S.-Y.S.; investigation, S.-Y.S.; resources, S.-Y.S.; data curation, S.-Y.S.; writing—original draft preparation, S.-Y.S. and S.A.C.; writing—review and editing, S.A.C. and D.K.; visualization, S.-Y.S.; supervision, S.A.C.; project administration, S.A.C. and D.K.; funding acquisition, D.K. and S.A.C. All authors have read and agreed to the published version of the manuscript.
Funding
This research was funded by the National Research Foundation of Korea (NRF-2017S1A3A2066084).
Data Availability Statement
Not applicable.
Conflicts of Interest
The authors declare no conflict of interest.
References
- Alawadhi, S.; Aldama-Nalda, A.; Chourabi, H.; Gil-Garcia, J.R.; Leung, S.; Mellouli, S.; Walker, S. Building understanding of smart city initiatives. In International Conference on Electronic Government; Springer: Berlin/Heidelberg, Germany, 2012; pp. 40–53. [Google Scholar]
- Rao, S.K.; Prasad, R. Impact of 5G technologies on smart city implementation. Wirel. Pers. Commun. 2018, 100, 161–176. [Google Scholar] [CrossRef]
- Ju, J.; Liu, L.; Feng, Y. Citizen-centered big data analysis-driven governance intelligence framework for smart cities. Telecommun. Policy 2018, 42, 881–896. [Google Scholar] [CrossRef]
- Anand, P.B. Right to information and local governance: An exploration. J. Hum. Dev. Capab. 2011, 12, 135–151. [Google Scholar] [CrossRef]
- Meijer, A. E-governance innovation: Barriers and strategies. Gov. Inf. Q. 2015, 32, 198–206. [Google Scholar] [CrossRef]
- Castelnovo, W. Co-production makes cities smarter: Citizens’ participation in smart city initiatives. In Co-Production in the Public Sector; Springer: Cham, Switzerland, 2016; pp. 97–117. [Google Scholar]
- Castells, M. Inofrmation Technology, Globalization and Social Development. (No. 114); UNRISD: Geneva, Switzerland, 1999. [Google Scholar]
- Naisbitt, J. Megatrends; Warner Books: New York, NY, USA, 1982; Volume 17. [Google Scholar]
- Thierer, A. How free computers are filling the digital divide. Herit. Found. Backgr. 2000, 1361, 1–21. [Google Scholar]
- Henriquez, L.; Kresin, F.; de Sensa, N. Amsterdam Smart Citizens Lab: Towards Community-Driven Data Collection. Available online: https://waag.org/sites/waag/files/2018-07/amsterdam-smart-citizen-lab-publicatie.pdf (accessed on 23 January 2017).
- Zandbergen, D.; Uitermark, J. In search of the smart citizen: Republican and cybernetic citizenship in the smart city. Urban Stud. 2020, 57, 1733–1748. [Google Scholar] [CrossRef] [Green Version]
- Selwyn, N. Reconsidering political and popular understandings of the digital divide. New Media Soc. 2004, 6, 341–362. [Google Scholar] [CrossRef]
- Le, N.T.; Hossain, M.A.; Islam, A.; Kim, D.Y.; Choi, Y.J.; Jang, Y.M. Survey of promising technologies for 5G networks. Mob. Inf. Syst. 2016, 2016, 2676589. [Google Scholar] [CrossRef] [Green Version]
- Neirotti, P.; De Marco, A.; Cagliano, A.C.; Mangano, G.; Scorrano, F. Current trends in smart city initiatives: Some stylised facts. Cities 2014, 38, 25–36. [Google Scholar] [CrossRef] [Green Version]
- Nam, T. Between success and failure of smart cities: An essay of smart governance. Commun. Korean Inst. Inf. Sci. Eng. 2018, 36, 9–20. (In Korean) [Google Scholar]
- NTIA (US Department of Commerce). Falling through the Net I: A Survey of the ‘Have Nots’ in Rural and Urban America. 1995. Available online: http://www.ntia.doc.gov/ntiahome/fallingthru.html (accessed on 8 January 2021).
- Hargittai, E. Second-level digital divide: Differences in people’s online skills. First Monday 2002, 7. [Google Scholar] [CrossRef]
- Scheerder, A.; van Deursen, A.; van Dijk, J. Determinants of Internet skills, uses, and outcomes. A systematic review of the second-and third-level digital divide. Telemat. Inform. 2017, 34, 1607–1624. [Google Scholar] [CrossRef]
- Van Dijk, J.A. The Deepening Divide: Inequality in the Information Society; Sage Publications: London, UK, 2005. [Google Scholar]
- Van Dijk, J.A. Digital divide research, achievements, and shortcomings. Poetics 2006, 34, 221–235. [Google Scholar] [CrossRef] [Green Version]
- Jung, J.H. A study on influencing factors on mobile internet usage level and the policy implications to eliminate the digital divide. Korean Policy Stud. Rev. 2017, 26, 151–176. (In Korean) [Google Scholar]
- Min, Y. Internet Access and digital divide: Focusing on access, utilization, and participation. J. Commun. Res. 2011, 48, 150–187. (In Korean) [Google Scholar]
- Colding, J.; Wallhagen, M.; Sörqvist, P.; Marcus, L.; Hillman, K.; Samuelsson, K.; Barthel, S. Applying a systems perspective on the notion of the smart city. Smart Cities 2020, 3, 420–429. [Google Scholar] [CrossRef]
- Chourabi, H.; Nam, T.; Walker, S.; Gil-Garcia, R.J.; Mellouli, S.; Nahon, K.; Pardo, T.A.; Scholl, J.H. Understanding smart cities: An integrative framework. In Proceedings of the HICSS, 45th Hawaii Conference, Maui, HI, USA, 4–7 January 2012; pp. 2289–2297. [Google Scholar]
- Giffinger, R.; Gudrun, H. Smart cities ranking: An effective instrument for the positioning of the cities? ACE Archit. City Environ. 2010, 4, 7–26. [Google Scholar]
- Washburn, D.; Sindhu, U.; Balaouras, S.; Dines, R.A.; Hayes, N.; Nelson, L.E. Helping CIOs understand “smart city” initiatives. Growth 2009, 17, 1–17. [Google Scholar]
- Lombardi, P.; Giordano, S.; Farouh, H.; Yousef, W. Modelling the smart city performance. Innov. Eur. J. Soc. Sci. Res. 2012, 25, 137–149. [Google Scholar] [CrossRef]
- Chun, S.A.; Kim, D.; Cho, J.S.; Chuang, M.; Shin, S.; Jun, D. Framework for smart city model composition: Choice of component design models and risks. Int. J. E-Plan. Res. 2021, 10, 50–69. [Google Scholar]
- Shapiro, J.M. Smart cities: Quality of life, productivity, and the growth effects of human capital. Rev. Econ. Stat. 2008, 88, 324335. [Google Scholar]
- Dameri, R.P. Searching for smart city definition: A comprehensive proposal. Int. J. Comput. Technol. 2013, 11, 2544–2551. [Google Scholar] [CrossRef]
- Nam, T.; Pardo, T.A. Conceptualizing smart cities with dimensions of technology, people, and institutions. In Proceedings of the 12th Annual International Digital Government Research Conference: Digital Government Innovation in Challenging Times, College Park, MD, USA, 12–15 June 2011; pp. 282–291. [Google Scholar]
- Silva, B.N.; Khan, M.; Han, K. Towards sustainable smart cities: A review of trends, architectures, components, and open challenges in smart cities. Sustain. Cities Soc. 2018, 38, 697–713. [Google Scholar] [CrossRef]
- Mckinsey. Smart Cities: Digital Solution for a More Livable Future; Mckinsey Global Institute: New York, NY, USA, 2018. [Google Scholar]
- Xiang, W.; Zheng, K.; Shen, X.S. (Eds.) 5G Mobile Communications; Springer: Berlin/Heidelberg, Germany, 2016. [Google Scholar]
- Skouby, K.E.; Lynggaard, P. Smart home and smart city solutions enabled by 5G, IoT, AAI, and CoT services. In Proceedings of the 2014 International Conference on Contemporary Computing and Informatics (IC3I), Mysore, India, 27–29 November 2014; pp. 874–878. [Google Scholar]
- Holland, R. Will the real Smart City please stand up? Creative, progressive, or just entrepreneurial. City 2008, 12, 302–320. [Google Scholar]
- Lindskog, H. Smart communities initiatives. In Proceedings of the 3rd ISOneWorld Conference, Las Vegas, NV, USA, 14–16 April 2004; Volume 16, pp. 14–16. [Google Scholar]
- Coe, A.; Paquet, G.; Roy, J. E-governance and smart communities: A social learning challenge. Soc. Sci. Comput. Rev. 2001, 19, 80–93. [Google Scholar] [CrossRef]
- Odendaal, N. Information and communication technology and local governance: Understanding the difference between cities in developed and emerging economies. Comput. Environ. Urban Syst. 2003, 27, 585–607. [Google Scholar] [CrossRef]
- Hargittai, E.; Hinnant, A. Digital inequality: Differences in young adults’ use of the Internet. Commun. Res. 2008, 35, 602–621. [Google Scholar] [CrossRef] [Green Version]
- Shin, S.; Eom. A study on influencing factors on mobile Internet use of marriage immigrants in Korea. J. Korean Assoc. Reg. Inf. Soc. 2019, 22, 73–109. (In Korean) [Google Scholar]
- Van Deursen, A.J.; Van Dijk, J.A. The digital divide shifts to differences in usage. New Media Soc. 2014, 16, 507–526. [Google Scholar] [CrossRef]
- Helsper, E.J. Gendered internet use across generations and life stages. Commun. Res. 2010, 37, 352–374. [Google Scholar] [CrossRef] [Green Version]
- Kim, M.C.; Kim, J. Digital divide: Conceptual and practical implications. Korean J. Sociol. 2002, 36, 123–155. (In Korean) [Google Scholar]
- Mossberger, K.; Tolbert, C.J.; Stansbury, M. Virtual Inequality: Beyond the Digital Divide; Georgetown University Press: Washington, DC, USA, 2003. [Google Scholar]
- Schiller, H. Information Inequality. The Deepening Social Crisis in America; Routledge: New York, NY, USA, 1996. [Google Scholar]
- Selwyn, N.; Gorard, S.; Furlong, J.; Madden, L. Older adults’ use of information and communications technology in everyday life. Aging Soc. 2003, 23, 561. [Google Scholar] [CrossRef] [Green Version]
- Hargittai, E.; Shafer, S. Differences in actual and perceived online skills: The role of gender. Soc. Sci. Q. 2006, 87, 432–448. [Google Scholar] [CrossRef]
- Harper, V. The digital divide (DD): A reconceptualization for educators. AACE J. 2003, 11, 96–103. [Google Scholar]
- Ono, H.; Zavodny, M. Gender and the Internet. Soc. Sci. Q. 2003, 84, 111–121. [Google Scholar] [CrossRef]
- Wasserman, I.M.; Richmond-Abbott, M. Gender and the Internet: Causes of variation in access, level, and scope of use. Soc. Sci. Q. 2005, 86, 252–270. [Google Scholar] [CrossRef]
- Bannert, M.; Arbinger, P.R. Gender-related differences in exposure to and use of computers: Results of a survey of secondary school students. Eur. J. Psychol. Educ. 1996, 11, 269–282. [Google Scholar] [CrossRef]
- Broos, A. Gender and information and communication technologies (ICT) anxiety: Male self-assurance and female hesitation. Cyberpsychol. Behav. 2005, 8, 21–31. [Google Scholar] [CrossRef]
- Comber, C.; Colley, A.; Hargreaves, D.J.; Dorn, L. The effects of age, gender and computer experience upon computer attitudes. Educ. Res. 1997, 39, 123–133. [Google Scholar] [CrossRef]
- Dutton, W.; Helsper, E. Internet in Britain: 2007, Oxford Internet Surveys; University of Oxford, Oxford Internet Institute: Oxford, UK, 2007. [Google Scholar]
- Fallows, D. How Women and Men Use the Internet. Pew Internet American Life Project. 2005. Available online: http://www.pewinternet.org/Reports/2005/How-Women-and-Men-Use-the-Internet.aspx (accessed on 10 November 2007).
- Kim, H. Age-related differences in the digital divide: Focusing on married female immigrants. Fam. Environ. Res. 2018, 56, 217–232. [Google Scholar] [CrossRef] [Green Version]
- Loges, W.E.; Jung, J.Y. Exploring the digital divide: Internet connectedness and age. Commun. Res. 2001, 28, 536–562. [Google Scholar] [CrossRef]
- Millward, P. The ‘grey digital divide’: Perception, exclusion, and barriers of access to the Internet for older people. First Monday 2003. [Google Scholar] [CrossRef] [Green Version]
- Shin, S.; Kim, D. A study on the relationship between mobile literacy and life satisfaction of the elderly: Focusing on the mediating effect of mobile-based living service usage level. J. Gov. Stud. 2014, 227–267. (In Korean) [Google Scholar]
- Jones, S.; Fox, S. Generations Online in 2009; Pew Internet American Life Project: Washington, DC, USA, 2009; pp. 1–9. [Google Scholar]
- Hwang, Y.; Park, N.; Lee, H.; Lee, W.T. Exploring digital literacy in convergent media environment: Communication competence and generation gap. Korean J. J. Commun. Stud. 2012, 56, 198–225. (In Korean) [Google Scholar]
- Song, K.J. Exploratory study on digital divide of multicultural families and preemptive policy effects. Soc. Theory 2015, 48, 135–163. [Google Scholar]
- Van Dijk, J.A.G.M.; Hacker, K. The digital divide as a complex and dynamic phenomenon special issue: Remapping the digital divide. Inf. Soc. 2003, 19, 315–326. [Google Scholar] [CrossRef]
- Servon, L. Four myths about the digital divide. Plan. Theory Pract. 2002, 3, 222–227. [Google Scholar] [CrossRef]
- Sung, W. A study on digital literacy and digital divide in the smart city. Korean Soc. Public Adm. 2014, 25, 53–75. (In Korean) [Google Scholar]
- Katz, J.E.; Rice, R.E. Social Consequences of Internet Use: Access, Involvement, and Interaction; MIT Press: Cambridge, MA, USA, 2002. [Google Scholar]
- Kim, E.J. A study on the policy alternatives for bridging the generation gap across the digital divide. Korean Policy Sci. Rev. 2006, 11, 195–219. (In Korean) [Google Scholar]
- Lee, S. Analysis of the effects of smart devices on digital divide in America. J. Korean Libr. Inf. Sci. Soc. 2012, 43, 29–52. (In Korean) [Google Scholar]
- Hindman, D.B. The rural-urban digital divide. J. Mass Commun. Q. 2000, 77, 549–560. [Google Scholar] [CrossRef]
- Kim, J.C.; Min, B.I. Digital divide between the Seoul metropolitan area and local region. Korean Gov. Rev. 2006, 26, 115–143. (In Korean) [Google Scholar]
- Townsend, L.; Sathiaseelan, A.; Fairhurst, G.; Wallace, C. Enhanced broadband access as a solution to the social and economic problems of the rural digital divide. Local Econ. 2013, 28, 580–595. [Google Scholar] [CrossRef] [Green Version]
- Vicente, M.R.; López, A.J. Assessing the regional digital divide across the European Union-27. Telecommun. Policy 2011, 35, 220–237. [Google Scholar] [CrossRef]
- Pereira, J.P.R. Broadband access and the digital divide. In New Advances in Information Systems and Technologies; Springer: Cham, Switzerland, 2016; pp. 363–368. [Google Scholar]
- Fong, M.W. Digital divide between urban and rural regions in China. Electron. J. Inf. Syst. Dev. Ctries. 2009, 36, 1–12. [Google Scholar] [CrossRef]
- Szeles, M.R. New insights from a multilevel approach to the regional digital divide in the European Union. Telecommun. Policy 2018, 42, 452–463. [Google Scholar] [CrossRef]
- Yeo, C.H.; Seo, Y.H. An analysis on the spatial spillover patterns of aging population in rural areas. J. Korean Assoc. Geogr. Inf. Stud. 2014, 17, 39–53. (In Korean) [Google Scholar] [CrossRef]
- Dobransky, K.; Hargittai, E. The disability divide in internet access and use. Inf. Commun. Soc. 2006, 9, 313–334. [Google Scholar] [CrossRef] [Green Version]
- Vicente, M.R.; López, A.J. A multidimensional analysis of the disability digital divide: Some evidence for Internet use. Inf. Soc. 2010, 26, 48–64. [Google Scholar] [CrossRef]
- Merchant, G. Writing the future in the digital age. Literacy 2007, 41, 118–128. [Google Scholar] [CrossRef]
- Eshet, Y. Digital literacy: A conceptual framework for survival skills in the digital era. J. Educ. Multimed. Hypermedia 2004, 13, 93–106. [Google Scholar]
- Ahn, U. A study on factors of determining continuous use of SNS: Based on technology readiness acceptance model. J. Korea Serv. Manag. Soc. 2016, 17, 257–258. [Google Scholar]
- Ajzen, I.; Fishbein, M. Understanding Attitudes and Predicting Social Behavior; Prentice-Hall: Englewood Cliffs, NJ, USA, 2000. [Google Scholar]
- Fazio, R.H. How do attitudes guide behavior? In Handbook of Motivation and Cognition: Foundations of Social Behavior; Guilford Press: New York, NY, USA, 1986; Volume 1, pp. 204–243. [Google Scholar]
- Davis, F.D. Perceived usefulness, perceived ease of use, and user acceptance of information technology. MIS Q. 1989, 13, 319–340. [Google Scholar] [CrossRef] [Green Version]
- National Information Society Agency. The Report on the Digital Divide; National Information Society Agency: Daegu, Korea, 2020.
- Knoke, D.; Burke, P.J.; Burke, P.J. Log-Linear Models; Sage: London, UK, 1980; Volume 20. [Google Scholar]
- Morrow-Howell, N.; Proctor, E. The use of logistic regression in social work research. J. Soc. Serv. Res. 1993, 16, 87–104. [Google Scholar] [CrossRef]
- Glasgow, N.; Berry, E.H. Introduction to rural aging in twenty-first-century America. In Rural Aging in 21st Century America; Springer: Berlin/Heidelberg, Germany, 2013; pp. 1–13. [Google Scholar]
Figure 1.
A model of access to digital technologies [19], p. 22.
Figure 1.
A model of access to digital technologies [19], p. 22.

Figure 2.
Stages in the Digital Divide [12], p. 352.
Figure 2.
Stages in the Digital Divide [12], p. 352.

Figure 3.
Conceptual model.

Figure 4.
The level of use experience with new technologies.


Table 1.
Comparison of services in current and future smart cities.
| Dimension | Current Smart Cities Services | Future Smart Cities Services (Based on 5G or Beyond) |
|---|---|---|
| Contents provision | Information needs and provision services | Immersive use experience services |
| Channel | Textual or single-channel interaction | Multimodal/multi-media Interactions/playable |
| Knowledge generation | Data Analytics-based patterns or predictability | Inference-based Predictions and anticipatory services |
| Focus | Surveillance and alerting oriented service | Executing automated complex sequence of actions |
| The role of citizens | Consumers | Active DIY actors |
Table 2.
Demographics of the respondents.
| Variable | Frequency | (%) | Variable | Frequency | (%) | ||
|---|---|---|---|---|---|---|---|
| Gender | Male | 3339 | 50.06 | Education attain level (graduated) | Elementary | 836 | 12.12 |
| Female | 3391 | 49.94 | Middle | 1041 | 15.09 | ||
| Age | Below 10 | 14 | 0.2 | High | 2848 | 41.28 | |
| 10~19 | 898 | 101 | College/ university | 2175 | 31.52 | ||
| 20~29 | 950 | 13.77 | Monthly income (thousand KRW) 1 USD = KRW 1130 (19 March 2021) | 0~990 | 239 | 3.81 | |
| 30~39 | 1012 | 14.67 | 1000~1999 | 592 | 8.58 | ||
| 40~49 | 1187 | 17.20 | 2000~2999 | 877 | 12.71 | ||
| 50~59 | 1211 | 17.55 | 3000~3999 | 1728 | 25.04 | ||
| 60~69 | 866 | 12.55 | 4000~4999 | 1539 | 22.30 | ||
| Above 70 | 762 | 11.05 | 5000~5999 | 1300 | 18.84 | ||
| Disability status | YES | 202 | 2.93 | Over 6000 | 625 | 9.06 | |
| NO | 6698 | 97.07 | Residential area | Si (city) | 6309 | 91.43 | |
| Gun (rural) | 591 | 8.57 | |||||
Table 3.
Measurement of variables.
| Variables | Survey Items and Measurement | |
|---|---|---|
| The Use Experience with New Technologies | Experience in using the following lists of intelligent technologies (AI speakers, mixed reality, smart homes, drones, blockchain, self-driving cars, and biometrics) No (0), Yes (1). Coded as dummy variables | |
| Socio-demographic factors | Gender | Male (0) or Female (1) |
| Age | The age of respondents | |
| Education | The highest level of education Elementary (1), Middle School (2), High School (3), College and University (4) | |
| Income | The level of monthly income (thousand Won) | |
| Region | The residential area of respondent City (0), Rural (1). Coded as dummy variables | |
| Disability status | The Disability status of the respondent No (0), Yes (1). Coded as dummy variables | |
| Digital literacy factors | Computer literacy | The level of operational skills of computer The average value of the following seven items, which are measured with a four-point ordinal scale. (1) Able to set up, delete and update the software (2) Able to connect network (wired and wireless) and use it (3) Able to set up user preference of the web browser (Chrome, Internet Explorer) (4) Able to connect and use various devices (digital camera, printer, scanner) (5) Able to transmit the file to others on the Internet. (6) Able to scan and clean the virus program. (7) Able to draw up a document on a word processer. |
| Mobile literacy | The level of operational skills of a mobile device The average value of the following seven items, which are measured with a four-point ordinal scale. (1) Able to manage settings of the device. (2) Able to set up a wireless network of the device. (3) Able to send the file device to a computer. (4) Able to transmit own files or images to others. (5) Able to search, download, update, delete applications on device. (6) Able to scan and clean the virus on the device. (7) Able to write a document with the device. | |
| Necessity factor | The perception of necessity | The level of perceived necessity of respondents on new technologies (AI speakers, mixed reality, smart homes, drones, blockchain, self-driving cars, and biometrics) The response to each technology’s necessity level is measured by the following categories with a four-point ordinal scale. Measured with a four-point ordinal scale. (1) Completely unnecessary. (2) Unnecessary. (3) Necessary. (4) Completely necessary. |
Table 4.
Descriptive statistics for the independent variable.
| Variable | Obs. | Mean | Std. Dev. | Min | Max | |
|---|---|---|---|---|---|---|
| Digital Literacy | Computer | 6900 | 2.614 | 0.953 | 1 | 4 |
| Mobile | 6900 | 2.884 | 0.880 | 1 | 4 | |
| Necessity | AI-Speakers | 6900 | 2.753 | 0.661 | 1 | 4 |
| Biometrics | 6900 | 2.816 | 0.722 | 1 | 4 | |
| Drones | 6900 | 2.838 | 0.740 | 1 | 4 | |
| Smart Homes | 6900 | 2.819 | 0.708 | 1 | 4 | |
| Mixed Reality | 6900 | 2.525 | 0.753 | 1 | 4 | |
| Self-driving car | 6900 | 2.827 | 0.794 | 1 | 4 | |
| Blockchain | 6900 | 2.558 | 0.759 | 1 | 4 | |
Table 5.
Correlation matrix.
| Variables | (1) | (2) | (3) | (4) | (5) | (6) | (7) | (8) | (9) | (10) | (11) | (12) | |
|---|---|---|---|---|---|---|---|---|---|---|---|---|---|
| (1) | Age | 1.00 | |||||||||||
| (2) | Education | −0.12 (0.00) | 1.00 | ||||||||||
| (3) | Income | −0.47 (0.00) | 0.4 (0.00) | 1.00 | |||||||||
| (4) | Computer Literacy | −0.59 (0.00) | 0.46 (0.00) | 0.47 (0.00) | 1.00 | ||||||||
| (5) | Mobile Literacy | −0.58 (0.00) | 0.45 (0.00) | 0.48 (0.00) | 0.84 (0.00) | 1.00 | |||||||
| (6) | Necessity of A.S. | −0.26 (0.00) | 0.16 (0.00) | 0.20 (0.00) | 0.29 (0.00) | 0.29 (0.00) | 1.00 | ||||||
| (7) | Necessity of B.M. | −0.30 (0.00) | 0.22 (0.00) | 0.22 (0.00) | 0.33 (0.00) | 0.32 (0.00) | 0.51 (0.00) | 1.00 | |||||
| (8) | Necessity of Drones | −0.25 (0.00) | 0.17 (0.00) | 0.21 (0.00) | 0.29 (0.00) | 0.27 (0.00) | 0.46 (0.00) | 0.55 (0.00) | 1.00 | ||||
| (9) | Necessity of S.H. | −0.24 (0.00) | 0.20 (0.00) | 0.22 0.00) | 0.28 (0.00) | 0.27 (0.00) | 0.51 (0.00) | 0.53 (0.00) | 0.52 (0.00) | 1.00 | |||
| (10) | Necessity of MR. | −0.24 (0.00) | 0.18 (0.00) | 0.19 (0.00) | 0.26 (0.00) | 0.23 (0.00) | 0.55 (0.00) | 0.49 (0.00) | 0.49 (0.00) | 0.48 (0.00) | 1.00 | ||
| (11) | Necessity of S.D.C | −0.21 (0.00) | 0.18 (0.00) | 0.18 (0.00) | 0.25 (0.00) | 0.25 (0.00) | 0.49 (0.00) | 0.48 (0.00) | 0.53 (0.00) | 0.49 (0.00) | 0.54 (0.00) | 1.00 | |
| (12) | Necessity of BC. | −0.23 (0.00) | 0.19 (0.00) | 0.20 (0.00) | 0.26 (0.00) | 0.24 (0.00) | 0.46 (0.00) | 0.50 (0.00) | 0.49 (0.00) | 0.52 (0.00) | 0.57 (0.00) | 0.53 (0.00) | 1.00 |
Table 6.
Results of logistic regression analysis on use experience with new technologies (odds ratio).
Table 6.
Results of logistic regression analysis on use experience with new technologies (odds ratio).
| DV: Use Experience | (1) AI Speakers | (2) Biometrics | (3) Drones | (4) Smart Homes | (5) Mixed Reality | (6) Self-Driving | (7) Blockchain | ||||||||
|---|---|---|---|---|---|---|---|---|---|---|---|---|---|---|---|
| OR. | P > z | OR. | P > z | OR. | P > z | OR. | P > z | OR. | P > z | OR. | P > z | OR. | P > z | ||
| Socio demogra-phic | Gender (female) | 1.065 | 0.290 | 1.067 | 0.297 | 0.964 | 0.683 | 0.865 | 0.128 | 0.973 | 0.794 | 0.832 | 0.274 | 1.280 | 0.236 |
| Age | 0.963 | 0.000 | 0.963 | 0.000 | 0.961 | 0.000 | 0.979 | 0.000 | 0.957 | 0.000 | 0.993 | 0.272 | 0.981 | 0.029 | |
| Education | 1.403 | 0.000 | 1.515 | 0.000 | 1.153 | 0.013 | 1.586 | 0.000 | 1.386 | 0.000 | 1.351 | 0.008 | 1.788 | 0.000 | |
| Income | 1.104 | 0.000 | 1.082 | 0.000 | 1.122 | 0.000 | 1.077 | 0.008 | 0.999 | 0.961 | 1.069 | 0.165 | 0.973 | 0.638 | |
| Disabled (yes) | 0.630 | 0.033 | 1.044 | 0.840 | 0.941 | 0.851 | 0.851 | 0.650 | 0.824 | 0.630 | N/A | 0.941 | 0.933 | ||
| Region (rural) | 0.636 | 0.000 | 0.541 | 0.000 | 0.492 | 0.003 | 0.706 | 0.111 | 0.583 | 0.034 | 0.976 | 0.942 | 0.266 | 0.066 | |
| Digital Literacy | Computer literacy | 1.266 | 0.000 | 1.200 | 0.010 | 1.054 | 0.622 | 1.055 | 0.635 | 1.567 | 0.000 | 1.370 | 0.061 | 1.477 | 0.068 |
| Mobile literacy | 1.477 | 0.000 | 1.428 | 0.000 | 1.352 | 0.007 | 1.464 | 0.002 | 1.182 | 0.202 | 1.143 | 0.495 | 1.037 | 0.884 | |
| Necessity | Necessity | 1.486 | 0.000 | 1.653 | 0.000 | 1.109 | 0.124 | 1.744 | 0.000 | 1.617 | 0.000 | 1.319 | 0.018 | 1.591 | 0.002 |
| _cons | 0.017 | 0.000 | 0.010 | 0.000 | 0.027 | 0.000 | 0.001 | 0.000 | 0.005 | 0.000 | 0.001 | 0.000 | 0.000 | 0.000 | |
| Obs | 6790 | 6790 | 6790 | 6790 | 6790 | 6956 | 6790 | ||||||||
| LR Chi2 | 1670.36 | 1409.86 | 418.23 | 382.38 | 426.45 | 70.46 | 80.46 | ||||||||
| Nagelkerke R2 | 0.305 | 0.276 | 0.134 | 0.132 | 0.164 | 0.054 | 0.085 | ||||||||
Table 7.
Summary of results.
| Factor/Variables | AI Speakers | Bio Metrics | Drones | Smart Homes | Mixed Reality | Self-Driving | Block Chain | |
|---|---|---|---|---|---|---|---|---|
| Socio-demographic factor | Gender (Female) | - | - | - | - | - | - | - |
| Age (Old) | Negative | Negative | Negative | Negative | Negative | - | Negative | |
| Education (High) | Positive | Positive | Positive | Positive | Positive | Positive | Positive | |
| Income (High) | Positive | Positive | Positive | Positive | - | - | - | |
| Disability (Yes) | Negative | - | - | - | - | - | - | |
| Region (Rural) | Negative | Negative | Negative | - | Negative | - | Negative | |
| Digital literacy factor | Computer | Positive | Positive | - | - | Positive | Positive | Positive |
| Mobile | Positive | Positive | Positive | Positive | - | - | - | |
| Necessity factor | Perception of necessity | Positive | Positive | - | Positive | Positive | Positive | Positive |
Table 8.
Results of hypothesis testing.
| Technologies | Effect (+/−) | Confirmed Hypotheses | Determinants |
|---|---|---|---|
| AI speakers | Positive | H1b, H1c, H2, H2a, H3 | Education, income, computer literacy, mobile literacy, necessity |
| Negative | H1a, H1e, H1d | Age, disability, region | |
| Biometrics | Positive | H1b, H1c, H2, H2a, H3 | Education, income, computer literacy, mobile literacy, necessity |
| Negative | H1a, H1e | Age, region | |
| Drones | Positive | H1b, H1c, H2b | Education, income, mobile literacy |
| Negative | H1a, H1e | Age, region | |
| Smart Homes | Positive | H1b, H1c, H2b, H3 | Education, income, mobile literacy, necessity |
| Negative | H1a | Age | |
| Mixed Reality | Positive | H1b, H2, H3 | Education, computer literacy, necessity |
| Negative | H1a, H1e, | Age, region | |
| Self-driving Car | Positive | H1b, H2 | Education, computer literacy |
| Negative | N/A | N/A | |
| BlockChain | Positive | H1b, H2, H3 | Education, computer literacy, necessity |
| Negative | H1a, H1e | Age, region |
Publisher’s Note: MDPI stays neutral with regard to jurisdictional claims in published maps and institutional affiliations. |
© 2021 by the authors. Licensee MDPI, Basel, Switzerland. This article is an open access article distributed under the terms and conditions of the Creative Commons Attribution (CC BY) license (https://creativecommons.org/licenses/by/4.0/).
Share and Cite
MDPI and ACS Style
Shin, S.-Y.; Kim, D.; Chun, S.A. Digital Divide in Advanced Smart City Innovations. Sustainability 2021, 13, 4076. https://0-doi-org.brum.beds.ac.uk/10.3390/su13074076
AMA Style
Shin S-Y, Kim D, Chun SA. Digital Divide in Advanced Smart City Innovations. Sustainability. 2021; 13(7):4076. https://0-doi-org.brum.beds.ac.uk/10.3390/su13074076
Chicago/Turabian StyleShin, Seung-Yoon, Dongwook Kim, and Soon Ae Chun. 2021. "Digital Divide in Advanced Smart City Innovations" Sustainability 13, no. 7: 4076. https://0-doi-org.brum.beds.ac.uk/10.3390/su13074076
Note that from the first issue of 2016, this journal uses article numbers instead of page numbers. See further details here.