
Energy Transition toward Cleaner Energy Resources in Nepal


Graduate School of Environmental and Information Studies, Tokyo City University, 3-3-1 Ushikubo-nishi, Tsuzuki-cu, Yokohama 224-8551, Japan
*
Author to whom correspondence should be addressed.
Sustainability 2021, 13(8), 4243; https://0-doi-org.brum.beds.ac.uk/10.3390/su13084243
Submission received: 28 February 2021
/
Revised: 28 March 2021
/
Accepted: 4 April 2021
/
Published: 11 April 2021
(This article belongs to the Special Issue Sustainable Integration of Renewable Power Generation Systems)
Abstract
:Energy is an important input for socioeconomic development and human well-being. The rationality of energy transitions toward cleaner energy resources is not only to improve individual living conditions, but also to enhance the economic growth of a nation. Nepal is considered to be one of the countries with a low per-capita electricity use, heavily relying on traditional energy resources such as firewood and agricultural residues. The country is rich in hydropower resources. However, various economic and socioeconomic constraints have left the significant potential for hydroelectricity untapped. This study describes the energy transition patterns in Nepal based on a literature review and field survey of household energy use in the winter. We collected data from 516 households in the Solukhumbu, Panchthar, and Jhapa districts of Nepal. The rate of per-capita electricity consumption was 330 kWh/capita/year, which is significantly lower than that of other contemporary global societies such as India 1000 and China 4900 kWh/capita/year. The increasing trend in hydroelectricity production has optimistically transformed the energy sector toward cleaner resources; this correlates with the GDP per capita. Solar home systems, mini- and micro-hydropower plants, biogas technology, and improved cook stoves have been widely used, which has lowered the health and environmental burdens in rural areas. By analysing the survey data, we found that 25% of the households only relied on traditional cooking fuel, while 67% and 8% of the households relied on mixed and commercial cooking fuels, respectively. Moreover, 77% and 48% of traditional and mixed-fuel-using households were unhappy with current cooking fuels while 40% and 66% of these households preferred to use clean cooking fuels. The share of traditional energy resources decreased from 78% to 68%, while that of commercial energy resources increased from 20% to 28% from 2014/15 to 2019/20. This study suggests that future energy policies and programs should acknowledge the reality of energy transition to achieve sustainability by establishing reliable and clean sources of energy.
1. Introduction
Energy is one of the most important inputs for modern economics, as it improves the socioeconomic development and well-being of society. Worldwide, the demand for energy has rapidly risen owing to an increase in the population and industrial sectors, leading to increased use of non-renewable energy resources, such as petroleum and coal [1]. Ensuring universal access to affordable energy services has been identified as one of the targets of the Sustainable Development Goals (SDGs) set for 2030 [2]. The expansion of the energy infrastructure and efficient technology upgrades, facilitating clean energy services, remain challenging for most developing countries. With rising concerns over environmental sustainability, the focus of energy policies has generally shifted from inefficient technology and traditional energy resources toward improved technologies and clean energy resources, especially in the context of developing countries.
Nepal, situated in the Himalayan mountain range between India and China, is one of the least developed countries in the world and has a low per-capita energy use. The mountainous topography of Nepal yields a challenge to the development of modern energy infrastructure in all regions of the country. The unavailability and unaffordability of clean commercial fuels, such as electricity and liquified petroleum gas (LPG), has long been a serious problem in Nepal. Owing to the lack of access to clean commercial fuels in rural areas, most people rely on traditional fuel resources to fulfil their daily household energy needs. A heavy reliance on traditional fuels and low per-capita electricity consumption has resulted in adverse environmental and public health impacts, especially for women who work as the gatherers, processors, carriers, and end-users of household energy [3]. Nepal has no major assessable reserves of coal, natural gas, or oil, and is largely dominated by traditional energy sources, such as firewood, agricultural residue, and animal dung for domestic energy requirements [4,5]. Owing to the steep gradient and mountainous topography, Nepal is characterised by a substantial potential for hydroelectricity and other renewable energy resources; however, this potential remains untapped due to various economic and other constraints [6]. Electricity generated from hydropower is regarded as a clean and sustainable source of energy because it does not require the input of fossil fuels and does not directly emit greenhouse gases to the surrounding environment. Geographical remoteness, scattered consumers, higher costs associated with the energy supply and maintenance, low consumption, and low level of household income are only a few of the factors that make linking rural mountainous areas to the national electricity grid difficult or even impossible [5].
The Nepalese government is committed to taking actions to support the initiatives of SDGs by improving access to efficient and environmentally friendly energy sources, particularly electricity, across the country. However, due to the lack of access to clean energy and low incomes, rural residents rely heavily on locally available traditional fuels. The Nepalese government encourages rural inhabitants to use better cooking technologies through subsidy schemes, especially biogas and updated cook stoves, to improve their living standards. Solar panels are also encouraged and widespread in households where grid electricity is not available. The establishment of subsidy schemes and a package of incentives for private sector hydropower generation projects was established to ensure a reliable electricity supply at a reasonable price [5]. Similar to other developing countries, with improved accessibility to clean energy and higher income levels, rural residents gradually switch from traditional energy to clean energy resources. This energy transition pattern leads to a structural change in the energy demand and consumption and has important policy implications for the sustainable management of energy resources. Thus, this study allows us to compare the prevalence of energy transition patterns based on a literature review and a field survey on household energy in three climatic regions in Nepal.
1.1. Background
Previous studies have recently widely examined the variation in residential energy use in Nepal. For example, Malla [7] examined the energy use patterns, reporting that energy use is heterogeneous across regions, with biomass dominating the energy mix in Nepal. Fox [8] conducted a field survey in Nepal, finding that firewood consumption ranges from 0.96–1.75 kg/capita/day in rural households. Family size, cast, and season all have an influence on this consumption rate. Rijal [9] also investigated the firewood consumption rate in traditional households in Nepal, finding that the firewood consumption rate was 235–1130 kg/capita/year. Shahi et al. [10] found that electricity use in Nepal is lower than that in other developed and developing countries. They found that electricity use is a function of the household income level, occupation, family size, and educational level of the responsible person. In Bhutan, Rahut et al. [11] analysed the determinants of household energy use, finding that wealthier households tend to use cleaner energy for lighting, cooking, and heating. Pradhan and Limmeechokchai [12] conducted research on electric and biogas stoves as options for cooking, reporting that the consumption of imported fossil fuels would decrease with the use of electricity and biogas for cooking in Nepal. Hydropower is the main source of electricity in Nepal; some studies have highlighted the opportunities and challenges associated with this energy source. For example, Sovacool et al. [3] examined the socioeconomic barriers to hydropower development in Nepal, providing evidence of the technical, social, economic, and institutional barriers to electricity development in Nepal. Gurung et al. [4] found that micro-hydropower plants could be the milestone in providing clean, affordable, and sustainable energy in rural areas of Nepal. Alam et al. [13] reported that Nepal, with the development of hydropower, can meet its domestic electricity demand, create a surplus for exports, and generate employment for citizens. Many other studies have reported that previous severe electricity crises led to blackouts for up to 16 h per day and a dependency on traditional fuels due to the lack of accessible and affordable sources of other clean fuels in different parts of the country [3,10,14,15]. Access to clean energy resources and its transition pattern is important, not only to promote better health and environmental conditions, but also to enhance the socioeconomic development of the region. Furthermore, it is vital to achieving sustainable development goals in terms of energy security. However, to date, no studies have focused on the energy transition patterns in Nepal. Thus, this study highlights the current energy transition patterns in Nepal. The findings of this study can aid in the formulation of effective energy policies and development strategies that allow us to explore how to overcome the existing challenges to providing clean and affordable energy to the citizens of Nepal, as well as to people worldwide.
1.2. Objectives
Nepal has recently made notable progress in rural electrification and the distribution of clean commercial fuels across the country [10]. Despite the ambitious rural electrification projects and rise in per-capita income, a significant proportion of Nepalese households still use traditional fuels for cooking and space heating. Therefore, considering the recent developments in energy accessibility, use of clean energy resources, and improved cooking technology are crucial. Therefore, the main objective of this study is to review the current energy transition patterns in Nepal while specifically focusing on clean energy development and improved cooking technologies in Nepal. To understand the current energy development trends, this study provides an updated view of current electricity consumption trends, hydropower development trends, and the dispersion of other clean and alternative energy services throughout the country. Furthermore, based on a field survey, this study analysed the current situation of cooking fuels, feelings and preference of the respondent on current cooking fuel used in three climatic regions in Nepal.
2. Materials and Methods
This study used two methods. The first method was a literature review which was conducted to gather secondary data in terms of hydroelectricity production, per-capita electricity consumption, GDP per-capita, diffusion of clean cooking technology, and share of different primary energy sources in the national energy mix. These data were collected from various national and international sources, such as the International Energy Agency (IEA), Government of Nepal/Water Energy Commission Secretariat (GoN/WECS), Alternative Energy Promotion Center (AEPC), Nepal Electricity Authority (NEA), and other relevant published research articles and reports. The second method was a case study on the household energy use of 516 households in three climatic regions in Nepal. Section 2.1, Section 2.2 and Section 2.3 present the details of the case study area and methods.
2.1. Study Area
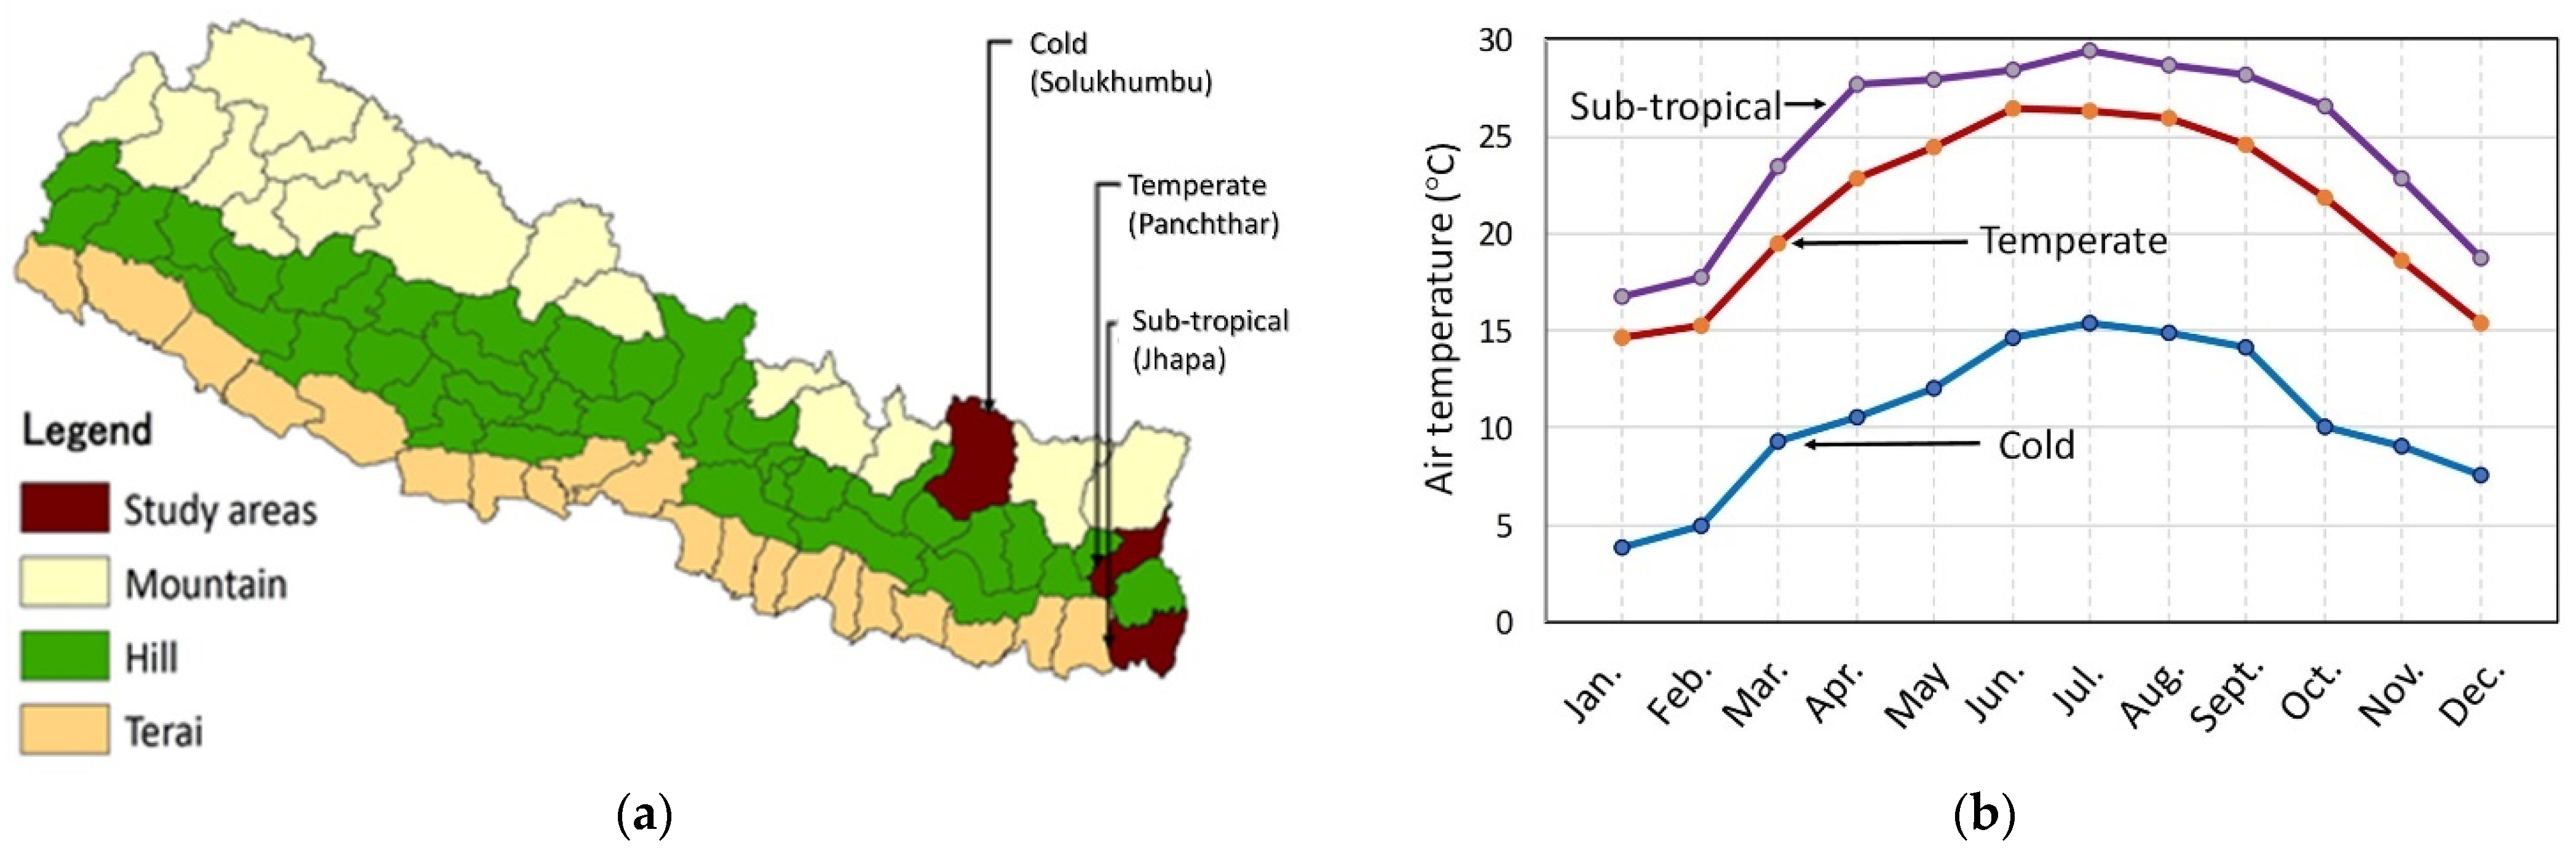
Nepal is a mountainous landlocked country situated in between India and China. It extends latitudinally from 26°22′ to 30°27′ and longitudinally from 80°04′ to 88°12′. The country is approximately 885 km long from east to west and its width from north–south varies from 130 to 260 km. Nepal can be broadly classified into three regions: the mountain, hill, and Terai regions, all of which extend from east to west with irregular widths from north to south. Figure 1a shows the subdivision of the country into mountain, hill, and Terai regions.
To represent three regions, this study selected three non-adjoining districts for household survey with different levels of road and energy infrastructure accessibility as shown in Table 1. These three regions were the Solukhumbu district from the mountain region, having a cold climate; Panchthar district from the hill region, having a temperate climate; and Jhapa district from the Terai region, having a sub-tropical climate. The altitude of the study area in the mountainous region is over 2000 m, between 1000 and 2000 m in the hill region, and below 500 m to sea level in the Terai region.
Figure 1b shows the monthly mean outdoor air temperatures of the study areas in the three regions. The monthly mean outdoor air temperature was the lowest during winter (December–January), sharply increasing in March due to an increase in the amount of solar radiation. The arrival of monsoon rain tends to mitigate the increase in the outdoor air temperature during the monsoon period. May and June are the hottest months in Nepal. Table 1 lists information on the study areas and surveyed houses.
2.2. Energy Use Survey
A household questionnaire survey was carried out in 516 households, comprising 78 households in the Solukhumbu district (Salleri), 262 households in the Panchthar district (Phidim), and 176 households in the Jhapa district (Gauradaha) in the winter season of 2017 and 2018 (Table 1). We selected three municipalities for this survey from the three districts. Each municipality has semi-urban and rural settlements, with distinctive variations in the energy availability. The distribution of grid electricity was uneven and only available in temperate and sub-tropical regions. All households in the sub-tropical region and only 60% of the households in the temperate region were connected to grid electricity at the time of the survey. Inhabitants of cold regions use electricity from locally generated micro-hydroelectric power plants and standalone photovoltaic solar power.
The questionnaire was based on information on the types and sources of energy and types of cooking stoves used in the study areas. Questions related to feelings and preference of their cooking fuels used were also asked to understand their opinions. The cook stoves available in the study were classified as traditional cook stoves, improved cooking stoves, LPG stoves, biogas stoves, and electric rice cookers. Kerosene and animal dung were not used as cooking fuels in the surveyed households.
2.3. Classification of the Use of Traditional, Mix, and Commercial Fuels in Households
Based on the cook stoves used in the study areas, this study categorised all the surveyed households into one of the three types of fuel-using households: traditional fuel-using households with traditional cook stoves and improved cook stoves used only with traditional biomass fuels, such as firewood and agricultural residue; mixed fuel-using households with multiple types of cooking stoves for traditional fuels, as well as for commercial fuels; and finally, commercial fuel-using households with cook stoves only compatible with modern commercial fuels, such as electricity and LPG [16].
3. Results and Discussion
3.1. Per-Capita Electricity Consumption
Electricity is a modern energy resource used for various purposes with modern technology. In Nepal, almost all the electricity is generated via clean hydroelectric resources. Access to electricity is a determining factor for improving quality of life. There has been a recent substantial increase in the electrification rate, reaching up to 82% of the population in 2016 [17]. In the rural areas of developing countries, people use electricity for lighting and charging mobiles. In contrast, in urban areas, people also use electricity for cooking, as well as for mechanical heating and cooling purposes [10].
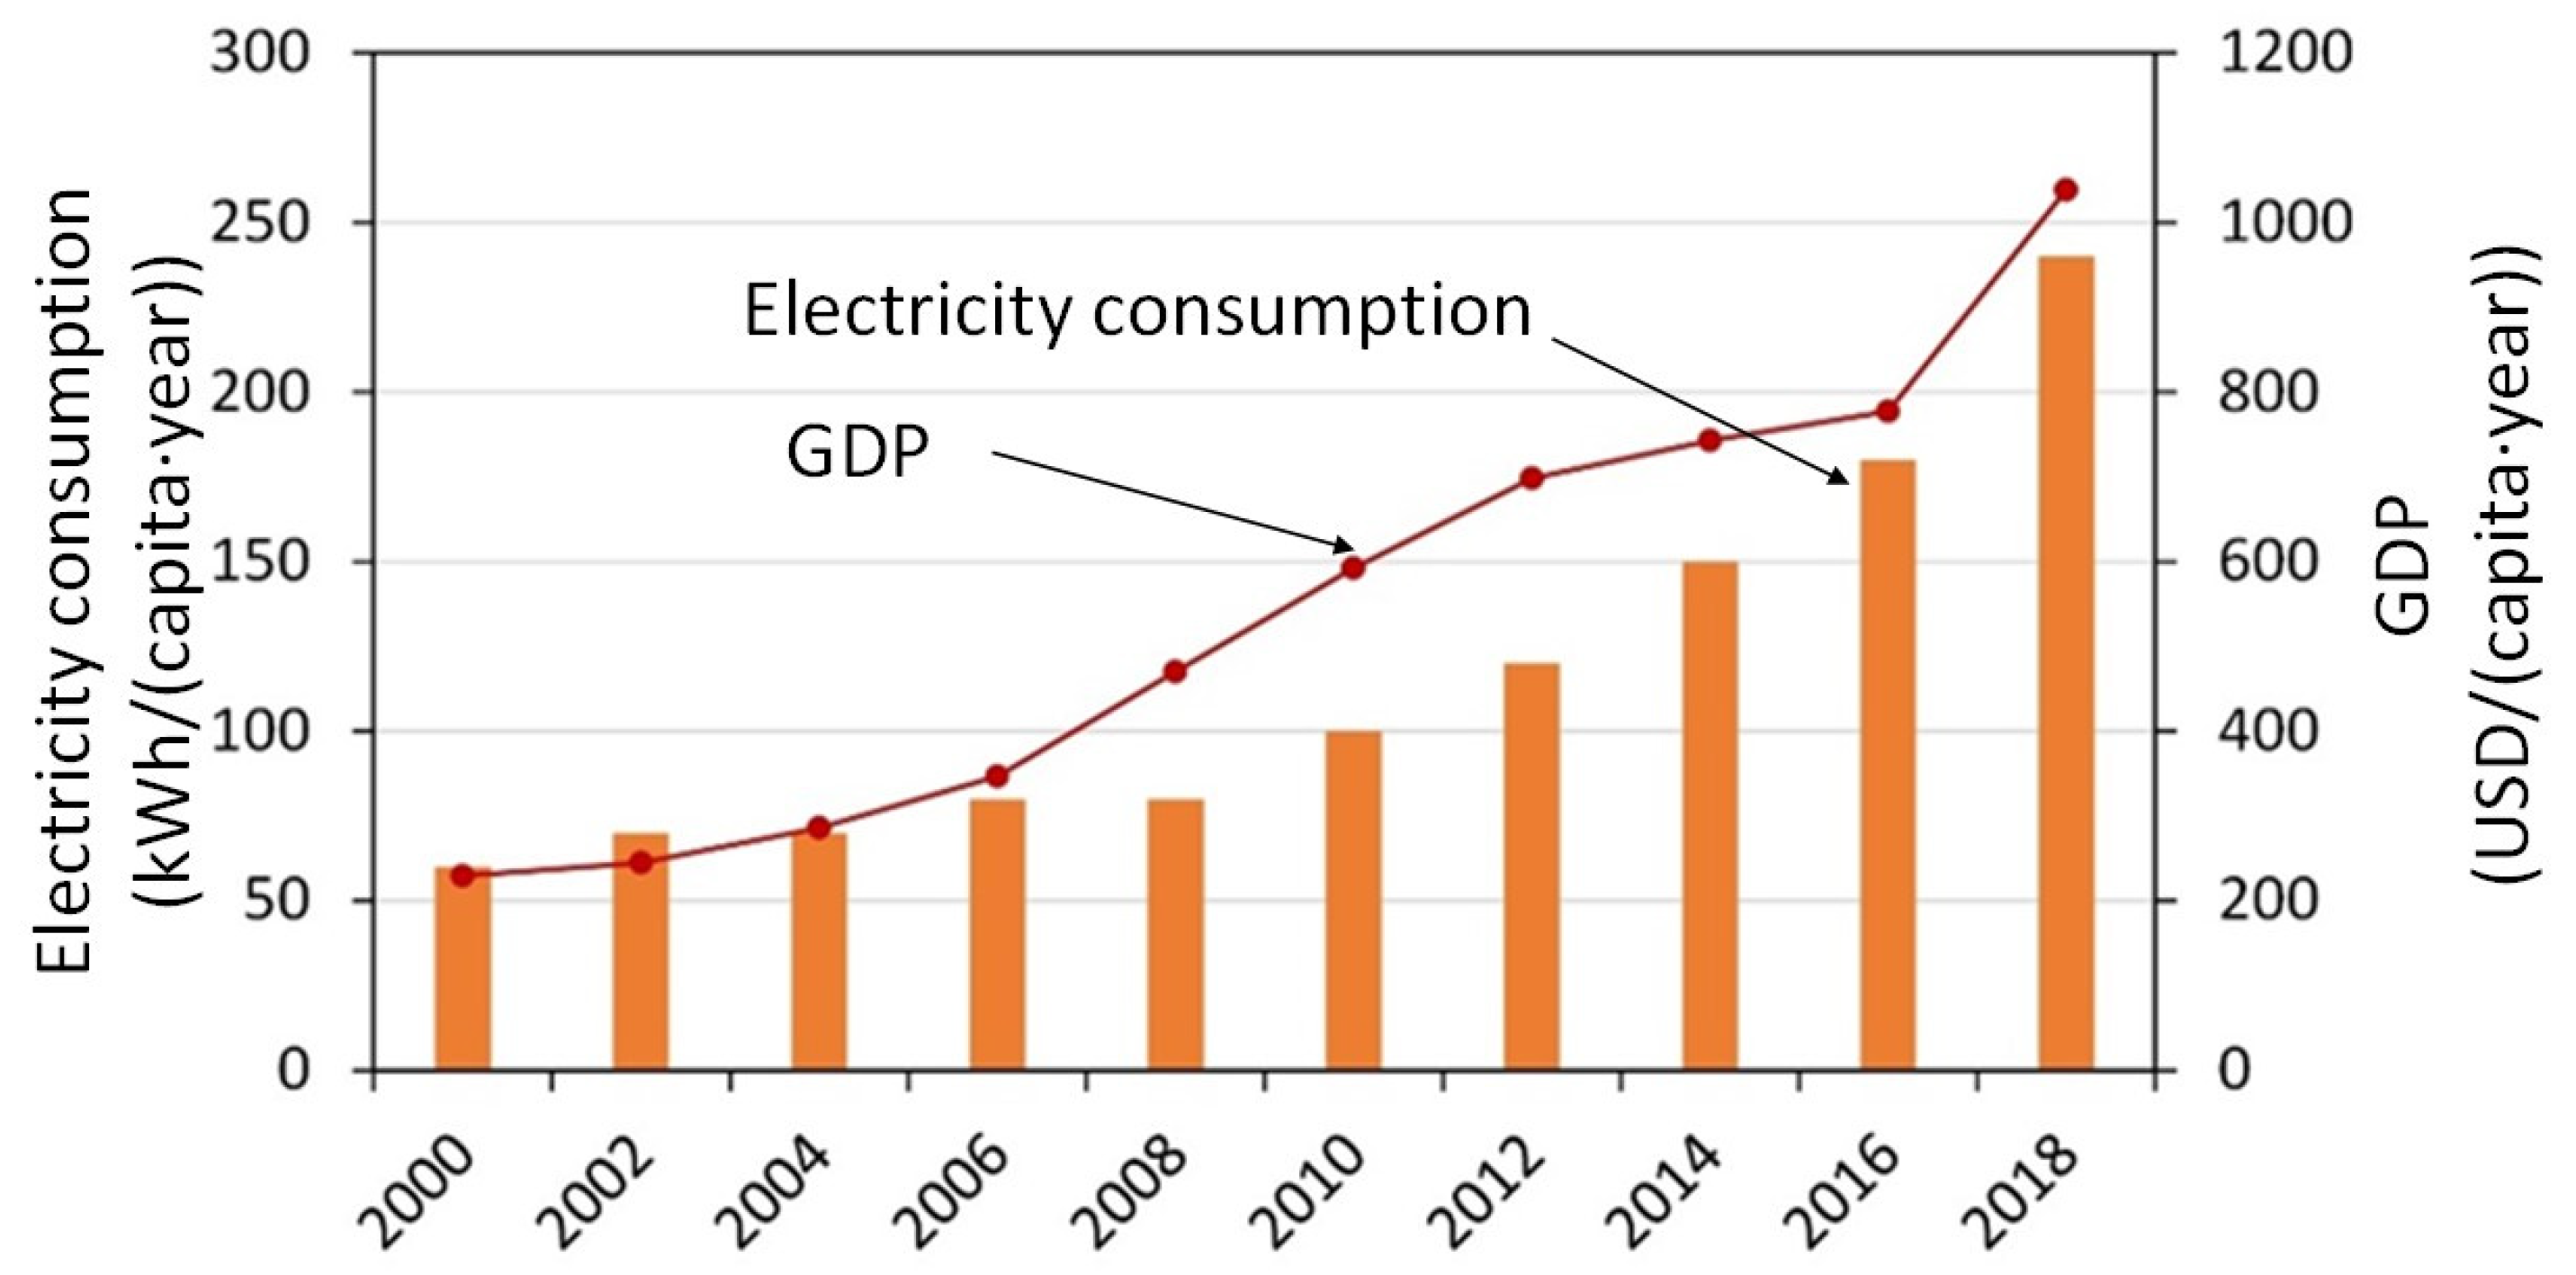
Figure 2 shows the annual rate of per-capita electricity consumption and per-capita gross domestic production (GDP) from 2000 to 2018 in Nepal. Vertical bars show the per-capita electricity consumption and the line graph shows the GDP. Both values appear to have grown steadily during that period. The per-capita electricity consumption increased from 63 kWh/y in 2000 to 238 kWh/y in 2018; however, this per-capita electricity consumption still remains the lowest among contemporary global societies. These data imply that per-capita electricity consumption will substantially increase over the next decade and it will increase the electricity demand of the country. A recent study carried out by using energy modelling predicted that per-capita electricity consumption of Nepal will increase to 496 kWh in 2025 and 1070 kWh in 2030 [18]. The electricity demand forecast report also predicted similar increasing trends of future electricity demand [10].
Table 2 presents the per-capita energy consumption of some neighbouring countries and the global average. This shows that Nepal consumes marginally less per-capita electricity than other developed and developing countries. Several reasons are associated with the low per-capita electricity consumption in Nepal. First, Nepal relies heavily on locally available traditional energy sources, such as firewood and agricultural residues, which represent 78% of the total energy consumption in Nepal [19,20]. Second, low-income levels and high electricity prices also impact poor people who, upon gaining access to electricity, are unable to fully use electricity for cooking and space heating. According to Poudyal et al. [18], the cost of electricity was 0.90 USD/kWh for end-users in 2018, which is among the highest in the world. Such a high price for electricity and the low-income levels may also minimise the per-capita electricity consumption. Shahi et al. [10] reported that household income has a positive correlation with electricity consumption, where low-income residents use less per-capita electricity. Third, the electricity crisis in Nepal disrupts the daily lives of individuals and businesses through frequent power outages. As a result, residents must face 12–14 h of load shedding every day, especially during the winter months [19,20]. Previous study found that people living in the extreme cold region exhibit low energy lifestyle and have adapted well to extreme cold climate [21].
In Nepal, the residential sector is the major electricity-consuming sector, accounting for nearly 87% of the total electricity consumption [15,16]. Owing to the high price, unreliable electricity supply, and the availability of firewood adjacent to their houses, most of the households that participated in our case study reported that they did not prefer to use any mechanical heating and cooling system in their houses. This revealed that an affordable price, reliable supply, and use of electricity for cooking and heating in the domestic sector may increase the per-capita electricity consumption, which can play a vital role in socioeconomic development and well-being of the residents. Low per-capita electricity-consuming countries, including Nepal, must promote the use of clean sources of electricity to the greatest extent possible, instead of traditional biomass and imported fossil fuels.
3.2. Trends in Hydroelectricity Development in Nepal
Hydropower has been considered one of the sources of clean electricity because it does not emit polluting materials into the air or onto land. Nepal is characterised by significant hydropower resources, where more than 6000 perennial rivers and rivulet flow with an average annual water runoff of 225 billion m3, thereby providing a substantial energy potential [17]. Previous studies have estimated that the feasible potential of Nepal for hydropower generation is approximately 83 GW, of which approximately 43 GW are considered technically and economically viable [19]. Hydropower development in Nepal began on 22 May 1911 with the installation of 500 kW of electricity at Pharping. However, Nepal has only harnessed 2% of its commercially feasible hydropower potential [23,24,25].
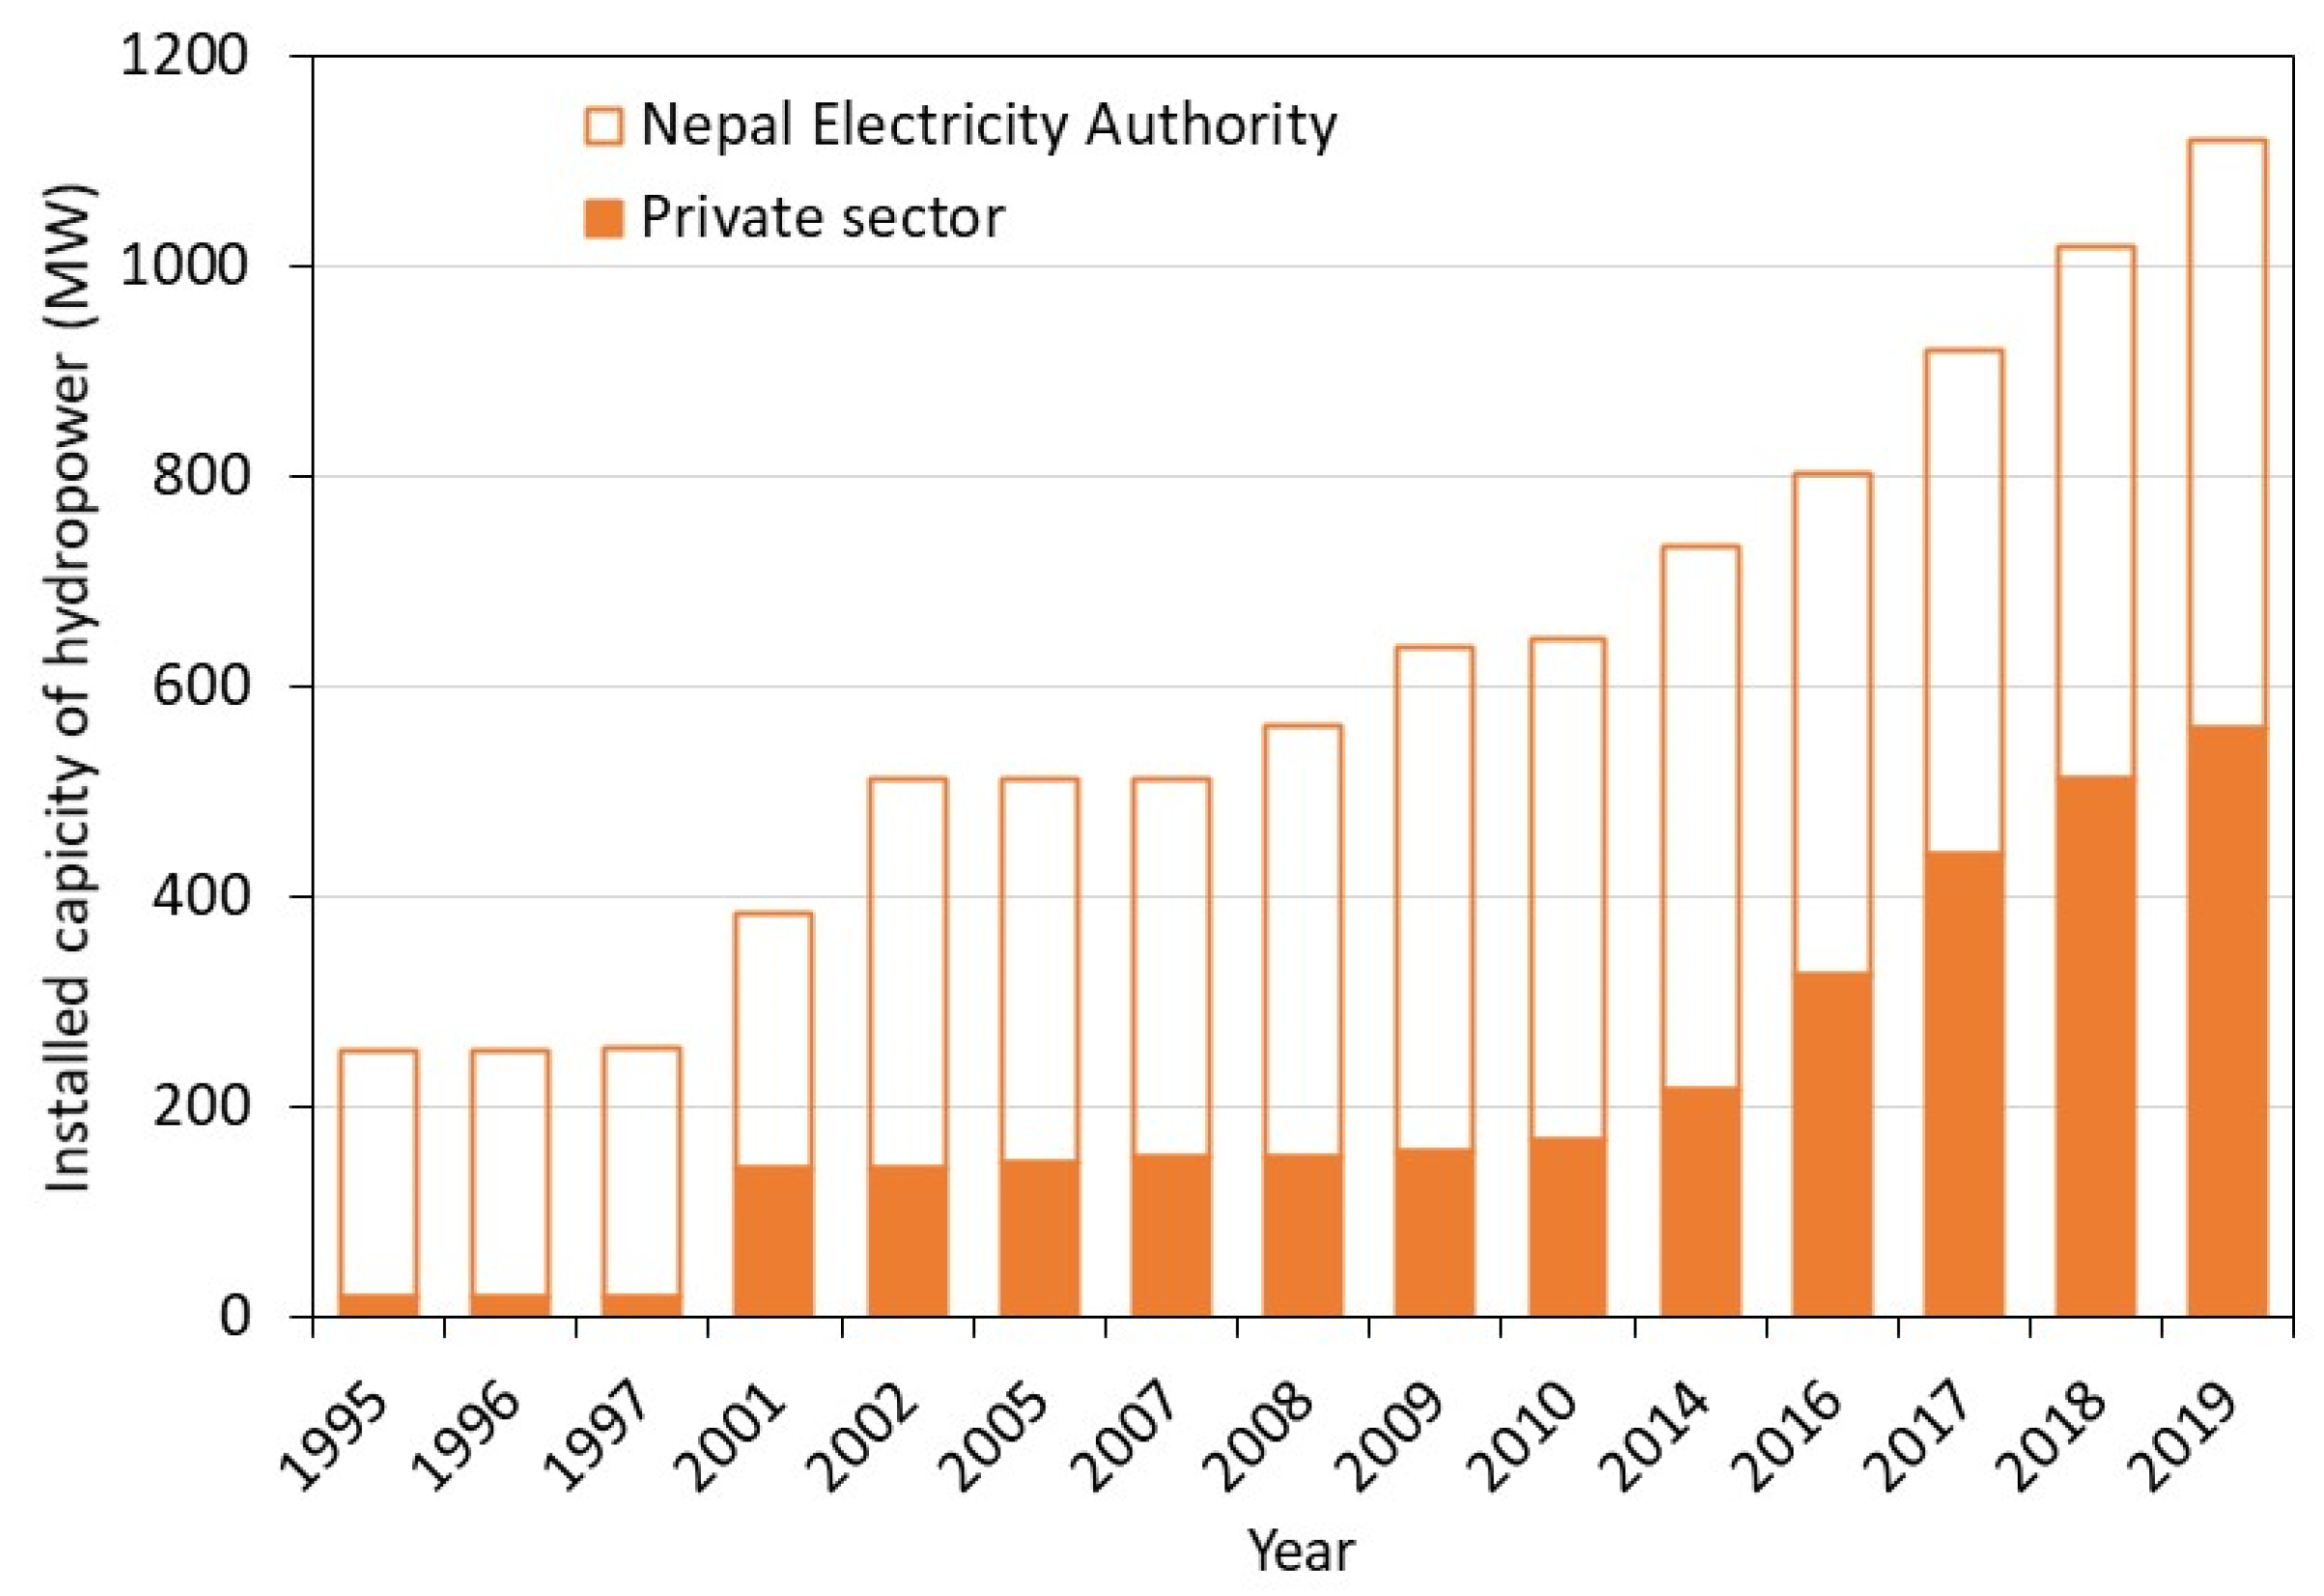
Figure 3 shows the installed capacity of hydroelectricity in Nepal from 1995 to 2019 by the NEA and the private sector. This shows that the growth in the installation capacity of hydroelectricity began to visibly occur in from 1997 to 2002, and is characterised by a continuously increasing trend. The first hydropower development policy was announced in 1992 to attract the private sector for hydropower development. The private sector started to develop hydropower projects shortly thereafter [26,27]. During 2000 and 2001, the private sector successfully completed large projects, such as Khimti Khola (60 MW) and Upper Votekoshi (45 MW)); these projects contributed to an increase in the hydroelectricity installation capacity. In 2002, the NEA also completed the 144 MW Kaligandaki hydropower project, which plays a significant role in partially fulfilling the electricity demand.
During the political unrest period, investors were not willing to take risks for hydropower development; from 2001 to 2010, the private sector was unable to develop hydropower projects [28]. After 10 years of civil war, a peace agreement was signed in 2006, and the political environment became stable, allowing hydroelectricity development. Subsequently, hydroelectricity development began to accelerate. As a result, the number of hydroelectricity projects has gradually increased since 2010. As of 2019, the installed electricity capacity in Nepal reached approximately 1120 MW, including both the private and public sectors [23,24,29]. Some other new hydropower projects are currently under development for electricity generation, which will add another 1300 MW to the national grid, creating a surplus for the export of clean hydroelectricity during the fiscal year 2020/21 [13,14].
Table 3 and Table 4 list the hydropower plants developed by the NEA and private sector with their respective locations and capacities. Hydropower development in Nepal began on 22 May 1911 with the installation of 500 kW of electricity at Pharping. In recent years, the rapidly increasing trend of hydroelectricity production in Nepal shows that the energy situation has changed to an optimistic attitude toward clean resources; however, the replacement of traditional fuels for cooking and heating is a challenging task. Energy transition toward modern clean energy sources can improve the future of Nepalese citizens in various ways. For example, the use of electricity for cooking and heating, instead of traditional fuels, can benefit millions of people with respect to respiratory health risks caused by indoor air pollution.
Moreover, fuel collection is a time-consuming task in rural societies, and its replacement by electricity can conserve a considerable amount of time. There must be improvements to the current state of low per-capita electricity consumption and the high dependency on traditional fuels for cooking and space heating. The Nepalese government must implement policies to enhance electricity use in all households for cooking and heating by providing subsidies to adopt new and clean technologies. They must also simultaneously promote clean and renewable energy development in all parts of the country.
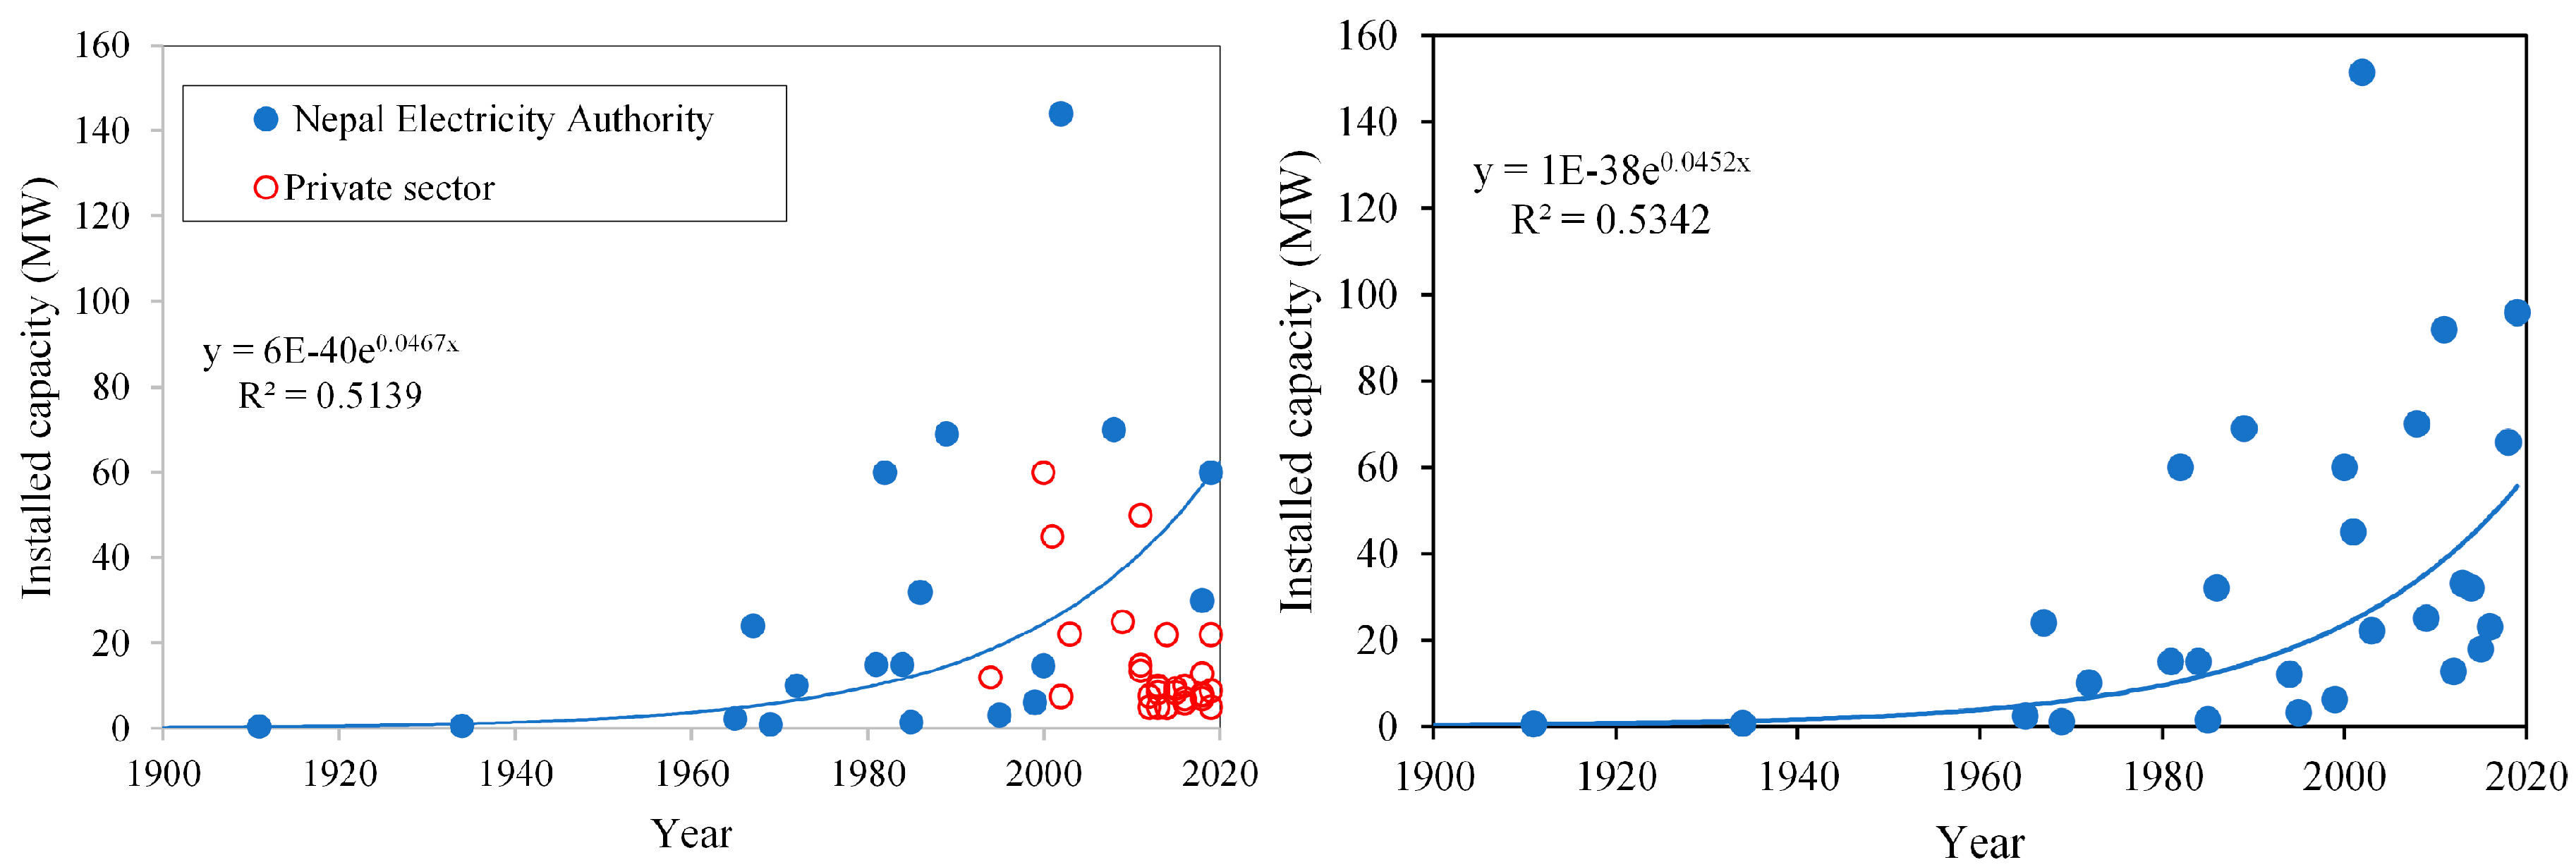
As the installed capacity of hydroelectricity growth begins slowly and then accelerate rapidly, this study carried out exponential regression analysis on installed capacity of hydroelectricity and time (year of establishment). Each plot in Figure 4a shows the installed capacity of hydroelectricity either from the NEA or private sector in the corresponding year. All values plotted in this figure were obtained from Table 3 and Table 4. However, we did not plot the small projects, less than 5 MW, which are shown in Table 4. The trend line in Figure 4a represents only the hydropower development trend of the NEA. As the number of projects developed by the private sector increases and the size decreases, it does not show a similar trend to that of the NEA. Therefore, we combined installed capacity of hydroelectricity on a yearly basis and obtained 28 plots. Figure 4b shows the yearly total installed capacity of hydroelectricity developed by both the NEA and private sector. The result showed positive correlation (r = 0.73, p < 0.001) between installed capacity and time. The regression line showed the continuous increasing trend of hydroelectricity capacity in Nepal. We speculate that, in the coming years, a significant amount of the electricity demand of the country will be fulfilled by hydroelectricity. However, it is still below the current electricity demand and this is being fulfilled by importing electricity from India [10,14].
Total electricity consumption in 2019/20 was 6422 GWh, a slight increase over the corresponding value of 6303 GWh in 2018/19, of which 22% was imported from India [30]. It suggested that current electricity production is still too low to fulfil the energy demand of the people in Nepal. Therefore, energy policy should encourage hydropower development in order to get clean energy and reduce the country’s financial burden of importing electricity and other fuels.
3.3. Installed Hydroelectricity Capacity and GDP
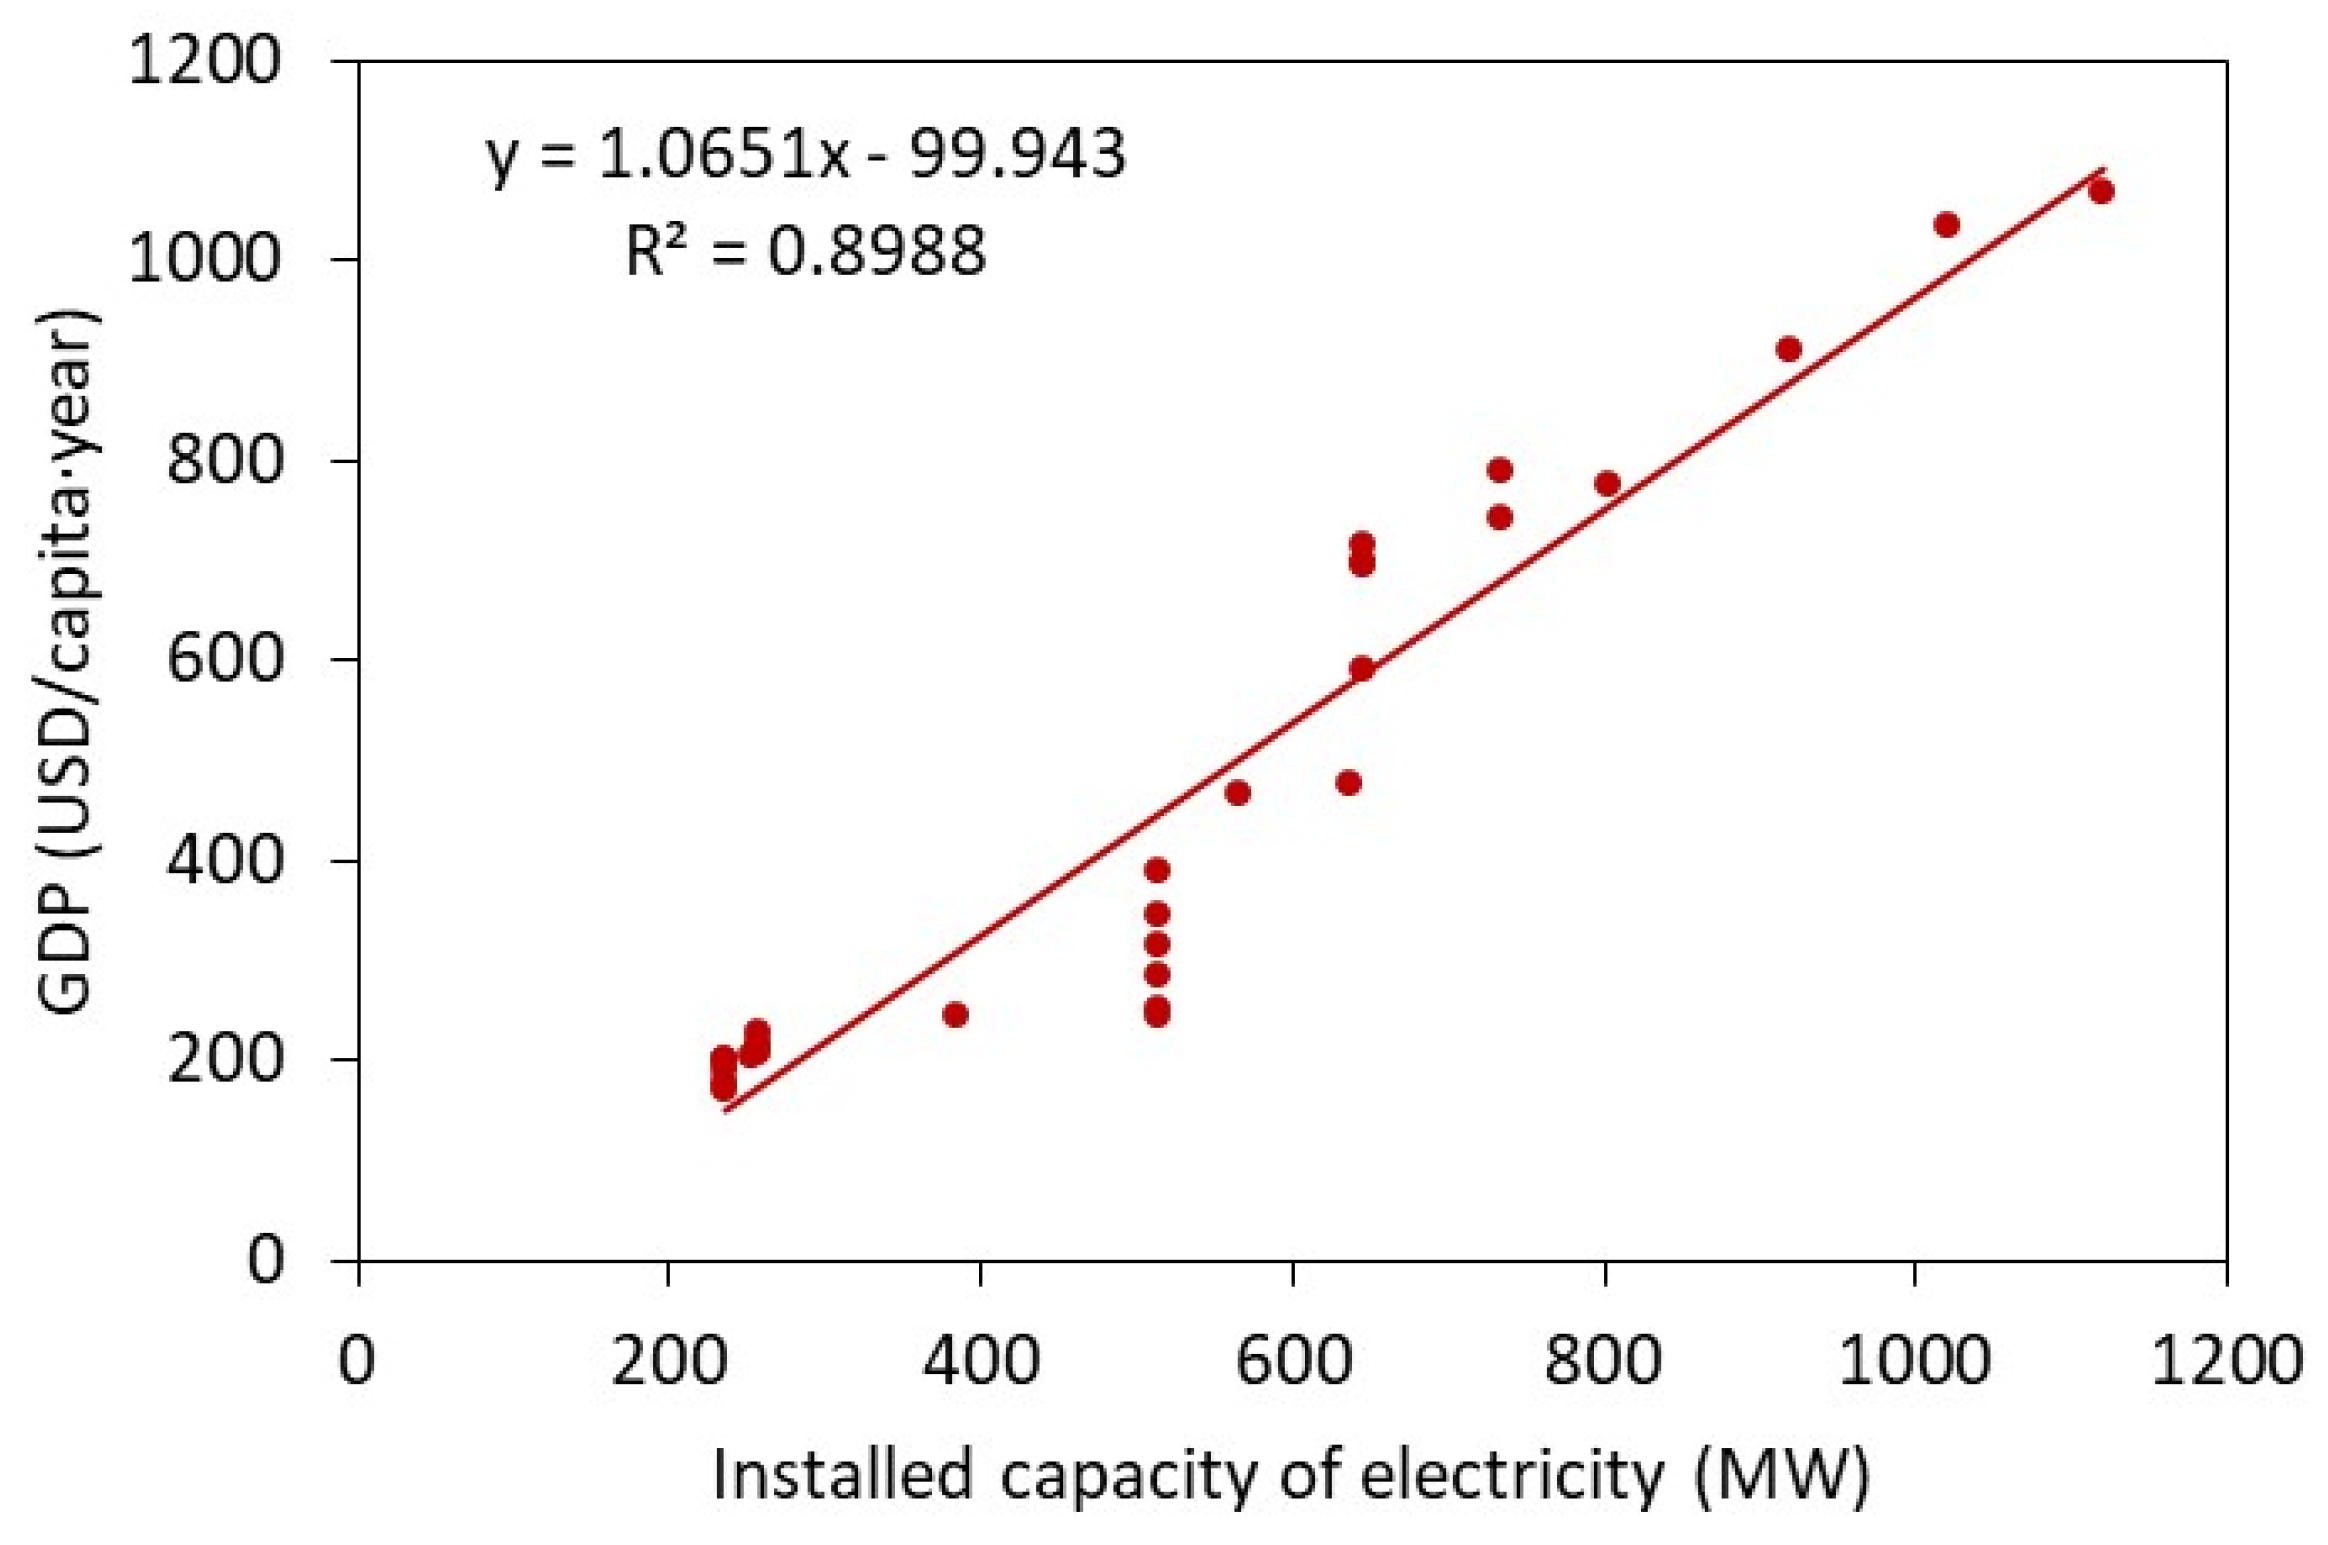
Several national policy makers and international organisations consider the availability of hydroelectricity as an engine for socioeconomic development, which can provide access to electricity, as well as stimulate economic activity and the economic growth of the country [28]. The installed hydroelectricity capacity may play an important role in increasing the GDP by providing energy impetus for industrial development. Figure 5 shows the relationship between the GDP and installed hydroelectricity capacity in Nepal. The vertical axis denotes the per-capita GDP and the horizontal axis denotes the installed hydroelectricity capacity of Nepal from 1991 to 2018. We obtained the GDP per-capita data from the World Bank data book [22] and the installed hydroelectricity capacity from NEA annual reports. We applied a linear regression model to examine the relationship between GDP per-capita as a dependent variable and installed hydroelectricity capacity as an independent variable. The GDP appears to have a good linear correlation with the installed hydroelectricity capacity in Nepal.
As the installed capacity increases, the GDP per capita also increases significantly (r = 0.95, p < 0.001), indicating that with the rise in the installed hydroelectricity capacity, the GDP per capita must increase to a higher level. Nevertheless, the energy sector of Nepal faces two serious problems. The first is an excessive dependence on the use of traditional energy sources, such as firewood and agricultural residues, which is one of the main causes of economic, environmental, and health threats. The second is the highly uneven access to modern energy services and low rate of clean energy (electricity and LPG) consumption [22], both of which are highly dependent on the level of socioeconomic development and societal well-being. This result indicates that increasing the installed hydroelectricity capacity in Nepal is necessary to achieve socioeconomic growth and subsequent rational modernisation.
3.4. Alternative Energy Access and Clean Cooking Technology
Achieving affordable and clean energy access for all people has been a priority of the Nepalese government for societal well-being. The AEPC is a central organisation that aims to promote alternative energy and clean cooking technology [27]. Figure 6 shows the cumulative number of households that installed biogas, solar home systems, and improved cooking stoves from 2007 to 2017 with the help of the AEPC. Figure 6 shows a continuously increasing trend. According to the AEPC, by 2019, 794,276 solar home systems, 400,432 domestic biogas plants, and 1,343,224 improved cook stoves were installed in households to provide clean energy services. Progress in the access to solar home systems and clean cooking technology has helped people reduce household indoor air pollution and lower associated health problems. Providing clean energy to the rural population remains a key priority to further reduce air pollution and emissions, which ensures the sustainable socioeconomic development of the nation. By 2014, more than 1000 micro-hydro power plants, with a total capacity of 25 MW, were installed to provide affordable and reliable electricity to rural households unable to access national grid electricity.
3.5. Current Household Cooking Fuel Access in Three Regions
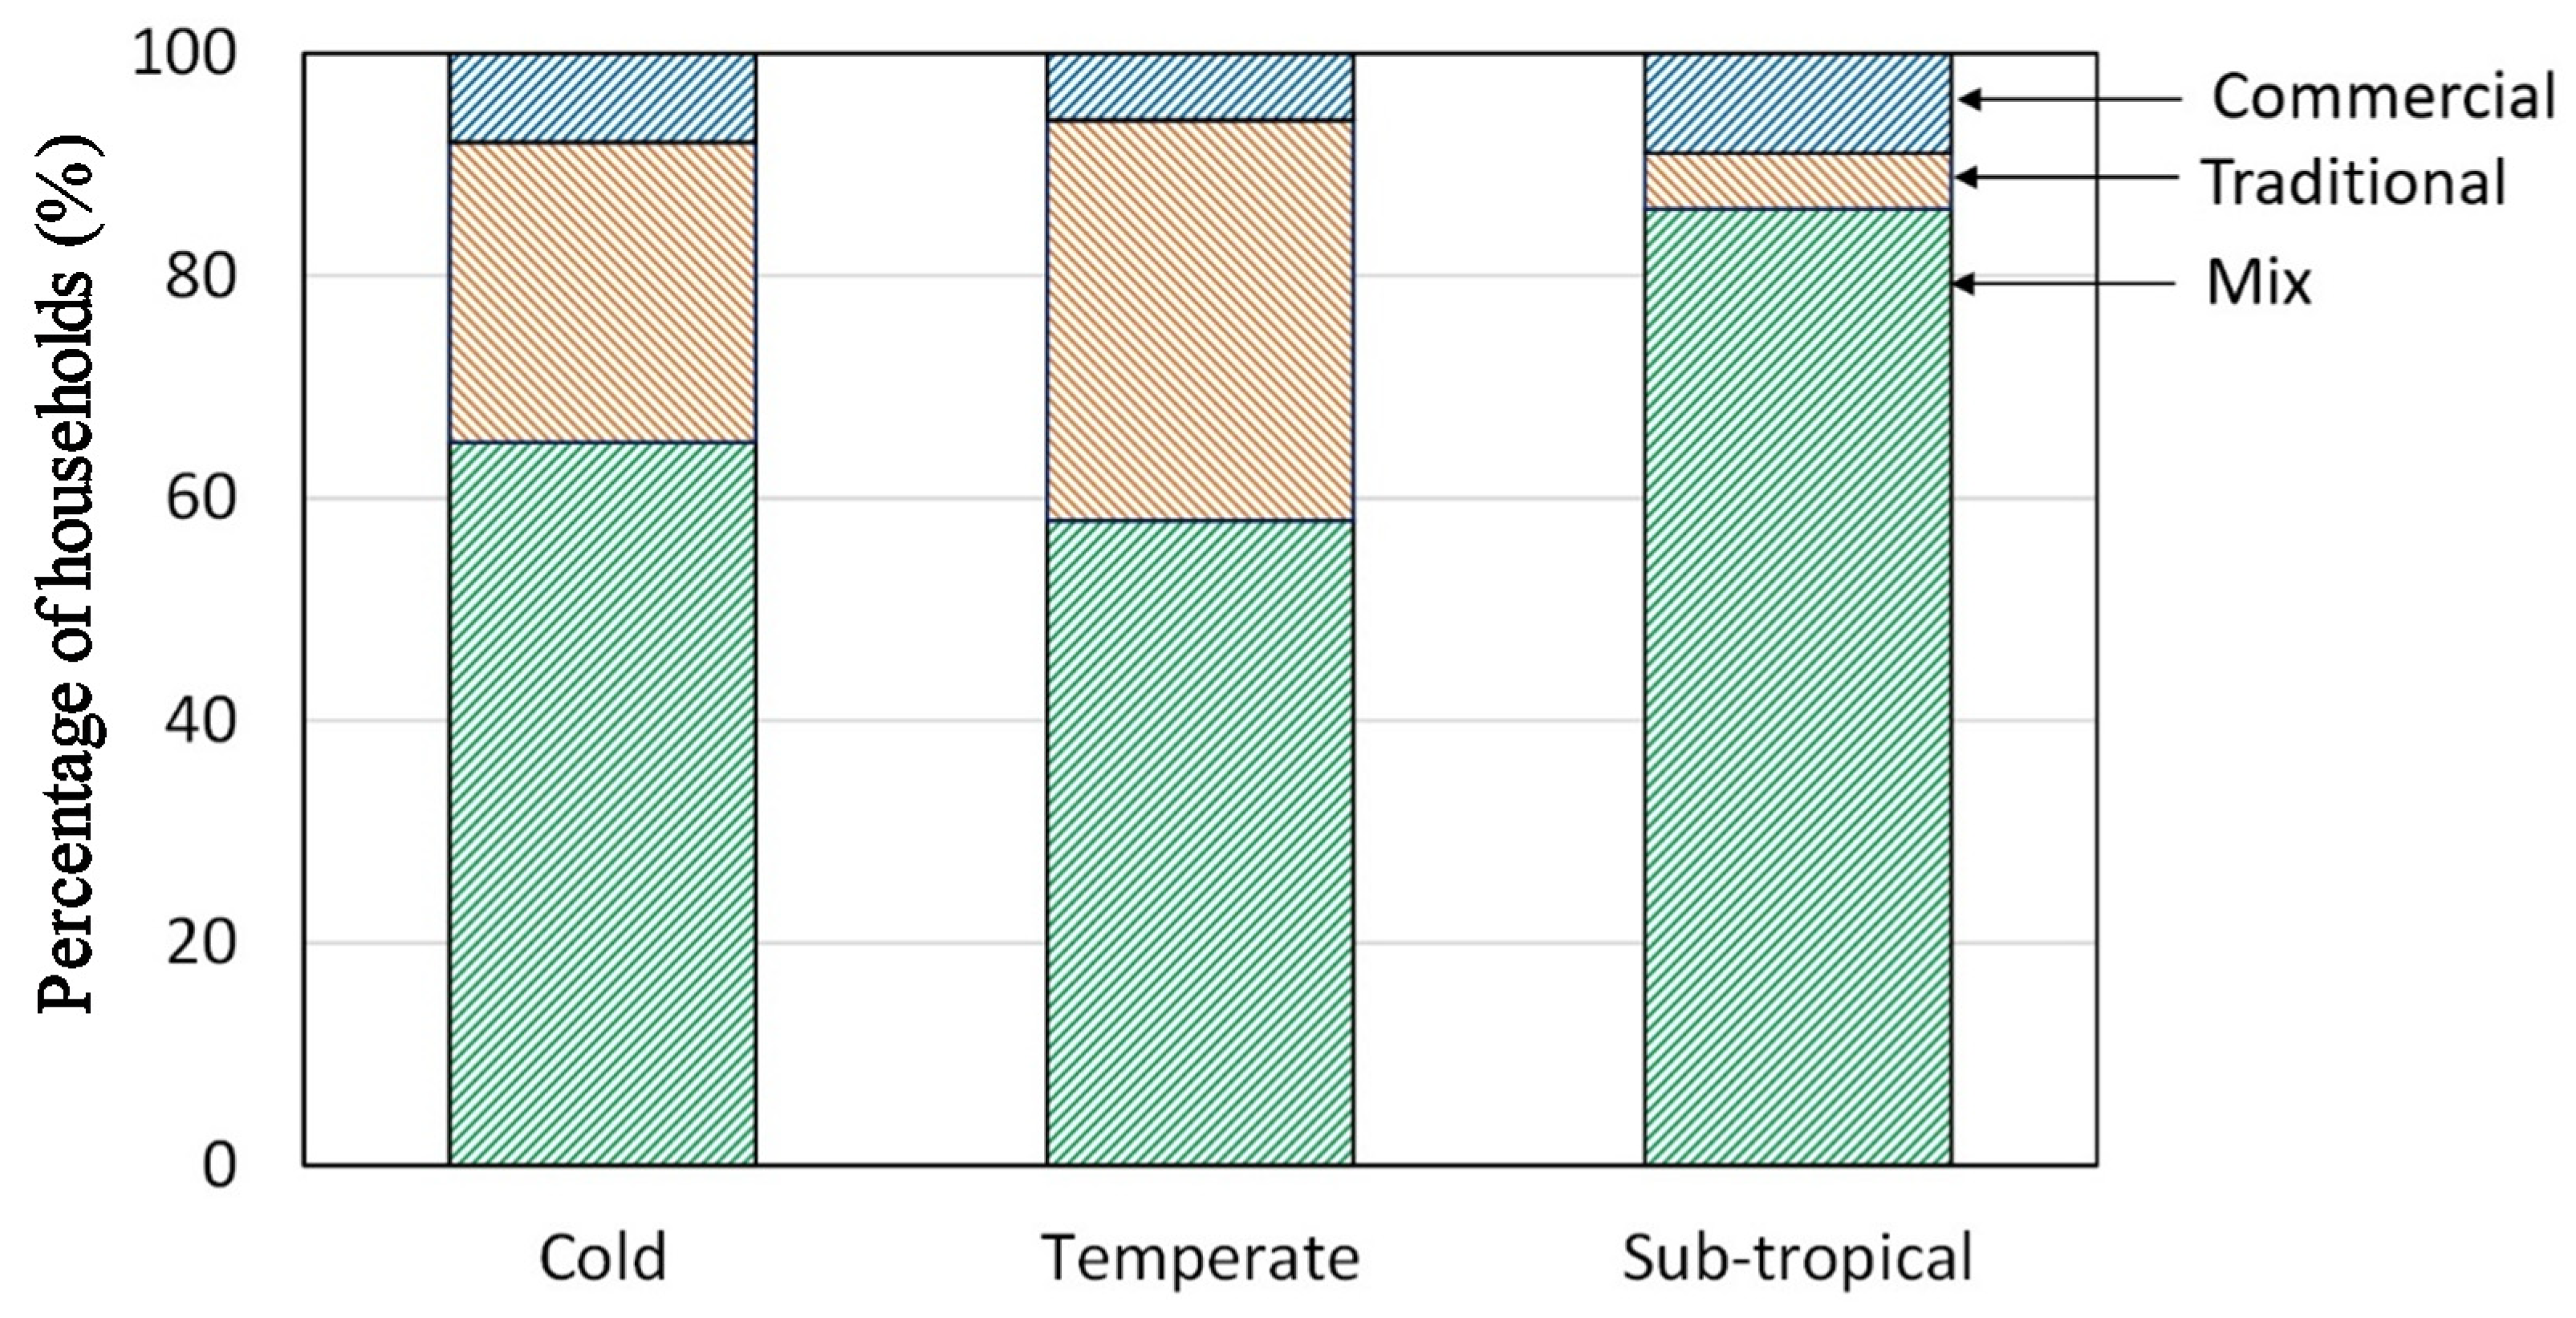
Based on the case study carried out in the three climatic regions in Nepal, the accessibility to cooking fuel was analysed. In each region, all households were categorised into traditional, mixed, and commercial fuel-using households based on the cook stoves present in each household. Figure 7 shows the percentage of traditional, mixed, and commercial fuel-using households in the three regions. In general, most of the households used mixed fuels, where the maximum number of households in all regions used both traditional and commercial fuels for everyday cooking purposes. However, the frequency of the use of clean cooking fuels varied depending on the socioeconomic conditions of each household. Only 20% of mixed fuel-using households used electricity and LPG at least once per day for cooking while the remaining households only occasionally used clean cooking fuels. The percentage of mixed fuel-using households was quite high in sub-tropical regions (86%), followed by cold regions (65%), but significantly lower in temperate regions (58%). The percentage of traditional fuel-using households declined gradually from temperate (36%) and cold (27%) regions to sub-tropical (5%) region.
The high percentage of mixed fuel-using households, low percentage of traditional fuel-using households, and high percentage of commercial fuel-using households in sub-tropical regions indicates that comparatively more households are shifting toward clean energy resources than the other two regions. Several factors may affect the energy transition patterns, such as the high accessibility of commercial fuels and the low availability of traditional fuel resources in sub-tropical region. This may be the main cause in the more rapid shift toward clean fuels than in the two other regions. This result appears to be reasonable because the sub-tropical region is more urbanised and highly populated than the other regions (see Table 1). All the investigated households in the sub-tropical region were connected to grid electricity, with easy access to other commercial fuels. The percentages of households in commercial mode were 8%, 6%, and 9% in the cold, temperate, and sub-tropical regions, respectively.
On average, 25% of the households relied on traditional cooking fuels, such as firewood and agricultural residues, while only 8% of the households relied on clean cooking fuels, such as LPG and electricity. The remaining 67% of the households relied on both traditional and commercial fuels for cooking activities. The high percentage of mixed fuel user households in all regions reveals that most of these households prefer to use a combination of clean cooking fuels and traditional sources. Ravindra et al. [31] reported that only 13% of the households in India primarily depend on clean cooking fuels, which is slightly higher than the results obtained in this study. This shows that clean cooking fuel remains relatively rare in the case study area. The most common reason for the non-adoption of clean cooking fuels was the unavailability of reliable clean fuels near the households, high installation costs, and comparatively high monthly expenditures on fuels. These factors, in addition to a lack of knowledge regarding electric cooking technology, have been reported as barriers to the adoption of electricity as a regular cooking fuel.
Table 5 shows the percentage of responses of traditional, mixed, and commercial fuel using households focused on feeling and preference of cooking fuels used. A large number of traditional and mixed fuel using households were unhappy with their cooking fuels while 40% of commercial fuel using households were happy and 40% were neutral regarding their cooking fuels. Traditional and mixed fuel using households were also aware of the harmful effect of regular use of traditional cooking fuels. However, they used traditional cooking fuels as they were not able to pay the regular cost of cooking energy. When respondents were asked about cooking fuel preference, 40%, 66%, and 94% of traditional, mixed, and commercial fuel using households would prefer to use LPG and electricity as their cooking fuels. Interestingly, 15% of traditional fuel using households did not prefer LPG and electricity as their cooking fuel. Responses from these households suggested that there was close interrelationship between socioeconomic and cultural behaviour and cooking fuel preference [32,33]. Some of these households reported that they have ability to pay for clean cooking fuels but they stated that they would prefer to use firewood. They had often mentioned that the taste of food prepared with firewood is better than other cooking fuels.
3.6. Energy Mix Shift toward Clean Resources
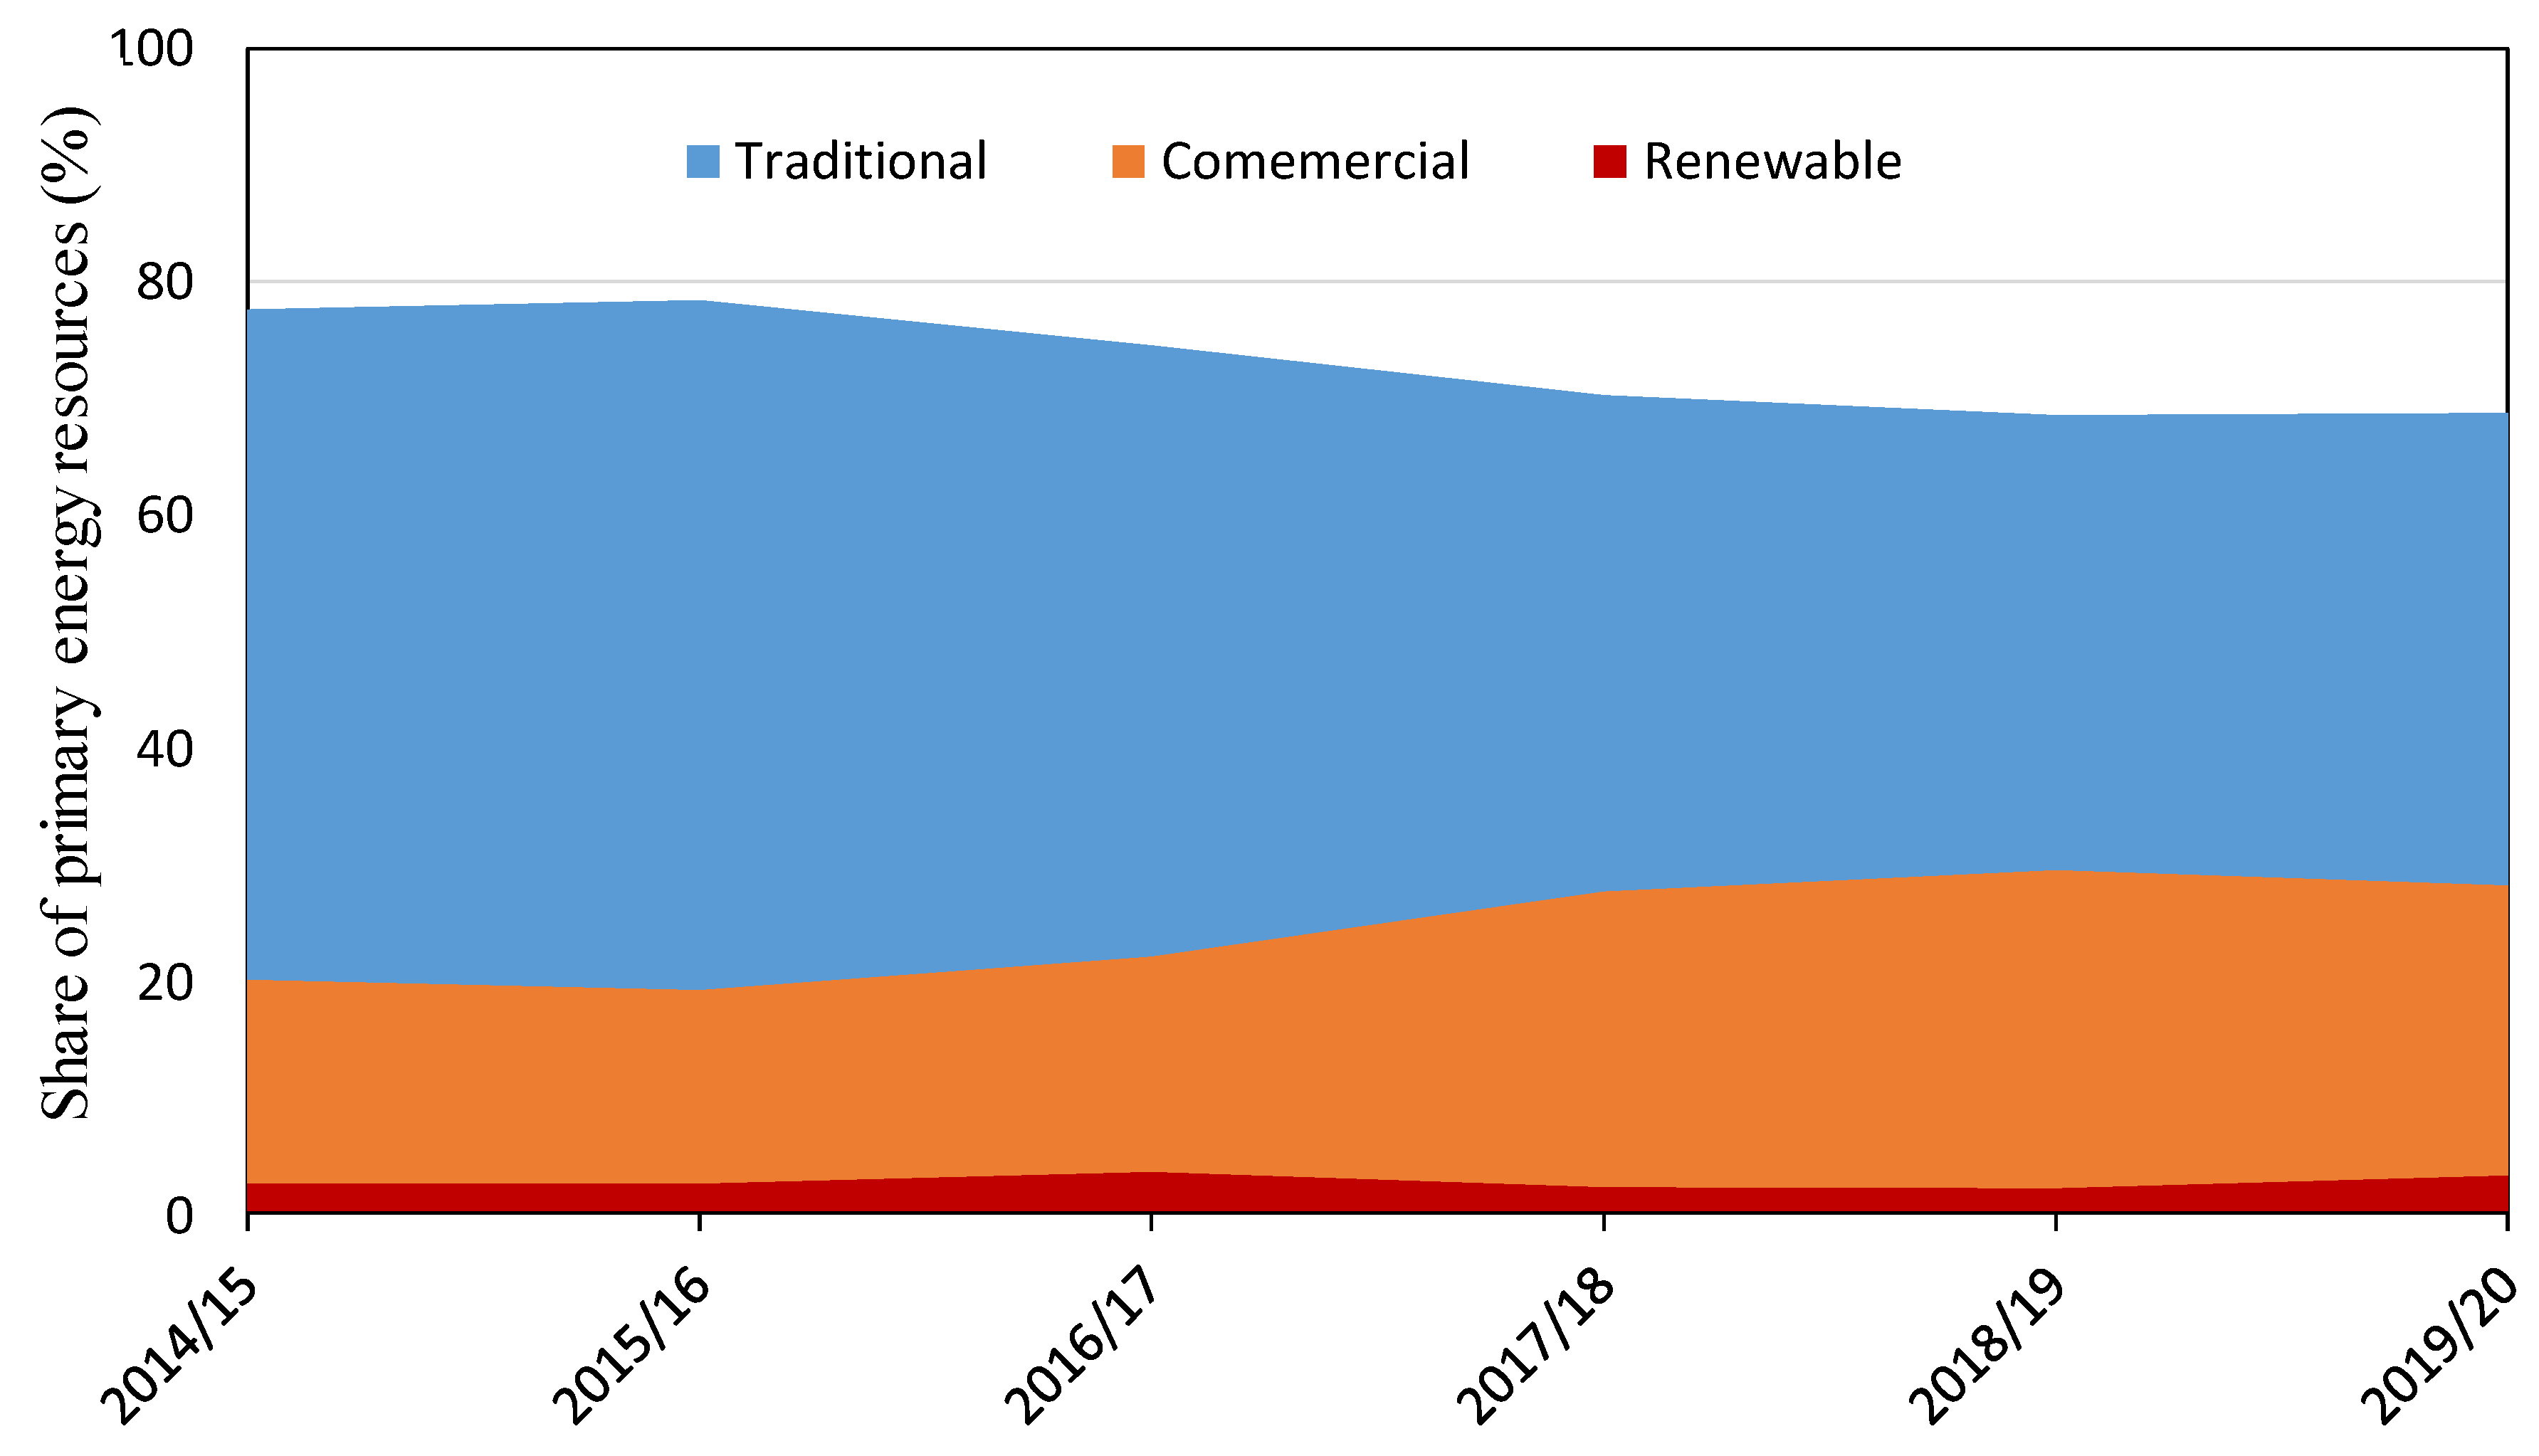
Energy mix is conceptualised as the share of various primary energy resources used to meet the energy requirement for a given reason, which can vary significantly from one country to another. The energy resources of Nepal are generally categorised into three groups: traditional energy resources, including firewood, agricultural residue, and animal dung; commercial energy resources, including modern energy resources, such as electricity, LPG, and petroleum products; and renewable energy resources, including other alternative natural resources, such as solar power, wind power, and electricity from isolated micro- and mini-hydropower plants. Commercial and renewable energy resources are considered cleaner sources of energy as compared to traditional resources. Figure 8 shows how the energy mix changed from 2014/15 to 2019/20 in Nepal. Figure 8 indicates that the energy mix has slowly and continuously changed toward commercial energy resources. The share of traditional energy resources has decreased from 78% to 68%, while that of commercial energy resources increased from 20% to 28% during that period. Renewable energy resources contribute a very low share in the primary energy supply of Nepal, which has increased from 2.5% to 3.2%. This statistic also indicates that more than half of the energy used in Nepal is fulfilled by traditional resources. Traditional energy resources are mostly used in the household sector, particularly for cooking and heating, which suggests that the Nepalese household energy sector still relies heavily on traditional fuel resources. The slower rate of energy transition toward cleaner energy resources can be attributed to the lack of reserves of coal, natural gas, or oil and insufficient electricity production to fulfil the energy demands of the country [34,35]. Hussain et al. [1] reported that Nepal has to increase its installed electrical capacity and production not only to meet the current demand, but also to meet the growing future demand for electricity. Nepal must emphasise the production and utilisation of renewable energy to enhance its energy transition toward cleaner resources.
4. Conclusions
The energy transition taking place is important to draw future consideration to enhance the socioeconomic development and to promote health and environmental condition of people, particularly those living in developing countries, but so far, it has not yet been realised very well. This study focused on energy transition patterns of Nepal based on a literature review and field survey. The findings of this study are summarized as follows.
- The rate of per-capita electricity consumption was 238 kWh/capita/year, which is lower than that of other contemporary global societies. In Nepal, due to the lack of reliable electricity, rural households rely heavily on firewood; therefore, the per-capita electricity use is the lowest in the world. An effective energy policy is required to increase the per-capita electricity consumption.
- Hydropower development is an emerging sector that provides clean energy resources in Nepal. The currently installed hydroelectricity capacity has reached 1120 MW. The increasing trend in hydroelectricity development in Nepal is expected to meet the country’s demand for cleaner energy to improve the quality of life for its citizens.
- This study showed that a significant positive relationship exists between the GDP and installed hydroelectricity capacity. As the installed hydroelectricity capacity increases, the GDP per capita tends to increase. Therefore, there is an urgent need to increase electricity production to increase the socioeconomic development of the people.
- Cleaner technologies, such as solar home systems, domestic biogas plants, and improved cook stoves, have played a vital role in minimising health and environmental problems, particularly in rural areas of Nepal where national grid electricity is not accessible.
- The field survey showed that 25% of the households relied entirely on traditional cooking fuels while 67% and 8% of the households relied on mixed and commercial cooking fuels, respectively. More traditional and mixed fuel user households were unhappy with their cooking fuels while only 20% commercial fuel using households were unhappy with their cooking fuels.
- The share of traditional energy resources has decreased from 78% to 68%, while the share of commercial energy resources increased from 20% to 28% from 2014/15 to 2019/20. This indicates that the Nepalese government must eliminate its heavy reliance on traditional energy resources by providing clean and sustainable energy resources to all citizens.
In conclusion, this study indicated that an energy transition is taking place in Nepal towards clean energy resources, particularly in providing more of its citizens with electricity access, boosting renewable energy services, and taking steps to utilize clean energy resources. However, it is still insufficient to ensure affordable, reliable, and sustainable modern energy resources for everyone by 2030. For example, large numbers of households in Nepal still rely on traditional cooking fuels and use very low electricity per-capita. Moreover, 68% of total energy consumption was still attributed to traditional sources. Thus, the government should focus on long-term energy planning to maximize hydro-electricity production and consumption to fulfil the modern lifestyle of people.
Author Contributions
Conceptualisation, data curation, methodology, data analysis, and writing of the original draft, T.R.P.; writing—review and editing, H.B.R. All authors have read and agreed to the published version of the manuscript.
Funding
This study received no external funding.
Institutional Review Board Statement
Not applicable.
Informed Consent Statement
Not applicable.
Acknowledgments
This is an independent study based on the existing energy database and field investigations of the energy transition patterns in Nepal. We extend our gratitude to the participants for providing the necessary information.
Conflicts of Interest
The authors declare no conflict of interest.
References
- Hussain, A.; Sarangi, G.K.; Pandit, A.; Ishaq, S.; Mamnun, N.; Ahmad, B.; Jamil, M.K. Hydropower development in the Hindu Kush Himalayan region: Issues, policies and opportunities. Renew. Sustain. Energy Rev. 2019, 107, 446–461. [Google Scholar] [CrossRef]
- United Nations. Sustainable Development Goal 7. 2020. Available online: https://sustainabledevelopment.un.org/sdg7 (accessed on 25 December 2020).
- Sovacool, B.; Dhakal, S.; Gippner, O.; Bambawale, M.J. Halting hydro: A review of the socio-technical barriers to hydroelectric power plants in Nepal. Energy 2011, 36, 3468–3476. [Google Scholar] [CrossRef]
- Gurung, A.; Gurung, O.; Eun Oh, S. The potential of renewable energy technology for rural electrification in Nepal: A case study from Tangting. Renew. Energy 2011, 36, 3203–3210. [Google Scholar] [CrossRef]
- Parikh, J. Hardship and health impacts on women due to traditional cooking fuels: A case study of Himachal Pradesh, India. Energy Policy 2011, 39, 7587–7594. [Google Scholar] [CrossRef]
- Parajuli, R.; Østergaard, P.A.; Dalgaard, T.; Pokharel, G.R. Energy consumption projection of Nepal: An economic approach. Renew. Energy 2014, 63, 432–444. [Google Scholar] [CrossRef]
- Malla, S. Household energy consumption pattern and its environmental implications. Energy Policy 2013, 61, 990–1002. [Google Scholar] [CrossRef]
- Fox, J. Firewood consumption in a Nepali village. Environ. Manag. 1984, 8, 243–249. [Google Scholar] [CrossRef]
- Rijal, H.B. Chapter 33, Firewood Consumption in Nepal. In Sustainable House and Living in the Hot-Humid Climates of Asia; Kubota, T., Rijal, H.B., Takaguchi, H., Eds.; Springer Nature Singapoor Pte Ltd.: Singapore, 2018; pp. 335–344. [Google Scholar]
- Shahi, D.K.; Rijal, H.B.; Shukuya, M. A study on household energy-use patterns in rural, semi-urban and urban areas of Nepal based on field survey. Energy Build. 2020, 223, 110095. [Google Scholar] [CrossRef]
- Rahut, D.B.; Das, S.; De Groote, H.; Behera, B. Determinants of household energy use in Bhutan. Energy 2014, 69, 661–672. [Google Scholar] [CrossRef]
- Pradhan, B.; Limmeechokchai, B. Electric and biogas stoves as options for cooking in Nepal and Thailand. Energy Procedia 2017, 138, 470–475. [Google Scholar] [CrossRef]
- Alam, F.; Alam, Q.; Reza, S.; Alam, S.; Saleque, K.; Chowdhury, H. A review of hydropower projects in Nepal. Energy Procedia 2017, 110, 581–585. [Google Scholar] [CrossRef]
- Acharya, B.; Adhikari, S. Household energy consumption and adaptation behaviour during crisis: Evidence from Indian economic blockade on Nepal. Energy Policy 2021, 148, 111998. [Google Scholar] [CrossRef]
- Nakarmi, A.M.; Mishra, T.; Banerjee, R. Integrated MAED–MARKAL-based analysis of future energy scenarios of Nepal. Int. J. Sustain. Energy 2016, 35, 968–981. [Google Scholar]
- Water and Energy Commission Secretariat (WECS). Energy consumption situation in Nepal year. 2014. 2011/2012.
- Zahnd, A.; Kimber, H.M. Benefits from a renewable energy village electrification system. Renew. Energy 2009, 34, 362–368. [Google Scholar] [CrossRef] [Green Version]
- Poudyal, R.; Loskot, P.; Nepal, R.; Parajuli, R.; Khadka, S.K. Mitigating the current energy crisis in Nepal with renewable energy sources. Renew. Sustain. Energy Rev. 2019, 116, 109388. [Google Scholar] [CrossRef]
- WECS. Energy Sector Synopsis Report 2010; Water and Energy Commission, Secretariat: Kathmandu, Nepal, 2010. [Google Scholar]
- Pokharael, T.R.; Rijal, H.B.; Shukuya, M. A field investigation on indoor thermal environment and its associated energy use in three climatic regions in Nepal. Energy Build. 2020, 222, 110073. [Google Scholar] [CrossRef]
- Rijal, H.B. Thermal adaptation of buildings and people for energy saving in extreme cold climate of Nepal. Energy Build. 2021, 230, 110551. [Google Scholar] [CrossRef]
- World Bank. World Development Indicators. 2020. Available online: https://databank.worldbank.org/reports.aspx?source=2&series=EG.USE.ELEC.KH.PC&country=#, (accessed on 20 December 2020).
- Shrestha, H. Facts and figures about hydropower development in Nepal. Hydro Nepal. J. WaterEnergy Environ. 2017, 20, 1–5. [Google Scholar]
- NEA. Fiscal Year 2017/18: A Year in Review; Nepal Electricity Authority (NEA): Kathmandu, Nepal,, 2018. [Google Scholar]
- Gunatilake, H.; Wijayatunga, P.; Roland-Holst, D. Hydropower Development and Economic Growth in Nepal; Asian Development Bank working paper series; Asian Development Bank: Metro Manila, Philippines, 2020; no. 70. [Google Scholar]
- Ministry of Energy, Water resources and Irrigation. Hydropower Development Policy 1992; The Government of Nepal: Kathmandu, Nepal, 1992. [Google Scholar]
- AEPC. Alternative Energy Promotion Center (AEPC), Kathmandu, Nepal. 2019. Available online: https://www.aepc.gov.np (accessed on 2 October 2019).
- Singh, R.P.; Nachtnebel, H.P.; Komendantova, N. Deployment of hydropower in Nepal: Multiple stakeholders’ perspectives. Sustainability 2020, 12, 6312. [Google Scholar] [CrossRef]
- Butchers, J.; Williamson, S.; Booke, J.; Tran, A.; Karki, P.B.; Gautam, B. Understanding sustainable operation of micro-hydropower: A field study in Nepal. Energy Sustain. Dev. 2020, 57, 12–21. [Google Scholar] [CrossRef]
- Nepal Electricity Authority (NEA). Annual Report 2019/20. Available online: https://www.nea.org.np/annual_report (accessed on 24 March 2021).
- Ravindra, M.; Kaur-Sidhu, S.; Mor, S.; John, S. Trend in household energy consumption pattern in India: A case study on the influence of socio-cultural factors for the choice of clean fuel use. J. Clean. Prod. 2013, 213, 1024–1034. [Google Scholar] [CrossRef]
- Pokharael, T.R.; Rijal, H.B. Hourly firewood consumption patterns and CO2 emission patterns in rural households of Nepal. Designs 2020, 4, 46. [Google Scholar]
- Shrestha, B.; Tiwari, S.; Bajracharya, S.; Keitsch, M. Role of gender participation in urban household energy technology for sustainability: A case of Kathmandu. Discov. Sustain. 2021, 2, 19. [Google Scholar] [CrossRef]
- Islar, M.; Brogaard, S.; Lemberg-Pedersen, M. Feasibility of energy justice: Exploring national and local efforts for energy. Energy Policy 2017, 105, 668–676. [Google Scholar] [CrossRef]
- Gurung, A.; Karki, R.; Cho, J.S.; Park, K.W.; Oh, S.E. Roles of renewable energy technologies in improving the rural energy situation in Nepal: Gaps and opportunities. Energy Policy 2013, 62, 1104–1109. [Google Scholar] [CrossRef]
Figure 1.
(a) Map of Nepal showing study area; (b) monthly mean outdoor air temperature of study area obtained from the climatological and agro-meteorological records of Damak (sub-tropical), Phidim (temperate) and Salleri (Cold).
Figure 1.
(a) Map of Nepal showing study area; (b) monthly mean outdoor air temperature of study area obtained from the climatological and agro-meteorological records of Damak (sub-tropical), Phidim (temperate) and Salleri (Cold).


Figure 4.
Hydropower development trends from 1900 to 2019; (a) number and capacity of individual hydropower plants developed by NEA and private sector and (b) total annual installed capacity of hydroelectricity in Nepal.
Figure 4.
Hydropower development trends from 1900 to 2019; (a) number and capacity of individual hydropower plants developed by NEA and private sector and (b) total annual installed capacity of hydroelectricity in Nepal.

Figure 5.
Relationship between the GDP per capita per year and installed hydroelectricity capacity in Nepal from 1991 to 2019 [22].
Figure 5.
Relationship between the GDP per capita per year and installed hydroelectricity capacity in Nepal from 1991 to 2019 [22].

Figure 6.
Cumulative distribution of biogas, solar home systems, and improved cooking stoves in Nepal (2007–2017) [27].
Figure 6.
Cumulative distribution of biogas, solar home systems, and improved cooking stoves in Nepal (2007–2017) [27].

Figure 7.
Proportion of traditional, mixed, and commercial fuel user households in the three regions.
Figure 7.
Proportion of traditional, mixed, and commercial fuel user households in the three regions.


Table 1.
General information on the study district, area and surveyed houses.
| Classification | Description | Cold (Solukhumbu) | Temperate (Panchthar) | Sub-Tropical (Jhapa) |
|---|---|---|---|---|
| District | Total population (persons) | 105,885 | 191,817 | 812,650 |
| Population density (people/km2) | 39 | 150 | 510 | |
| Area (km2) | 3312 | 1241 | 1606 | |
| Availability of grid electricity | No | Yes | Yes | |
| Access to black-topped roads | Yes | Yes | Yes | |
| Study area | Altitude (m) | 2413 | 1376 | 300 |
| No. of houses | 76 | 262 | 176 | |
| Survey period | 8–14 Jan. 2018 | 29 Dec. 2017 to 6 Jan. 2018 | 16–24 Dec. 2017 |
Table 2.
Comparison of per-capita electricity consumption in neighbouring countries [22].
Table 2.
Comparison of per-capita electricity consumption in neighbouring countries [22].
| Year | Per-Capita Electricity Consumption (kWh/(Capita·Year)) | |||||
|---|---|---|---|---|---|---|
| World Average | India | Bangladesh | China | Japan | Nepal | |
| 2000 | 2300 | 400 | 100 | 1000 | 8100 | 60 |
| 2010 | 2900 | 600 | 300 | 3000 | 8100 | 100 |
| 2018 | 3300 | 1000 | 500 | 4900 | 7600 | 230 |
| Name | Installed Capacity (MW) | Year Established | Location (District) |
|---|---|---|---|
| Upper Trisuli 3A | 60.0 | 2019 | Rasuwa and Nuwakot |
| Chameliya | 30.0 | 2018 | Darchula |
| Middle Marsyangdi | 70.0 | 2008 | Lamjung |
| Kaligandaki A | 144.0 | 2002 | Syangja |
| Modi Khola | 14.8 | 2000 | Parbat |
| Puwa Khola | 6.2 | 1999 | Ilam |
| Chatara | 3.2 | 1995 | Sunsari |
| Marsyangdi | 69.0 | 1989 | Tanahu |
| Kulekhani-Ⅱ | 32.0 | 1986 | Makawanpur |
| Seti | 1.5 | 1985 | Kanski |
| Devighat | 15.0 | 1984 | Nuwakot |
| Kulekhani-Ⅰ | 60.0 | 1982 | Makawanpur |
| Gandak | 15.0 | 1981 | Nawalparasi |
| Sunkoshi | 10.1 | 1972 | Sindhupalchwk |
| Fewa | 1.0 | 1969 | Kanski |
| Trisuli | 24.0 | 1967 | Nuwakot |
| Panauti | 2.4 | 1965 | Kavrepalnchok |
| Sundarijal | 0.6 | 1934 | Kathmandu |
| Pharping | 0.5 | 1911 | Kathmandu |
| Total | 559.3 |
| Name | Installed Capacity (MW) | Year Established | Location (District) |
|---|---|---|---|
| Rudi Khola A | 8.8 | 2019 | Lamjung and Kaski |
| Bagmati Khola small | 22.0 | 2019 | Makwanpur and Lalipur |
| Pikhuwa Khola | 5.0 | 2019 | Bhojpur |
| Molung Khola | 7.0 | 2018 | Okhaldhunga |
| Madkyu Khola | 13.0 | 2018 | Kaski |
| Super Mai | 7.8 | 2018 | Ilam |
| Mai Sana Cascade | 8.0 | 2018 | Ilam |
| Mai Cascade | 7.0 | 2016 | Ilam |
| Upper Mai Khola | 10.0 | 2016 | Ilam |
| Daraudi Khola A | 6.0 | 2016 | Gorkha |
| Andhi Khola | 9.4 | 2015 | Syangza |
| Naughad gad Khol | 8.5 | 2015 | Darchula |
| Mailung Khola | 5.0 | 2014 | Rasuwa |
| Mai Khola | 22.0 | 2014 | Ilam |
| Upper Hugdi Khola | 5.0 | 2014 | Gulmi |
| Lower MadiⅠ | 10.0 | 2013 | Parbat |
| Sipring Khola | 9.7 | 2013 | Dolakha |
| Tadi Khola (Thaprek) | 5.0 | 2013 | Nuwakot |
| Ankhu Khola-Ⅰ | 8.4 | 2013 | Dhading |
| Jogmai | 7.6 | 2012 | Ilam |
| Upper Mai C | 5.1 | 2012 | Ilam |
| Upper Marsyangdi A | 50.0 | 2011 | Lamjung |
| Hewa Khola A | 14.9 | 2011 | Panchthar |
| Thapa Khola | 13.6 | 2011 | Mygdi |
| Upper Madi | 25.0 | 2009 | Kaski |
| Chilime | 22.1 | 2003 | Rasuwa |
| Indrawati-Ⅲ | 7.5 | 2002 | Sindhupalchok |
| Upper Bhotekoshi | 45.0 | 2001 | Sindhupalchowk |
| Khimti Khola | 60.0 | 2000 | Dolakha |
| Jhimruk Khola | 12.0 | 1994 | Pyuthan |
| Small projects, less than 5 MW | 120.4 | ||
| Total | 560.8 |
Table 5.
Percentage of responses of traditional, mix and commercial fuel using households.
| Questions | Scale | Proportion of Fuel Using Households (%) | ||
|---|---|---|---|---|
| Traditional | Mix | Commercial | ||
| Are you happy with cooking fuel being used in your house? | Yes | 8 | 22 | 40 |
| Neutral | 15 | 30 | 40 | |
| No | 77 | 48 | 20 | |
| Would you prefer to use LPG and electricity as cooking fuel? | Yes | 40 | 66 | 94 |
| Neutral | 45 | 20 | 0 | |
| No | 15 | 14 | 6 | |
Publisher’s Note: MDPI stays neutral with regard to jurisdictional claims in published maps and institutional affiliations. |
© 2021 by the authors. Licensee MDPI, Basel, Switzerland. This article is an open access article distributed under the terms and conditions of the Creative Commons Attribution (CC BY) license (https://creativecommons.org/licenses/by/4.0/).
Share and Cite
MDPI and ACS Style
Pokharel, T.R.; Rijal, H.B. Energy Transition toward Cleaner Energy Resources in Nepal. Sustainability 2021, 13, 4243. https://0-doi-org.brum.beds.ac.uk/10.3390/su13084243
AMA Style
Pokharel TR, Rijal HB. Energy Transition toward Cleaner Energy Resources in Nepal. Sustainability. 2021; 13(8):4243. https://0-doi-org.brum.beds.ac.uk/10.3390/su13084243
Chicago/Turabian StylePokharel, Tika Ram, and Hom Bahadur Rijal. 2021. "Energy Transition toward Cleaner Energy Resources in Nepal" Sustainability 13, no. 8: 4243. https://0-doi-org.brum.beds.ac.uk/10.3390/su13084243
Note that from the first issue of 2016, this journal uses article numbers instead of page numbers. See further details here.