
Flood Hazard Assessment Mapping in Burned and Urban Areas


1
Department of Geography and Climatology, Faculty of Geology and Geoenvironment, National and Kapodistrian University of Athens, University Campus, 15784 Athens, Greece
2
Department of Geology, Division of General Marine Geology and Geodynamics, University of Patras, 26504 Rio Patras, Greece
3
Laboratory of Geoenvironmental Science and Environmental Quality Assurance, Department of Civil Engineering, University of West Attica, 12244 Athens, Greece
*
Author to whom correspondence should be addressed.
Sustainability 2021, 13(8), 4455; https://0-doi-org.brum.beds.ac.uk/10.3390/su13084455
Submission received: 21 March 2021
/
Revised: 11 April 2021
/
Accepted: 14 April 2021
/
Published: 16 April 2021
(This article belongs to the Special Issue Natural and Technological Hazards in Urban Areas: Assessment, Planning and Solutions)
Abstract
:This study proposes a simple method to produce a flood hazard assessment map in burned and urban areas, where primary data are scarce. The study area is a municipal unit of Nea Makri, a coastal part of the eastern Attica peninsula (central Greece), which has been strongly urbanized and suffered damage from urban fires in 2018. Six factors were considered as the parameters most controlling runoff when it overdraws the drainage system’s capacity. The analytical hierarchy process (AHP) method and a geographical information system (GIS) were utilized to create the flood hazard assessment map. The outcome revealed that the areas with highest flood hazard are distributed in the eastern and southern parts of the study area, as a result of the combination of lowlands with gentle slopes, torrential behavior of the streams, streams covered by construction, increasing urbanization and burned areas. The uncertainty and the verification analyses demonstrate a robust behavior for the model predictions, as well as reliability and accuracy of the map. Comparing the existing urban fabric and road network to the potential flood hazard areas showed that 80% of the urban areas and 50% of the road network were situated within areas prone to flood. The method may be applied to land use planning projects, flood hazard mitigation and post-fire management.
1. Introduction
The Earth landscape is a result of the interaction of several parameters, such as the geomorphic process, climate and human activity. Natural hazards are physical events, able to influence the natural and human environment significantly. In this context, the morphological changes of landforms due to natural disasters can restrict human interaction with the ecosystem [1,2,3,4,5,6,7,8,9,10,11,12].
Floods have affected the natural environment, before humans’ appearance on Earth. Nowadays, they are considered natural hazards and a significant global problem threatening human life [13,14].
Floods have a significant impact on the development of a region. Historically, floods have large consequences for individuals and communities which include loss of human life, damage to buildings and infrastructure, destruction of crops, disruption to social affairs and loss of livestock [15,16].
In Europe, floods are among the most expensive types of natural disasters with costs about €4 billion per year over the period 2000–2020. Flooding is less significant in inner continental countries compared to Mediterranean countries [17].
On the other hand, floods after a fire are typically more extensive than before wildfires. Worldwide, fires burn more than 300 Mha h−1 per year, and in the Euro-Mediterranean region, wildfires burn about 450,000 ha per year [18,19,20]. Greece in particular experienced unusually high burned areas in 2007 and 2018. In the aftermath of wildfires, all surrounding and impacted areas are at risk of flooding for several years. Damaged areas are left without the vegetation that can help absorb rainfall. Wildfires dramatically change the landscape and the hydrologic response of a watershed and thus, a simple storm can cause extreme flash floods [21,22]. Another invisible threat is the deposited ash layer which contains potentially toxic elements [23]. However, much work should be performed on the topic of the impact of wildfire ash on human health and ecological terrestrial receptors [23,24,25].
Burned areas, along with human activities, influence flooding. Proactive planning is among the powerful tools to minimize losses and reduce the economic impact that accompanies floods’ occurrence. Moreover, accurate spatial data related to the distribution of floods are a powerful tool for planers and engineers to decide whether or not the land of an area is safe for urban development [3,13,20,21,22,26,27].
Flood peaks, depths, volumes and mapping of flood hazard areas may be estimated by applying hydrologic and hydraulic–hydrodynamic models. Their produced flood hazard maps linked to the probability of occurrence of a flooding phenomenon in a certain period of time [28,29,30]. On the other hand, these models involve data that in many cases are often unavailable. Alternatively, several researchers have used deterministic methods to define flood-prone areas [27,28,31,32]. A deterministic method, proposed by [33] is the analytical hierarchy process (AHP) method, which is a multi-criteria decision-making technique. It is a weight evaluation procedure which uses qualitative and quantitative criteria to evaluate alternative solutions for a particular problem, among which the most suitable solution is selected [34,35]. Besides, the AHP can easy couple with a geographical information system (GIS) to estimate natural hazard maps. However, the AHP method cannot identify the uncertainty associated with spatial outputs [36,37].
This study’s main scope is to propose a method to produce a flood hazard map in burned and urban areas. Hence, a coastal part of the northeastern Attica peninsula in central Greece has been selected as the case study. The study area is a part of the Athens metropolitan area and has been affected by extreme summer fires in the recent past.
To achieve this goal, geomorphologic, geologic and land use data affecting flood events were considered. These factors were evaluated by using the AHP method and GIS capabilities and their uncertainty was assessed by using a sensitivity analysis. Previous floods which occurred in the study area were utilized for the validation of the flood hazard map. As a last step, the urban activities were evaluated with the produced flood hazard map.
2. Materials and Methods
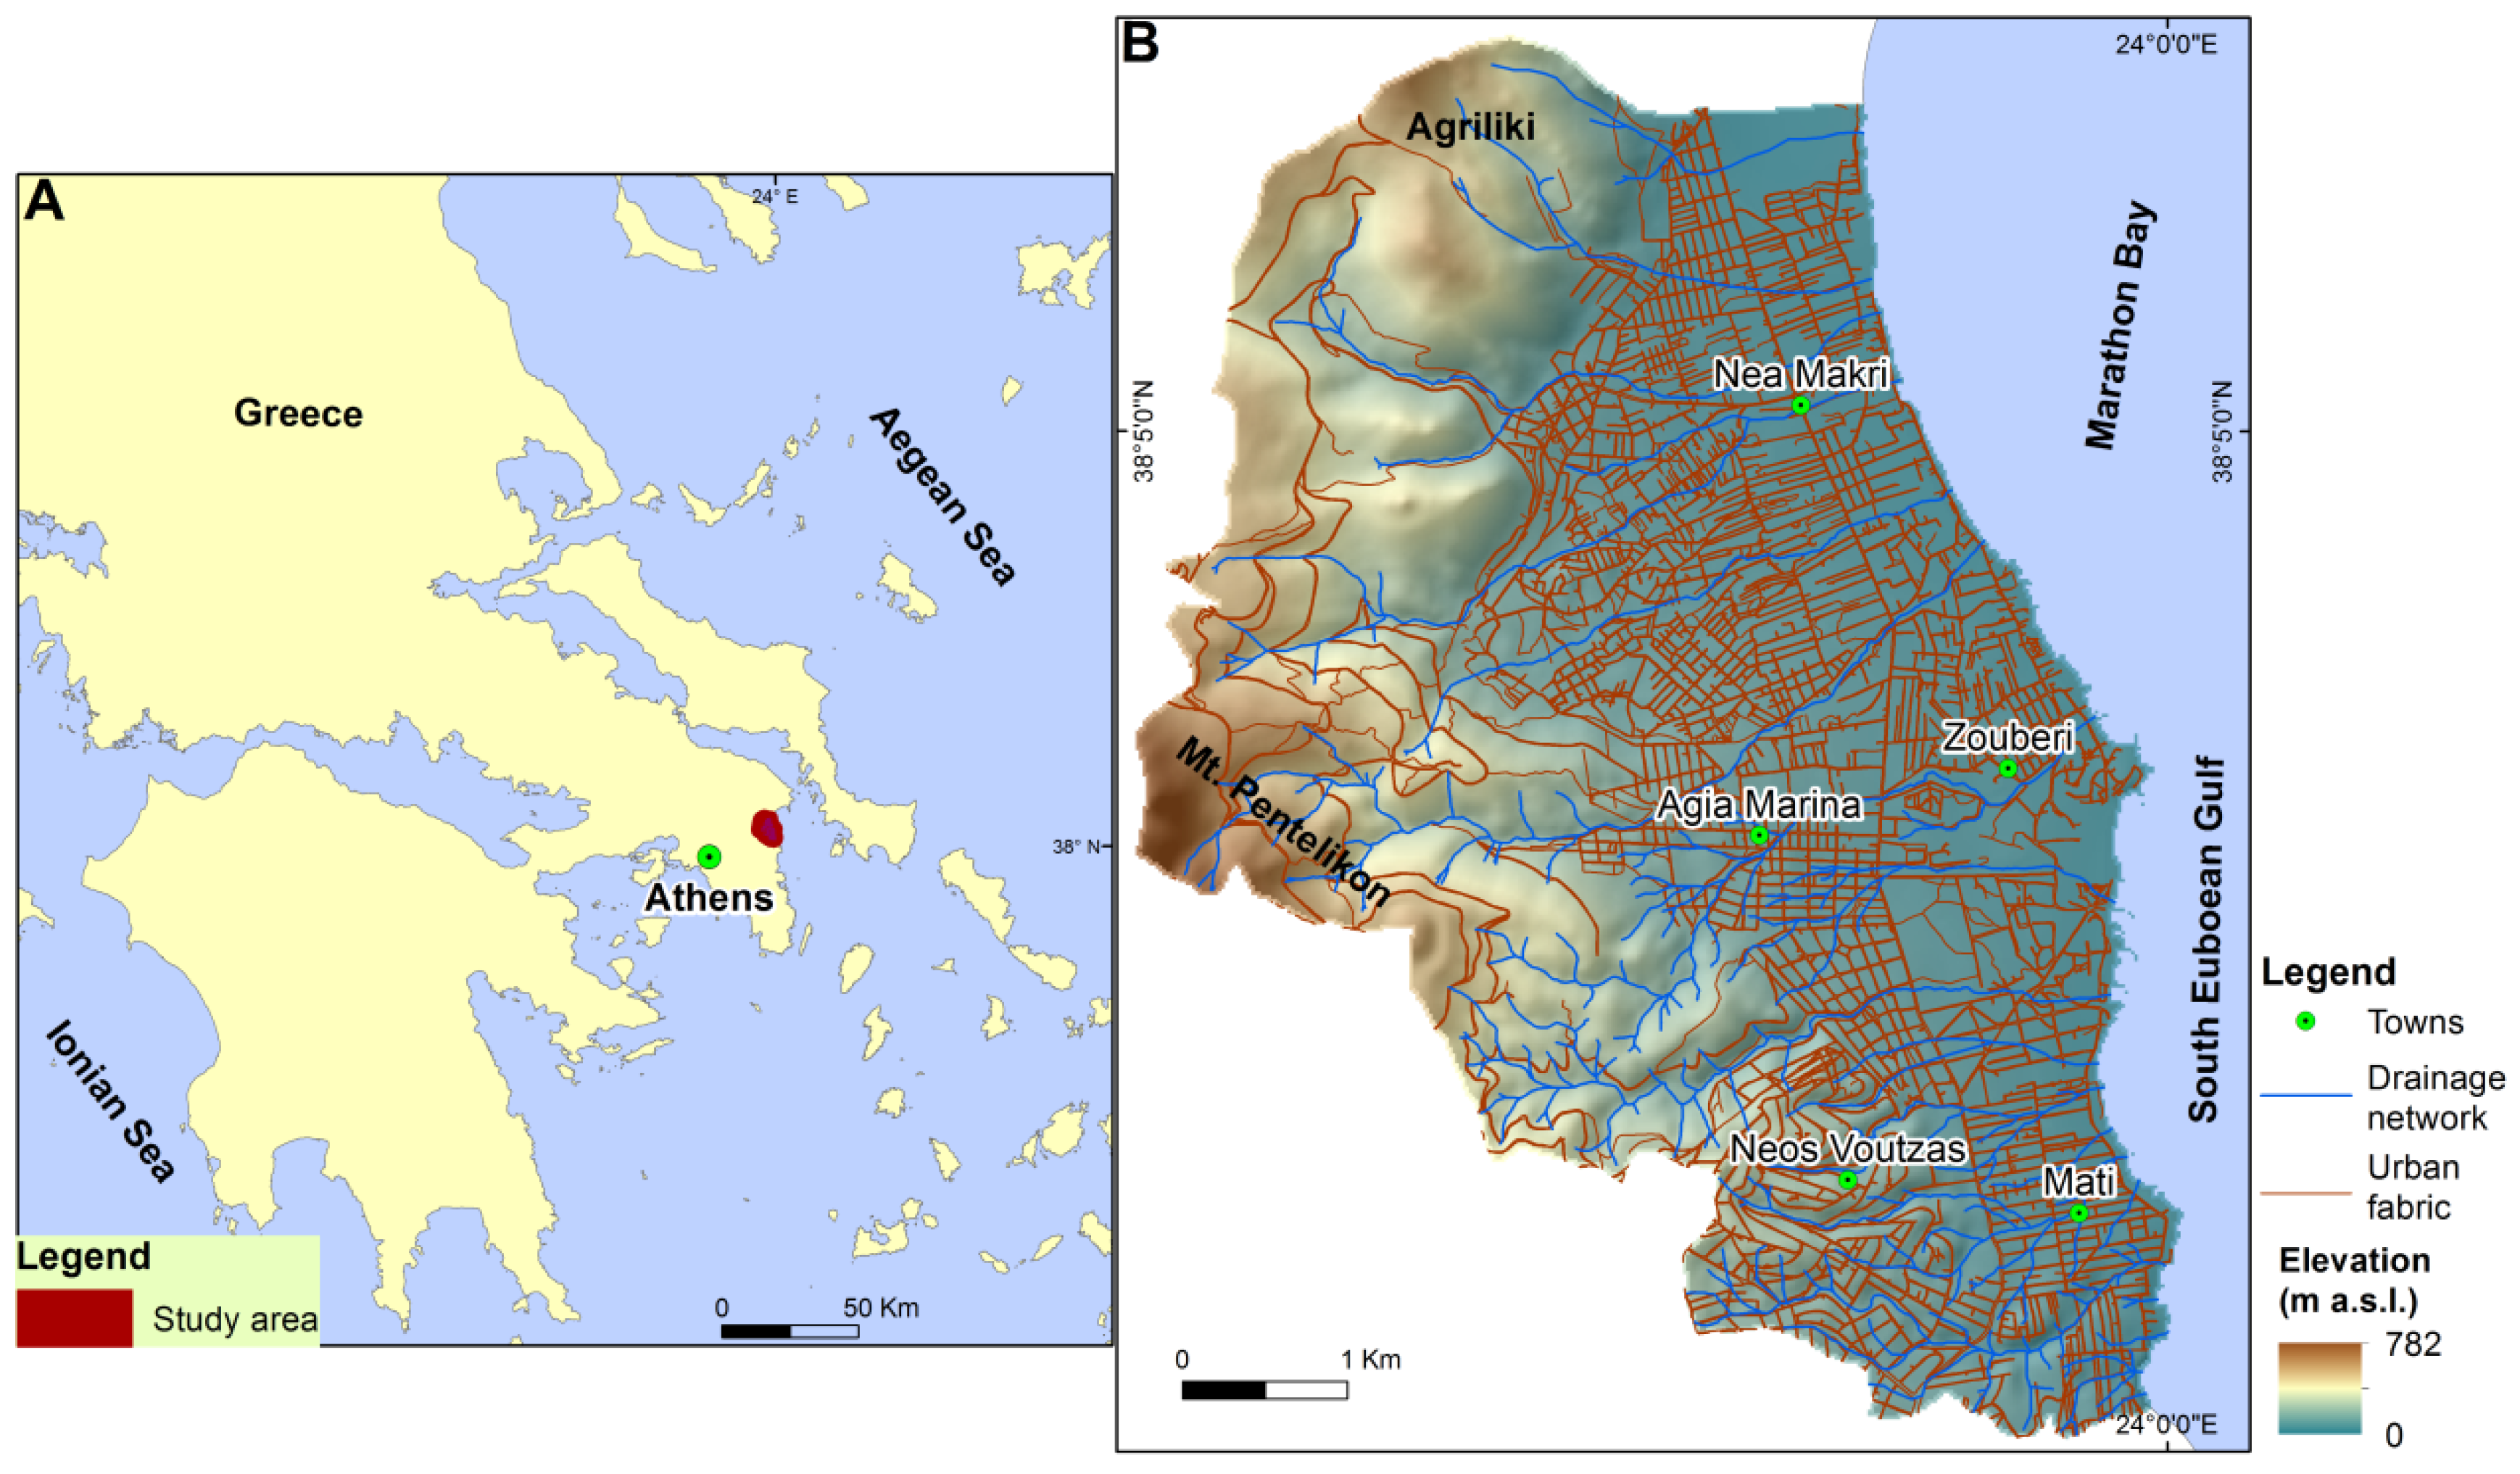
The case study area is the municipal unit of Nea Makri and is a popular holiday resort. It is located on the coast of Marathon Bay, a bay of the South Euboean Gulf, in the northeastern part of Attica Prefecture (Figure 1A). It is bounded on its western—southwestern part by Mount Pentelikon, while the hill Agriliki dominates its northern part. The area is a popular tourist destination with holiday houses, hotels and yacht marinas.
The study area occupies approximately 34 km2, and it is a low altitude area, with elevation varying from 0 to 782 m above sea level. Gentle slopes characterize its morphology, while only the western and northwestern parts of the basin are mountainous (Figure 1B).
As regards climatic conditions, the study area has a Mediterranean climate type. The mean annual temperature reaches 18 °C and the yearly precipitation is 400 mm.
Several streams drain the study area. They have a limited length and their drainage basins have small areas. The length of their mainstream channel varies from 0.2 to 5.5 km. The steams debouch northeastwards from the eastern flank of Mount Pentelikon to the South Euboean Gulf (Figure 1B). Their flow is ephemeral, and they have torrential behavior. Although such fluvial systems in semiarid areas are frequently dry, extreme flash floods happen.
The study area was severely hit by fire on 23 July 2018. The fire started on the Pentelikon Mountain, spread very quickly to the seaside towns of Mati and Neos Voutzas (Figure 1B) and grew into one of the largest urban wildfires in recent European history, which left 102 people dead and 164 injured. Seventy percent of Mati was utterly burnt from the wildfires, while the remaining 30% was either partially burned or contains burnt areas. Houses and vehicles were totally burned, leaving Mati and nearby towns completely destroyed [38,39].
Since the early 21st century, the region has strongly urbanized and its population has greatly increased [40]. Unchecked constructions block parts of the drainage network. The lowland areas of the towns Nea Makri, Zouberi and Mati have repeatedly been affected by flood events during extreme storm events [41].
3. Methodology
3.1. Data
The used data and their sources in the present work were:
- topographic maps at different scales (1:50,000, 1:25,000) along with topographic diagrams at scale 1:5000 from the Hellenic Military Geographical Service;
- the geological map sheet Kifisia (scale 1:50,000) from the Institute of Geology and Mineral Exploration of Greece, published in 2002;
- historical flood data [38];
- field data involving observations and mapping of the drainage networks of the study area.
3.2. Applied Method
Flood hazard mapping can be achieved by using hydraulic–hydrodynamic methods. An advantage of these models is that the indicated hazard maps are usually connected to certain return periods according to the European flood directive, even though they need data which are often not able to be obtained at a scale of the drainage basin [26,27,28,29,30,31,32,44,45].
In the present study, the lack of data related to precipitation and especially discharge gauges resulted in limitations to the hydrologic analysis. Thus, the link of the flood hazard assessment to return periods was not feasible. Otherwise, the AHP method was applied to produce the flood hazard assessment model. The method has been commonly used to delineate flood-prone areas since this approach warrants accurate and reliable predictions. For instance, Rahmati, et al. [27] used the AHP to map the flood-susceptible areas in Yasooj region, Iran, while Fernández and Lutz [28] applied the same method to assess flood hazard zoning in Tucumán Province, Argentina. In Greece, several researchers used the AHP method to assess potential flood-prone areas; i.e., Stefanidis and Stathis [29] in Kassandra Peninsula (northern Greece), Papaioannou et al. [45] in Thessaly (central Greece), Bathellos et al. [46] in northeastern Peloponnesus (southern Greece) and Skilodimou et al. [47] in the drainage basin of Pinios River (western Greece). Additionally, Bathrellos et al. [32] applied this method to produce an urban flood hazard map in the metropolitan urban area of Athens, capital of Greece.
Saaty [33,34,35] proposed the AHP method, which implements a linear correlation between the factors involved. The application of the method in flood hazard assessment, including the pair-wise comparison, the creation of the table-matrix, the calculating of the weighting coefficients, as well as the computation of the consistency ratio, was analyzed in detail in the published work [32].
3.3. Involved Factors
The applied model is based on the factors which control the route of water when the capacity of the drainage network is exceeded by an extreme flood event. Previous published works [12,13,26,27,32,45,46,47,48,49] as well as data availability were utilized for the selection of the appropriate factors. Six physical and anthropogenic factors were taken into account. The physical factors were slope, elevation, distance from open channel streams, and hydrolithology, while the anthropogenic factors were distance from totally covered streams, along with land cover.
3.3.1. Slope
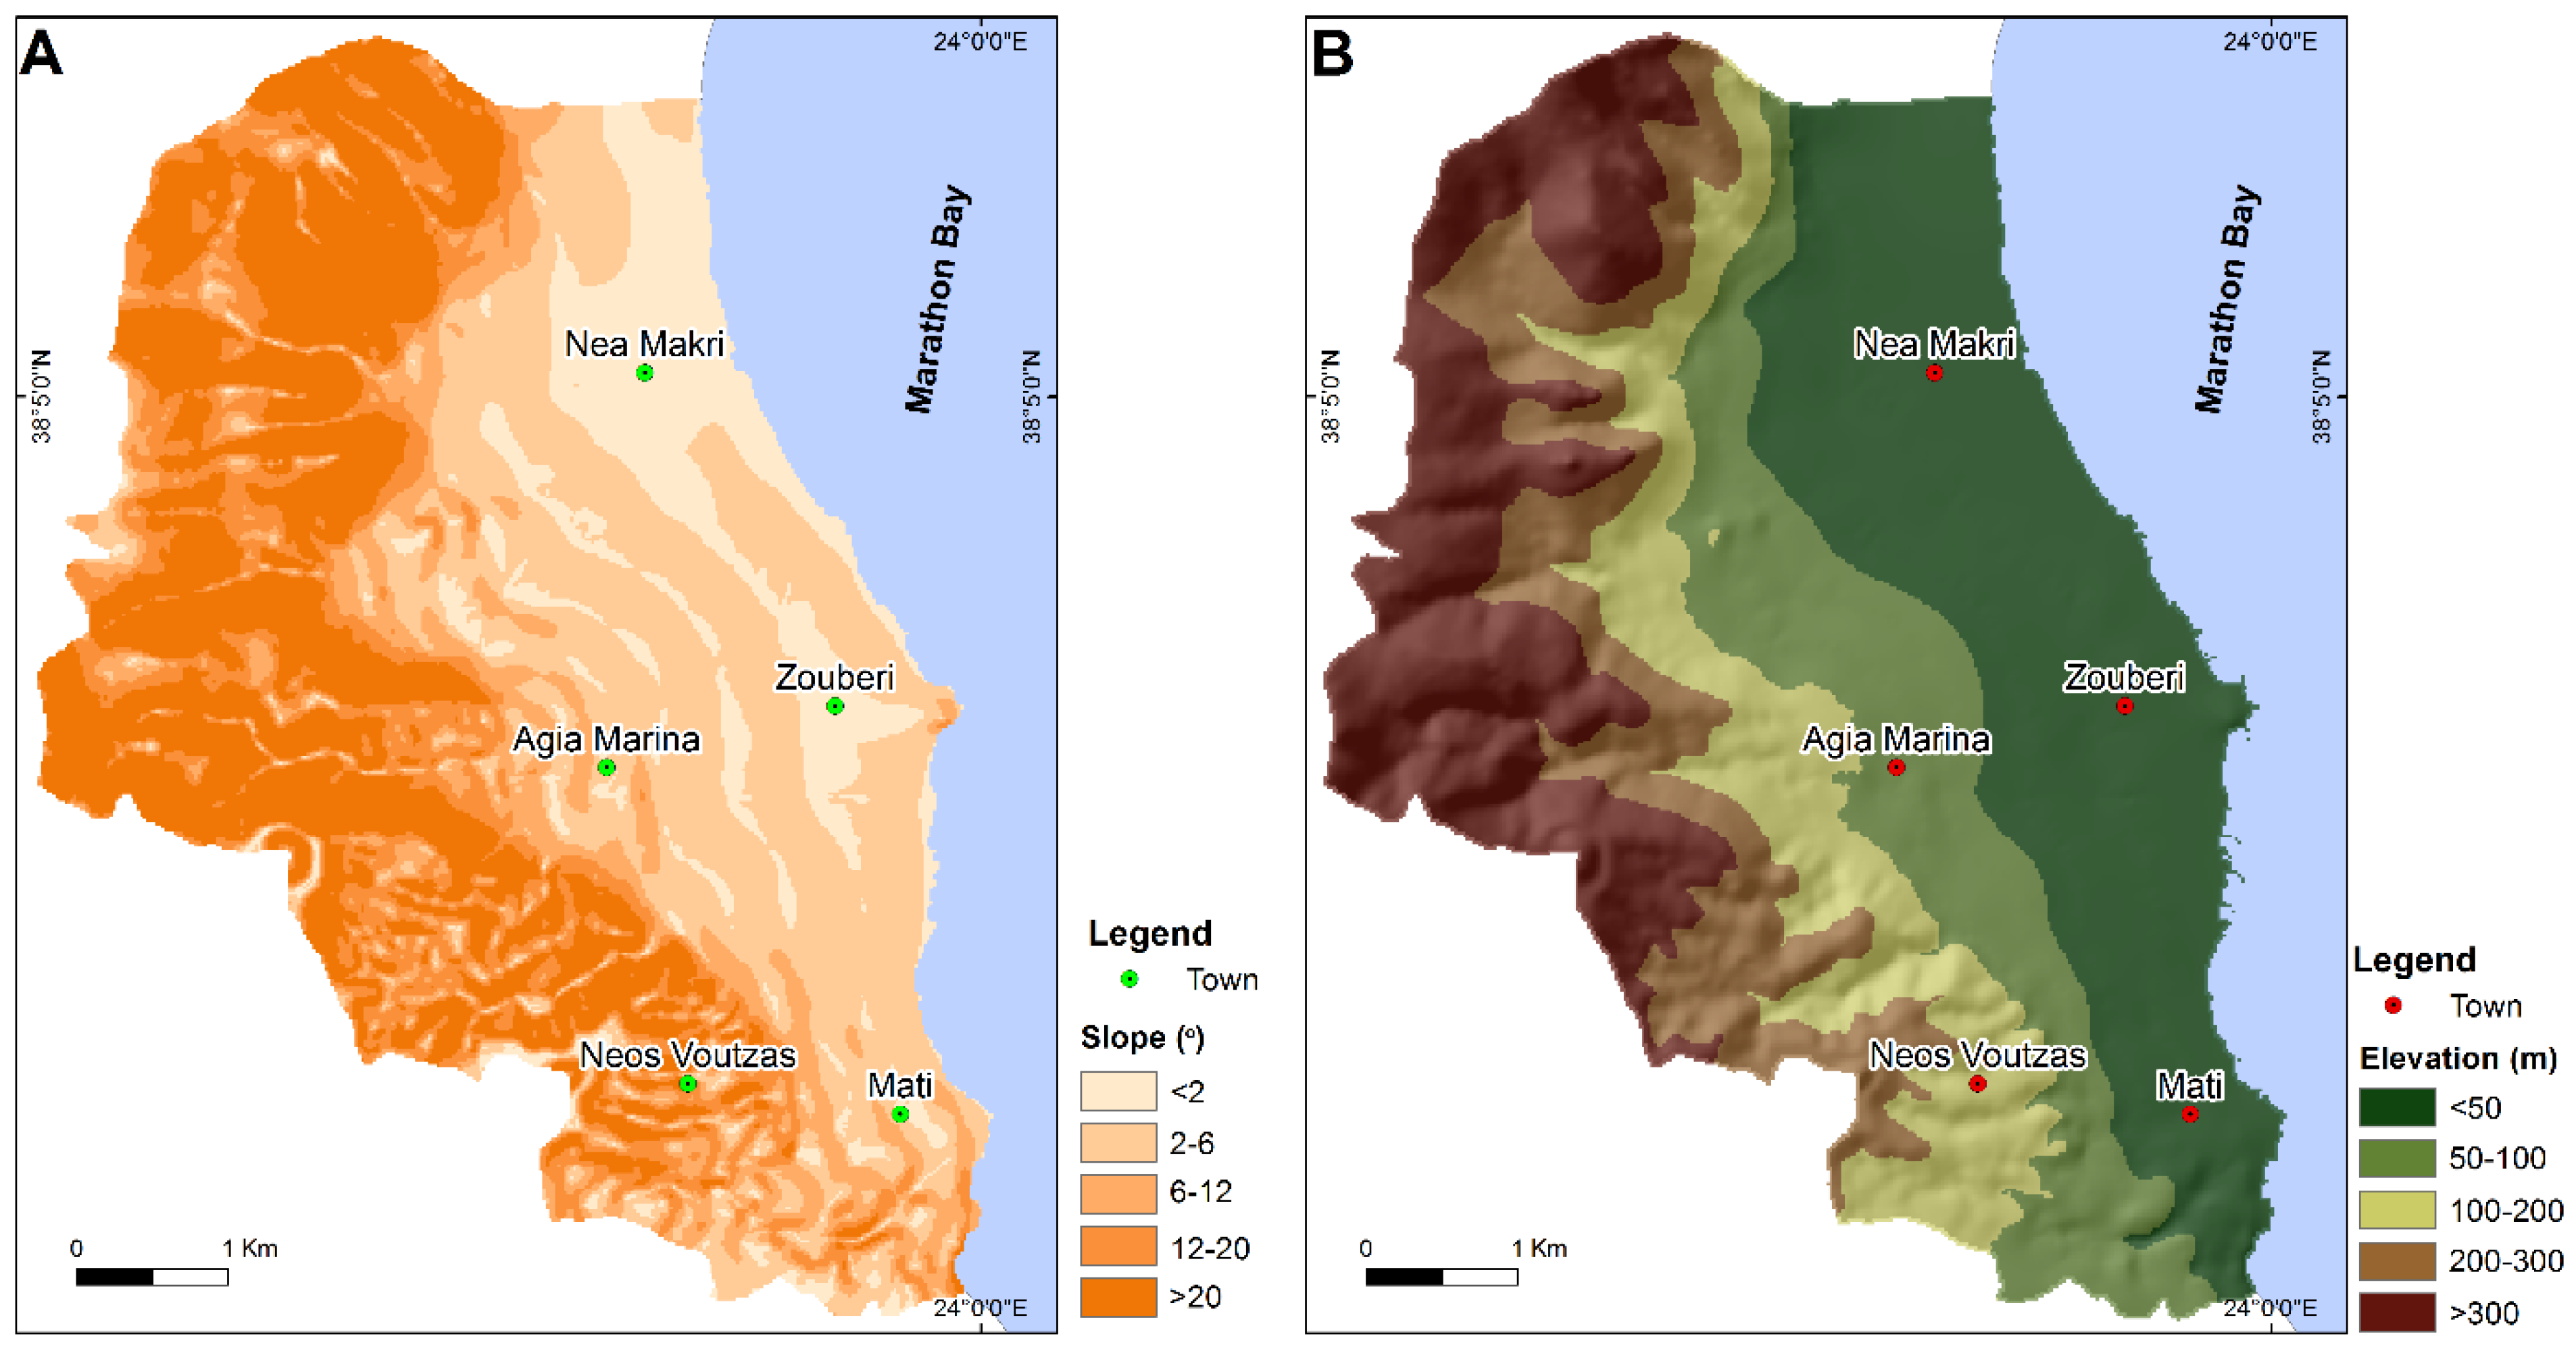
Since steep slopes contribute to flood occurrences and gentle slopes are more susceptible to flooding, slope is an essential factor for flood hazard assessment. Since a high-resolution digital terrain model (DEM) of the study area was not available, contours (4 m interval) and elevation points of the topographic diagrams were used to produce a DEM. The data were interpolated by using the topo to raster method, which is based on the ANUDEM program developed by Hutchinson [50]. Although DEMs derived from contour lines and elevation points often have bias, this method has a minor bias in the interpolation algorithm that may result in misleading results when calculating the profile curvature of the output surface, but is otherwise not noticeable [50]. According to Arun [51], the ANUDEM interpolation method is preferable for streams and adapted itself to terrain variations. Therefore, this method was considered to be the most appropriate to meet the requirements of the present work. The DEM was used to create the slope layer which was separated into five classes (Figure 2A), which are (i) <2°, (ii) 2–6°, (iii) 6–12°, (iv) 12–20° and (v) >20°.
3.3.2. Elevation
Lowlands are flood-prone areas, and thus elevation is a vital factor in flood hazard estimation. As in the case of slope, the DEM was used to create the elevation layer. It was classified into the following, i.e., (i) <50 m a.s.l., (ii) 50–100 m a.s.l., (iii) 100–200 m a.s.l., (iv) 200–300 m a.s.l. and (v) >300 m a.s.l. (Figure 2B).
3.3.3. Distance from Open Channel Streams
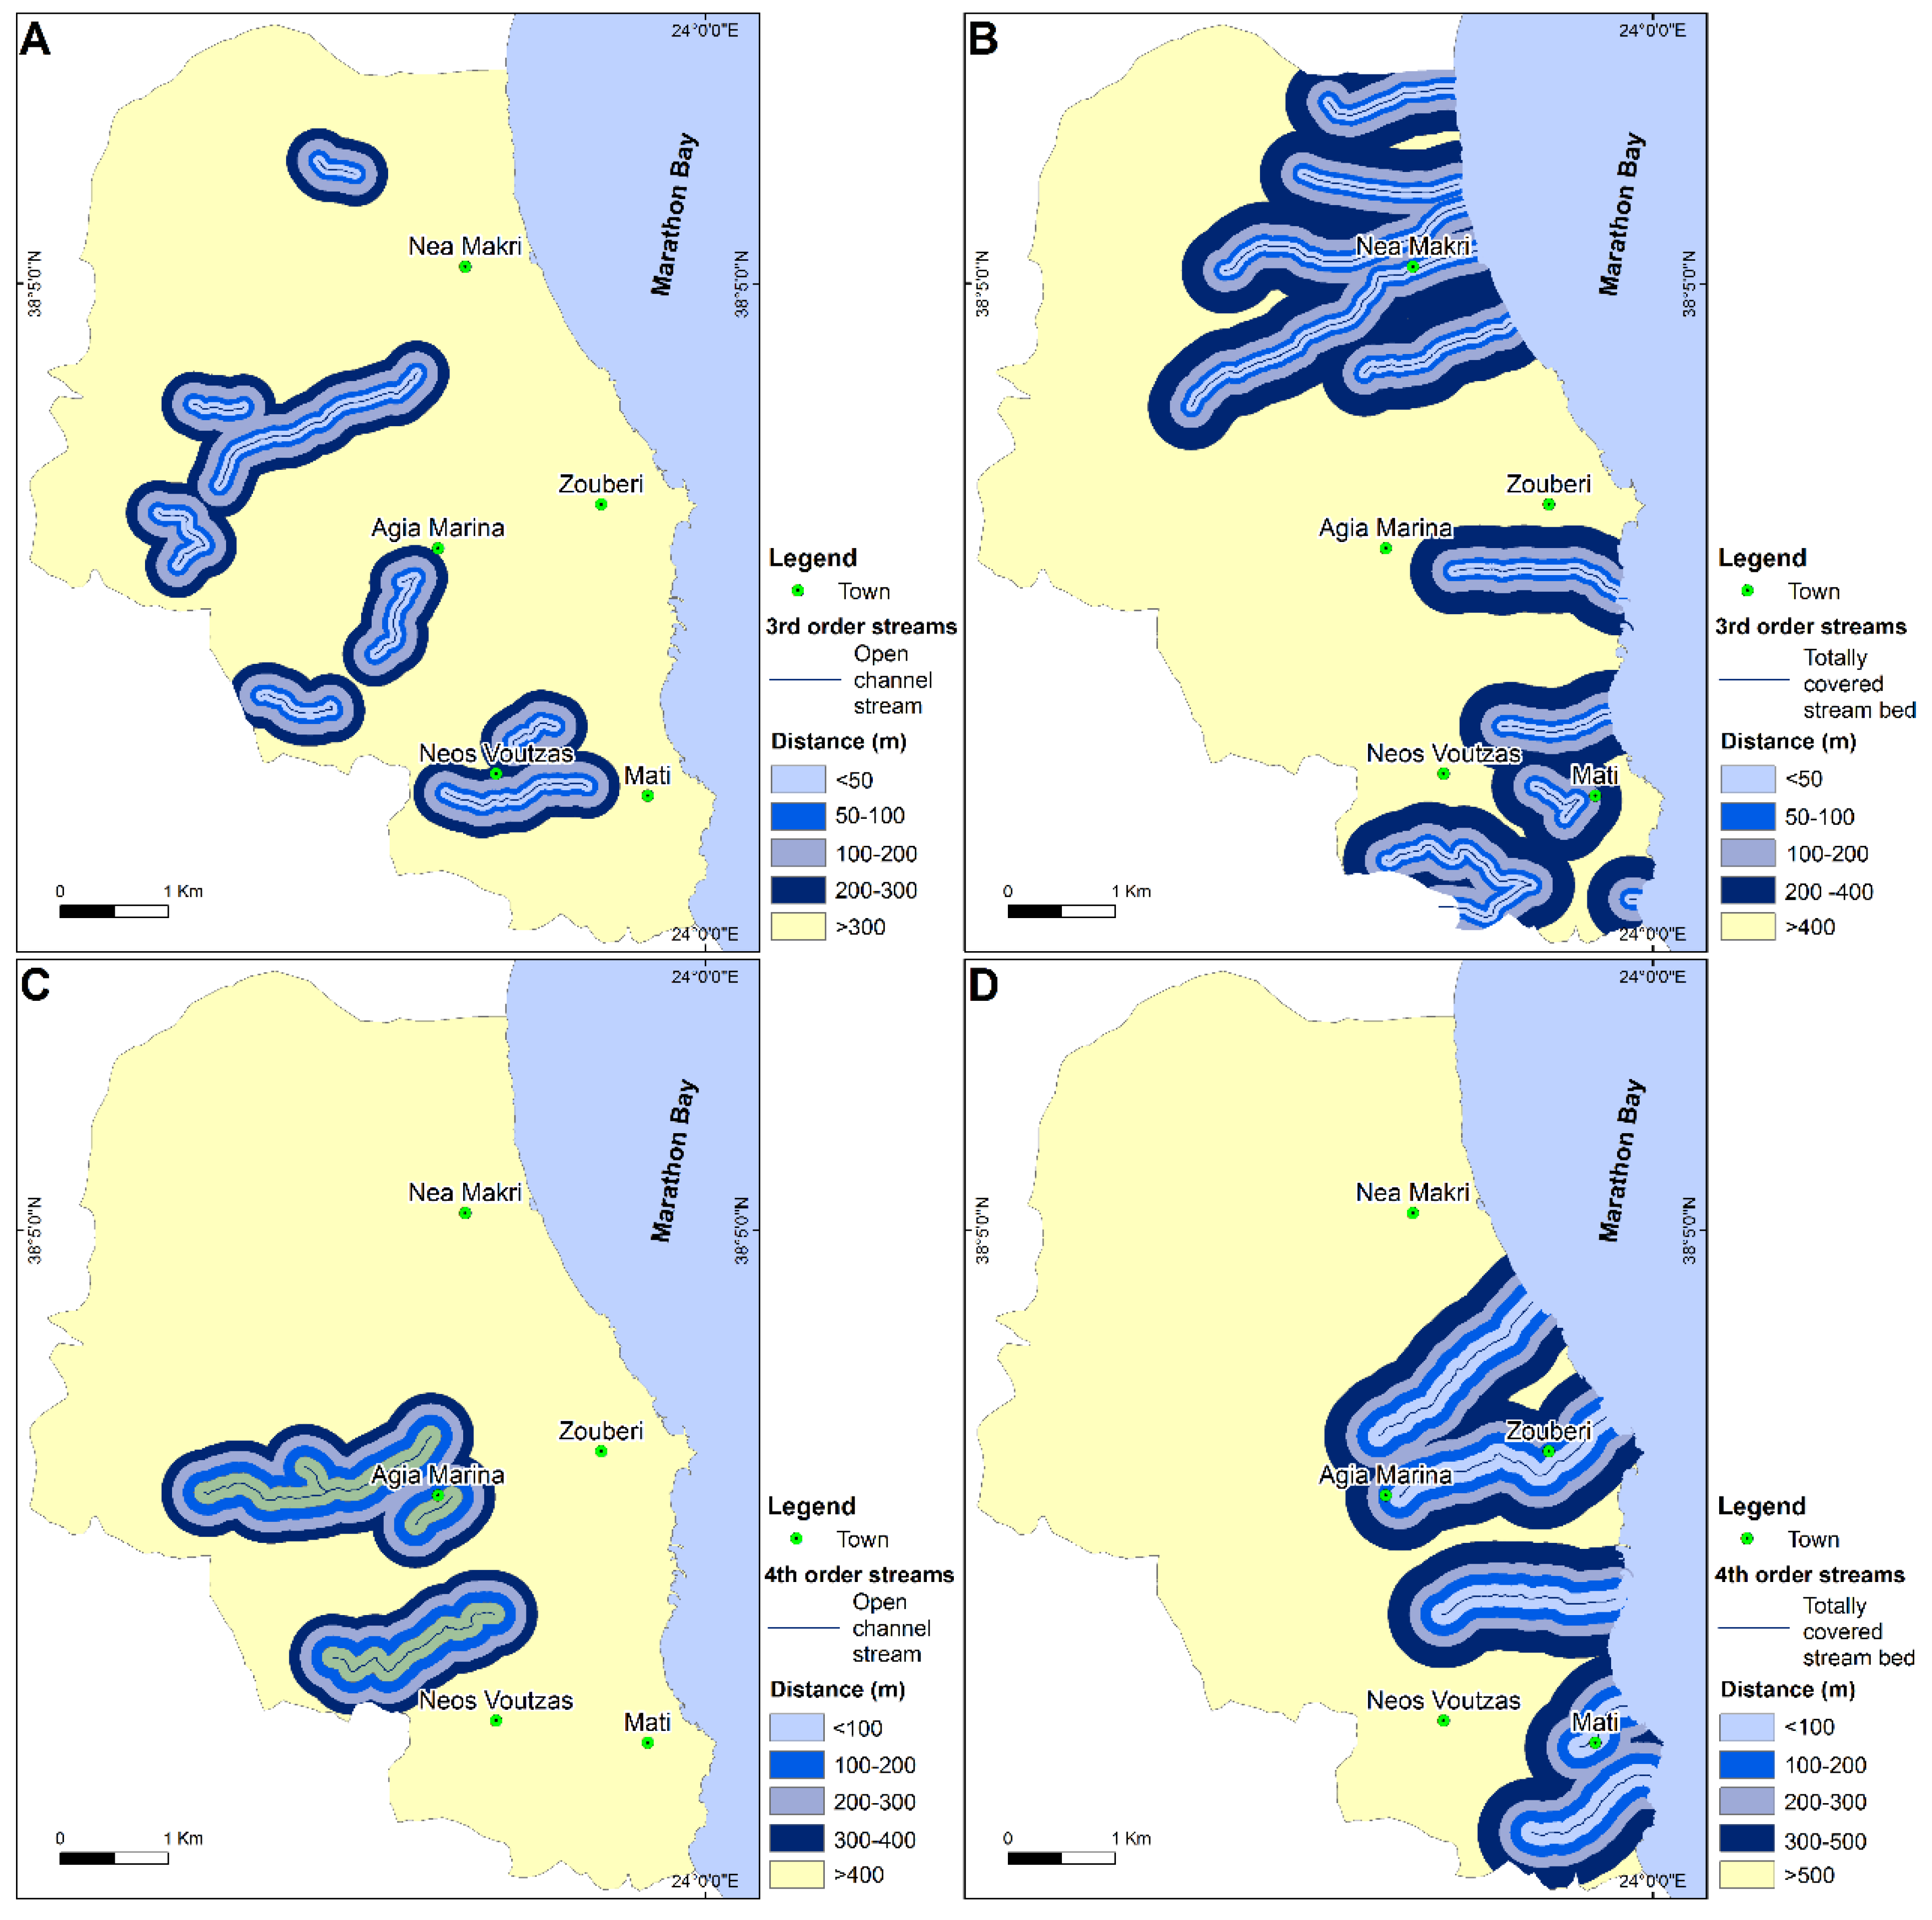
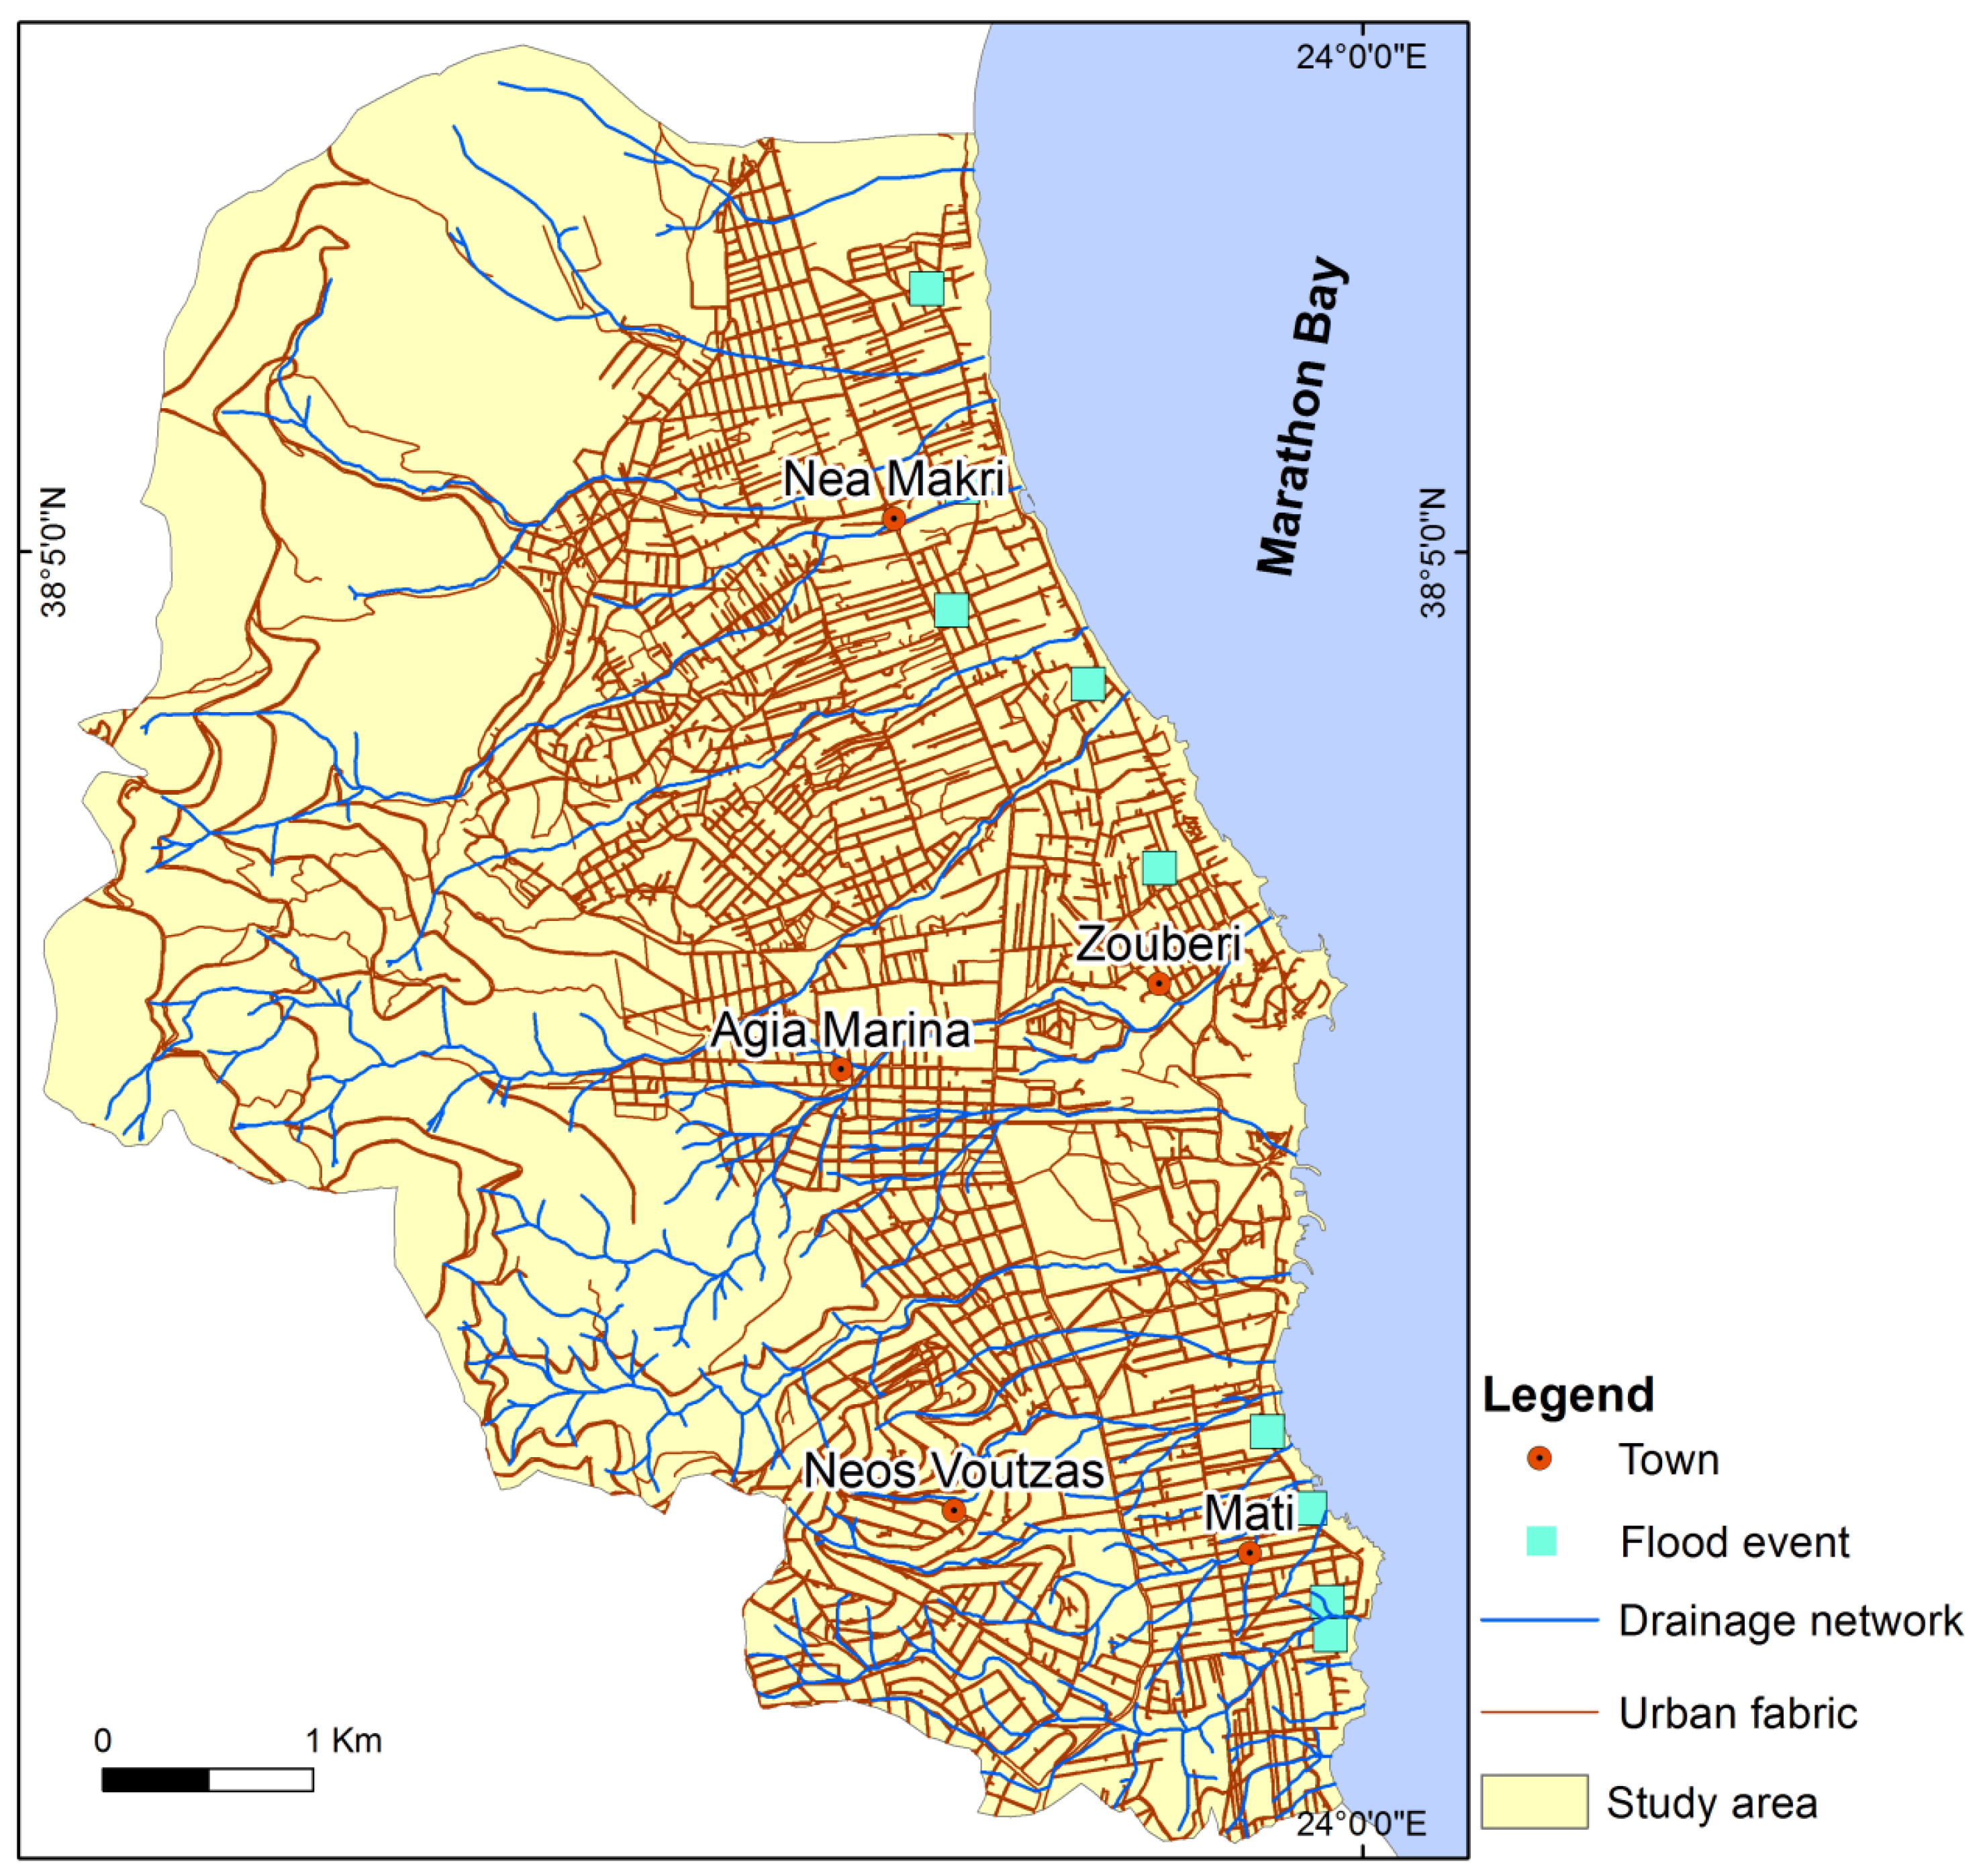
Streams are a significant parameter for flood hazard assessment. The drainage networks were obtained from the topographic maps (scale 1:5000) and were digitized as a line layer. The Strahler’s stream order system was used to define the streams. Third and higher order streams were studied, as they can cause flood events. The drainage networks of the study area consist of open channel streams and streams covered by urban fabric (Figure 3). The open channel streams were mapped through extensive fieldwork.
3.3.4. Distance from Totally Covered Streams
As in the case of open channel streams, the totally covered streams were identified and mapped in detail through extensive fieldwork. Buffer zones were generated around the totally covered streams of the study area, i.e.,: third-order streams at distances of 50, 100, 200 and 400 m (Figure 3B) and fourth-order streams at distances of 100, 200, 300 and 500 m (Figure 3D).
3.3.5. Hydrolithology
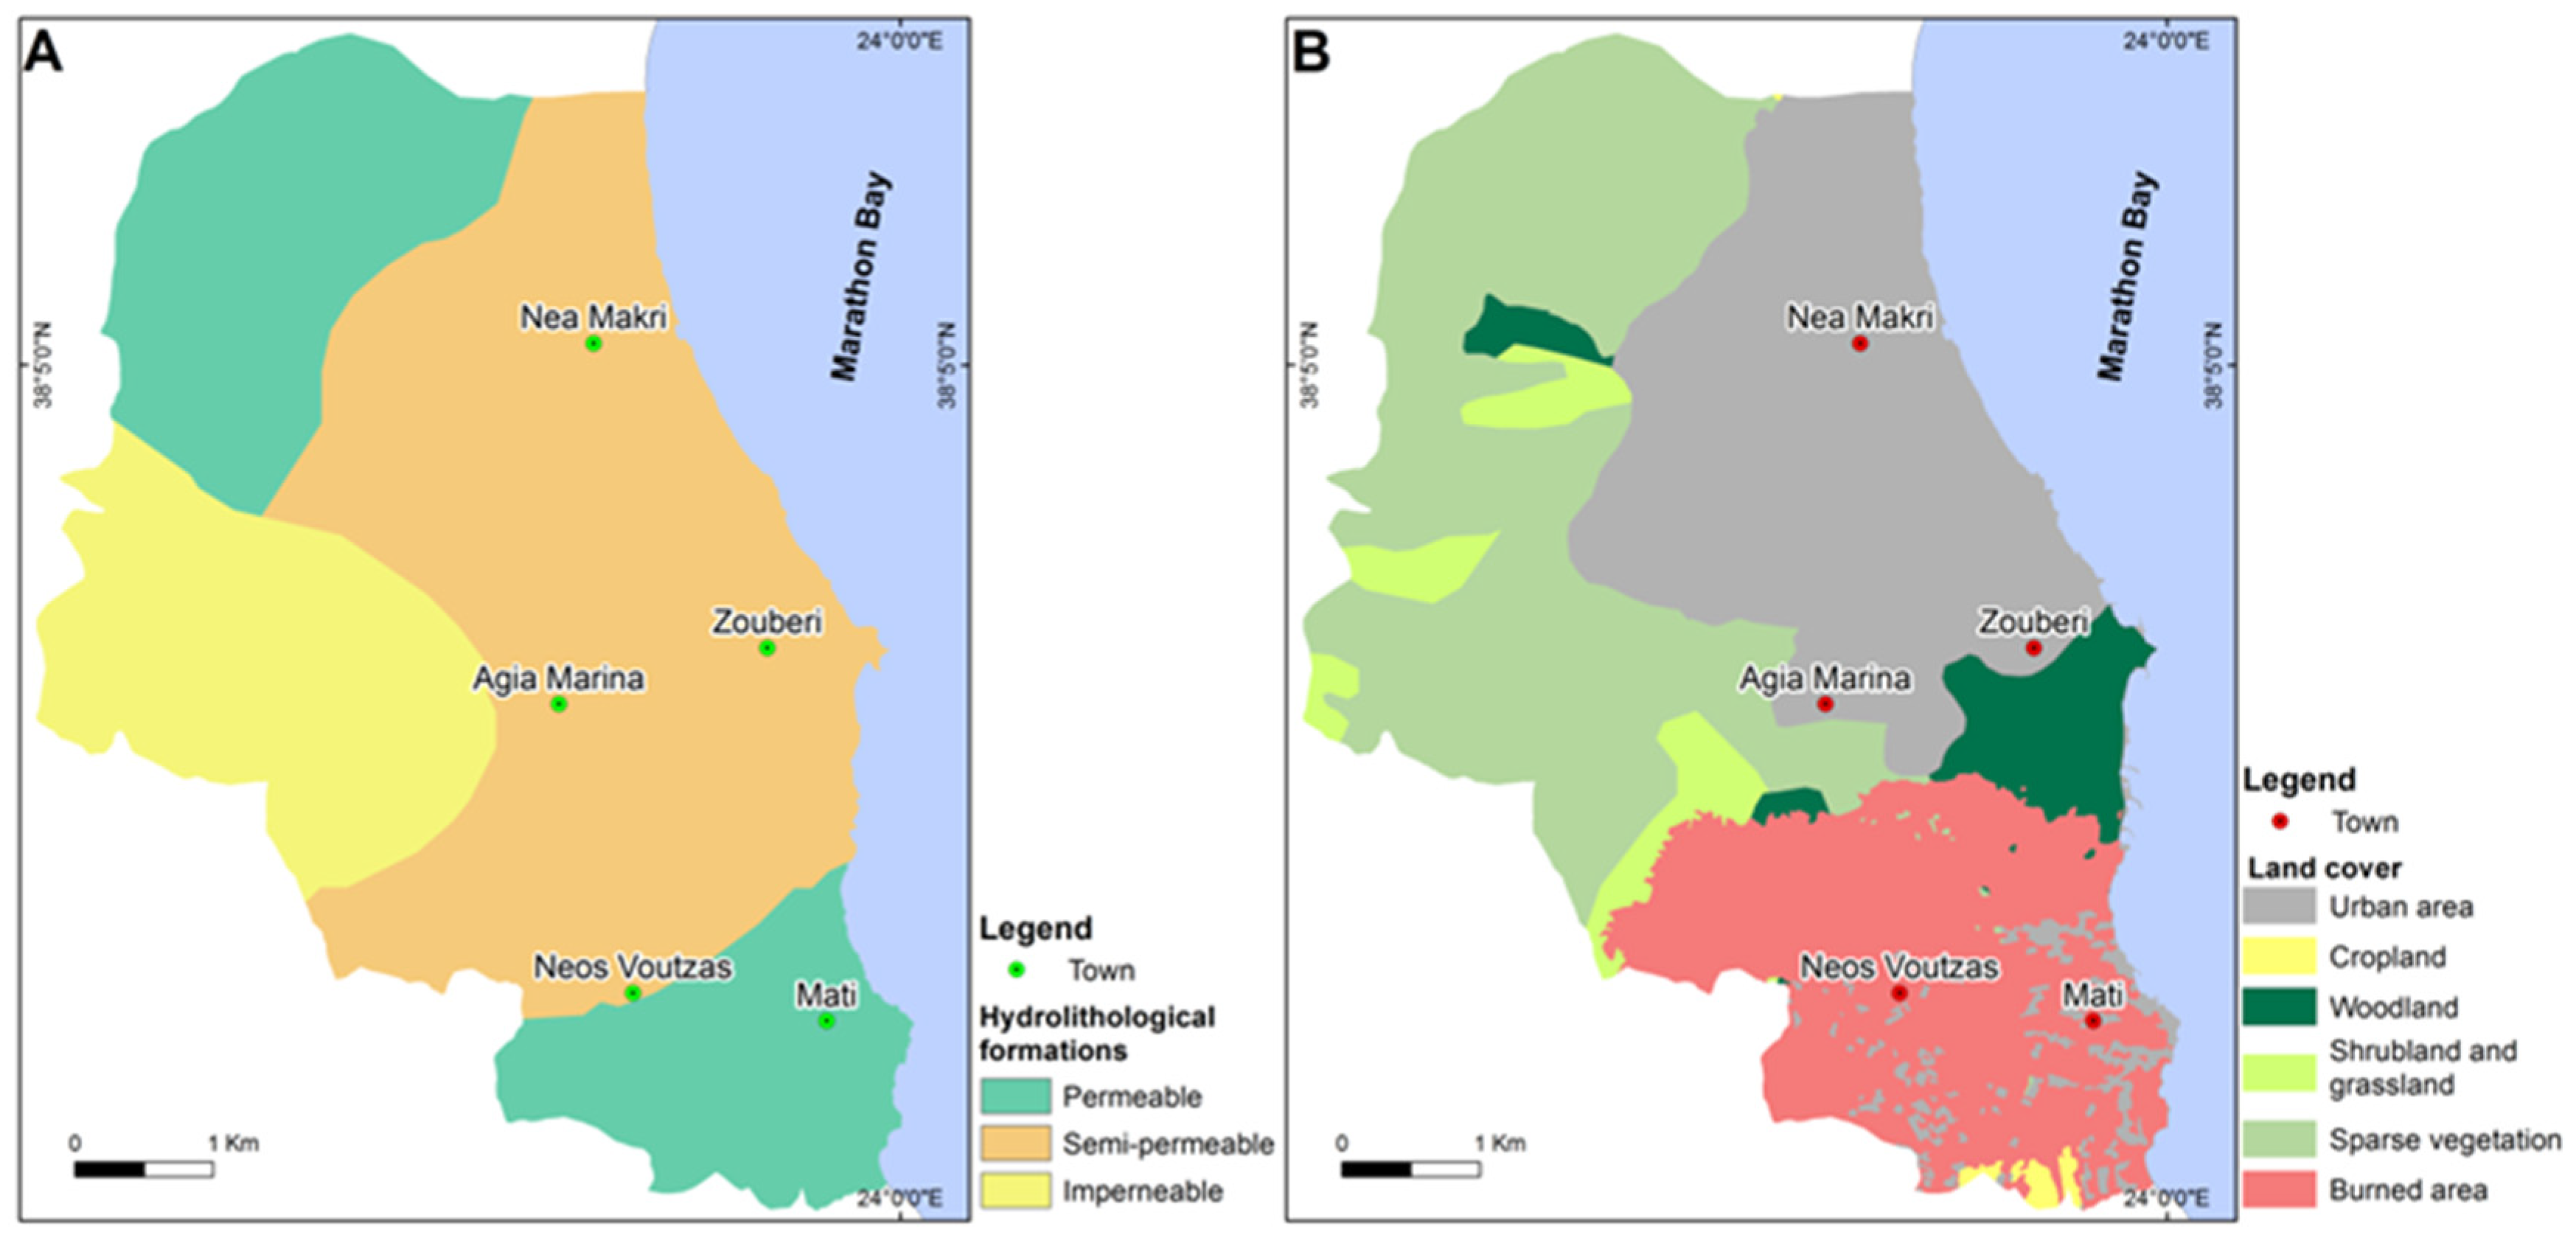
The geologic conditions influence the surface runoff and may also contribute to flooding occurrences and flood hazard. The geological formations derived from the geological map of the study area were categorized into three classes according to their hydrolithological status [52]. They are (i) permeable, (ii) semi-permeable and (iii) impermeable formations (Figure 4A).
3.3.6. Land Cover
Since the vegetation can help absorb rainfall, land cover influences the occurrence of floods. Since high-resolution land use data of the study area were not available, the land cover of the study area was taken from the CORINE 2012 Land Cover (CLC) map Copernicus Program, and the Urban Atlas, 2018. The CORINE 2012 program contains land cover data for Europe including land cover classes published by the European Commission. The European Urban Atlas provides reliable, high-resolution land use maps for more than 300 large urban zones [39,40]. For the necessities of this study, the Urban Atlas, 2018 was used to map the urban and burned areas while the CORINE 2012 was utilized to identify the rest of the land uses. The land uses, which reflect the vegetation covering, were classified into six categories as follows: (i) urban area, (ii) cropland, (iii) woodland, (iv) shrubland and grassland, (v) sparse vegetation area and (vi) burned area (Figure 4B). The urban and burned areas covered 33% and 22% respectively of the whole study area, while the remaining area consisted of 1% cropland, 5% woodland, 5% shrubland and grassland and 34% sparse vegetation.
3.4. The Rating of Every Class and the Weighting of the Factors
Each class of the involved factors had to be normalized to a standard rating scale. The determination of the rating of the classes was based on published work [32,46,47] and personal experience from previous studies of flood activity.
A five-grade scale was used for the normalization of the classes. Positive, whole numbers, ranging from 0 to 4, were given to every class. Each class expresses a different hazard level. Thus, the class rated as 0 expresses a low flood hazard, while the class rated as 4 expresses a high flood hazard. Table 1 shows the factors, their classes and their ratings.
3.5. The Flood Hazard Index Values and the Uncertainty
The flood hazard index values (FI) were commutated by using Equation (1):
where n is the number of factors, Ri is the rating of factor i and Wi is the weight of factor i. Thus, the basic flood hazard assessment map was produced.
Uncertainty has an important role in natural hazard evaluation [49,53]. Uncertainties in the weights of the adopted factors can bias the outcome of every hazard assessment. Published works [32,36,37,46,47], where geoenvironmental factors were evaluated through the AHP method, were used to calculate the uncertainties, ΔWi, of the weighting coefficient. The values of the weighting coefficient which are presented in Table 2 were changed by 20%. The new weight values (ΔWi) of every factor are shown in Table 3.
Equation (2) was used to calculate the error (ΔS):
The values of the error map were multiplied by 1.96 to calculate the 95% confidence level of the flood hazard values and in the next step, were added and subtracted from the basic flood hazard values. Thus, two other maps characterizing the maximum and minimum flood hazard values were produced.
3.6. Verification and Correlation of the Flood Hazard Evaluation
The accuracy of the actual hazard level was examined by using past flood events. They were included in published works [32], and the historical flood database of Greece [41]. A flood inventory map was generated which includes nine flood occurrences that were observed in the municipality unit of Nea Makri for the period 2000–2020 (Figure 5).
The verification was based on the statistical analysis of the frequency ratio (FR) method. It expresses the association between the spatial distribution of floods and hazard zones. In the published works [11,32,54,55], the methodology of the calculation of the FR area is presented.
Finally, the zones of the basic flood hazard map were compared with the active urban fabric and road network of the study area.
4. Results
The implementation of the previously described flood hazard assessment method led to the production of three flood hazard maps. The standard deviation method was used to categorize the maps. The areas of the maps were categorized into five classes, which were very high, high, moderate, low and very low flood hazard.
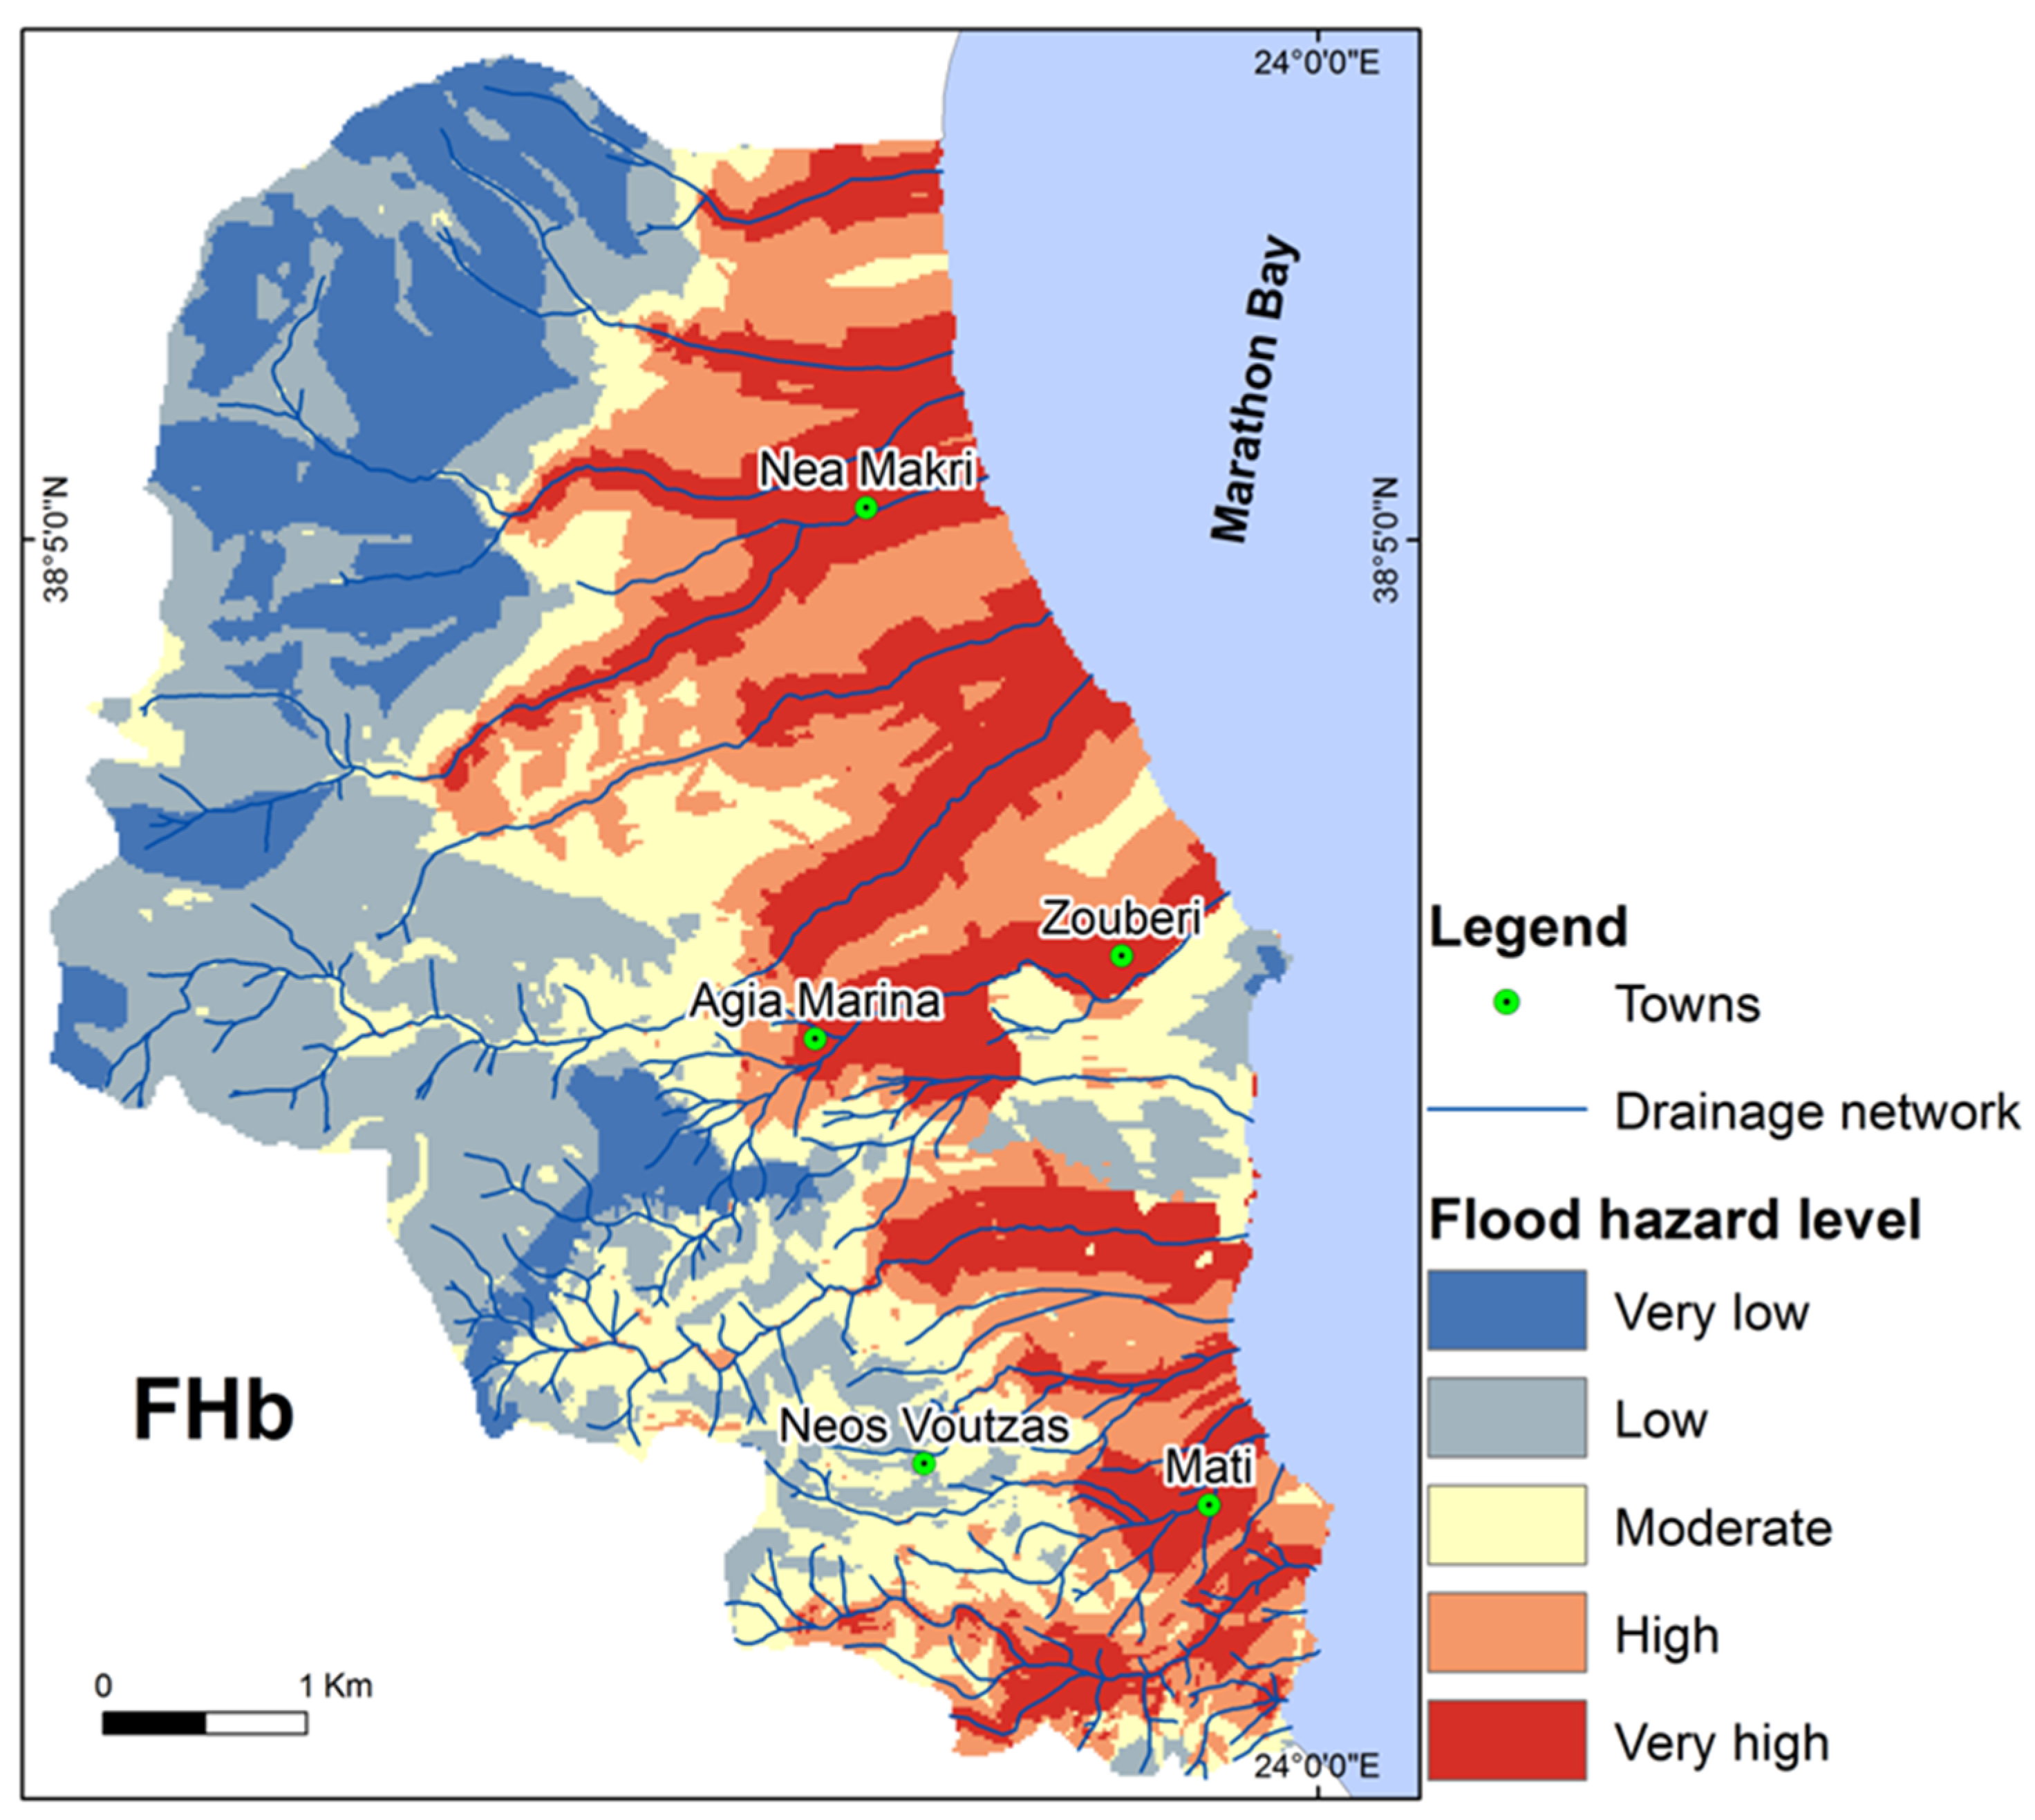
Figure 6 illustrates the basic flood hazard assessment map (FHb). In this map, the areas of very high and high flood hazard are located primarily in lowlands and particularly in eastern and southern parts of the study area. The moderate hazard zone is distributed mainly in the central part and the eastern and southern parts of the map. In the northern and western parts of the study area, many locations are situated in low and very low hazard areas.
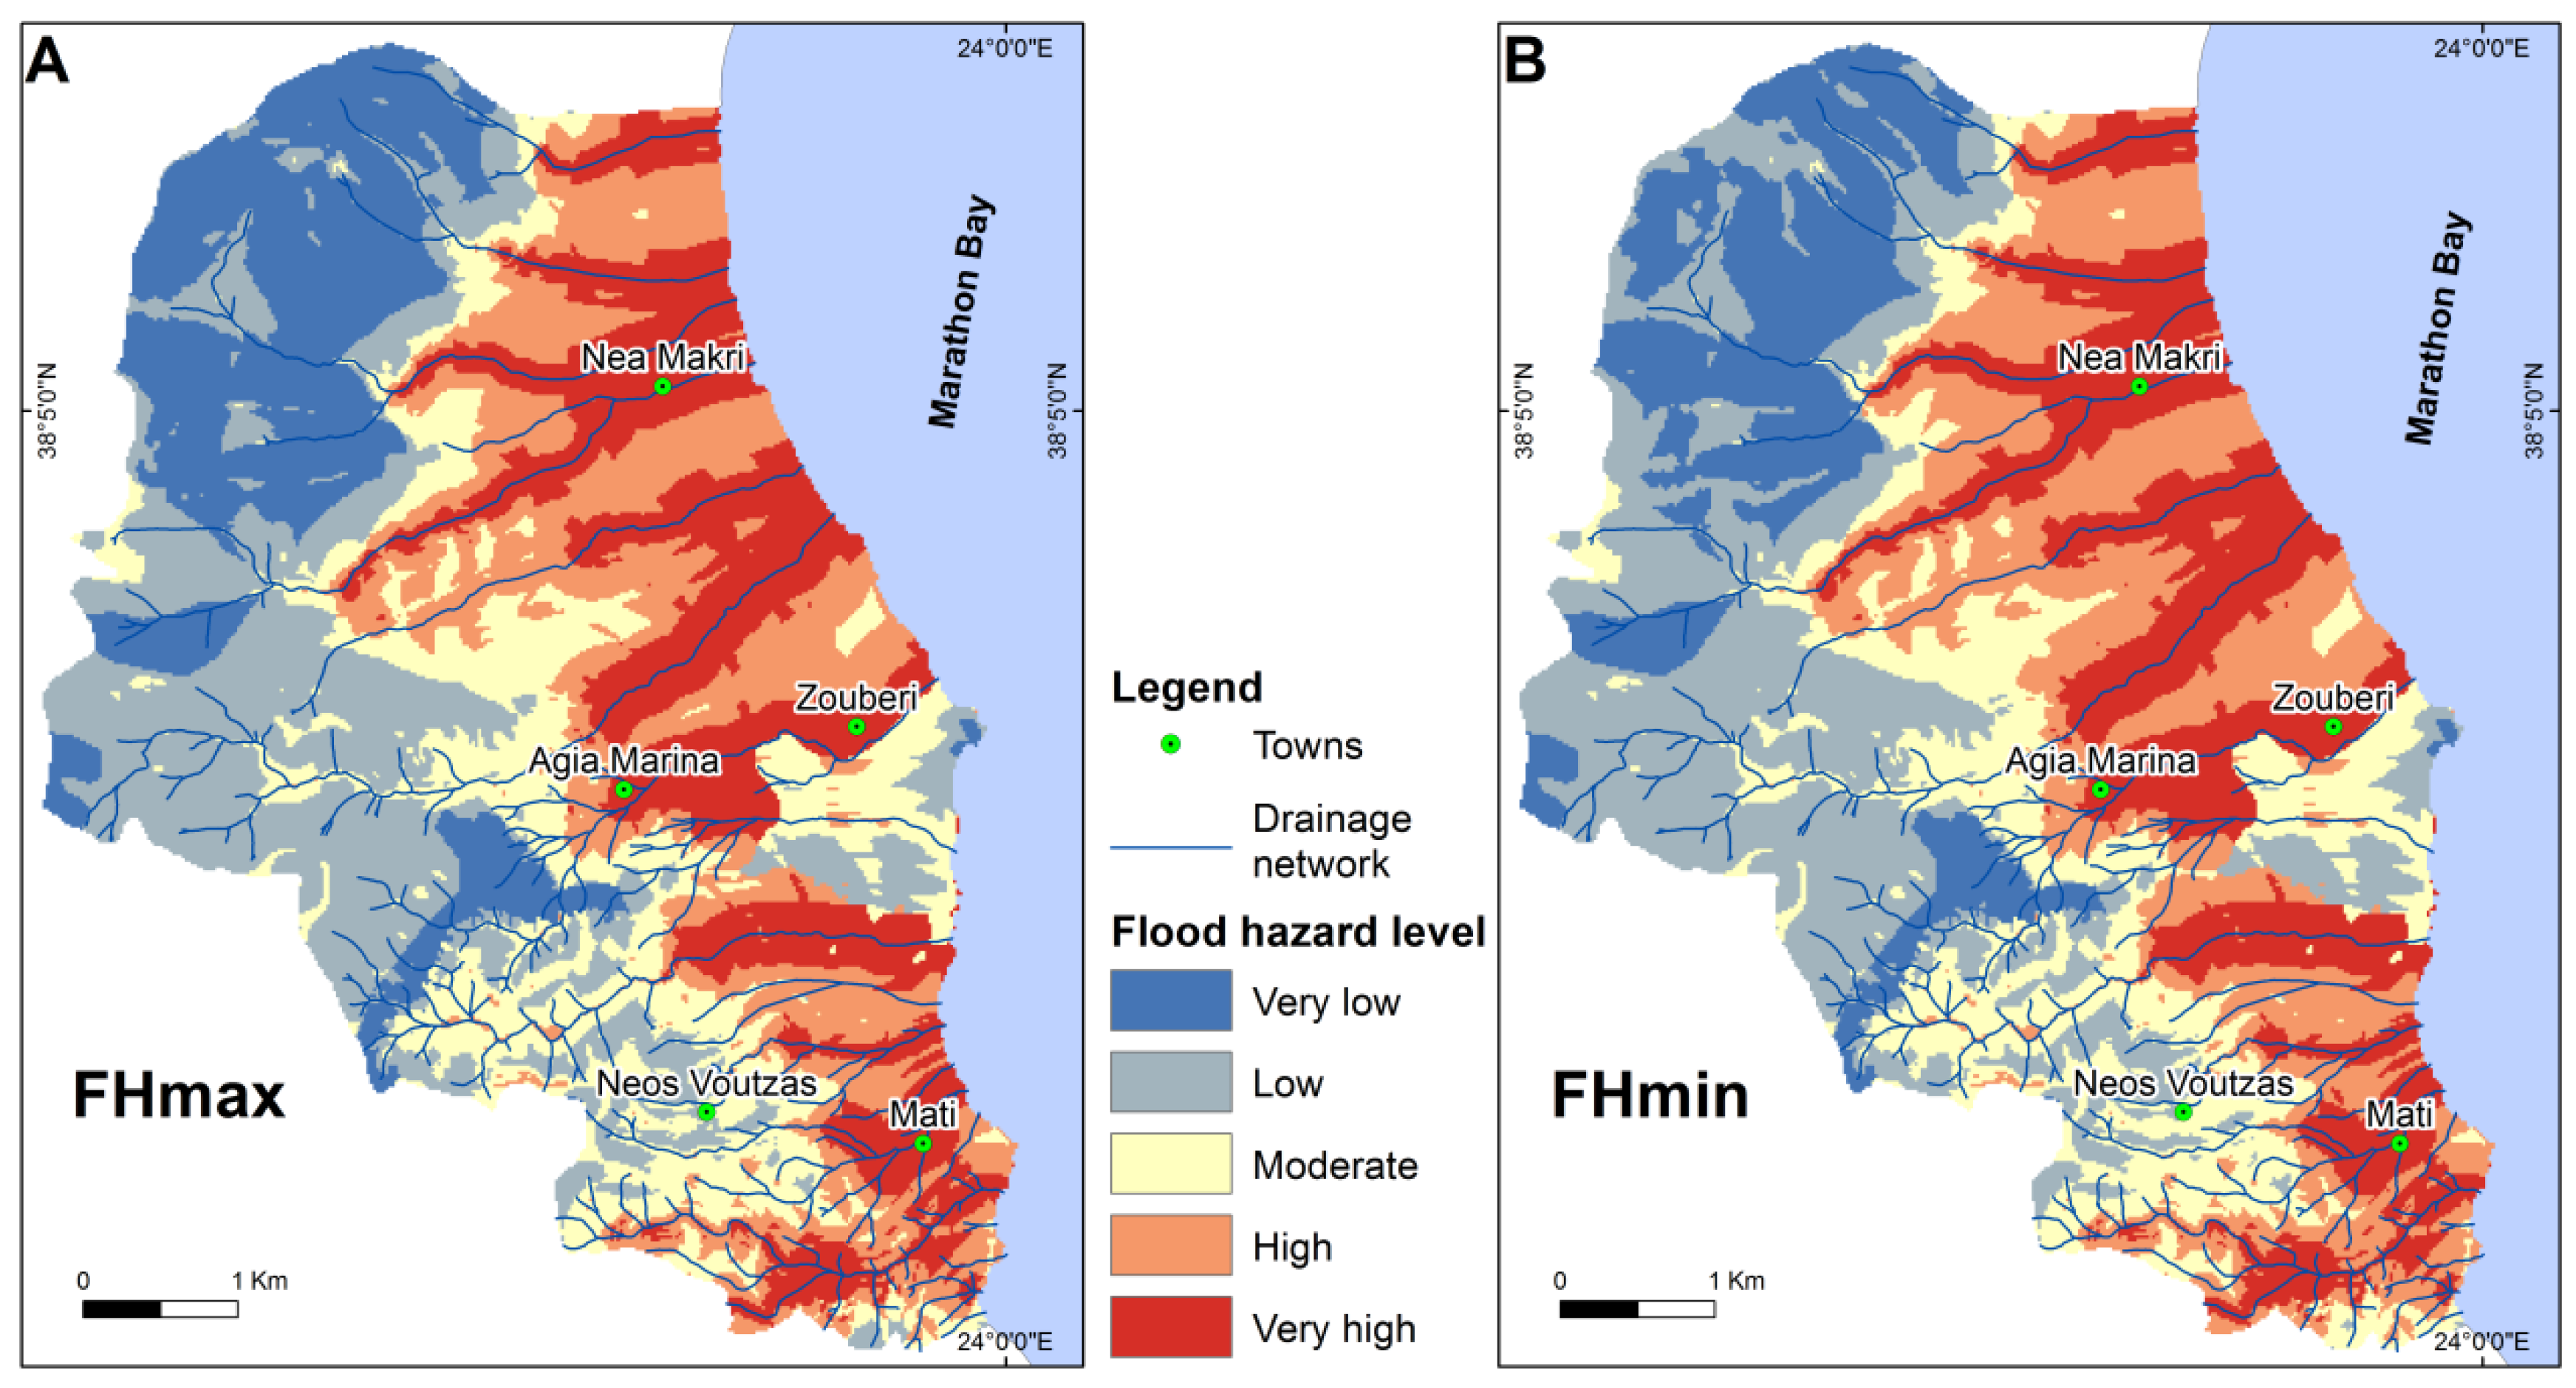
Figure 7A,B demonstrates the maximum and minimum value of each pixel’s flood hazard assessment, respectively, after considering the uncertainty in the weighting coefficients. According to the flood hazard analysis, the northeastern eastern and southeastern parts of the study area host the most flood-prone regions.
The percentages corresponding to the area of each hazard zone for the three maps of Figure 6 and Figure 7 are tabulated in Table 4. In the areas of the high and very high zones of the map with the upper flood hazard (FHmax), values slightly increased compared to the corresponding zones of the basic map (FH). The similar correlation proves that the spatial extents of moderate and low hazard zones decreased, while the very low hazard zone increase. Comparing the zones of the map with the lower flood hazard values (FHmin) to those of the basic map (FH), the areas of very high and high hazard zones showed a little increase, the moderate and low hazard areas slightly decreased, while the area of very low hazard zone remained unchanged.
Table 5 tabulates the estimated frequency ratio of the flood events for each flood hazard zone. According to [54,55,56], when the ratio values are more than 1, then there is a strong relationship between events and the given natural hazard zone.
Table 5 shows that flood events were significantly correlated to very high and high hazard zones. In the very high hazard area, the frequency ratio was higher than 2, demonstrating a very high probability of flooding. Similarly, the ratio value was observed to be 1.7, in the high hazard zone, showing a high likelihood of flood occurrences. Because the ratio value was lower than 1 in the moderate hazard zone, the probability of floods is low. Since the ratio value was found to be equal to 0 in the low and the very low hazard zones, the likelihood of flooding is minimal.
Moreover, the urban area and the road network were superimposed on the basic flood hazard map. In this context, the area of the urban fabric and the length of the road network that overlaps into each flood hazard zone were estimated (Table 6).
The results demonstrate that the vast majority of the urban areas are located within very high and high flood hazard zones. Half of the road network’s total length is situated within very high and high flood hazard zones. In contrast, small parts of the urban fabric and the other half of the road network are located within very low, moderate and low landslide hazard zones.
5. Discussion
The urban area constitutes about 33% of the entire study area. The study area has suffered from urban fires in 2018, resulting in about 25% of the area being burned. According to Fox [21], Euro-Mediterranean countries have common post-fire risk characteristics. They have relatively high population densities, and much of the coastal lowland area is developed. Hence, even small fires can be hazardous, and after fire these coastal areas are vulnerable to flooding. So since the study area is a coastal area and more than half of it is occupied by urban and burned areas, is at high risk of flooding.
In the present study, a method is presented to assess the flood hazard in burned areas and it can be applied even outside the localities affected by the fire. It provides an estimation of flood-prone areas where data are not available, which are typically used more often in connection with floods. Six physical and anthropogenic factors were considered as the most relevant parameters affecting the watercourse when intense storm events cause high runoff that exceeds drainage system capacity. The physical factors, related to flood activity, were slope, elevation, distance from open channel streams, and hydrolithology. The anthropogenic factors associated with floods were distance from totally covered streams, along with burnt and urban areas derived from land cover, as well as supplementary land uses.
A flood hazard assessment map was created via the AHP method and a GIS. According to Hervás and Bobrowsky [57], flood hazard refers to the probability of flood occurrence within a reference period of time. In the present study, the link of the flood hazard assessment to return periods was not possible. So, a flood susceptibility map was produced which refers to the spatial likelihood or probability for a flood to occur in the future. This map represents the potential flood hazard in the study area, and was further categorized by using the standard deviation method with five classes (Figure 6) of hazard level: very low, low, moderate, high and very high.
The areas of flood hazard varying between very high and high were recorded mostly in the eastern and southern parts of the Nea Makri area. The area of these two hazard zones covers almost 40% of the whole area (Table 4). In Greece, extreme flash flood events of low frequency and high magnitude occur in many fluvial systems with a relatively small extent drained by ephemeral streams [58]. Thus, the small drainage basins, along with the torrential behavior of the streams, influence the flood manifestations in the study area. Moreover, the lowland morphology, gentle slope, the covered streams and intense urbanization in the eastern part of the municipality unit of Nea Makri increase the runoff and produce encouraging locations for flood occurrences. According to Shakesby [59], in Euro-Mediterranean regions wildfires in forests leave the terrain bare and vulnerable to storms which can cause severe runoff and soil erosion. The runoff increases often in the upper parts of watersheds, and thus poses flooding risks in urban zones located downstream. Thus, the burned area in the southern part of the study area creates favorable conditions for flooding.
In contrast, low and very low flood hazard areas are situated in the mountainous northern, northwestern and western parts of the municipality unit of Nea Makri. These areas are not urbanized, contain open stream channels and do not include burned areas. Therefore, the hazard of flooding in these areas is very low. The spatial distribution of the moderate hazard zone is observed primarily in the central, eastern and southern parts of the municipality unit of Nea Makri. These three hazard zones cover almost 60% of the whole area (Table 4).
The AHP method is a powerful and valuable tool for flood hazard analysis [32,36,46,47], although it shows several constraints in assessing the impact of uncertainties [60,61]. This fact was evaluated by calculating two additional scenarios that present the upper and lower flood hazard values after accounting for the uncertainty in the weighting coefficients (Table 3). The findings of the uncertainty analysis showed that the two additional maps (FHmin and FHmax) illustrate a low variation of the presence of flood hazard zones (Table 5) concerning the basic flood hazard map (FHb). Consequently, the analysis proved slight differences in the spatial and quantitative distribution of the flood hazard zones. This fact indicates robust behavior for the predictions of the applied method.
The combination of several different maps can create a map that does not contain an area’s actual hazard level [62]. Thus, the basic flood hazard map was verified by means of frequency ratio and flood events which affected the study area over the past 20 years. The findings established that the vast majority of the floods, almost 90% (Table 5), were located within the limits of the high and very high flood hazard zones. Moreover, the frequency ratio was higher than 1 in the high and very high hazard zones, indicating that these hazard zones are strongly correlated with flood occurrences (Table 5). The flood hazard intensity rises as the frequency ratio values increase.
The applied method brings many advantages; first of all, that of offering completeness of the analysis of the territory and methodological homogeneity. It is simple and easy to use where primary data are scarce. The results provide reasonable values, which could lead to its further application. The used approach is, therefore, useful in synergy with methods linked to the attribution of a probability.
Comparing the existing urban fabric and road network to the proposed hazard areas of the basic flood hazard map, it is recorded that the vast majority (77%) of the urban fabric and 50% of the road network’s length are situated within the boundaries of high and very high flood hazard zones (Table 6). This result demonstrated that they have been constructed in areas prone to flood. In these areas, proactive planning and selection of the proper construction rules are essential for the prevention and mitigation of the consequences of flood hazards.
Detailed works relating to the condition of events and evolution of natural hazards and the vulnerability of the exposed elements at risk (i.e., buildings) will help propose the proper protection measures [46]. The application of the procedure facilitates identifying those sites from the already existing urban fabric and road network situated in non-safe areas. Thus, the appropriate mitigation or hazard reduction approaches can be more effectively designed and applied. Furthermore, the awareness of the non-safe regions related to flood hazard might be helpful in emergency preparedness planning.
Therefore, scientists, engineers, stakeholders, planners and decision makers may utilize the proposed approach in forthcoming spatial planning projects [63,64,65,66,67,68]. Additionally, the local authorities may use the produced map to guide the adoption of measures and strategies aiming towards flood hazard mitigation and post-fire management.
6. Conclusions
In the present work, a burned and urban area of the Attica peninsula in central Greece was selected to produce a flood hazard assessment map. The proposed areas of very high and high flood hazard are located mainly in the study area’s eastern and southern parts as a consequence of the synthesis of lowlands with gentle slope, ephemeral streams with torrential behavior, totally covered streams and urban areas. The burned area in southern part of the study area will increase surface runoff and create favorable conditions for flooding. The uncertainty analysis showed insignificant variations of the spatial distribution of the flood hazard zones. The flood hazard map presents a significant correlation between the flood hazard zones and the spatial distribution of flood phenomena. This verification demonstrated reliable results and high accuracy of the created map. The spatial distribution of the existent urban fabric and road network was analyzed to identify the parts situated in unsafe areas to design and apply flood hazard mitigation measures. About 80% of the urban areas and 50% of the road network’s length were located within areas prone to flood. The proposed method offers completeness of the analysis of the territory, is simple to apply where primary data are scarce and provides reasonable results, which could lead to its further application. Therefore, scientists, stakeholders, engineers and decision makers may apply the proposed approach in forthcoming land use planning projects. Flood hazard mitigation techniques can be more effectively designed, while the proposed approach may be useful also in emergency preparedness planning and post-fire management.
Author Contributions
Conceptualization, G.D.B. and H.D.S.; methodology, G.D.B. and H.D.S.; software, G.D.B. and H.D.S.; validation, G.D.B. and H.D.S.; formal analysis, G.D.B. and H.D.S.; investigation, G.D.B., H.D.S. and D.E.A.; resources, G.D.B., H.D.S. and D.E.A.; data curation, G.D.B. and H.D.S.; writing—original draft preparation, G.D.B., H.D.S. and D.E.A.; writing—review and editing, G.D.B., H.D.S. and D.E.A.; visualization, G.D.B. and H.D.S.; supervision, G.D.B. and H.D.S. All authors have read and agreed to the published version of the manuscript.
Funding
This research received no external funding.
Institutional Review Board Statement
Not applicable.
Informed Consent Statement
Not applicable.
Data Availability Statement
Data that support the findings of this study are available from the corresponding author upon reasonable request.
Acknowledgments
The constructive and thorough reviews of anonymous reviewers are warmly acknowledged.
Conflicts of Interest
The authors declare no conflict of interest.
References
- Cerdà, A. Effect of Climate on Surface Flow Along a Climatological Gradient in Israel: A Field Rainfall Simulation Approach. J. Arid Environ. 1998, 38, 145–159. [Google Scholar] [CrossRef]
- Bathrellos, G.D.; Skilodimou, H.D.; Maroukian, H. The spatial distribution of Middle and Late Pleistocene cirques in Greece. Geogr. Ann. 2014, 96, 323–338. [Google Scholar] [CrossRef]
- Skilodimou, H.D.; Bathrellos, G.D.; Maroukian, H.; Gaki-Papanastassiou, K. Late Quaternary evolution of the lower reaches of Ziliana stream in south Mt. Olympus (Greece). Geogr. Fis. Din. Quat. 2014, 37, 43–50. [Google Scholar]
- Bathrellos, G.D.; Skilodimou, H.D.; Maroukian, H.; Gaki-Papanastassiou, K.; Kouli, K.; Tsourou, T.; Tsaparas, N. Pleistocene glacial and lacustrine activity in the southern part of Mount Olympus (central Greece). Area 2017, 49, 137–147. [Google Scholar] [CrossRef]
- Kamberis, E.; Bathrellos, G.; Kokinou, E.; Skilodimou, H. Correlation between the structural pattern and the development of the hydrographic network in a portion of the Western Thessaly basin (Greece). Cent. Eur. J. Geosci. 2012, 4, 416–424. [Google Scholar] [CrossRef] [Green Version]
- Kokinou, E.; Skilodimou, H.D.; Bathrellos, G.D.; Antonarakou, A.; Kamberis, E. Morphotectonic analysis, structural evolution/pattern of a contractional ridge: Giouchtas Mt., Central Crete, Greece. J. Earth Syst. Sci. 2015, 124, 587–602. [Google Scholar]
- Chousianitis, K.; Del Gaudio, V.; Sabatakakis, N.; Kavoura, K.; Drakatos, G.; Bathrellos, G.D.; Skilodimou, H.D. Assessment of Earthquake-Induced Landslide Hazard in Greece: From Arias Intensity to Spatial Distribution of Slope Resistance Demand. Bull. Seismol. Soc. Am. 2016, 106, 174–188. [Google Scholar] [CrossRef]
- Bathrellos, G.D.; Skilodimou, H.D.; Maroukian, H. The significance of tectonism in the glaciations of Greece. Geol. Soc. 2017, 433, 237–250. [Google Scholar] [CrossRef]
- Papadopoulou-Vrynioti, K.; Bathrellos, G.D.; Skilodimou, H.D.; Kaviris, G.; Makropoulos, K. Karst collapse susceptibility mapping considering peak ground acceleration in a rapidly growing urban area. Eng. Geol. 2013, 158, 77–88. [Google Scholar] [CrossRef]
- Τsolaki-Fiaka, S.; Bathrellos, G.D.; Skilodimou, H.D. Multi-Criteria Decision Analysis for an Abandoned Quarry in the Evros Region (NE Greece). Land 2018, 7, 43. [Google Scholar] [CrossRef] [Green Version]
- Skilodimou, H.D.; Bathrellos, G.D.; Koskeridou, E.; Soukis, K.; Rozos, D. Physical and anthropogenic factors related to landslide activity in the Northern Peloponnese, Greece. Land 2018, 7, 85. [Google Scholar] [CrossRef] [Green Version]
- Bathrellos, G.D.; Kalivas, D.P.; Skilodimou, H.D. GIS-based landslide susceptibility mapping models applied to natural and urban planning in Trikala, Central Greece. Estud. Geol. 2009, 65, 49–65. [Google Scholar] [CrossRef] [Green Version]
- Bathrellos, G.D.; Skilodimou, H.D.; Soukis, K.; Koskeridou, E. Temporal and Spatial Analysis of Flood Occurrences in the Drainage Basin of Pinios River (Thessaly, Central Greece). Land 2018, 7, 106. [Google Scholar] [CrossRef] [Green Version]
- Skilodimou, H.D.; Livaditis, G.; Bathrellos, G.D.; Verikiou-Papaspiridakou, E. Investigating the flooding events of the urban regions of Glyfada and Voula, Attica, Greece: A contribution to Urban Geomorphology. Geogr. Ann. 2003, 85, 197–204. [Google Scholar] [CrossRef]
- Merz, B.; Kreibich, H.; Schwarze, R.; Thieken, A. Assessment of economic flood damage. Nat. Hazards Earth Syst. Sci. 2010, 10, 1679–1724. [Google Scholar] [CrossRef]
- European Environment Agency (EEA). Mapping the Impacts of Natural Hazards and Technological Accidents in Europe: An Overview of the Last Decade; Report 13/2010; Office for Official Publications of the European Communities, European Environment Agency (EEA): Luxembourg, 2010. [Google Scholar]
- Gaume, E.; Bain, V.; Bernardara, P.; Newinger, O.; Barbuc, M. A compilation of data on European flash floods. J. Hydrol. 2009, 367, 70–78. [Google Scholar] [CrossRef] [Green Version]
- Chuvieco, E.; Mouillot, F.; Pereira, J.M.C.; Oom, D. A new global burned area product for climate assessment of fire impacts. Glob. Ecol. Biogeogr. 2016, 5, 619–629. [Google Scholar] [CrossRef] [Green Version]
- Bassi, S.; Kettunen, M. Forest Fires: Causes and Contributing Factors in Europe; IP/A/ ENVI/ST/2007-15,PE401.003; European Parliament, Policy Department, Economic and Scientific Policy: Brussels, Belgium, 2008. [Google Scholar]
- Dennis, M.S.; Joseph, E.G.; Jason, W.K. Objective Definition of Rainfall Intensity-Duration Thresholds for Post-fire Flash Floods and Debris Flows in the Area Burned by the Waldo Canyon Fire, Colorado, USA. In Engineering Geology for Society and Territory; Lollino, G., Ed.; Springer: Cham, Switzerland, 2015; Volume 2. [Google Scholar]
- Fox, D.M.; Laaroussi, Y.; Malkinson, L.D.; Maselli, F.; Andrieu, J.; Bottai, L.; Wittenberg, L. POSTFIRE: A model to map forest fire burn scar and estimate runoff and soil erosion risks. Remote Sens. Appl. Soc. Environ. 2016, 4, 83–91. [Google Scholar] [CrossRef]
- Bathrellos, G.D.; Gaki-Papanastassiou, K.; Skilodimou, H.D.; Papanastassiou, D.; Chousianitis, K.G. Potential suitability for urban planning and industry development using natural hazard maps and geological–geomorphological parameters. Environ. Earth Sci. 2012, 66, 537–548. [Google Scholar] [CrossRef]
- Alexakis, D. Suburban areas in flames: Dispersion of potentially toxic elements from burned vegetation and buildings. Estimation of the associated ecological and human health risk. Environ. Res. 2020, 183, 109153. [Google Scholar] [CrossRef] [PubMed]
- Alexakis, D.; Kokmotos, I.; Gamvroula, D.; Varelidis, G. Wildfire effects on soil quality: Application on a suburban area of West Attica (Greece). Geosci. J. 2021, 25, 243–253. [Google Scholar] [CrossRef]
- Alexakis, D. Contaminated land by wildfire effect on ultramafic soil and associated human health and ecological risk. Land 2020, 9, 409. [Google Scholar] [CrossRef]
- Rahmati, O.; Zeinivand, H.; Besharat, M. Flood hazard zoning in Yasooj region, Iran, using GIS and multi-criteria decision analysis. Geomat. Nat. Hazards Risk 2016, 7, 1000–1017. [Google Scholar] [CrossRef] [Green Version]
- Fernández, D.S.; Lutz, M.A. Urban flood hazard zoning in Tucumán Province, Argentina, using GIS and multicriteria decision analysis. Eng. Geol. 2010, 111, 90–98. [Google Scholar] [CrossRef]
- Merwade, V.; Cook, A.; Coonrod, J. GIS techniques for creating river terrain models for hydrodynamic modeling and flood inundation mapping. Environ. Model. Softw. 2008, 23, 1300–1311. [Google Scholar] [CrossRef]
- Tate, E.C.; Maidment, D.R.; Olivera, F.; Anderson, D.J. Creating a terrain model for floodplain mapping. J. Hydrol. Eng. 2002, 7, 100–108. [Google Scholar] [CrossRef]
- De Moel, H.; van Alphen, J.; Aerts, J.C.J.H. Flood maps in Europe—Methods, availability and use. Nat. Hazards Earth Syst. Sci. 2009, 9, 289–301. [Google Scholar] [CrossRef] [Green Version]
- Stefanidis, S.; Stathis, D. Assessment of flood hazard based on natural and anthropogenic factors using analytic hierarchy process (AHP). Nat. Hazards 2013, 68, 569–585. [Google Scholar] [CrossRef]
- Bathrellos, G.D.; Karymbalis, E.; Skilodimou, H.D.; Gaki-Papanastassiou, K.; Baltas, E.A. Urban flood hazard assessment in the basin of Athens Metropolitan city, Greece. Environ. Earth Sci. 2016, 75, 319. [Google Scholar] [CrossRef]
- Saaty, T.L. A scaling method for priorities in hierarchical structures. J. Math. Psychol. 1977, 15, 234–281. [Google Scholar] [CrossRef]
- Saaty, T.L. How to make a decision: The Analytic Hierarchy Process. Eur. J. Oper. Res. 1990, 48, 9–26. [Google Scholar] [CrossRef]
- Saaty, T.L. Decision making—The Analytic Hierarchy and Network Processes (AHP/ANP). J. Syst. Sci. Syst. Eng. 2004, 13, 1–35. [Google Scholar] [CrossRef]
- Bathrellos, G.D.; Gaki-Papanastassiou, K.; Skilodimou, H.D.; Skianis, G.A.; Chousianitis, K.G. Assessment of rural community and agricultural development using geomorphological-geological factors and GIS in the Trikala prefecture (Central Greece). Stoch. Environ. Res. Risk Assess. 2013, 27, 573–588. [Google Scholar] [CrossRef]
- Bathrellos, G.D.; Kalivas, D.P.; Skilodimou, H.D. Landslide Susceptibility Assessment Mapping: A Case Study in Central Greece. In Remote Sensing of Hydrometeorological Hazards; Petropoulos, G.P., Islam, T., Eds.; CRC Press, Taylor & Francis Group: London, UK, 2017; pp. 493–512. ISBN 13978-1498777582. [Google Scholar]
- Georgiopoulos, G.; Kambas, M. ‘Armageddon’ Fire in Greece Kills at Least 80, Many Missing. In Reuters. 2018. Available online: https://www.reuters.com/article (accessed on 25 July 2018).
- Mitsopoulos, I.; Mallinis, G.; Dimitrakopoulos, A.; Xanthopoulos, G.; Eftychidis, G.; Goldammer, J.G. Vulnerability of peri-urban and residential areas to landscape fires in Greece: Evidence by wildland-urban interface data. Data Brief 2020, 31, 106025. [Google Scholar] [CrossRef]
- Authority, H.S. 2011 Population-Housing Census. 2011. Available online: www.statistics.gr/en/2011-census-pop-house (accessed on 27 December 2018).
- Ministry of Environment and Energy. Floods, Historic Floods. 2019. Available online: http://www.ypeka.gr/Default.aspx?tabid=252&language=el-GR (accessed on 21 February 2021).
- Copernicus. Copernicus Land Monitoring Service. 2016. Available online: http://land.copernicus.eu (accessed on 21 February 2021).
- Copernicus. Urban Atlas 2018. Copernicus Land Monitoring Service. 2021. Available online: https://land.copernicus.eu/local/urban-atlas/urban-atlas-2018 (accessed on 21 February 2021).
- European Council. EU Directive of the European Parliament and of the European Council on the Assessment and Management of Flood Risks (2007/60/EU); European Council: Brussels, Belgium, 2007. [Google Scholar]
- Papaioannou, G.; Vasiliades, L.; Loukas, A. Multi-criteria analysis framework for potential flood prone areas mapping. Water Resour. Manag. 2015, 29, 399–418. [Google Scholar] [CrossRef]
- Bathrellos, G.D.; Skilodimou, H.D.; Chousianitis, K.; Youssef, A.M.; Pradhan, B. Suitability estimation for urban development using multi-hazard assessment map. Sci. Total Environ. 2017, 575, 119–134. [Google Scholar] [CrossRef] [PubMed]
- Skilodimou, H.D.; Bathrellos, G.D.; Chousianitis, K.; Youssef, A.M.; Pradhan, B. Multi-hazard assessment modeling via multi-criteria analysis and GIS: A case study. Environ. Earth Sci. 2019, 78, 47. [Google Scholar] [CrossRef]
- Migiros, G.; Bathrellos, G.D.; Skilodimou, H.D.; Karamousalis, T. Pinios (Peneus) River (Central Greece): Hydrological—Geomorphological elements and changes during the Quaternary. Cent. Eur. J. Geosci. 2011, 3, 215–228. [Google Scholar] [CrossRef]
- Youssef, A.M.; Sefry, S.A.; Pradhan, B.; Al Fadail, E.A. Analysis on causes of flash flood in Jeddah city (Kingdom of Saudi Arabia) of 2009 and 2011 using multi-sensor remote sensing data and GIS. Geomat. Nat. Haz. Risk 2016, 7, 1018–1042. [Google Scholar] [CrossRef]
- Hutchinson, M.F.; Xu, T.; Stein, J.A. Recent progress in the ANUDEM elevation gridding procedure. Geomorphometry 2011, 2011, 19–22. [Google Scholar]
- Arun, P.V. A comparative analysis of different DEM interpolation methods. Egypt. J. Remote Sens. Space Sci. 2013, 16, 133–139. [Google Scholar]
- Bathrellos, G.D.; Skilodimou, H.D.; Kelepertsis, A.; Alexakis, D.; Chrisanthaki, I.; Archonti, D. Environmental research of groundwater in the urban and suburban areas of Attica region, Greece. Environ. Geol. 2008, 56, 11–18. [Google Scholar] [CrossRef]
- Van Westen, C.; Kappes, M.S.; Luna, B.Q.; Frigerio, S.; Glade, T.; Malet, J.P. Medium-scale multi-hazard risk assessment of gravitational processes. In Mountain Risks: From Prediction to Management and Governance; Springer: Dordrecht, The Netherlands, 2014; pp. 201–231. [Google Scholar]
- Lee, S.; Pradhan, B. Probabilistic landslide hazards and risk mapping on Penang Island, Malaysia. J. Earth Syst. Sci. 2006, 115, 661–672. [Google Scholar] [CrossRef]
- Rozos, D.; Skilodimou, H.D.; Loupasakis, C.; Bathrellos, G.D. Application of the revised universal soil loss equation model on landslide prevention. An example from N. Euboea (Evia) Island, Greece. Environ. Earth Sci. 2013, 70, 3255–3266. [Google Scholar] [CrossRef]
- Pradhan, B.; Lee, S. Delineation of landslide hazard areas on Penang Island, Malaysia, by using frequency ratio, logistic regression, and artificial neural network models. Environ. Earth Sci. 2010, 60, 1037–1054. [Google Scholar] [CrossRef]
- Hervás, J.; Bobrowsky, P. Mapping: Inventories, susceptibility, hazard and risk. In Landslides—Disaster Risk Reduction; Springer: Berlin/Heidelberg, Germany, 2009; pp. 321–349. [Google Scholar]
- Karymbalis, E.; Katsafados, P.; Chalkias, C.; Gaki-Papanastassiou, K. An integrated study for the evaluation of natural and anthropogenic causes of flooding in small catchments based on geomorphological and meteorological data and modeling techniques: The case of the Xerias torrent (Corinth, Greece). Z. Geomorphol. 2012, 56, 45–67. [Google Scholar] [CrossRef]
- Shakesby, R.A. Post-wildfire soil erosion in the Mediterranean: Review and future research directions. Earth Sci. Rev. 2011, 105, 71–100. [Google Scholar] [CrossRef]
- Rozos, D.; Bathrellos, G.D.; Skilodimou, H.D. Comparison of the implementation of rock engineering system and analytic hierarchy process methods, upon landslide susceptibility mapping, using GIS: A case study from the Eastern Achaia County of Peloponnesus, Greece. Environ. Earth Sci. 2011, 63, 49–63. [Google Scholar] [CrossRef]
- Nefeslioglu, H.A.; Sezer, E.A.; Gokceoglu, C.; Ayas, Z. A modified analytical hierarchy process (M-AHP) approach for decision support systems in natural hazard assessments. Comput. Geosci. 2013, 59, 1–8. [Google Scholar] [CrossRef]
- Kappes, M.S.; Keiler, M.; von Elverfeldt, K.; Glade, T. Challenges of analyzing multi-hazard risk: A review. Nat. Hazards 2012, 64, 1925–1958. [Google Scholar] [CrossRef] [Green Version]
- Bathrellos, G.D.; Skilodimou, H.D. Land Use Planning for Natural Hazards. Land 2019, 8, 128. [Google Scholar] [CrossRef] [Green Version]
- Makri, P.; Stathopoulou, E.; Hermides, D.; Kontakiotis, G.; Zarkogiannis, S.D.; Skilodimou, H.D.; Bathrellos, G.D.; Antonarakou, A.; Scoullos, M. The Environmental Impact of a Complex Hydrogeological System on Hydrocarbon-Pollutants’ Natural Attenuation: The Case of the Coastal Aquifers in Eleusis, West Attica, Greece. J. Mar. Sci. Eng. 2020, 8, 1018. [Google Scholar] [CrossRef]
- Panagopoulos, G.P.; Bathrellos, G.D.; Skilodimou, H.D.; Martsouka, F.A. Mapping Urban Water Demands Using Multi-Criteria Analysis and GIS. Water Resour. Manag. 2012, 26, 1347–1363. [Google Scholar] [CrossRef]
- Papadopoulou-Vrynioti, K.; Alexakis, D.; Bathrellos, G.D.; Skilodimou, H.D.; Vryniotis, D.; Vasiliades, E.; Gamvroula, D. Distribution of trace elements in stream sediments of Arta plain (western Hellas): The influence of geomorphological parameters. J. Geochem. Explor. 2013, 134, 17–26. [Google Scholar] [CrossRef]
- Papadopoulou-Vrynioti, K.; Alexakis, D.; Bathrellos, G.D.; Skilodimou, H.D.; Vryniotis, D.; Vasiliades, E. Environmental research and evaluation of agricultural soil of the Arta plain, western Hellas. J. Geochem. Explor. 2014, 136, 84–92. [Google Scholar] [CrossRef]
- Skilodimou, H.; Stefouli, M.; Bathrellos, G. Spatio-temporal analysis of the coastline of Faliro Bay, Attica, Greece. Estud. Geol.-Madrid 2002, 58, 87–93. [Google Scholar]
Figure 1.
(A) Map showing the location of the study area. (B) Map illustrating the variation of elevations, the spatial extent of the drainage network and the roads, along with the main towns, in the study area.
Figure 1.
(A) Map showing the location of the study area. (B) Map illustrating the variation of elevations, the spatial extent of the drainage network and the roads, along with the main towns, in the study area.

Figure 2.
Thematic maps showing: (A) the classes of slopes; (B) the classes of elevations.

Figure 3.
Maps of streams depicting distance from: (A) open channel streams and third-order streams; (B) totally covered streams and third-order streams; (C) open channel streams and fourth-order streams; (D) totally covered streams and fourth-order streams.
Figure 3.
Maps of streams depicting distance from: (A) open channel streams and third-order streams; (B) totally covered streams and third-order streams; (C) open channel streams and fourth-order streams; (D) totally covered streams and fourth-order streams.

Figure 4.
Thematic maps showing: (A) the spatial distribution of hydrolithological formations and (B) land cover in the study area.
Figure 4.
Thematic maps showing: (A) the spatial distribution of hydrolithological formations and (B) land cover in the study area.

Figure 5.
Map showing the spatial distribution of flood events in the study area.

Figure 6.
The basic flood hazard (FHb) assessment map.

Figure 7.
Maps illustrating (A) the higher (FHmax) and (B) the lower (FHmin) values of the flood hazard assessment.
Figure 7.
Maps illustrating (A) the higher (FHmax) and (B) the lower (FHmin) values of the flood hazard assessment.


Table 1.
The rate values for each class of the involved factors.
| Factors | Classes | Rating |
|---|---|---|
| Slope (°) | <2 | 4 |
| 2–6 | 3 | |
| 6–12 | 2 | |
| 12–20 | 1 | |
| >20 | 0 | |
| Elevation (m a.s.l.) | <50 | 4 |
| 50–100 | 3 | |
| 100–200 | 2 | |
| 200–300 | 1 | |
| >300 | 0 | |
| Distance from open channel streams (m) | third-order stream | |
| 0–50 | 4 | |
| 50–100 | 3 | |
| 100–200 | 2 | |
| 200–300 | 1 | |
| >300 | 0 | |
| fourth-order stream | ||
| 0–100 | 4 | |
| 100–200 | 3 | |
| 200–300 | 2 | |
| 300–400 | 1 | |
| >400 | 0 | |
| Distance from totally covered streams (m) | third-order stream | |
| 0–50 | 4 | |
| 50–100 | 3 | |
| 100–200 | 2 | |
| 200–400 | 1 | |
| >400 | 0 | |
| fourth-order stream | ||
| 0–100 | 4 | |
| 100–200 | 3 | |
| 200–300 | 2 | |
| 300–500 | 1 | |
| >500 | 0 | |
| Hydrolithology | permeable | 1 |
| semipermeable | 2 | |
| impermeable | 3 | |
| Land cover | urban area | 4 |
| cropland | 2 | |
| woodland | 0 | |
| shrubland and grassland | 1 | |
| sparse vegetation area | 3 | |
| burned area | 4 |
Table 2.
The weights of the factors and the consistency ratio (CR), where F1 = slope, F2 = elevation, F3 = distance from open channel streams, F4 = distance from totally covered streams, F5= hydrolithology and F6 = land cover.
Table 2.
The weights of the factors and the consistency ratio (CR), where F1 = slope, F2 = elevation, F3 = distance from open channel streams, F4 = distance from totally covered streams, F5= hydrolithology and F6 = land cover.
| F1 | F2 | F3 | F4 | F5 | F6 | Weights, Wi | |
|---|---|---|---|---|---|---|---|
| F1 | 1 | 4 | 1/2 | 3 | 1/2 | 2 | 0.207 |
| F2 | 1 | 1/3 | 1/2 | 1/4 | 1/4 | 0.058 | |
| F3 | 1 | 3 | 1 | 1/3 | 0.088 | ||
| F4 | 1 | 1/3 | 1 | 0.260 | |||
| F5 | 1 | 1/3 | 0.104 | ||||
| F6 | 0.283 |
CR = 0.04.
Table 3.
The uncertainties (ΔWi) of the weighting coefficient for each factor.
| Factors | ΔWi |
|---|---|
| Slope | 0.041 |
| Elevation | 0.012 |
| Open streams | 0.018 |
| Covered streams | 0.052 |
| Hydrolithology | 0.021 |
| Land cover | 0.057 |
Table 4.
Percentages represent the area of each flood hazard zone (areas are shown in Figure 6 and Figure 7).
| Flood Hazard Zones | Percentage % of Total Study Area | ||
|---|---|---|---|
| FH | FHmax | FHmin | |
| Very low | 14.4 | 16.5 | 14.4 |
| Low | 25.6 | 23.5 | 25.3 |
| Moderate | 20.1 | 19.6 | 19.0 |
| High | 20.1 | 20.6 | 21.4 |
| Very high | 19.8 | 20.1 | 20.1 |
Table 5.
The frequency ratio (FR) values of floods in flood hazard zones; A = area of each flood hazard zone in Km2, AC = the area ratio for each flood hazard zone to the total area in a percentage form, Fn = number of floods in each zone, FF = the frequency of floods expressed in percentage.
Table 5.
The frequency ratio (FR) values of floods in flood hazard zones; A = area of each flood hazard zone in Km2, AC = the area ratio for each flood hazard zone to the total area in a percentage form, Fn = number of floods in each zone, FF = the frequency of floods expressed in percentage.
| Flood Hazard Zones | A | AC | FN | FF | FR |
|---|---|---|---|---|---|
| Very low | 4.7 | 14.4 | 0 | 0.0 | 0.0 |
| Low | 8.4 | 25.6 | 0 | 0.0 | 0.0 |
| Moderate | 6.6 | 20.1 | 1 | 11.1 | 0.6 |
| High | 6.6 | 20.1 | 3 | 33.3 | 1.7 |
| Very high | 6.5 | 19.8 | 5 | 55.6 | 2.8 |
Table 6.
Urban fabric area (UF) and length of the road network (RN) that fall into each flood hazard zone.
Table 6.
Urban fabric area (UF) and length of the road network (RN) that fall into each flood hazard zone.
| Flood Hazard Zones | UF (Km2) | % | RN (Km) | % |
|---|---|---|---|---|
| Very low | 0.0 | 0 | 22.5 | 6 |
| Low | 0.5 | 4 | 79.2 | 22 |
| Moderate | 2.7 | 19 | 82.0 | 22 |
| High | 5.4 | 37 | 83.4 | 23 |
| Very high | 5.7 | 40 | 99.4 | 27 |
| Total | 14.3 | 100 | 366.5 | 100 |
Publisher’s Note: MDPI stays neutral with regard to jurisdictional claims in published maps and institutional affiliations. |
© 2021 by the authors. Licensee MDPI, Basel, Switzerland. This article is an open access article distributed under the terms and conditions of the Creative Commons Attribution (CC BY) license (https://creativecommons.org/licenses/by/4.0/).
Share and Cite
MDPI and ACS Style
Skilodimou, H.D.; Bathrellos, G.D.; Alexakis, D.E. Flood Hazard Assessment Mapping in Burned and Urban Areas. Sustainability 2021, 13, 4455. https://0-doi-org.brum.beds.ac.uk/10.3390/su13084455
AMA Style
Skilodimou HD, Bathrellos GD, Alexakis DE. Flood Hazard Assessment Mapping in Burned and Urban Areas. Sustainability. 2021; 13(8):4455. https://0-doi-org.brum.beds.ac.uk/10.3390/su13084455
Chicago/Turabian StyleSkilodimou, Hariklia D., George D. Bathrellos, and Dimitrios E. Alexakis. 2021. "Flood Hazard Assessment Mapping in Burned and Urban Areas" Sustainability 13, no. 8: 4455. https://0-doi-org.brum.beds.ac.uk/10.3390/su13084455
Note that from the first issue of 2016, this journal uses article numbers instead of page numbers. See further details here.