Article

System Dynamics as Ex Ante Impact Assessment Tool in International Development Cooperation: Study Case of Urban Sustainability Policies in Darkhan, Mongolia

by
Patricia Chica-Morales
1,*,
Victor F. Muñoz
2 and
Antonio J. Domenech
3
1
Doctoral Program in Economics and Business, University of Malaga, 29071 Malaga, Spain
2
System Engineering and Automation, University of Málaga, 29071 Malaga, Spain
3
East Asian Studies Department, University of Málaga, 29071 Malaga, Spain
*
Author to whom correspondence should be addressed.
Sustainability 2021, 13(8), 4595; https://0-doi-org.brum.beds.ac.uk/10.3390/su13084595
Submission received: 1 March 2021 / Revised: 13 April 2021 / Accepted: 14 April 2021 / Published: 20 April 2021

Abstract

:
In recent years, there has been a trend of increasing criticism towards official development assistance (ODA) and the optimization of ODA policies, in a world of growing inequality between the Global North and Global South. To contribute to efficient ODA planning, this article proposes to innovatively apply system dynamics as an optimal tool for ex ante impact assessment. The study case is located in the slums of Darkhan (Mongolia), whose citizens and environment suffer the consequences of poor urban planning and lack of municipal solid waste management (MSWM). In this context, the present research proposes a policy of education and infrastructure as key factors for the improvement of MSWM in the context of an international cooperation plan, carried out by the Korean agency KOICA. To evaluate its impact and anticipate its effects, a tailor-made system dynamics model of a Darkhan district has been created, with the focus on the education process in order to simulate the different options of the proposed policies. The results show that education policy is particularly relevant for behavioral change, in terms of reducing waste burned and waste on the ground, and increasing composted and recycled waste. However, in this context, the policy is ineffective for improving the district’s water and air pollution situation. This article also offers discussions and recommendations to be applied to the international cooperation plan, which takes place in real life. It is expected that the described process of model construction and its results will contribute to the further use of system dynamics as a planning tool in the international cooperation field.

1. Introduction

Official development assistance (ODA) is an instrument of international development cooperation for the promotion of human, sustainable, and gender-equitable development [1,2,3]. One of the modalities of ODA and international cooperation in education for sustainable development is as an agent of change, towards more environmentally conscious citizenship [4,5].
In recent decades, ODA has faced a strong debate on the effectiveness and coherence of policies, reflected in the low impact of resources used and lack of adequacy of said resources [6,7,8,9,10]. In this respect, the correct planning of development interventions plays an essential role, as the future provision of objectives and resources will depend on this. Bilateral ODA agencies have traditionally used tools based on analysis, observation, and judgment for planning, with the logical framework approach and project cycle management being the main representatives, due to their greater ease of use [10,11]. However, these tools generally lack a methodological basis capable of anticipating the quantitative impact of policies [10,11,12,13]. In terms of this concern, the European Union and academia encourage the use of tools that reveal the ex ante impact and effectiveness of interventions over time, before their implementation [12,14,15,16].
In this context, system dynamics, an analyzing and modeling methodology that allows the simulation of policies in complex contexts [17,18,19], appears to be an effective tool for decision making in international development cooperation. System dynamics have previously been extensively proven for policy making and the ex ante impact assessment of environmental policies [20,21,22], natural resource management [19,21,23], and sustainable urban planning [24,25,26,27]. However, no evidence has been found of its use in official development assistance policies, so we will take advantage of this void to introduce it and implement its virtues in this field.
To see how system dynamics can support development policy decision making, we will use a Korea International Cooperation Agency (KOICA) case study. KOICA is an international benchmark, a renowned ODA agency that bases its model on Korea’s own experience as a former developing country, in addition to its strong support for education, infrastructure, and rural development in Asia [28,29,30]. From the different regions where KOICA cooperates, we will look at Mongolia, a country characterized by having around 50% of the population living in the so-called ger districts, slums of traditionally nomadic families rapidly moved to and settled in the traditional nomadic yurts (ger in Mongolian). These districts currently suffer serious urban planning, pollution, and public health problems [31,32,33].
Deficient municipal solid waste management (MSWM) is identified as a cross-cutting element which intertwines the aforementioned districts’ problems. There is a lack of municipal attention, evidenced by infrequent waste collection [34,35] and a lack of environmental education in the promotion of the correct separation of household waste and awareness of the environmental consequences of behavior [35], among others. This results in dirty, unsafe streets with waste on the ground, polluting the soil and water [32,36,37], and a more polluted atmosphere, due to using waste burning as a heating method on household stoves [38]. Slum district 15 of Darkhan city, in the north of Mongolia, was chosen due to the uniqueness of the environment in which it develops. First, the area has a small number of inhabitants—8647 people [39]—which might work as a “laboratory” to experiment with MSWM policies. Additionally, the population is sensitive to public participation and the role of neighbors due to the loss of the community activity aspect of their nomadic heritage, which can make it easier to spread better environmental attitudes among citizens [34,35,40,41]. Finally, despite being Mongolia’s second largest city and having serious environmental problems [42,43,44], it receives scant attention from international development cooperation and multilateral institutions in general. This is reflected in the small number of international reports and programs carried out in this city and in the limited articles in high-impact journals carried out in comparison with those of Ulaanbatar. For this reason, we refer throughout the article to many primary sources and the only known research on residential waste separation behavioral intention in Darkhan [35] which involved interviews with the population of the ger districts to find out their behavioral intentions about source separation.
Faced with the dire situation in Darkhan district 15, the Korean agency KOICA, together with other local actors, developed a plan that could provide sustainable urban planning solutions to Darkhan district 15 (see Figure 1), through an intervention called the Green Ger Village Master Plan. However, when following up the Plan through interim documents we found poor funding and weak policies have meant that tangible achievements towards its goals have not been made. To improve the plan’s impact, education and infrastructure policies to improve MSWM and urban sustainability based on the work of [35] are proposed to address the district’s various environmental and public health problems and to maximize environmental solutions. The policies would be funded by KOICA and the local government would oversee its maintenance. The education policy is aimed not only at a better environmental behavior in terms of source separation, but also at local and female empowerment through knowledge, incentive factors, and public participation. The infrastructure policy is aimed at the renovation, creation, and maintenance of MSWM facilities and resources. To see the different lines of the educational and infrastructure policy, read Appendix A.
MSWM problems have not created a situation unique to the Darkhan slums, but rather a situation shared in slums throughout the rest of the world. Literature on MSWM proposes source separation and waste reduction as a key element to alleviating MSW mismanagement in slums in developing countries [45,46,47,48,49]. In this sense, it is acknowledged that the so-called situational, knowledge, and incentive factors play a crucial role in this behavior [46,48,50]. The existence of situational factors (management infrastructure, recycling infrastructure, etc.) is considered to be an essential condition for the correct collection and subsequent management of waste [48,51]. However, subjective factors, such as the knowledge of correct waste management [45,48,52], awareness of perceived benefits such as incentive factors [53,54], public recognition [46,48,50], or environmental awareness [55] are also recognized as determining factors. They also highlight the importance of socioeconomic factors (gender, incomes, educational level, etc.) [48].
From a system dynamics approach, the simulation of policies to improve MSWM has also been addressed, usually focused on collection systems and their costs, transportation, and treatment. [56,57,58,59]. However, it was not until [54] that a model reflected a source separation policy and its effect on total waste generation and landfills. Sukholthaman and Sharp [51] evaluated different but constant percentages of the population performing source separation, and the impact of said ratios on the total waste generated and recycled. However, they did not include in the model the effect on other types of behavior (waste burning, waste to bins, recycling, etc.), or how the agents of behavioral change on source separation (knowledge, situational factors, and incentives) provide influence progressively over time. Neither does this, nor the previous applications mentioned, address the effects that this type of policy could have on the environment and public health.
Based on this research gap, and the particularities of Darkhan district 15, we propose the simulation of education and infrastructure policies to improve MSWM through system dynamics. The proposed model will make it possible to simulate different waste management policy alternatives, and to make efficient decisions in this respect. Unlike previous applications, the model will focus not only on waste management itself, but also on the effects of citizen education and the impact of this on the environment. To this end, we will draw on research that has previously addressed the importance of these aspects in different contexts [46,48]. Moreover, in contrast to other MSWM system dynamics models, this model focuses on education processes, seeking to identify the types of waste management behaviors that are strongly linked to education. This will allow us to anticipate the results before implementing the development plan, and make recommendations based on them, resulting in a more efficient use of ODA resources. The ultimate aim is to highlight the advantages of using tools, such as system dynamics, which allow anticipating the effects of policies before they are implemented within the Green Ger Village Master Plan, and in international development cooperation in general.

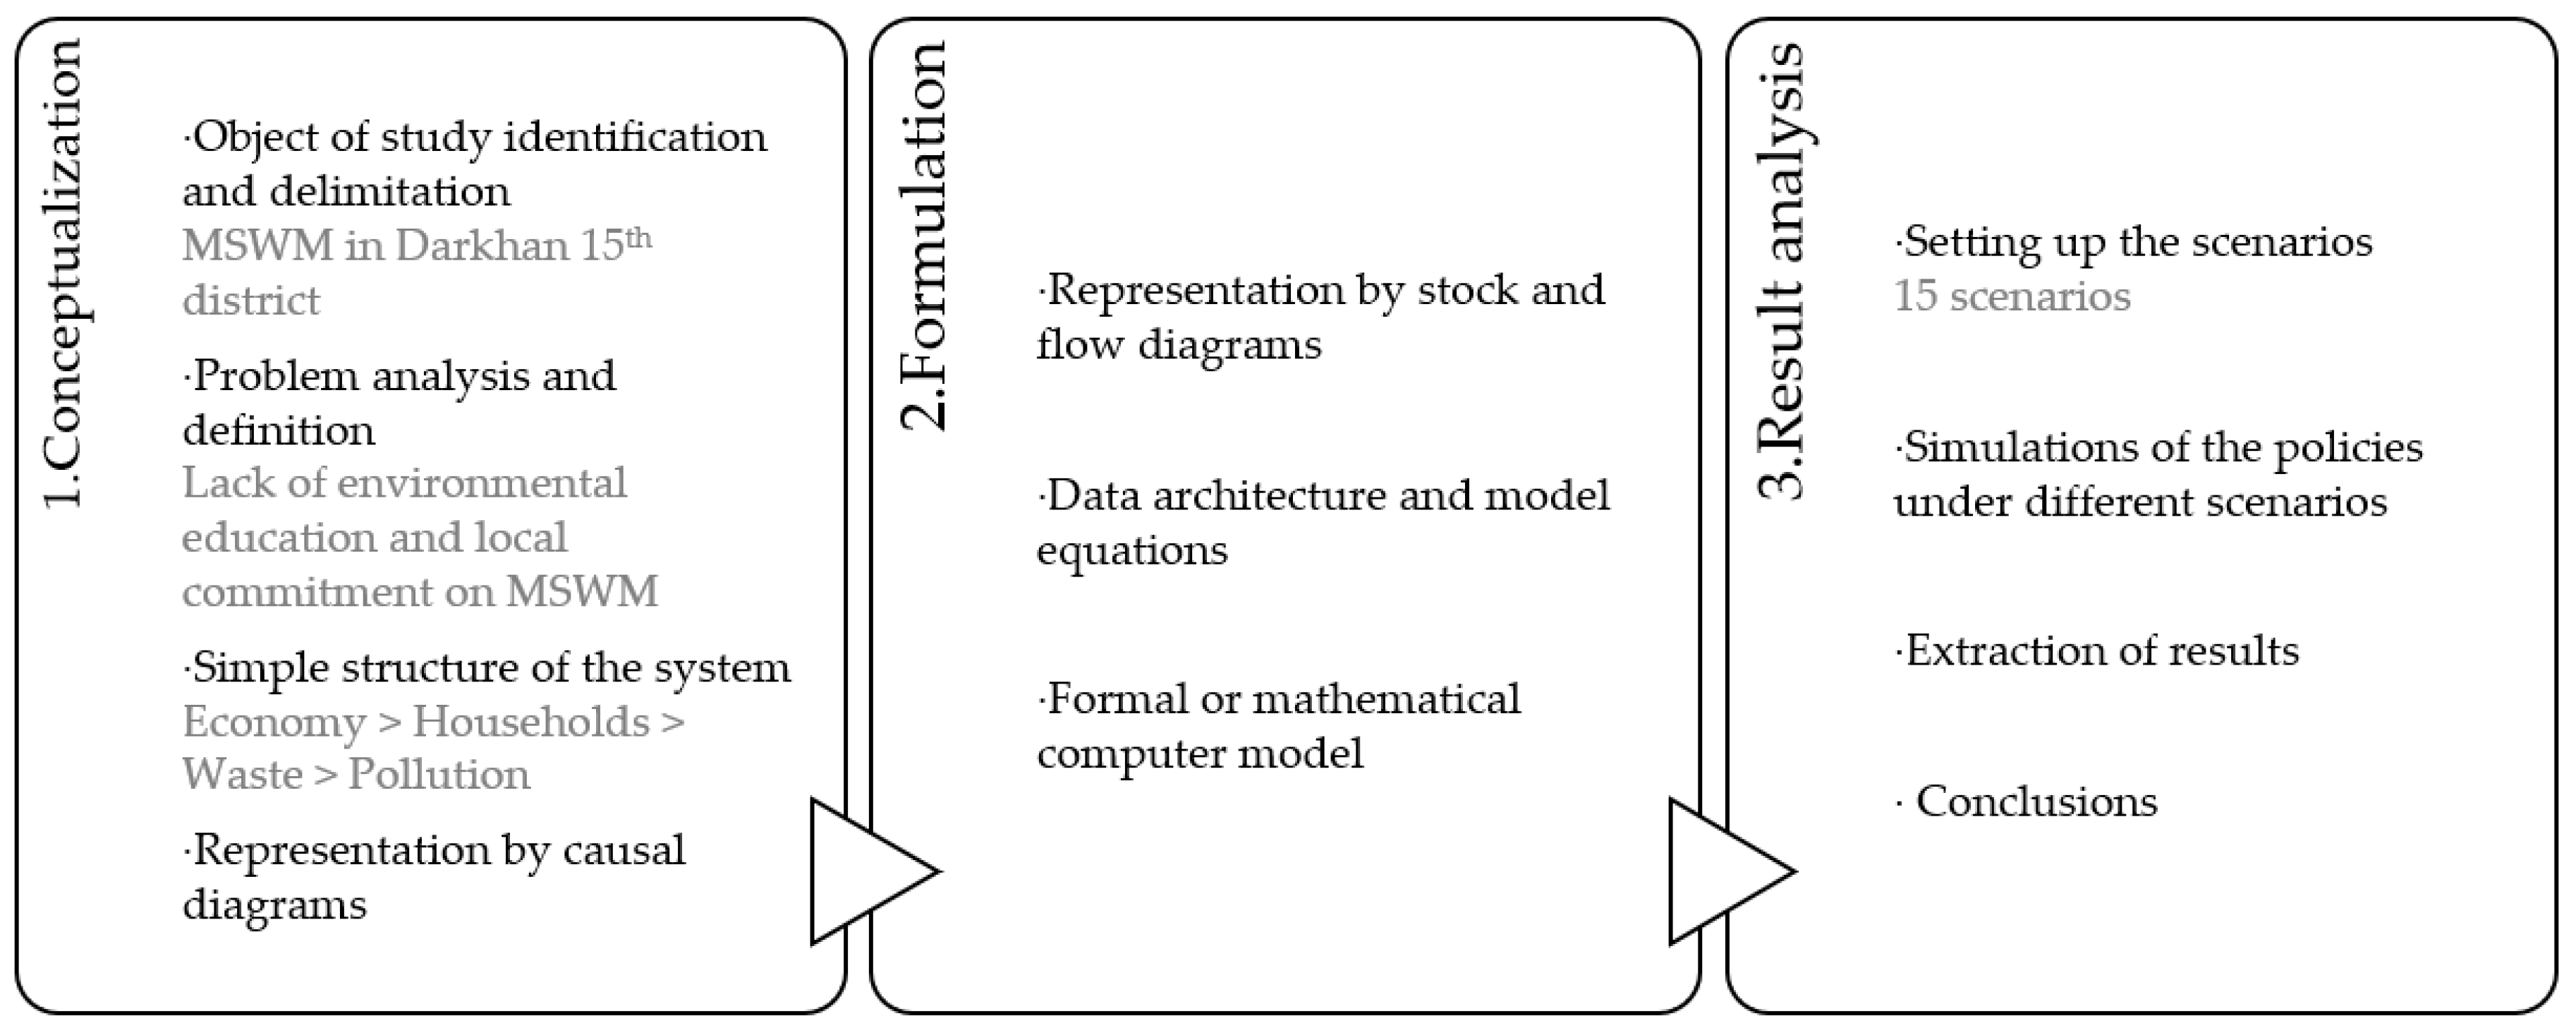
2. Materials and Method

System dynamics is an analysis and modeling methodology of temporal behavior in complex contexts which allows the simulation of policies, emulating their effects over time in a controlled environment [22,60]. The methodology works through non-linear models as an aggregation of cause–effect relationships between system variables. The integration of feedback loops, time delays, stocks, and flows of materials in cause–effect relationships make it suitable for reproducing the dynamic behavior of structures that are inherent in social and environmental contexts, using computer programs [60].
The construction process of a system dynamics model is systematized, comprising the conceptualization, formulation, and result analysis of the model. Thus, following the common steps [61,62], we will construct our model, named DARKHAN-15 (DARKHAN-15 refers to 15th ger district of Darkhan city), in which we will simulate MSWM policies. The first step, conceptualization, is essential for the successful functioning of the model, as it involves the understanding of the system and its translation into causal diagrams of relationships, on which the model will be constructed. This is followed by the formulation phase, representing its relationships as a stock and flow diagram, later integrated into simulation software with the model database, to form the mathematical model. This model will be able to simulate the system’s behavior, where the education and infrastructure policies can be applied over a certain period. Lastly, the result analysis phase includes the establishment of the conditions of the different scenarios or alternatives, and their subsequent simulation. The results extracted can be used to draw conclusions and make decisions regarding the policies to be implemented. Figure 2 details the process of building the model using system dynamics.
The first step of the conceptualization phase is to identify the object of study, the municipal solid waste management (MSWM) system in Darkhan city district 15. The problem analysis set in Section 1 concludes that deficient MSWM is caused, on the one hand, by a lack of resources and attention from the local government to ger districts and, on the other, by households that are not educated in environmental awareness and so improperly manage their household waste. This problem leads to polluted soil, air, and water and in turn to disease and environmental degradation. The next step is to identify the elements and basic structure that constitute DARKHAN-15. The key elements involved in the system are identified as follows:
-
Households: the element that generates and manages waste.
-
Local government and KOICA: the elements that have the economic funds to collect and manage waste.
-
Waste: an element generated, managed, and collected (or not).
-
Pollution: an element that accumulates the effects of poor waste management.
These basic elements are used to establish the subsystem as simple behavioral structures of the different subsystems. Thus, the relationship between the three subsystems and functions identified in our system is presented below. The system starts with the economic funding of MSWM infrastructure and education activities, which leads to different generation rates of waste by households that, depending on the efficiency of the waste management, end with higher or lower consequences on pollution. Figure 3 shows the process described, with inputs and outputs from each subsystem represented with arrows.
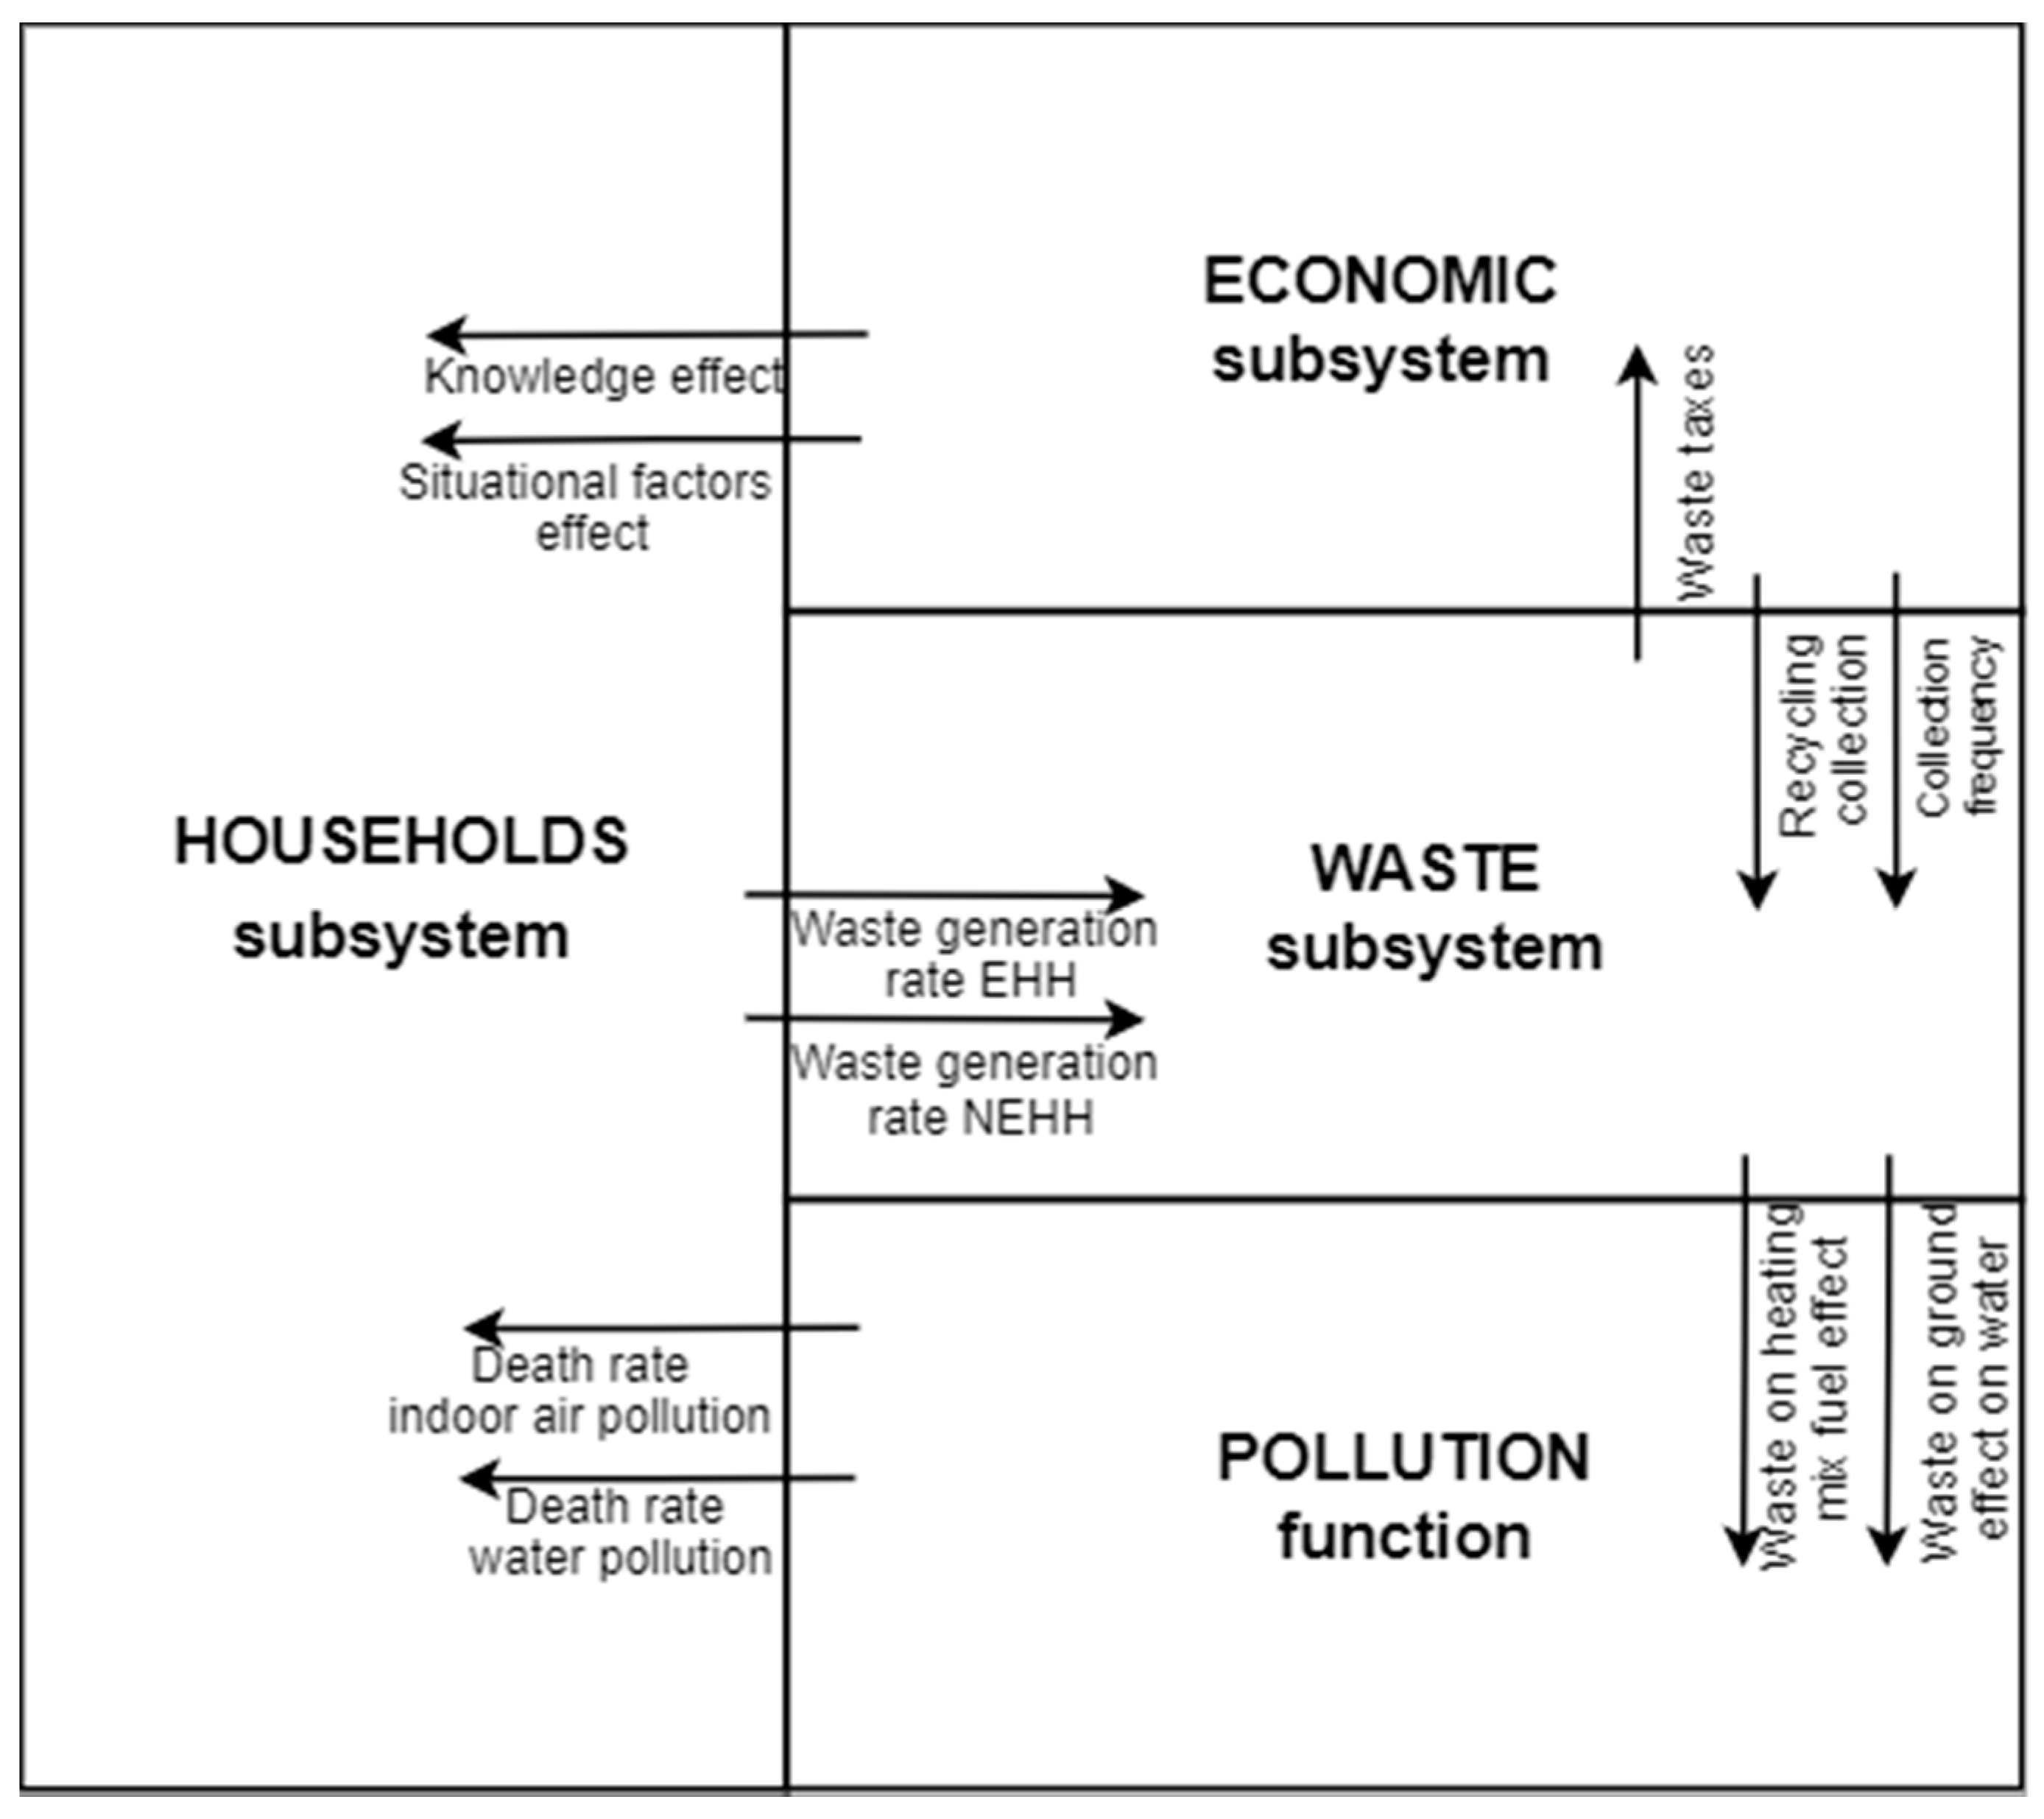
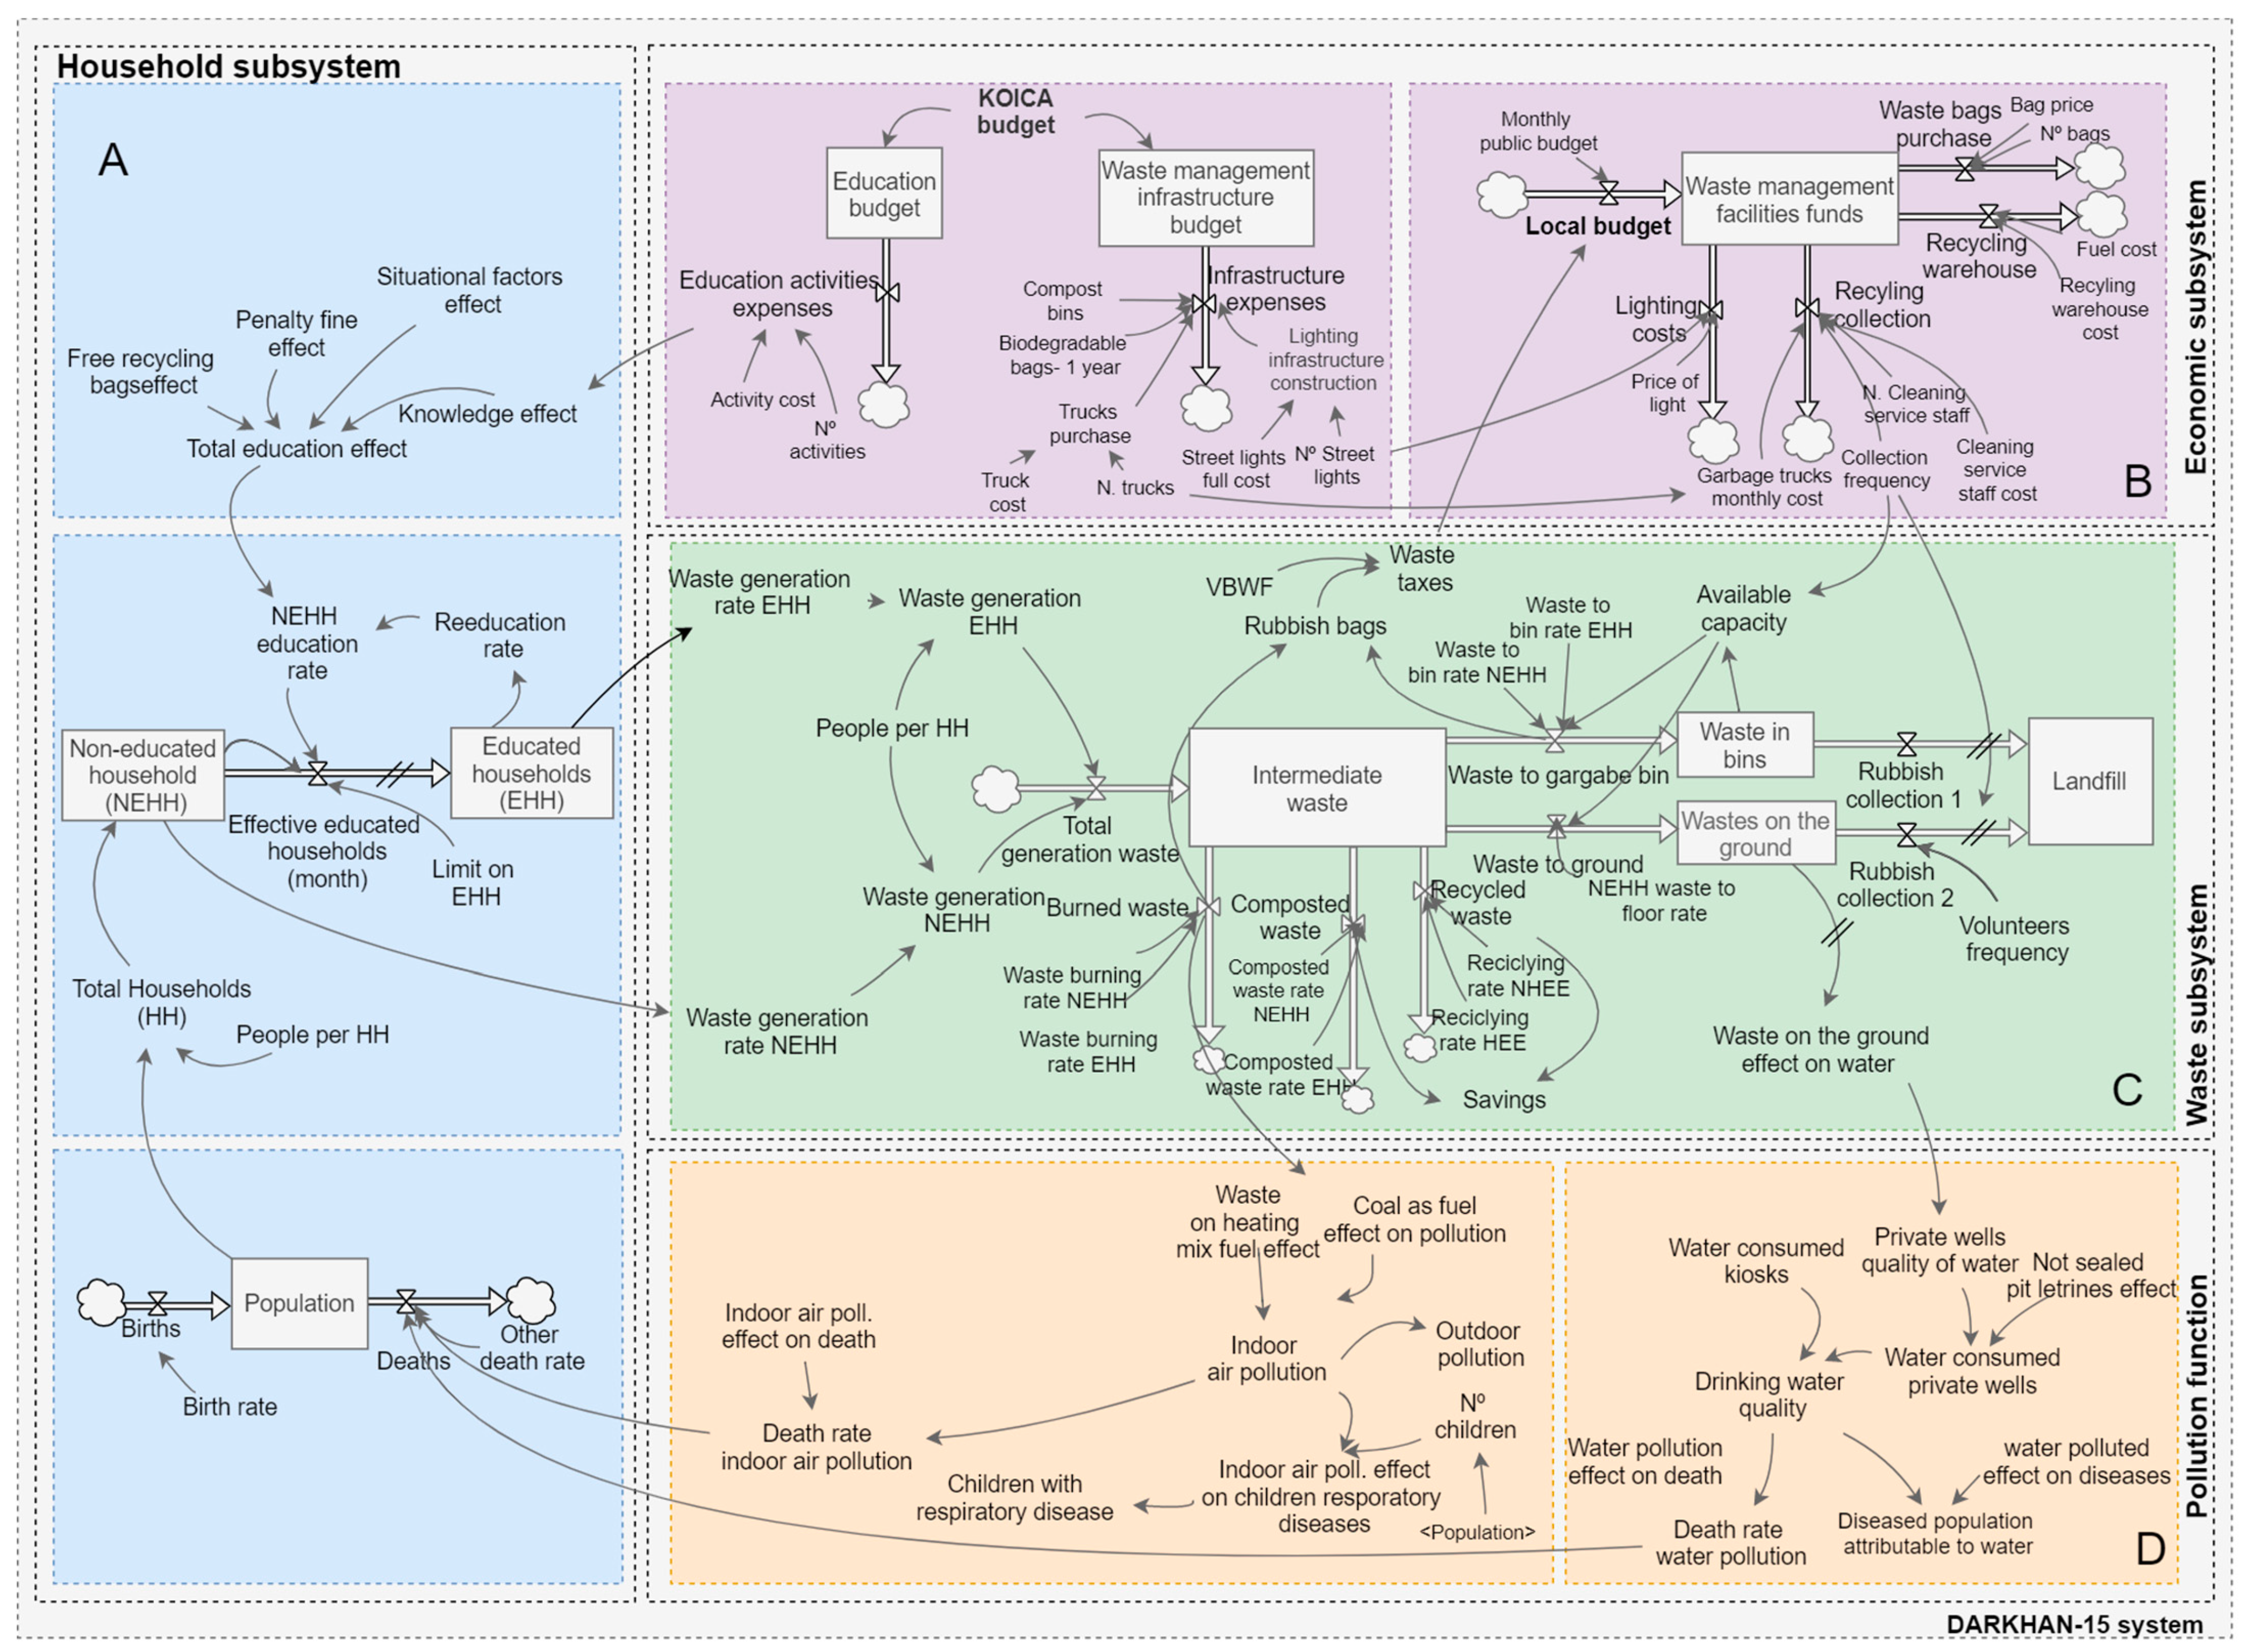
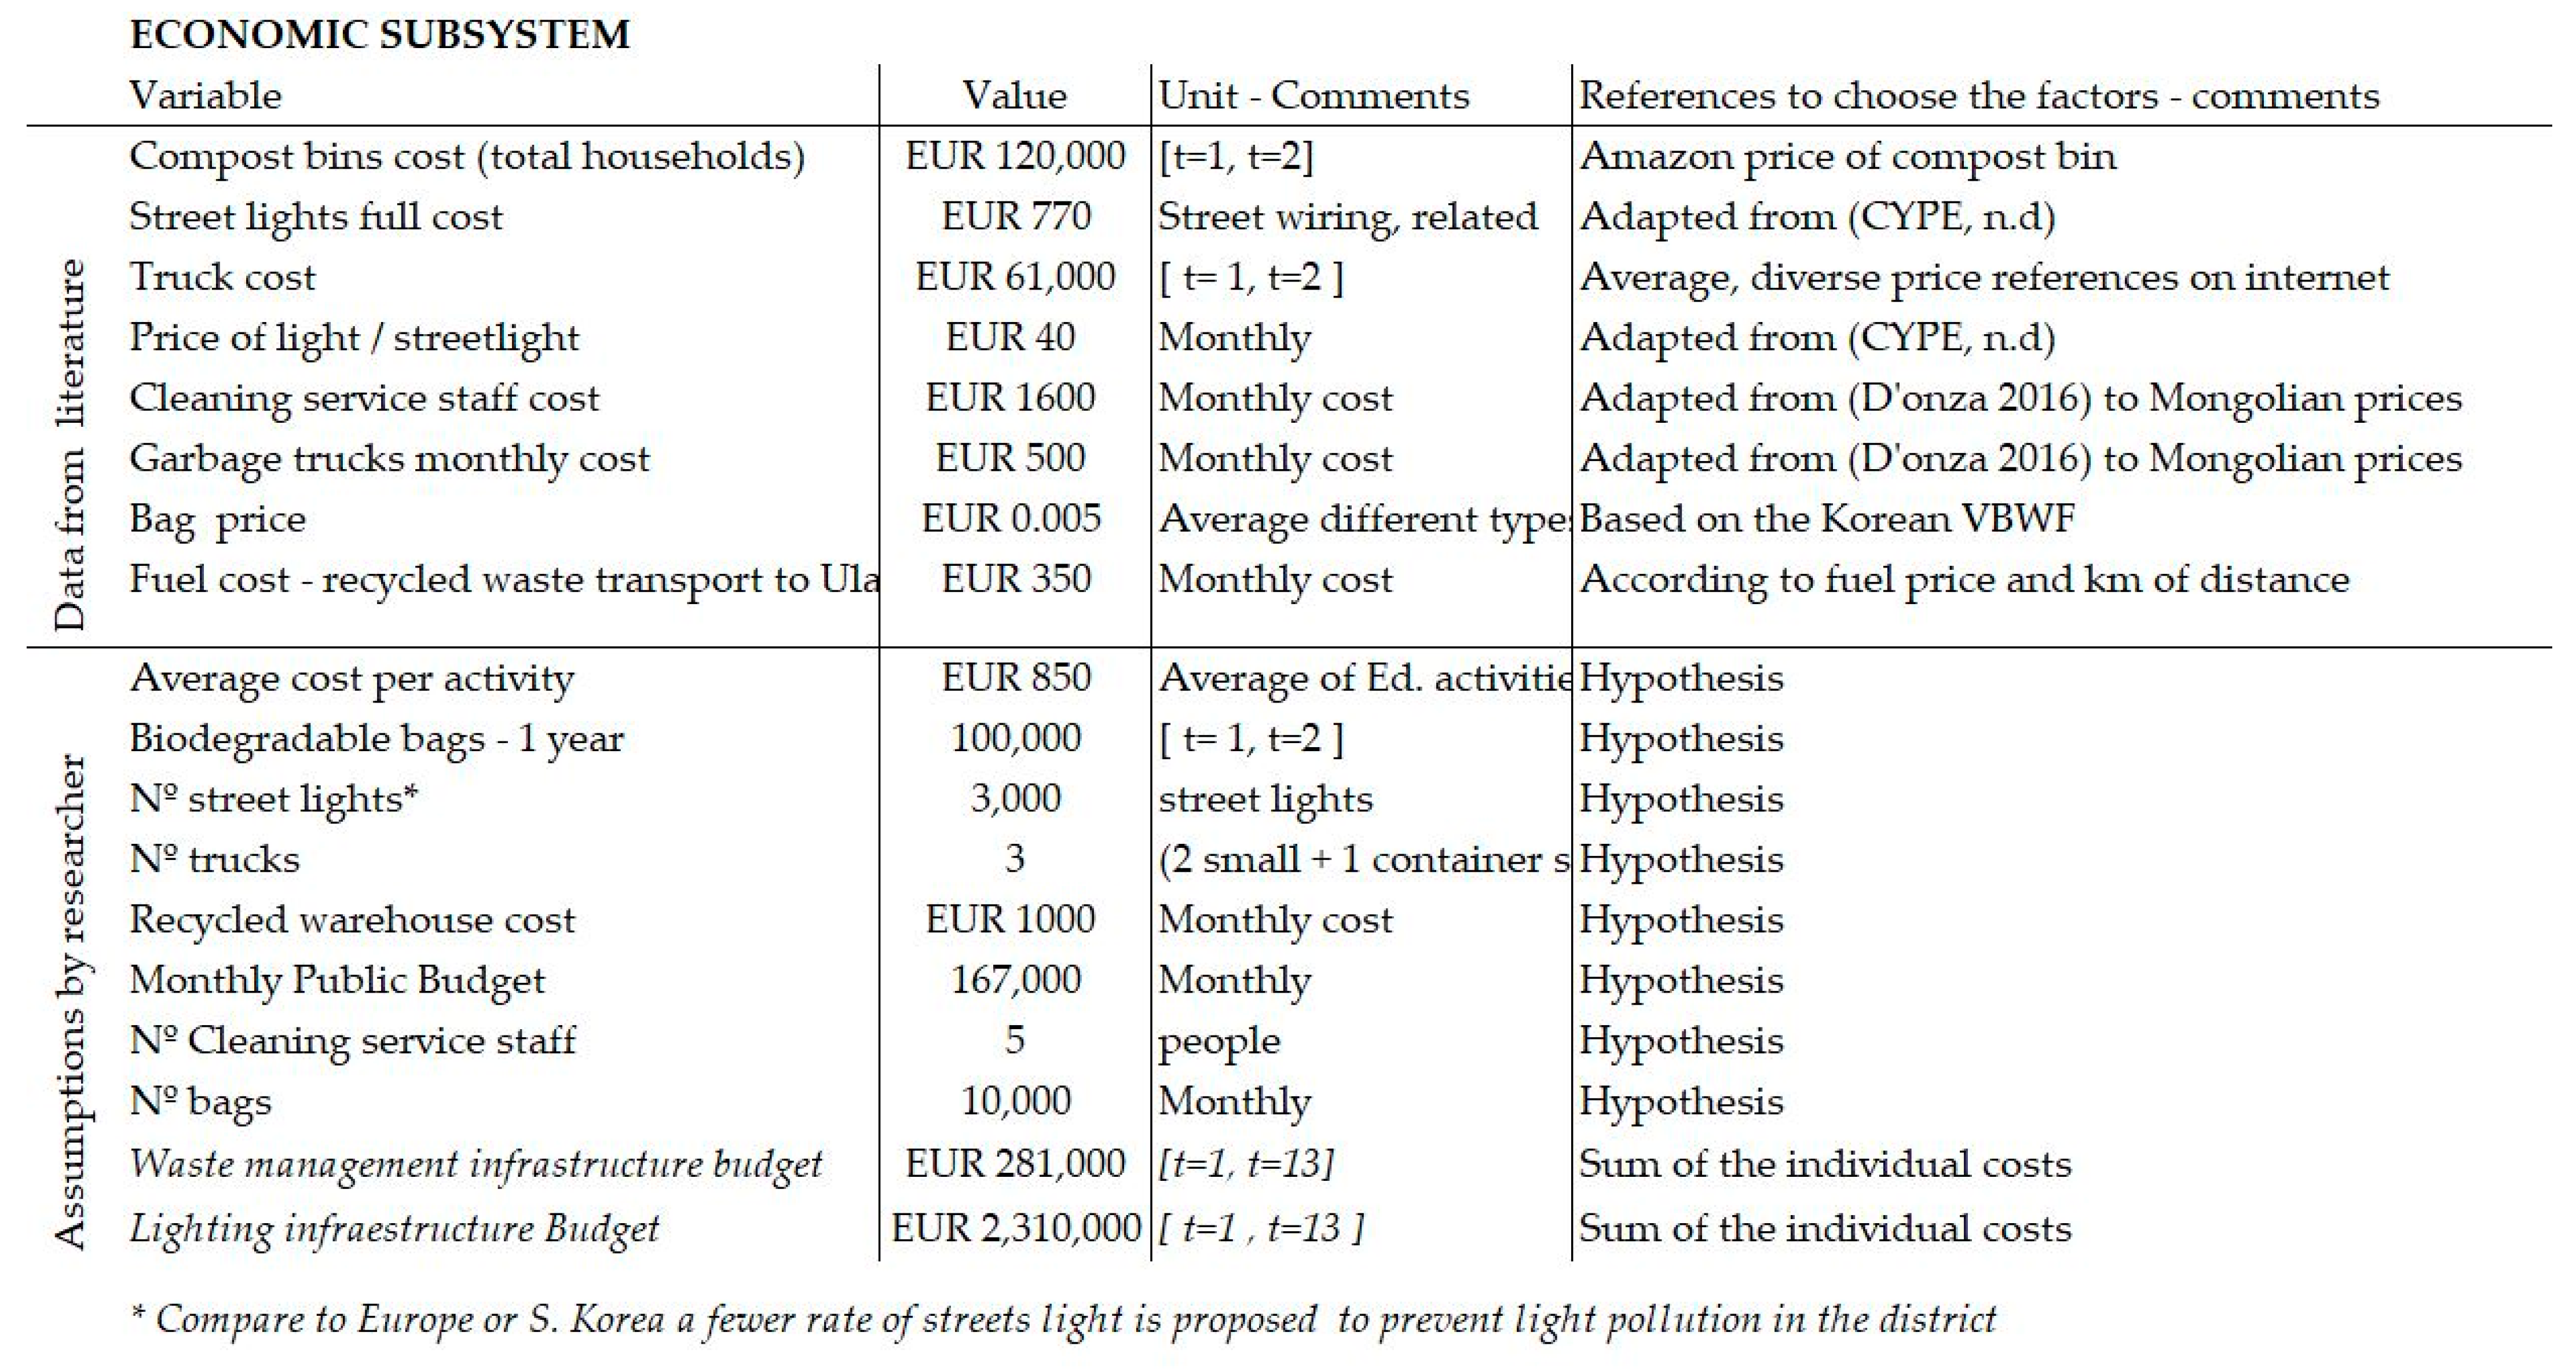
  • “Economic subsystem”. The control subsystem of DARKHAN-15. It comprises the economic resources that fund the education and infrastructure policies. The subsystem has the following inputs: on the one hand, the KOICA funds that finance the education policy and the initial infrastructure. On the other, the local funds that maintain the infrastructure created. As outputs, the implementation of the policies results in a “knowledge effect” and a “situational factors effect” on the “households subsystem”. The infrastructure policy provides as outputs a “collection frequency” of waste and the maintenance, or not, of a “recycling collection” in the “waste subsystem”. Lastly, the “waste taxes” evidenced via the rubbish bags, an element from the “waste subsystem”, provide income to the local government.
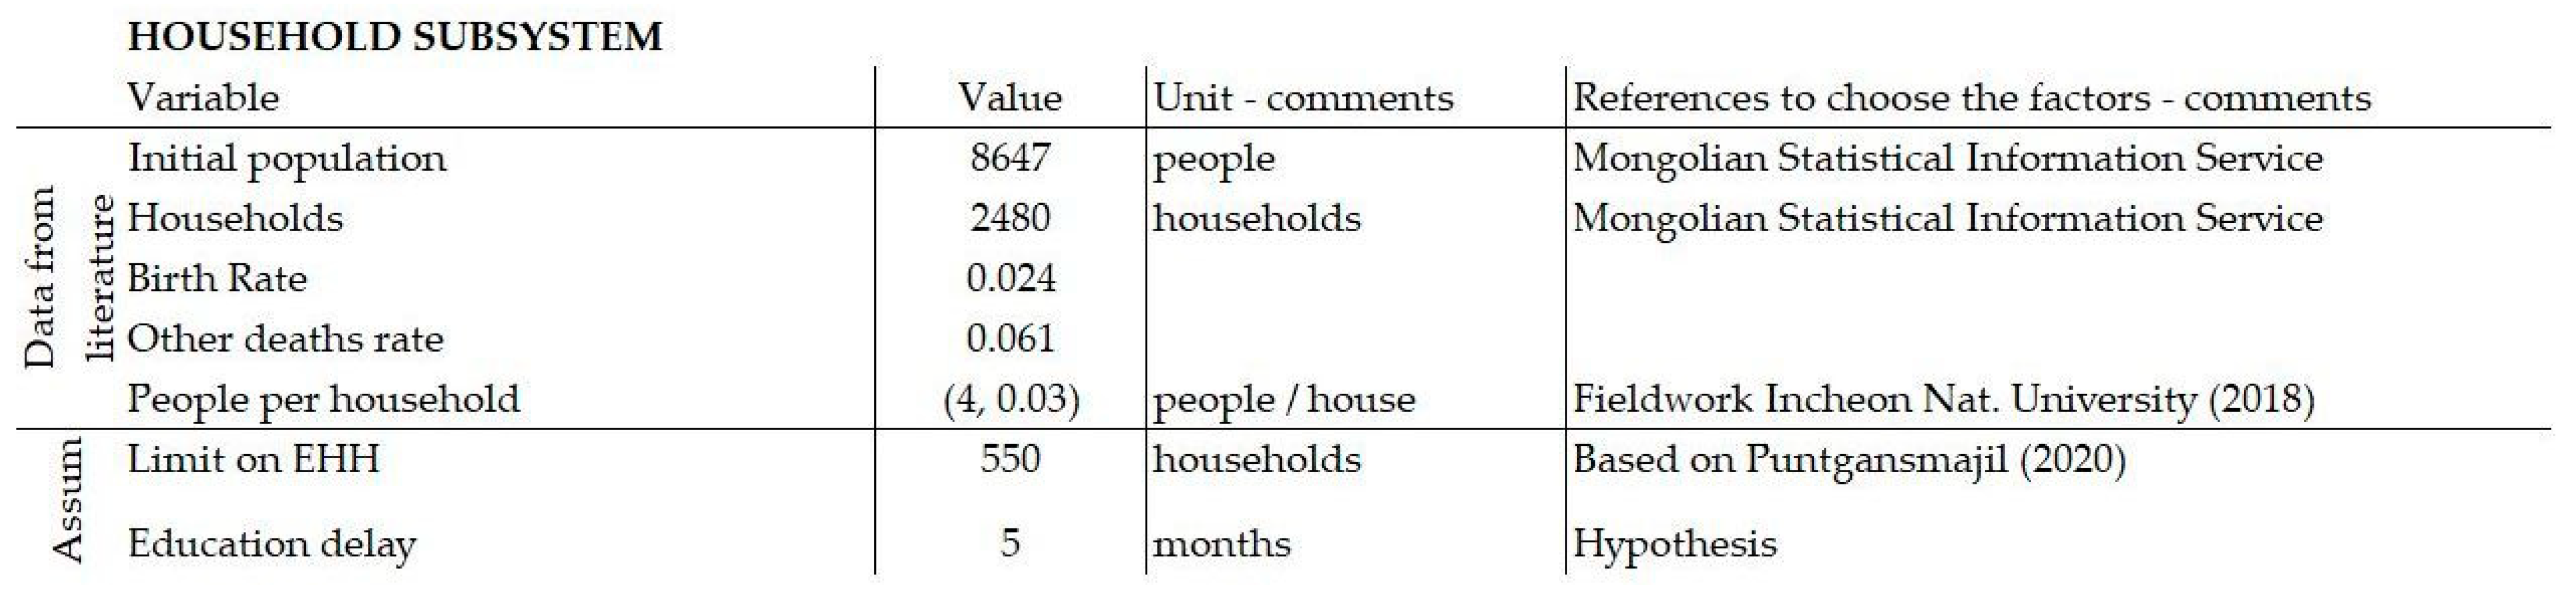
  • “Households subsystem”. Comprises the citizens of the ger districts forming family units that generate waste. We consider educated households those that, regardless of their level of formal education, are educated in environmental awareness, sustainable development, and proper waste management. This implies that “educated households” (EHH) will generate less waste and manage it correctly (reducing, recycling, and reusing), in contrast with “non-educated households” (NEHH) that manage it incorrectly (burning waste, throwing it on the ground, etc.). The education process will depend on the “knowledge effect” and “situational factors effect” from the “economic subsystem”. As outputs, “waste generation rate of EHH” and “waste generation rate of NEHH” will determine the volume of waste to be managed in the “waste subsystem”.
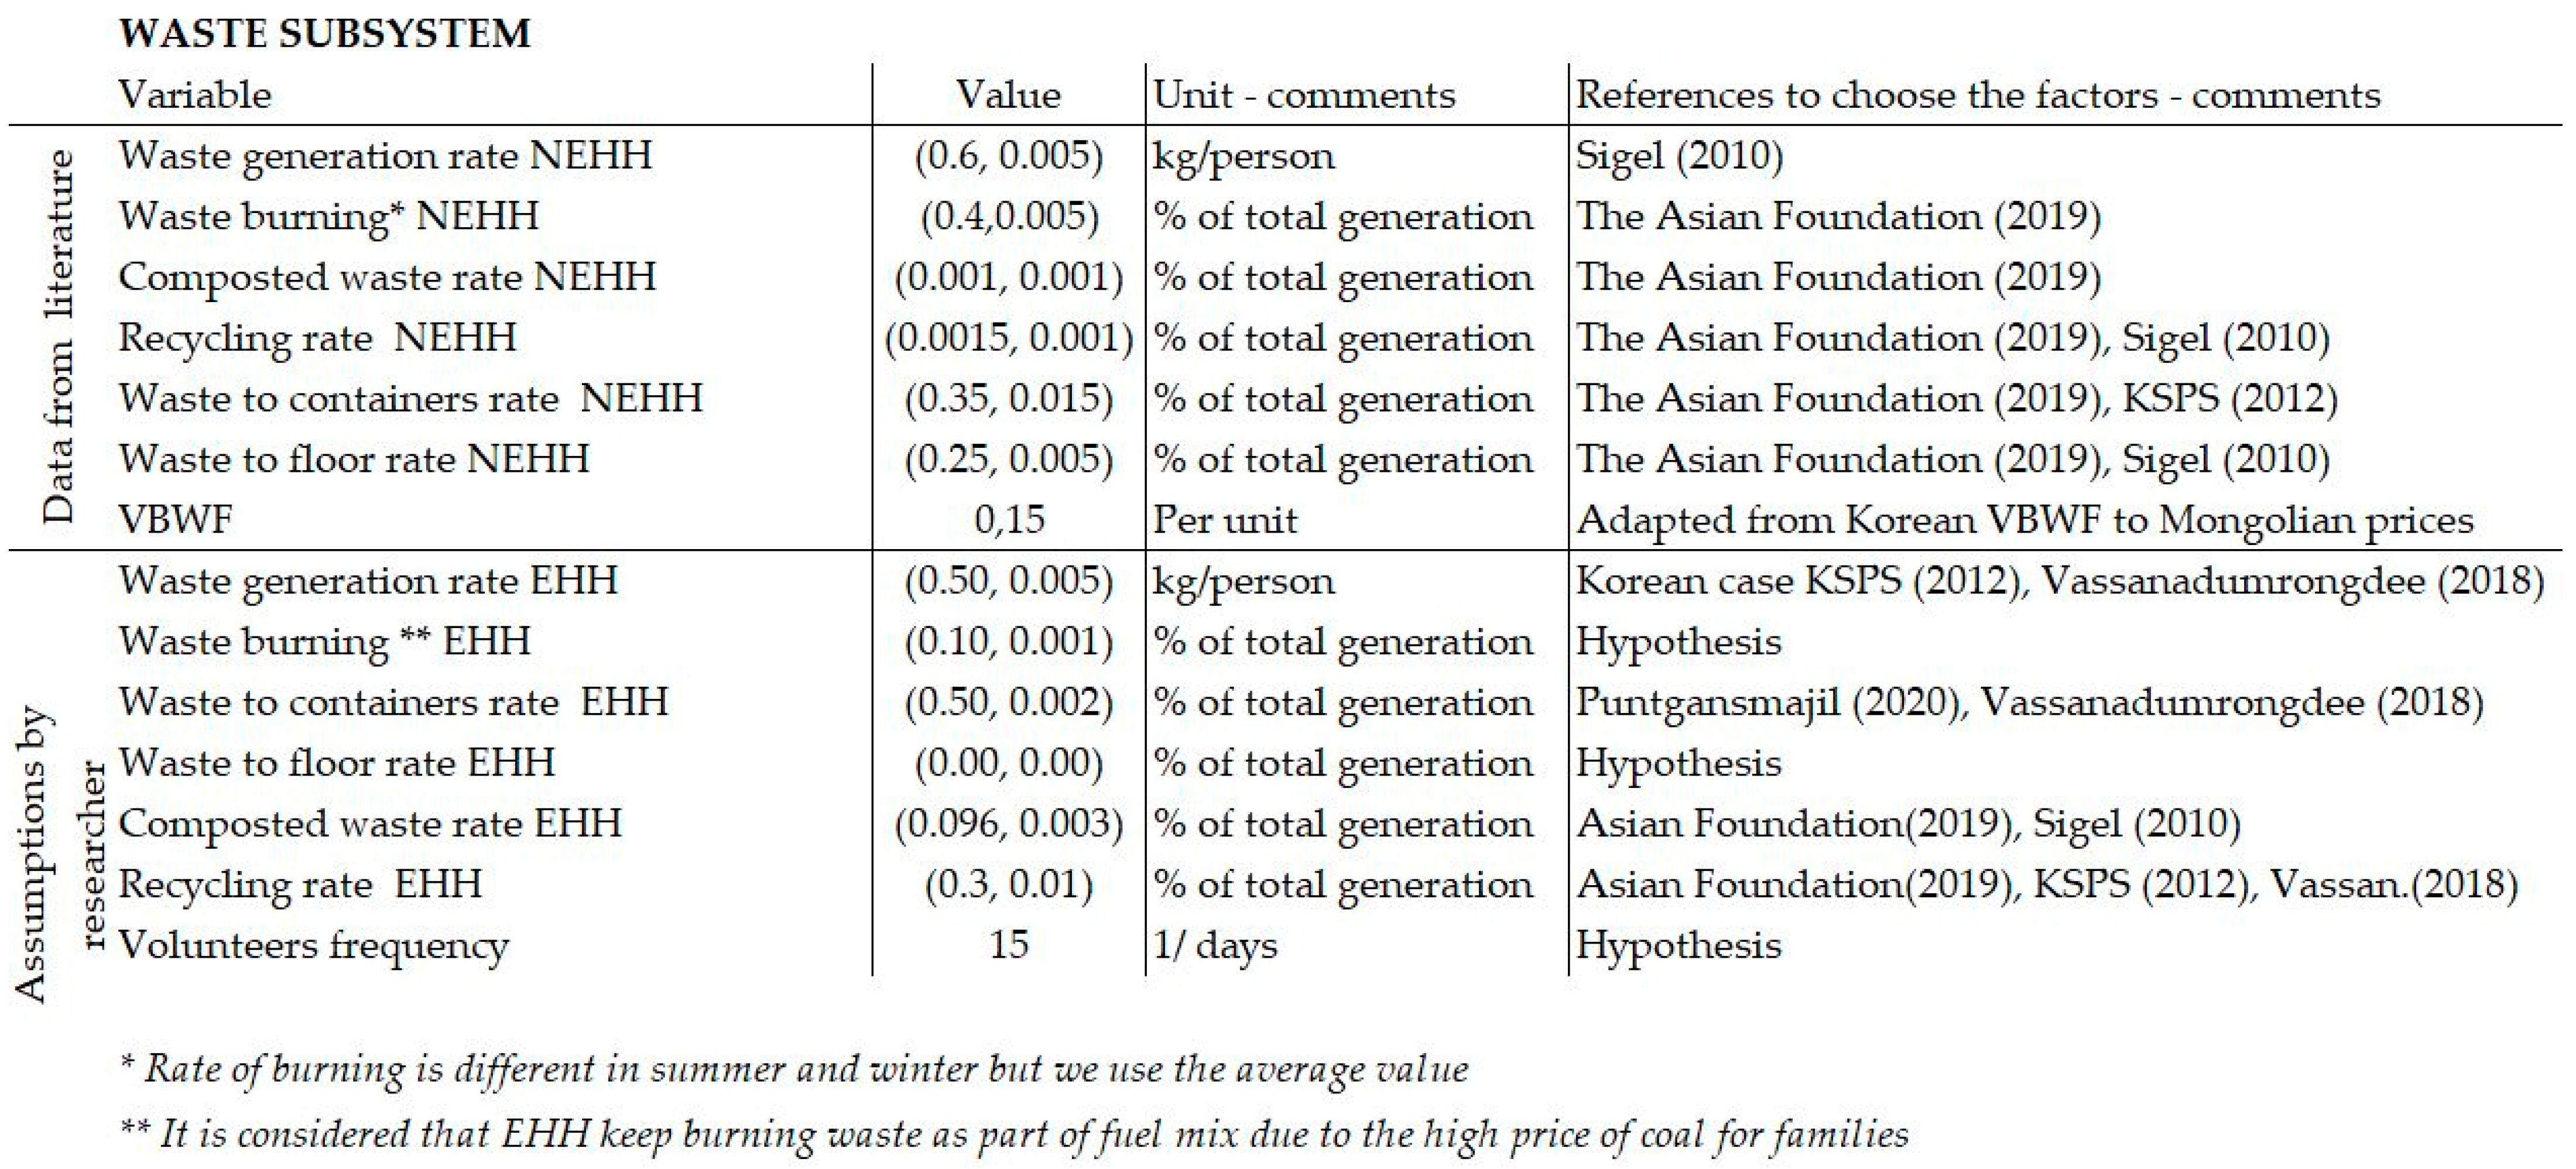
  • “Waste subsystem” comprises the generation of waste by “waste generation rate of EHH” and “waste generation rate of NEHH” from the “households subsystem” and its collection, depending on the “collection frequency” and the existence or not of a “recycling collection”. As outputs of the subsystem, there are “waste on heating mix fuel effect” and the “waste on ground effect on water”, resulting from incorrect waste management, which affect water and air quality from the “pollution function”. Additionally, the use of waste bags, which includes a volume waste fee, provides income to the local government (“economic subsystem”) through “waste taxes”. Therefore, the “waste subsystem” depends on the generation of waste of the “households subsystem” and the economic resources from the “economic subsystem”.
  • “Pollution function” comprises the elements affected by the consequences of bad waste management that sickens “households” (people) and deteriorates the environment. This function depends on the “waste subsystem”. According to the waste management in the latter subsystem, “waste on heating mix fuel effect” and the “waste on ground effect on water” will result in a greater or lesser “death rate indoor air pollution” and “death rate water pollution” in the “households subsystem”.
The final step of the conceptualization phase is to establish the cause–effect relationships between the variables of the subsystems and their limits. Elements are progressively added to the structure, identifying the elements that will form our system. This naturally leads to the establishment of system boundaries and feedback loops. After this, causal loop diagrams are translated into stock and flow diagrams through stock, flow, auxiliary variables, and delays. Figure 4 represents the economic, household, waste, and pollution subsystems of the DARKHAN-15 system through a single stock and flow diagram.
To clearly explain the stock and flow diagram of DARKHAN-15, we divided the three mentioned subsystems and pollution function with more in-depth detail in the households subsystem.

2.1. Economic Subsystem

The economic subsystem comprises the financial capital that generates the infrastructure and education policy in DARKHAN-15. The education policy is aimed at better environmental education, and so it includes educational activities. The infrastructure policy is aimed at the renovation, creation, and maintenance of MSWM facilities and resources, and so it reflects the elements that play a role in them. The proposed financing of this policy is as follows: KOICA would support the education policy and the creation of the waste management infrastructure with development funds, while the local government would cover the maintenance costs once the infrastructure is created. These processes are highlighted in purple in Figure 4A, through a stock and flow diagram.
The “education budget”, “waste management infrastructure budget”, and “waste management maintenance budget” variables are considered as stock, and drawn within a rectangle as they are relevant variables for defining the state of the system and representing stock or accumulation of material, in this case, cash flow. Those variables are determined by the costs of the auxiliary variables that affect them. Key elements of the economic subsystem causal diagram are, on the left, “education activity expenses” and “lighting infrastructure” together with “waste management maintenance budget” which will positively influence the households subsystem through “knowledge effect” and “situational factors effect”. As stated in the literature [35,50], the “lighting infrastructure construction” and its maintenance will positively influence the “situational factors effect”. On the right-hand side, “collection frequency” and “recycling collection” will positively influence the waste subsystem.

2.2. Households Subsystem

This the citizens (people) of the ger districts forming family units which generate waste, and the process of transformation—or education—of “non-educated households” to “educated households”. This will result in a reduction in waste generation. The household subsystem consists of three parts, from bottom to top (see Figure 4B in blue): the “population” living in the district, its organization into “households”, and the “total education effect” of the applied policies. The variables “non-educated households”, “educated households”, and “population“ are represented within a rectangle and so are considered as a stock variable, representing an accumulation of material, in this case, households for the first and second, and people for the third.
Starting from the top, we find the factors that are included in the education process. The literature on the subject [45,47,48,49] indicates that the inclusion of situational factors, incentive-based factors, and knowledge-based factors has positive effects on waste management and, so, we consider that these factors combined educate households as they change their behavior in relation to waste management and the environment. “Total education effect” is formed from the “knowledge effect”, on which the “situational factors effect” and the incentive-based effect (formed in turn by the “penalty fine effect” and the “recycling bag effect”) have a multiplying effect. The combination of these effects under “total education effect” gives an “NEHH education rate” which is the rate at which “non-educated households (NEHH)“ are educated.
Secondly, located in the center of the diagram, we find a representation of the households’ education process. The population organized in households considered as “non-educated households“—because of their incorrect waste management – generates waste at a certain “waste generation rate NEHH”. When households are positively influenced by the “total education effect“, households are educated at an “HH education rate“, resulting in a certain number of households being grouped into “educated households EHH“. These “EHH“ will generate waste at a lower rate than the “NEHH“ because of their better environmental awareness, resulting in a “waste generation rate EHH“. It is considered that there is a delay in the education process and a “limit EHH“. Another important process to highlight is the process of re-education of “educated households“. The existing literature refers to the importance of social recognition and the role of neighbors through public participation in the education of the households themselves [46,48]. Thus, “EHH“ will educate a certain part of the “NEHH“, thus multiplying the effects of the implemented policies, leading to a reinforcement loop (R1).
Finally, at the end of the diagram, we find the relationship between “births“ and “deaths“ that gives rise to the “population“ of district 15.

2.3. Waste Subsystem

This subsystem contains the elements that are part of the generated waste and collection of waste management. The subsystem reflects the waste management behaviors of households. Usually, in the absence of adequate collection and environmental awareness, households in ger districts throw a small amount in the garbage, another amount is burned and incorporated as part of the fuel mix due to the price of coal, another amount is thrown on the ground, and an almost non-existent amount is composted or recycled. Additionally, the diagram reflects a policy line based on an incentive, the volume-based waste fee, a policy successfully implemented in Korea which achieved effective source separation [63]. These processes are shown in green in Figure 4C.
Its main element, in the center, is “intermediate waste”, which accumulates waste generated until its management and collection. The structure of this subsystem is based on the Sukholthaman waste management system dynamics model [54]. The variables “intermediate waste“, “waste in bin“, and “waste on the ground“ are considered as stock because of their relevance to knowing the state of the system, and because they represent a stock of material, in this case, kilograms of waste (see Figure 4C). “Collection frequency” will be the determining element for reducing the accumulation of “waste in bins“ and “waste on the ground“. It is considered that “EHH“ do not throw waste on the ground and that they will, instead, reuse and recycle possible waste in this category, and the rest will be thrown into the waste stored in their plot until collection time. Other processes shown in the diagram are those related to the generation of economic resources and pollution. Firstly, we can see how “burned waste“ (in the form of ash) and “waste in bin“ influence the volume of “rubbish bags“ used. The imposition of the volume-based waste fee—“VBWF“—as an incentive implies that the larger the number of “rubbish bags“, the higher the revenue generation through “waste taxes“. “Composted waste“ and “recycled waste“ feature in the reverse process. “Composted waste“ provides “savings“ by not requiring the purchase of fertilizers and using compost for gardens. “Recycled waste“ is not subject to taxes, and its bags are dispensed free of charge. Finally, there are the effects associated with poor management of “burned waste“ and “waste on the ground“. The literature on the subject indicates that part of the waste is incorporated as part of heating mix fuel [38]. Thus, the greater the amount of “burned waste“, the greater the “waste on heating mix fuel effect“. In turn, when “waste on the ground” accumulates, it leaches into the ground slowly (causing a delay), contaminating groundwater—“waste on ground effect on water”—and affecting the pollution function.

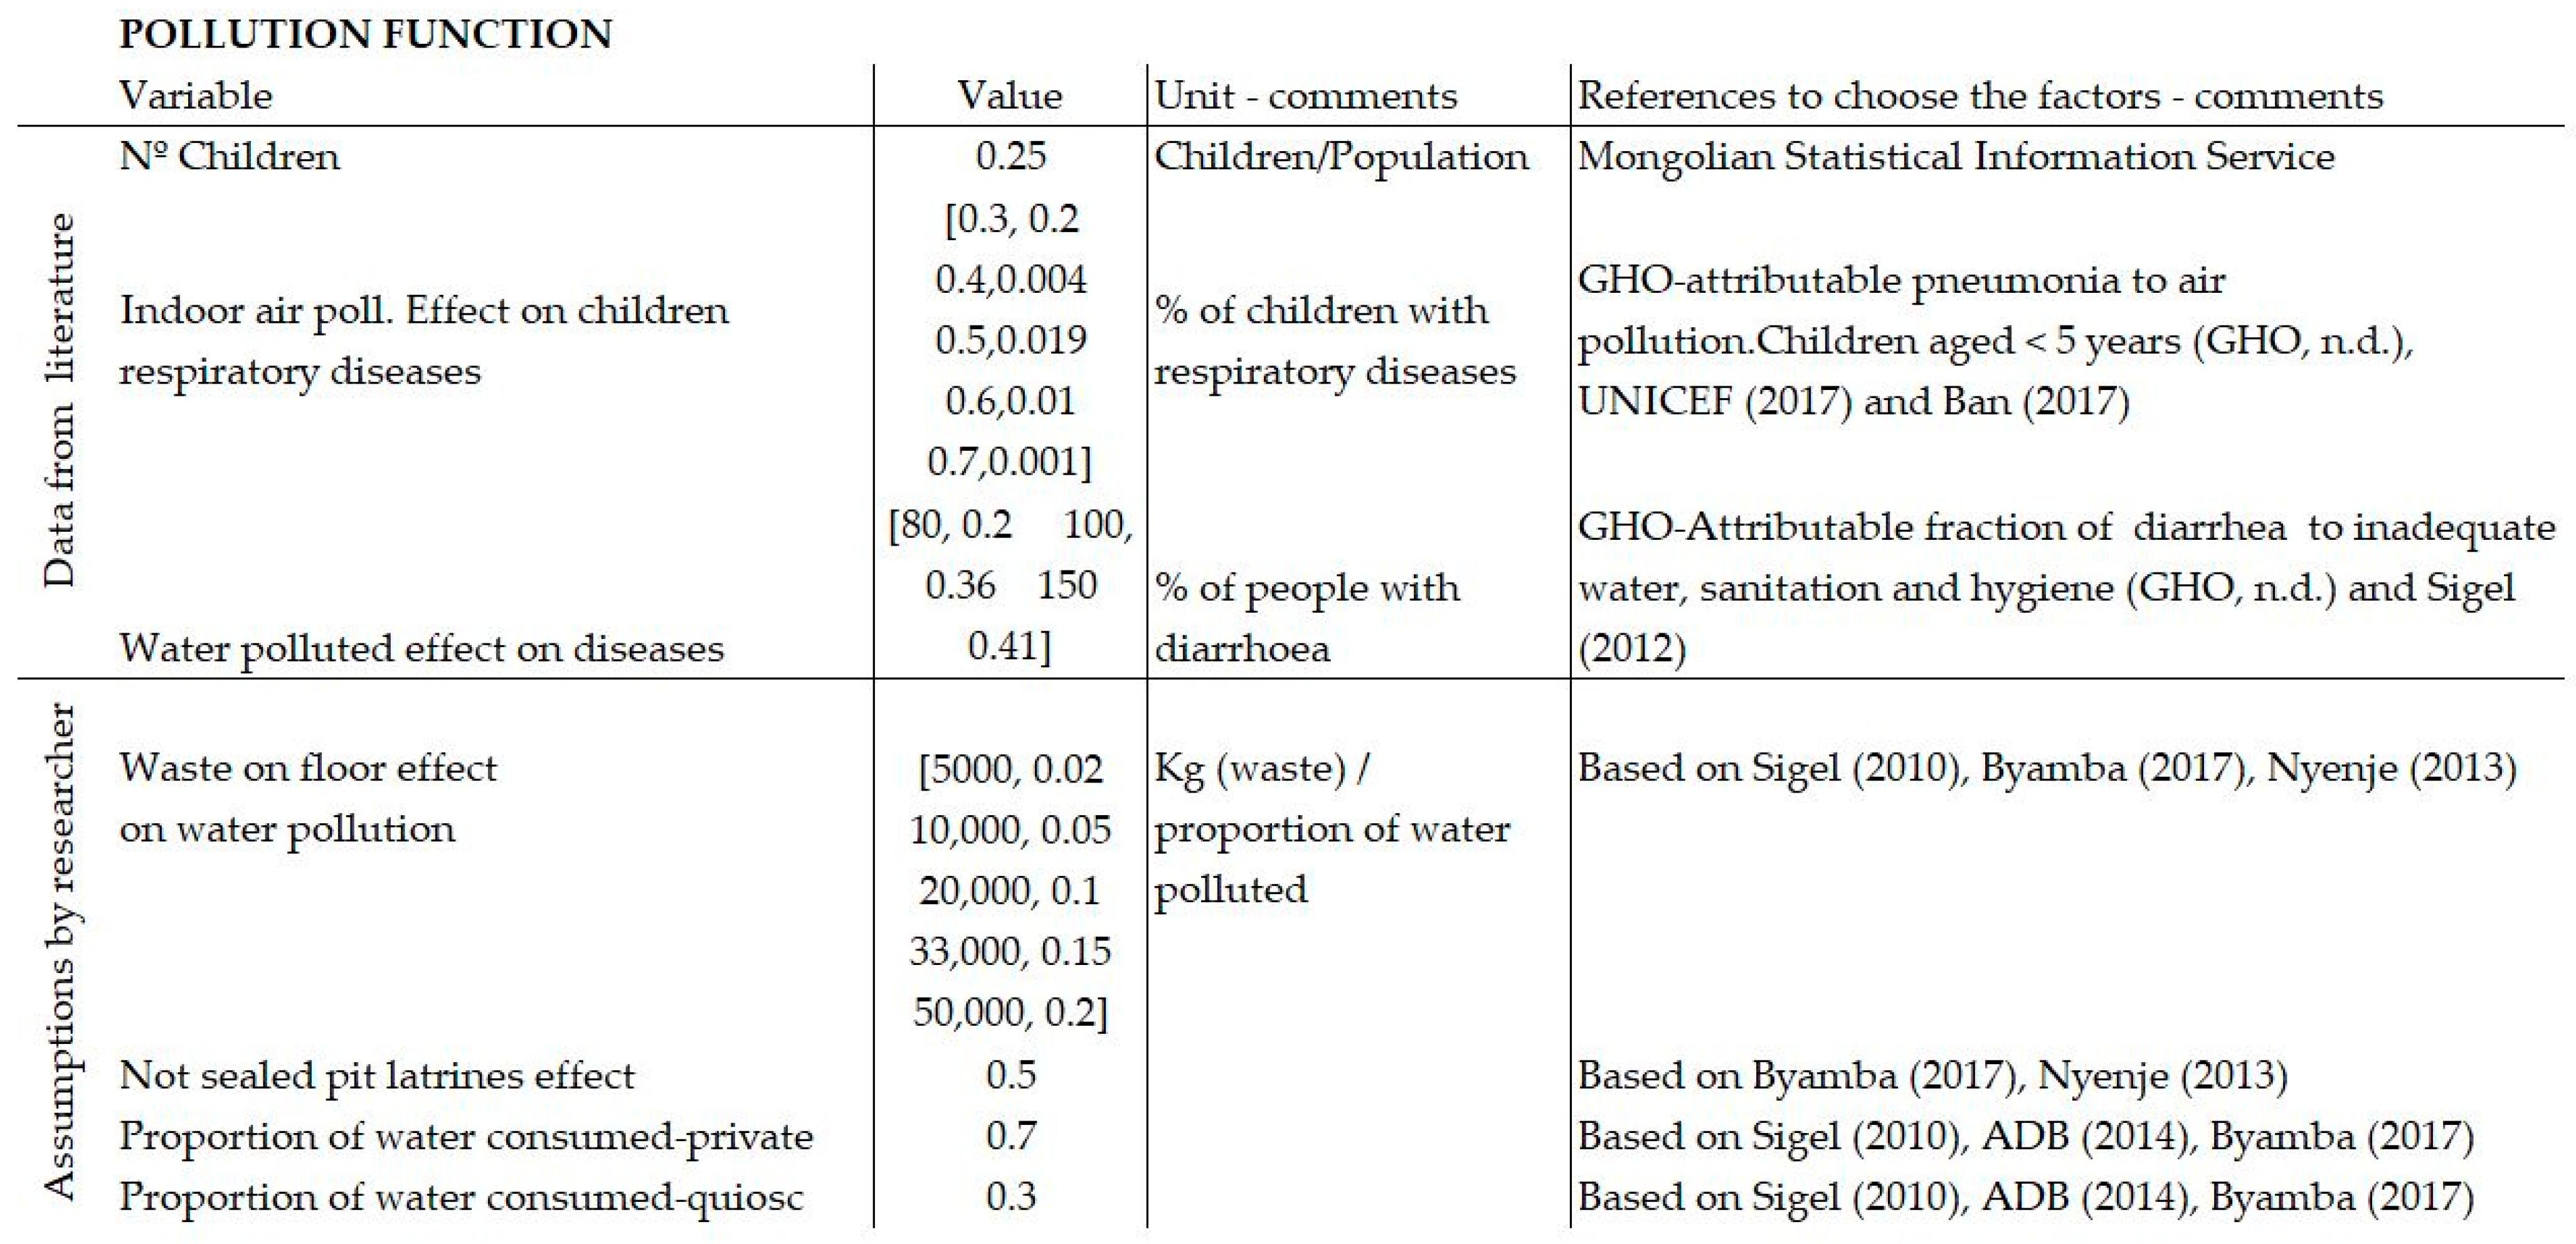
2.4. Pollution Function

The pollution function includes those factors that cause pollution of the system, leading to disease and deterioration of the environment. By throwing waste on the ground and drinking from private wells in their homes (because of the price of water in kiosks and because the region has many aquifers), people drink the wastewater that has leached through the ground, also contaminated by unsealed pit latrines on household plots. As a result, the population drinks a mixture of kiosk water and well water. Likewise, households burn garbage as part of their fuel mix due to the price of coal, ignoring the seriousness of these actions, leading to higher pollution levels [36]. The literature also indicates that the high use of coal (especially in winter) is the most important contributor to indoor air pollution [38]. This process is highlighted in Figure 4D in orange.
The pollution function is determined by the “indoor air pollution“ on the left, and the water pollution is measured as “drinking water quality“, represented on the right. These lead to serious health consequences visible in “children with respiratory diseases“ and the “death rate by indoor air pollution“, “diseased population attributable to water“, and “death rate by polluted water“.
The next step is to establish the model’s data architecture. These data will be part of the model’s equations and will determine the effect of some variables on others, according to previously established relationships. To form the database that feeds into the model as closely as possible to reality, an in-depth consultation on the literature on the object of study, reports from official and international agencies and primary sources, has been performed. On certain occasions, inconsistent, mismatched, or no data were found from similar applications in similar conditions and have been interpolated. Appendix B provides the data for the exogenous variables of the model for the different subsystems of economy, households, pollution, and the pollution function.
The last step is to detail the DARKHAN-15 model in formal language, in the form of equations and computational language. Simulation software facilitates the definition of the equations through the representation of the stock and flow diagram and the introduction of the data architecture. The most common are Vensim and Stella-iThink. However, the free software tool Insight Maker has been selected because of its ease of use, and its nature as an open application makes it possible to disseminate the information for free and to learn from other users’ applications [64]. As a result of the above process, the DARKHAN-15 model is fully introduced in formal and computational language and the formulation phase is finished. The complete model can be found at the following link: https://insightmaker.com/insight/216778/Waste-Management-Darkhan-15 (accessed on 5 April 2021). To consult the complete list of the equations of the model see the supplementary materials.

3. Results Analysis

Once we have our tailor-made MSWM system policy simulation model for Darkhan district 15, the next step is to test the model. This is to simulate the DARKHAN-15 model in certain scenarios. The results offered by the simulations will show the effect of the policies implemented in the waste management system. It should also be noted that the objective of simulating the policy is not only to assess the impact, but also to make recommendations for different alternatives that would lead to the efficient use of economic resources.

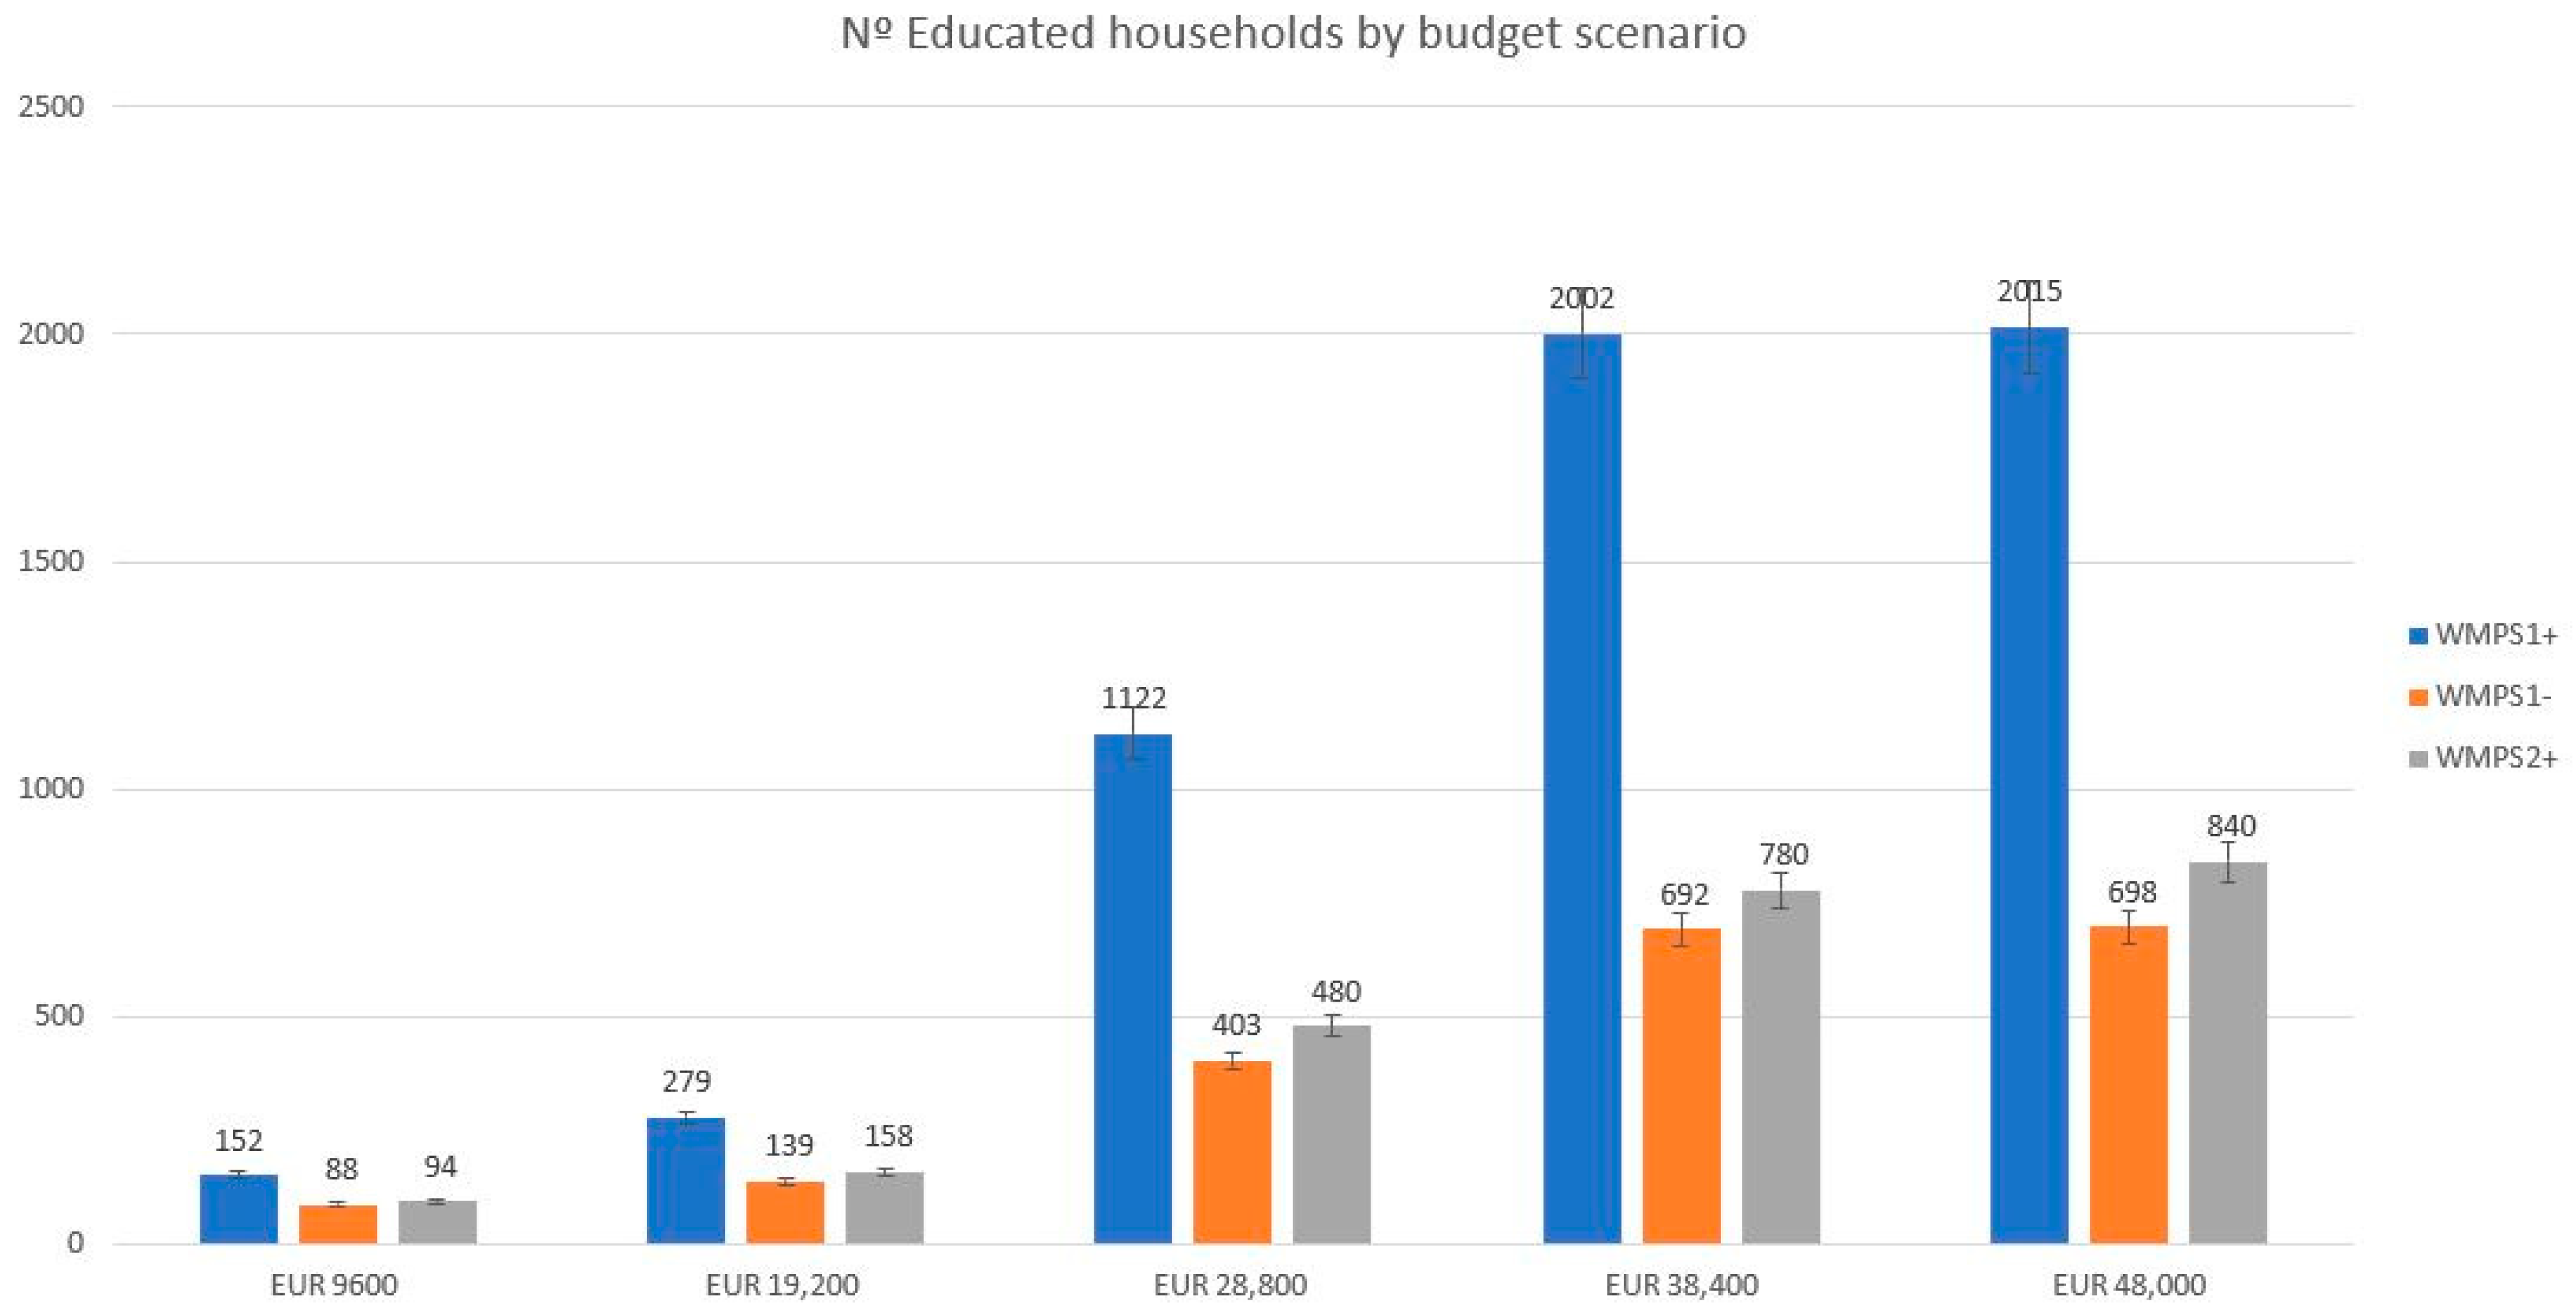
3.1. Scenarios of Simulations and Results

We have chosen fifteen scenarios (see Table 1) for the case at hand, which contain different conditions for financing the education and infrastructure plan and for citizen responses to the plans.
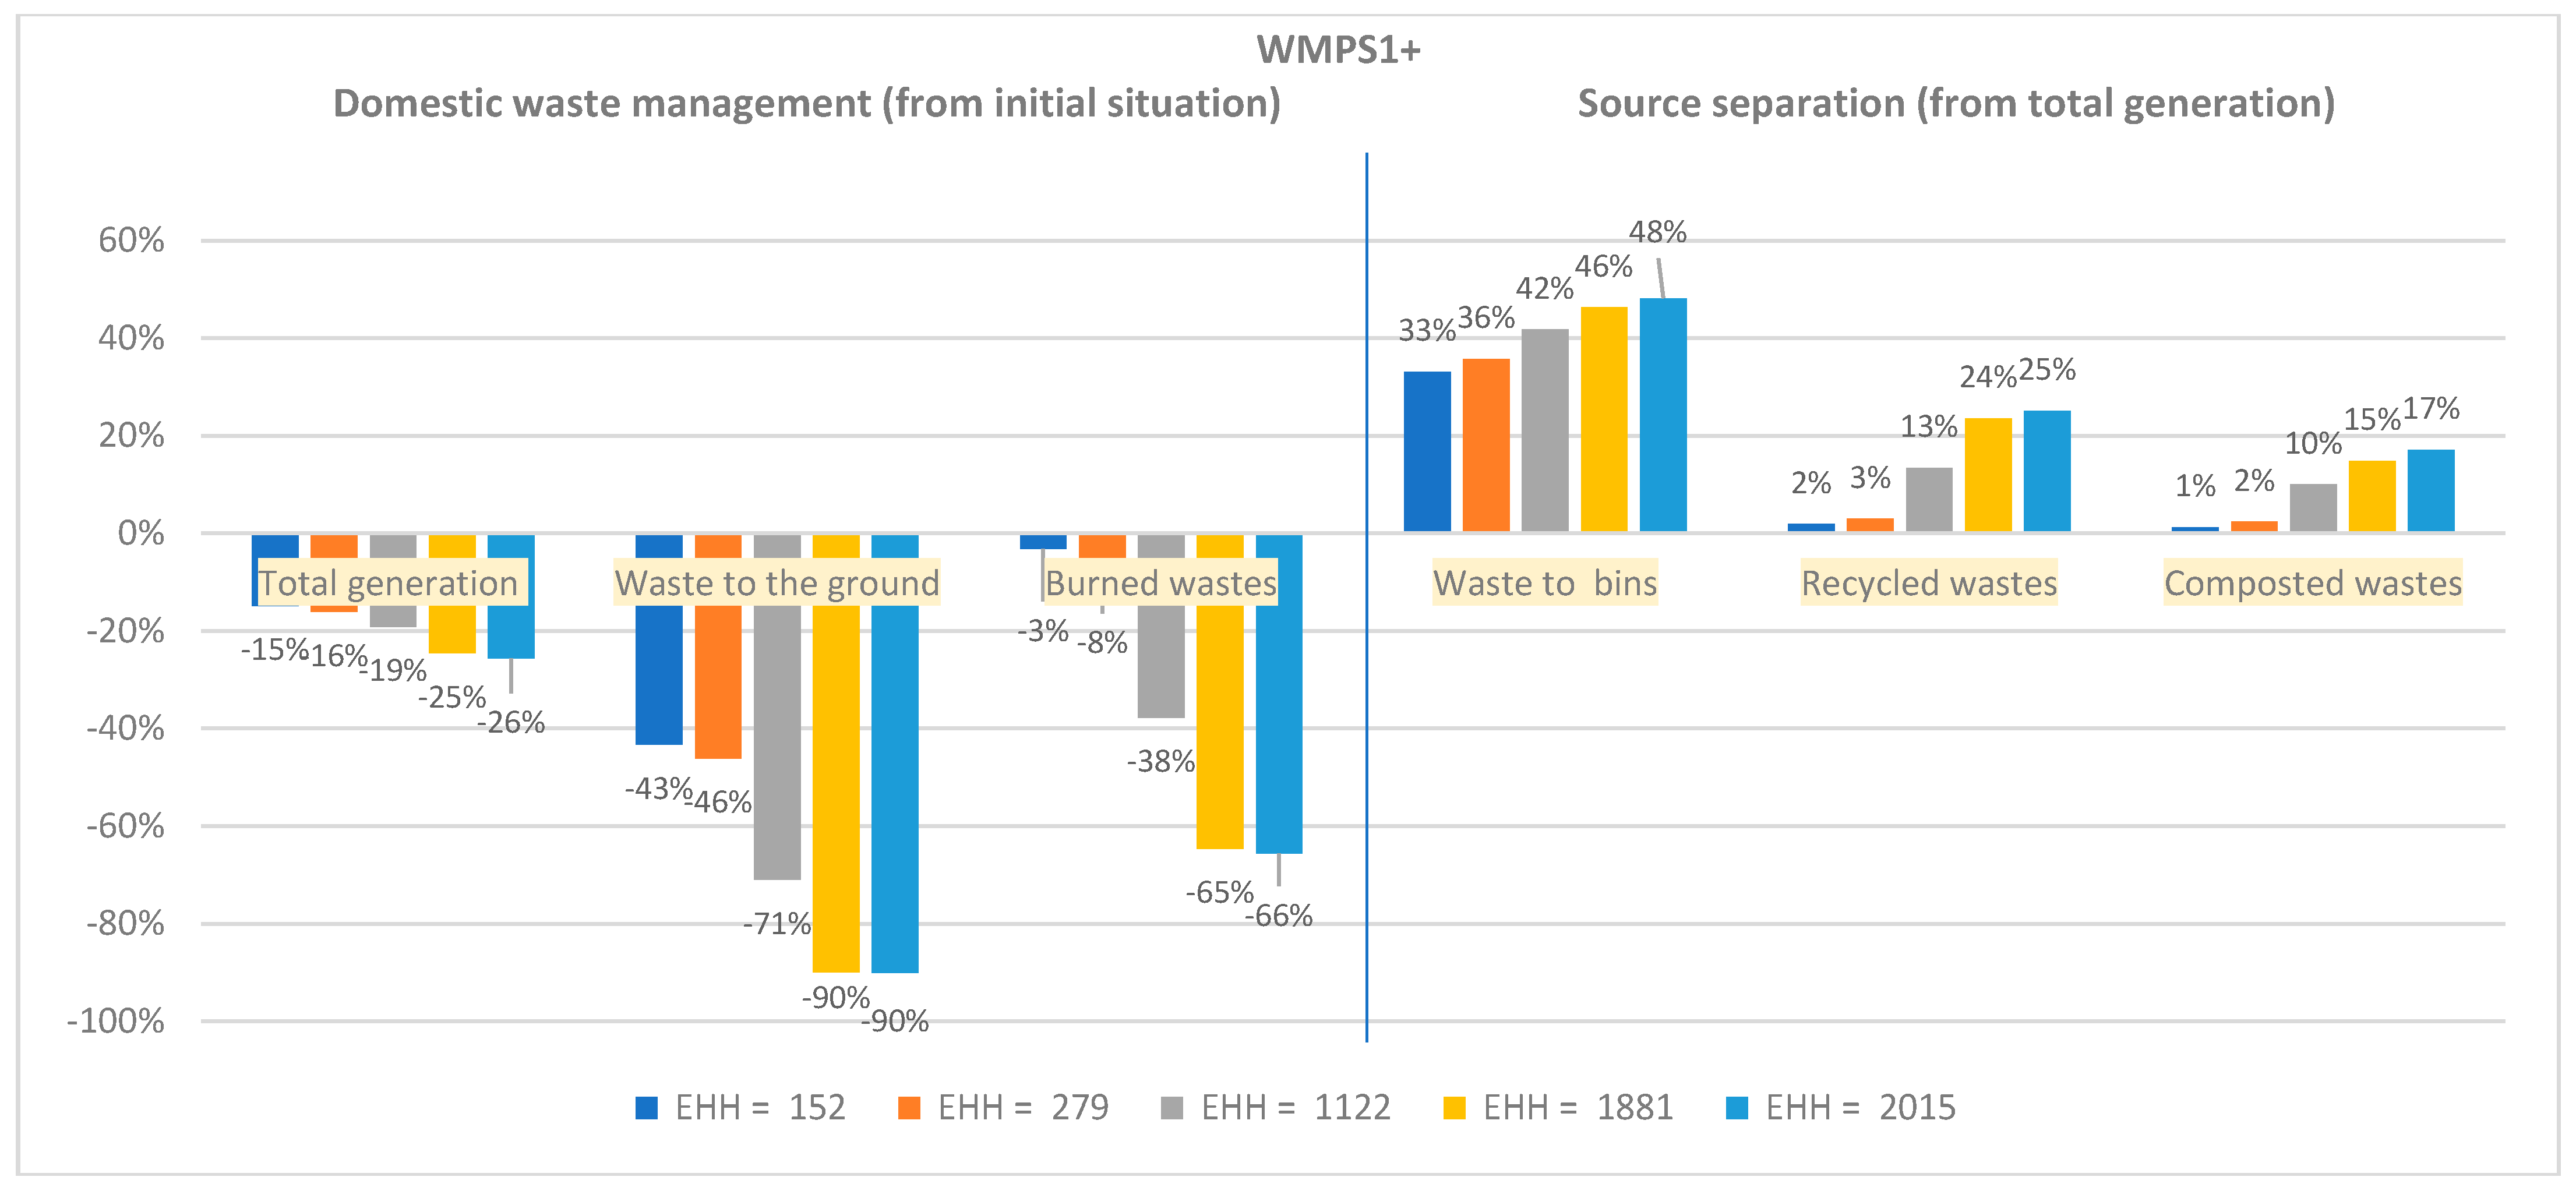
  • WMPS1+, Waste Management Policy Scenario 1, optimistic. Considers that KOICA finances the education and infrastructure plan, and the local government is responsible for its maintenance. This scenario includes increasing collection frequency to 30 days—every two days for organic waste, every two days for recycling waste – resulting in an effect on situational factors. Citizen response to education activities and re-education is positive. See parameters and conditions in Table 1. Parameters of effects seen in the table have been set according to the results of residential waste separation behavioral intention in Darkhan [35] and factors influencing source separation intention [45]
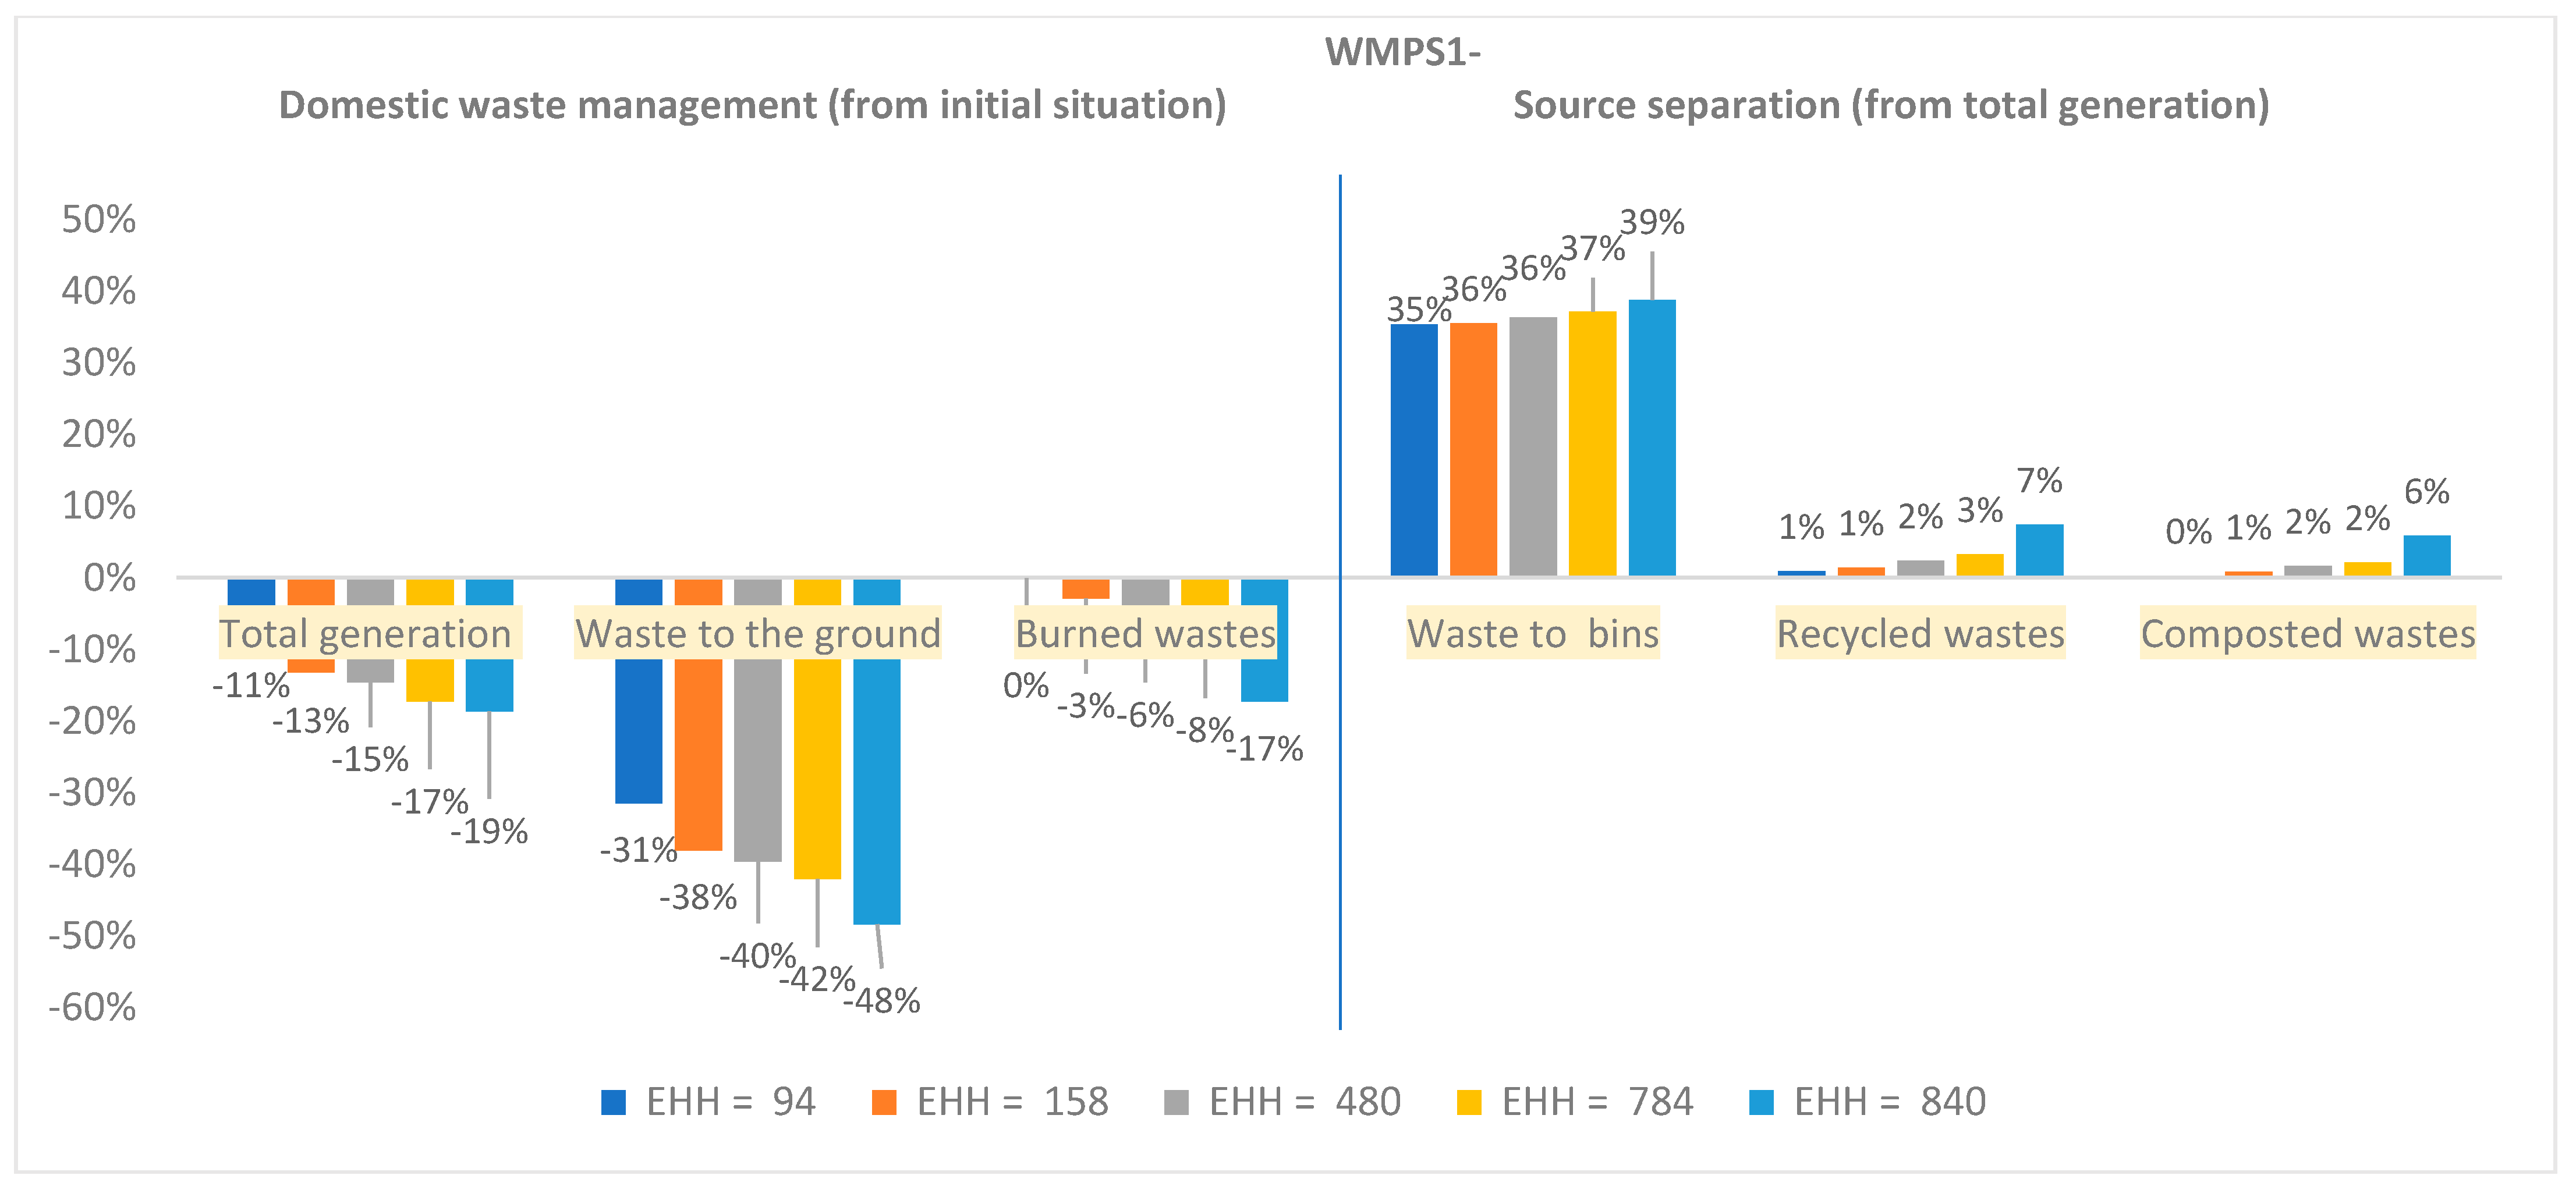
  • WMPS1-, Waste Management Policy Scenario 1, pessimistic. Considers that KOICA finances the education and infrastructure plan, and the local government is responsible for its maintenance. This scenario includes increasing collection frequency to 30 days—every two days for organic waste, every two days for recycling waste—resulting in an effect on situational factors. Compare to the latter scenario, citizen response to education activities and re-education however is moderately negative.
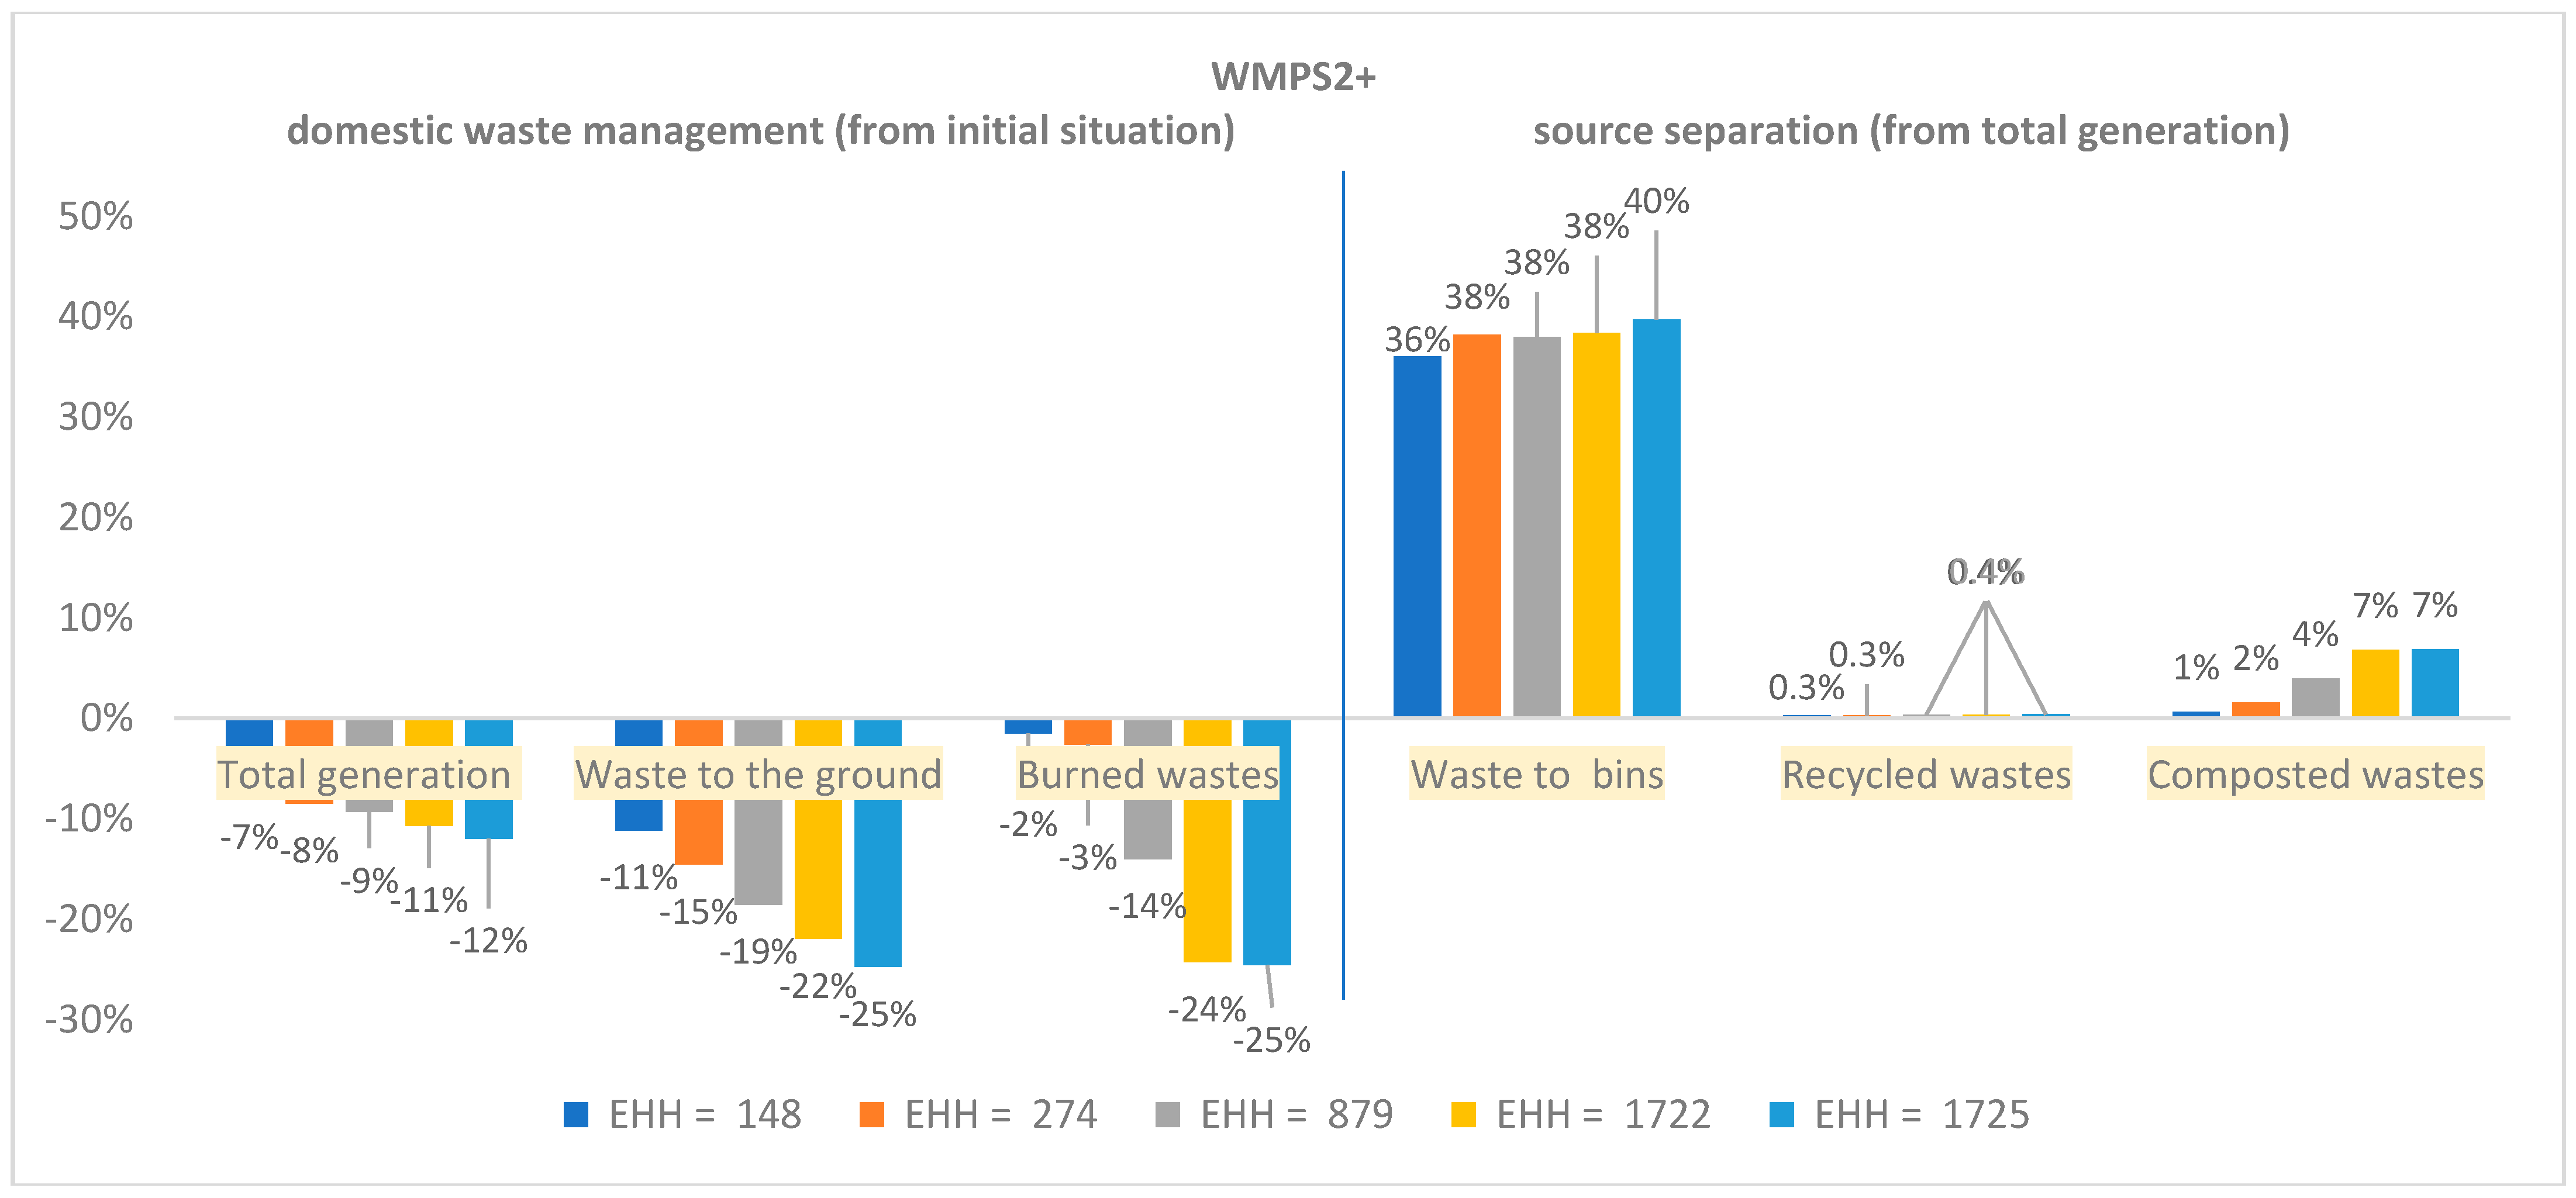
  • WMPS2+, Waste Management Policy Scenario 2, optimistic (a pessimistic WMPS2 scenario is not contemplated because the situation would be very similar to the initial one). KOICA finances the education and infrastructure plan, but the local government is not responsible for its maintenance. This scenario has been named WMPS2 Waste Management Policy Scenario 2. It does not include a commitment to maintaining the infrastructure in place, so the frequency of collection does not change from the initial situation—3 times a month—the incentive system does not exist, and the recycling system and street lighting do not work. In this situation, the positive effects derived from the incentives and situational factors are non-existent. This scenario is considered to assess the effect of the policy without the commitment of the local government.
Regarding the funding conditions of the education policy, the cost taken as a reference is based on the average price of the activities of the education action policy lines budgeted in Appendix C. According to this, five budget variants are considered:
  • An associated budget of EUR 9,600 to be divided over the three years of the plan’s implementation, equivalent to 4 activities per year.
  • An associated budget of EUR 19,200 to be divided over the three years of the plan’s implementation, equivalent to 8 activities per year.
  • An associated budget of EUR 28,800 to be divided over the three years of the plan’s implementation, equivalent to 12 activities per year.
  • An associated budget of EUR 38,400 to be divided over the three years of the plan’s duration, equivalent to 16 activities per year.
  • An associated budget of EUR 48,000 to be divided over the three years of the plan’s duration, equivalent to 20 activities per year.
The conditions of the simulations are as follows:
  • Time unit: months
  • Simulation horizon: 36 months
  • Time step: 1 month
  • Number of simulations: 16 simulations

3.2. Simulation Results

The main objective of this research is to see the effect of educational policies on household education and, consequently, the effect on source separation and the environment, and the district’s public health. Thus, results are shown at t = 36 (time considered to be the end of the policy (this time horizon corresponds to the usual duration of a KOICA cooperation project of this size), over the 15 scenarios, as an average of 16 simulations in three blocks:
  • Results for the number of educated households (Figure 5).
  • Impact of education on source separation (Figure 6, Figure 7 and Figure 8).
  • Results for environmental pollution and diseases of the population (Table 2).
First, we present the effect on the educated households. Results are shown as the average of educated households—and their standard deviation—when applying the mentioned 15 scenarios across 16 simulations (see Figure 5).
Figure 5 shows the number of educated households out of the total (2480 households) for each of the conditions established. A greater effect is obtained when the conditions of financing, maintenance, and citizen response of the WMPS1+ scenario are fulfilled. However, if these conditions are not created (WMPS1−, WMPS2+), the impact is much smaller. Additionally, a large marginal difference is observed between one scenario and the rest. The larger the budget, the larger the effect of education on total households. However, once we reach budget D (EUR 38,400), we observe that the marginal difference to budget E (EUR 48,000) is not significant. That is, given the larger volume of resources involved, it does not represent a large difference in the number of educated households. It should be remembered that we consider educated households those that, regardless of their level of formal education, are educated in environmental awareness, sustainable development, and proper waste management.
After that, we proceed to evaluating the impact of the different levels of education on source separation levels, observable in total waste generation, waste to the ground, burned waste, waste to bins, recycled waste, and composted waste. The first three, total generation, waste on the ground, and burned waste, are given as a percentage reduction or increase in the initial situation. The next three, waste to bins, recycled waste, and composted waste, are given as a percentage of total generation. Figure 6, Figure 7 and Figure 8 show the effects of the educational level over the three different scenarios.
According to Figure 6, Figure 7 and Figure 8 “total generation“ reduction rates are between 10% and 25% in the different scenarios, with the highest impact under WMPS1+ conditions. Following this, when looking at “waste to ground“ in the three figures, we observe a significant reduction in all scenarios. The WMPS2+ data show that, even though the government continues to collect waste at an inadequate frequency (3 days/month), the population, more aware of the seriousness of its contribution, reduces the volume of waste on the ground. Regarding the reduction of “burned waste, a strong reduction is observed in many educated households, especially under WMPS1+ conditions.
Following this, we can observe the effects on source separation over “waste to bins“, “recycled waste“ and “composted waste“ in comparison with total generation for each educational level. The major change in WMPS1+ is not in “waste to bins“ but rather in source separation in total (as a sum of “waste to bins“, “recycled wastes“, and “composted waste“) caused by the joint effect of education and infrastructure policies. It should be noted that in the initial situation, the ratio of waste thrown away was 0.35 (see Figure A4 in Appendix B). This is reflected in high waste to bins“ rates but also in recycled waste“ and composted waste“. However, source separation is very low in WMPS1- and WMPS2+ although waste to bin rates continue to increase. This is because in WMPS1-, waste collection at the proper frequency is a determinant of waste to bins. In WMPS2+, however, the key factor is education. Although waste is not collected at the right frequency, the population makes an effort to manage waste correctly. “Recycled waste” shows highly different results according to the conditions of each scenario, revealing the importance of mixing infrastructure and educational policy. “Composted waste”, however, only shows a good result within the three scenarios with the highest levels of education.
Finally, results of the environmental policies (measured through indoor air pollution and water quality) and on population diseases (measured through diseases attributable to water and children with respiratory diseases) are shown in Table 2. Diseases attributable to water and children with respiratory diseases are chosen, as they are the reference points of UNICEF and the World Health Organization for warning about public health problems in the region. Levels of attributable diseases are measured according to the World Health Organization data website [65,66].
Table 2 shows the effects of the policies on air and water pollution, and consequently diseases suffered by the population, in the five different education budget scenarios (see Table 1). Water quality is measured between 0 and 1, where 1 is the highest degree of water quality and 0 the worst. To establish the parameters of water quality levels and their effect on diseases, the values of other countries have been taken as a reference from the World Health Organization (Appendix B). No significant changes are observed in the level of water quality or associated diseases. Indoor air pollution is measured as levels of PM2.5 inside the ger houses. To establish the parameters of indoor air pollution and its effect on diseases, the values of other countries have been taken as a reference from the World Health Organization and articles of reference (Appendix B). No significant changes are observed in the level of air pollution or associated diseases. To sum up, the results from all 15 scenarios do not show significant changes, despite the associated budgets of the policies, and responses from the community to said policies. This is due, on the one hand, to the existence of other weighty factors which blur the effects of the policy within these variables, but also to the fact that sociodemographic aspects such as age have not been considered in a disaggregated manner. It is highly likely that if the household population had been divided into age segments, we would have seen greater effects on the health of the elderly, children, and people at risk of ill health, as reports from the World Health Organization (WHO) habitually show.

4. Discussions

The results extracted from the simulations show how an education and infrastructure policy effectively reduces total waste generation in all scenarios. This means that while household education levels in WMPS1- are not as high as in WMPS1+, other active factors, such as incentives, are effective in reducing waste generation. Furthermore, we can observe that when the incentive and situational factors are not active (WMPS2+), education is not sufficient to enhance a greater reduction in total waste generated.
The importance of educational policy in domestic waste management and source separation is especially clear with burned waste, waste to the ground, recycling, and composting, where the effects amongst the higher education levels show a major impact. This leads us to conclude that, in these types of management, education has a crucial role to play, as argued by [45,48,52]. However, the “waste to bin” and “waste to the ground” results in the three scenarios show that waste collection infrastructure is key to improving these two types of waste management. In line with [46], the WMPS2+ results warn of the weakness of local governments in some developing regions, who neglect waste management issues, and the need to formulate policies which entail their full engagement. In the WMPS2+ scenario where, despite a positive response from the population to the infrastructure and education policies implemented by KOICA, the population continues to burn and dump waste on the ground at a high rate, and cannot put their waste in bins as they are not collected at an adequate frequency. This shows that, no matter how much we educate the population, if the local government does not maintain a basic infrastructure of municipal management (adequate frequency, recycling system, implementation of incentives, maintenance of lighting, etc.), the population is less motivated to implement source separation. However, composting, burned waste, and waste on the ground slightly improve, due to the community’s sustainable development education levels. This is a change with respect to [54], as the authors did not consider other types of behavior and source separation other than recycling. They also failed to consider the case in which the central government did not attend to the correct collection of waste, including a recycling system, but took it as an assumption.
In contrast to [54,58], which focus on measuring the impact of MSWM policies on waste generation and separation, we also addressed the results of the policy in terms of the environment and public health. The results show that policies have an exceptionally low effect on environmental pollution and the public health of the local population. Despite a relevant reduction of waste generated, burned, and landfilled—especially under WMPS1+—the consequences for pollution and health of the population are nearly unobservable. This shows that there are other, much weightier, factors which damage Darkhan’s health and environment, such as coal as part of the fuel mix [43] or the non-sealing of latrines in household plots [32].
Finally, it is important to consider that the results of our model emphasize a first approach to anticipating the results of this policy. To obtain more precise results, a larger number of parameters should be addressed to reflect a greater variety of effects that affect the model.
In terms of the desired high efficiency and impact standards, and thanks to the results of the system dynamics model, we make a series of recommendations to be considered for the possible creation of an MSWM policy within the Green Ger Village Master Plan:
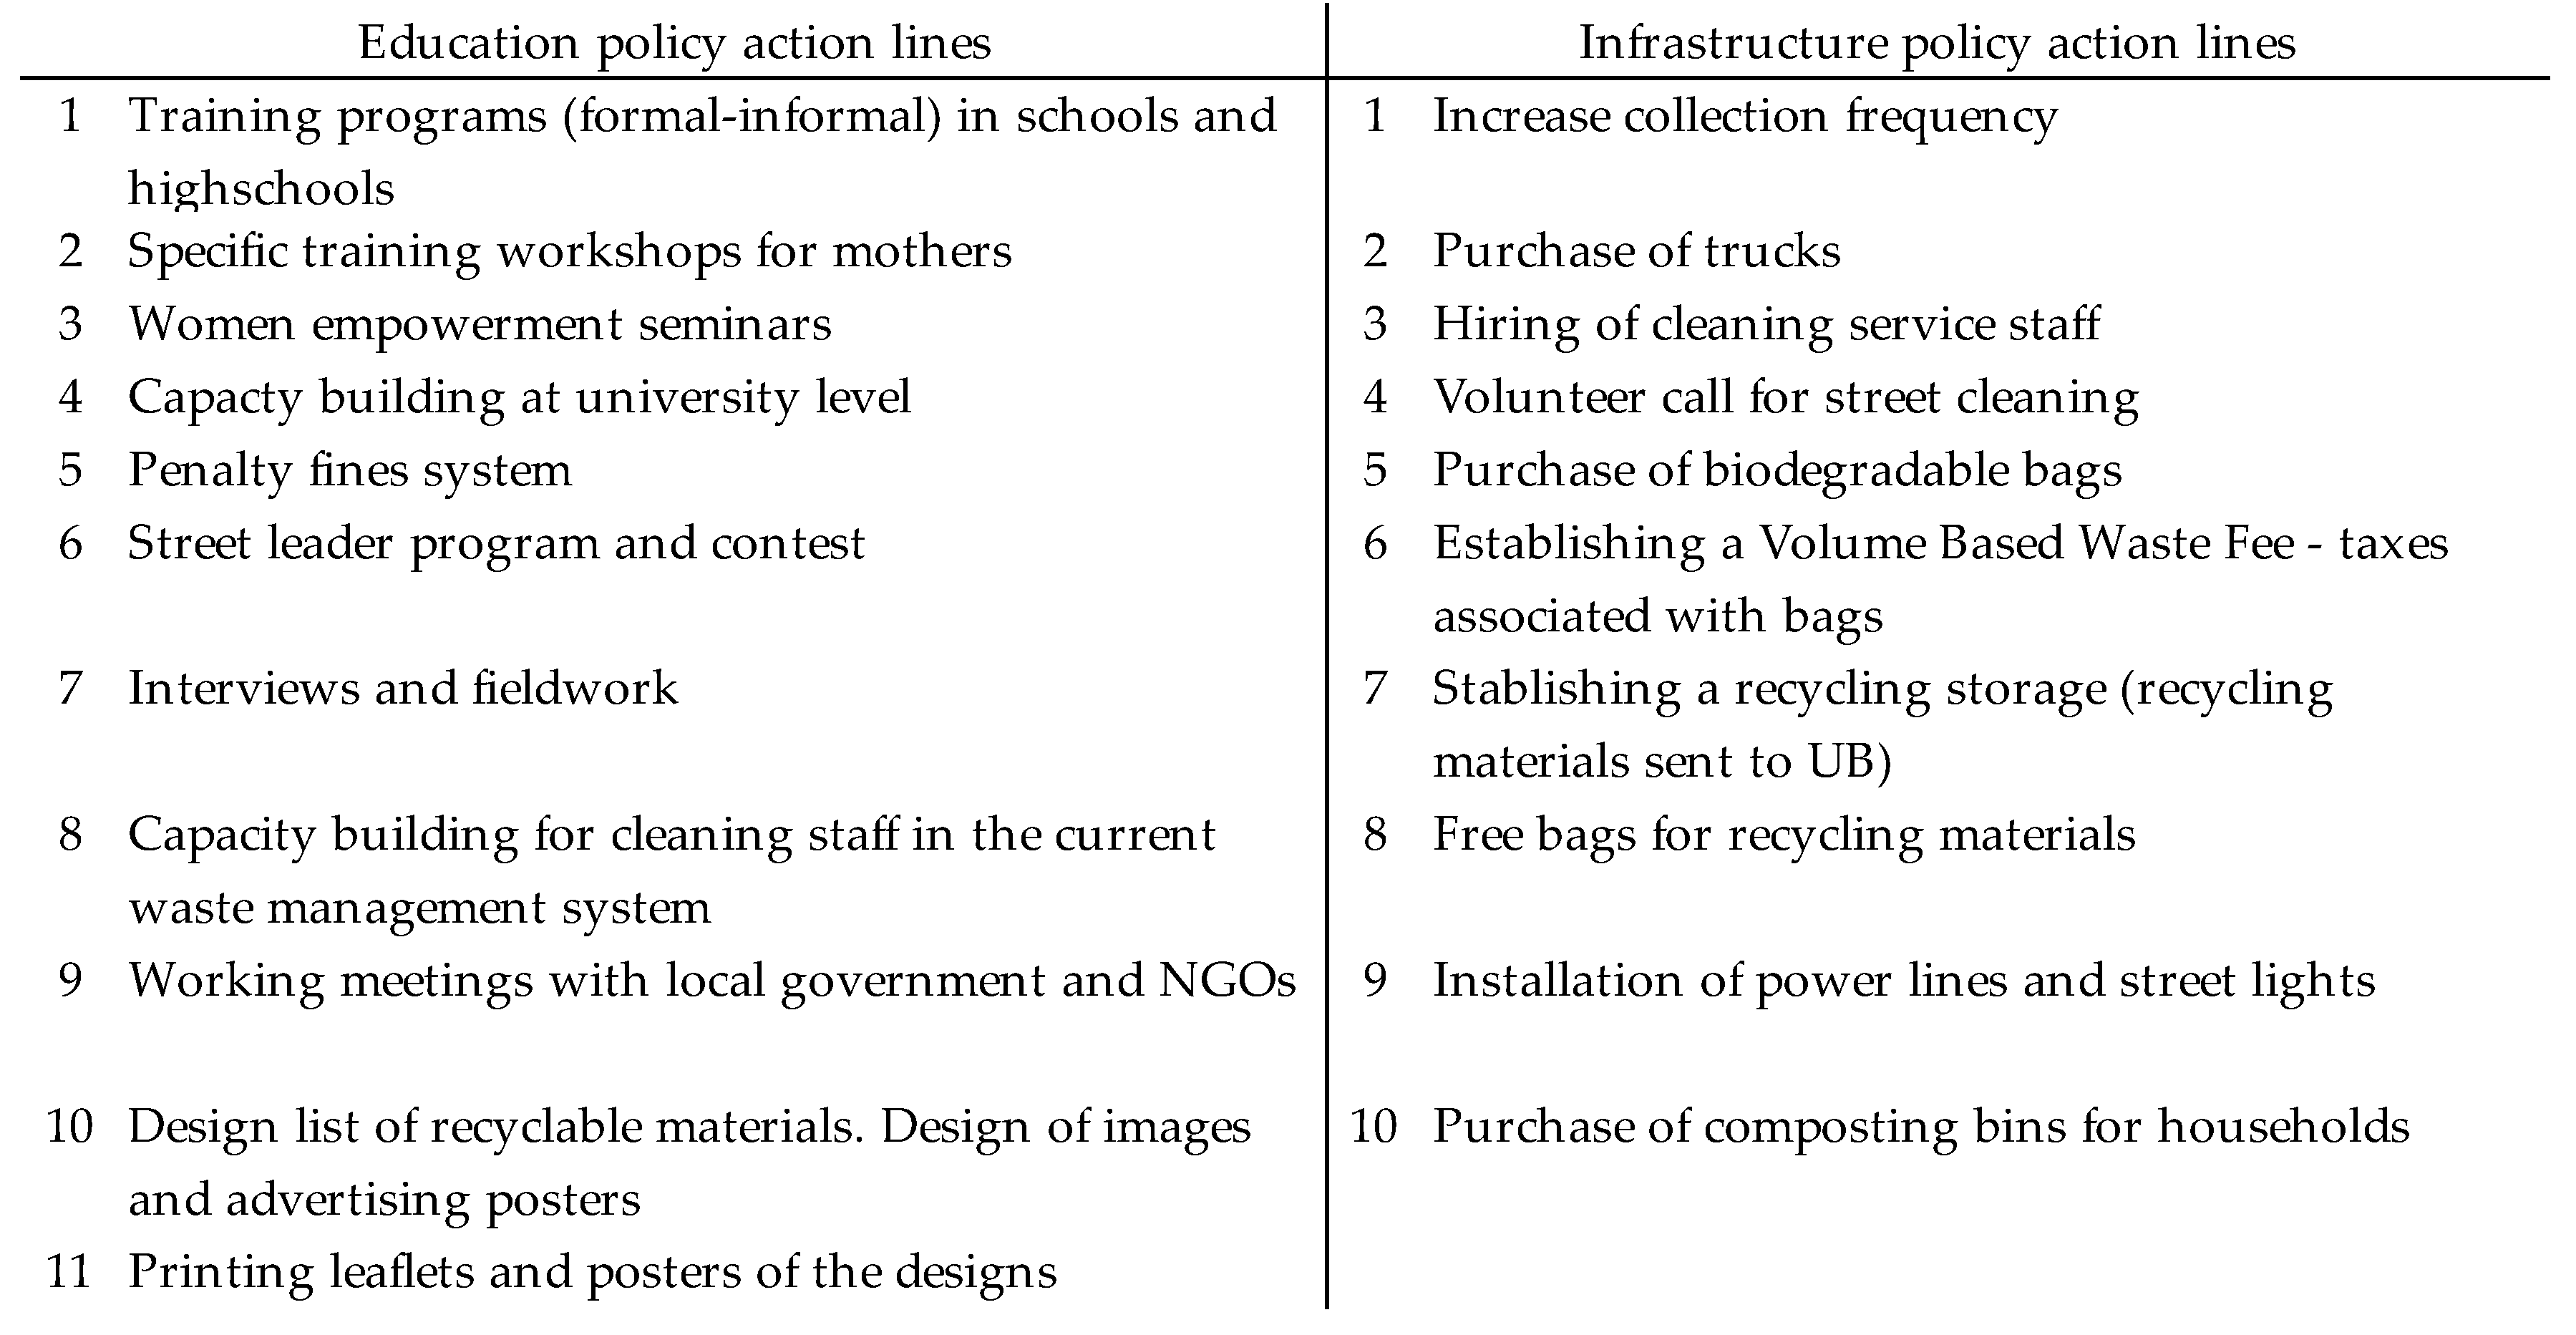
  • If the real conditions are similar to the WMSP1+ scenario, we recommend, in addition to the funding of the infrastructure policy, an allocation of EUR 38,400, to be spread over three years of the education policy. A larger budget would not result in a much higher impact. During the first year, we would recommend focusing the budget on meetings, the design and printing of materials, and capacity building for cleaning staff, as well as citizen training programs. In the second and third years, we recommend focusing the budget on education and training activities within the communities, with special attention paid to women, a street leader contest, and education at the university.
  • If the real conditions are similar to the WMSP1- scenario, we recommend, in addition to the funding of the infrastructure policy, an allocation of EUR 28,800, as this budget will achieve extremely similar effects to higher ones. In this scenario, the sustainability of the policy and re-education of households will play a key role over time. Thus, in the years following the plan, the population will continue to be re-educated, despite a lower response than desired. Within this assumption, we recommend performing the same activities as in the WMSP1+ scenario, but with a lower burden of meetings, field work, and university training activities in the second and third years.
  • If the real conditions are similar to the WMPS2+ scenario, we recommend not implementing the infrastructure policy, as the results obtained would be insufficient in the absence of local government support. In this case, it would be better to direct the budget of the infrastructure policy towards other types of initiatives which could improve the district’s development. It would be advisable to support the education policy with a budget of EUR 28,800 for the benefits it would bring to the population (environmental awareness, improvement of the situation in the streets, etc.), although it would not have as much impact as desired. Within this assumption, we recommend performing the same activities as in the WMSP1+ scenario, focusing almost totally on education and training activities within the communities in the second and third years, with special attention paid to women. Capacity building for cleaning staff activities is not recommended under this scenario.
  • If such a large volume of funds is not available to cover the infrastructure and education policy, we recommend eliminating the lighting infrastructure line, which would mean a cut of EUR 2,310,000 (total). The remaining education and infrastructure policy lines contained in Appendix A are considered essential.
  • Lastly, in case the primary objective of the cooperation plan is the reduction of pollution in the district, it is recommended to combine the proposed policies with a clean policy that includes solar panels, access to central heating, and sealing pit latrines.

5. Conclusions

This paper aimed to assess efficient MSWM policy decisions for Darkhan, district 15, as part of an international development cooperation plan. Our research aimed to focus on the importance of education for sustainable development processes in households, and its gradual positive effect on the urban ecosystem. To this end, a system dynamics model focused on education in MSWM policies has been designed to anticipate its impact in terms of source separation, the environment, and public health. However, it fails to show the waste management treatment processes that require heavy use of funds and are key in soil contamination [58], and the effects of these policies on the capacity of landfills [59]. Likewise, the model does not reflect the sociodemographic variables that are determinants for a higher degree of source separation, such as gender, income level, or level of school education [65].
The results of the DARKHAN-15 model shows that an MSWM education policy is particularly relevant for behavioral change in terms of burned waste, waste to the ground, recycling, and composting, including more information on the effects of the policy than has been provided by other articles to date. Innovatively, the model has revealed a real situation in many developing countries, observing the effects of policies if there is no commitment to maintaining MSWM infrastructure by local governments.
The particularity of our context has been another of the key elements of our proposal. Darkhan is a poorly studied city, despite the serious conditions it suffers and the fact that it is the second-largest city in Mongolia. Thus, this research intends not only to propose possible policies to improve the environmental situation, but also to increase the visibility of the circumstances of the region.
The results of this research lead us to conclude that system dynamics might be an efficient ex ante impact assessment tool for international development cooperation, as it offers a range of results in different conditions and is able to make the most efficient decisions. However, we must not forget that system dynamics has a large component of subjectivity and specificity (it is a tailor-made model that reflects a concrete reality), making the application of the model to other contexts more complex. For this reason, the process of constructing the model has been extensively detailed so that it can be easily understood and applied by other academics and policy makers. According to our results, we consider it essential that international cooperation for development policies on the environment focuses on education to contribute to better sustainable development, as it generates a perdurable change in citizens and their relationship with the environment. Future research shall address the importance of education for sustainable development in urban planning and development policies, with system dynamics being a good instrument for understanding and anticipating its impact.
It is expected that the described process of model construction and its results will contribute to further use of system dynamics as a planning and evaluation tool in international development plans and, ultimately, lead to their greater efficiency.

Supplementary Materials

Author Contributions

Conceptualization, P.C.-M., V.F.M. and A.J.D.; methodology, P.C.-M. and V.F.M.; formal analysis, P.C.-M.; investigation, P.C.-M.; writing—original draft preparation, P.C.-M.; writing—review and editing, V.F.M. and A.J.D. All authors have read and agreed to the published version of the manuscript.

Funding

This work was supported by the SEED Program for Korean Studies through the Ministry of Education of the Republic of Korea and the Korean Studies Promotion Service of the Academy of Korean Studies (AKS-2016-INC-2230004).

Institutional Review Board Statement

Not applicable.

Informed Consent Statement

Not applicable.

Data Availability Statement

Data availability has been referenced in Appendix B and Supplemental Materials.

Acknowledgments

The authors appreciate the support and information shared by Incheon National University IC-IDCC Office, Mongolian University of Life Science, and the Mongolian NGO Citizen’s Initiative Development Driver, M.A.P., and, J.M.M.D. The authors truly thank the anonymous peer reviewers for their insightful and positive feedback and comments.

Conflicts of Interest

The authors declare no conflict of interest.

Appendix A

Figure A1. Action lines included in the education and infrastructure policy proposal for improving MSWM in district 15 of Darkhan. Source: Own work. Based on the Waste Separation Policy proposal for Darkhan of Puntsagnamjil [35].
Sustainability 13 04595 g0a1

Appendix B

Figure A2. Data related to economic subsystem. Date source: Economic data is shown in euros, being a global currency that is easy to understand. However, the official currency of Mongolia is the Mongol Tugrik.
Sustainability 13 04595 g0a2
Figure A3. Data related to households subsystem.
Sustainability 13 04595 g0a3
Figure A4. Data related to waste subsystem.
Sustainability 13 04595 g0a4
Figure A5. Data related to pollution function.
Sustainability 13 04595 g0a5

Appendix C. Detailed Budget of Educational Activities

Sustainability 13 04595 i001

References

  1. Sachs, J.D. From Millennium Development Goals to Sustainable Development Goals. Lancet 2012, 379, 2206–2211. [Google Scholar] [CrossRef]
  2. Ayers, J.M.; Huq, S. Supporting adaptation to climate change: What role for official development assistance? Dev. Policy Rev. 2009, 27, 675–692. [Google Scholar] [CrossRef]
  3. United Nations. General Assembly, 70th Session; United Nations: New York, NY, USA, 25 September 2015; Volume 16301. [Google Scholar]
  4. Oikawa, Y. International Cooperation: ESD and DRR in Japan; Springer: Tokyo, Japan, 2016; pp. 143–180. Available online: https://0-link-springer-com.brum.beds.ac.uk/chapter/10.1007/978-4-431-55982-5_10 (accessed on 17 April 2021).
  5. Chung, B.G.; Park, I. A Review of the Differences between ESD and GCED in SDGs: Focusing on the Concepts of Global Citizenship Education. J. Int. Coop Educ. 2016, 18, 17–35. [Google Scholar]
  6. OECD. Busan High Level Forum on Aid Effectiveness: Proceedings. Busan High Level Forum on Aid Effectiveness: Proceedings. 29 November–1 December 2011. Available online: https://www.oecd.org/dac/effectiveness/HLF4%20proceedings%20entire%20doc%20for%20web.pdf (accessed on 17 April 2021).
  7. Dietrich, S. Donor Political Economies and the Pursuit of Aid Effectiveness. Int. Organ. 2015, 70, 65–102. [Google Scholar] [CrossRef] [Green Version]
  8. Sianes, A. Shedding Light On Policy Coherence for Development: A Conceptual Framework. J. Int. Dev. 2017, 29, 134–146. [Google Scholar] [CrossRef]
  9. Carbone, M. Mission impossible: The European Union and policy coherence for development. J. Eur. Integr. 2008, 30, 323–342. [Google Scholar] [CrossRef]
  10. Crawford, P.; Bryce, P. Project monitoring and evaluation: A method for enhancing the efficiency and effectiveness of aid project implementation. Int. J. Proj. Manag. 2003, 21, 363–373. [Google Scholar] [CrossRef]
  11. European Union. Evaluation Methodological Approach. Toolbox. Available online: https://europa.eu/capacity4dev/evaluation_guidelines/wiki/toolbox-0 (accessed on 17 April 2021).
  12. European Comission. A social multi-criteria framework for ex-ante impact assessment: Operational Issues | EU Science Hub. 2017. Available online: https://ec.europa.eu/jrc/en/publication/social-multi-criteria-framework-ex-ante-impact-assessment-operational-issues (accessed on 17 April 2021).
  13. Landoni, P.; Corti, B. The Management of International Development Projects: Moving toward a Standard Approach or Differentiation? Proj. Manag. J. 2011, 42, 45–61. [Google Scholar] [CrossRef]
  14. Jakupec, V.; Kelly, M. Official development assistance and impact assessment–theoretical and practical frameworks. In Assessing the Impact of Foreign Aid; Jakupec, V., Kelly, M., Eds.; Elsevier Inc.: Amsterdam, The Netherlands, 2016; pp. 1–16. [Google Scholar]
  15. Annesley, C.; Engeli, I.; Gains, F.; Resodihardjo, S.L. Policy Advocacy in Hard Times: The Impact of Economic Performance on Gendering Executive Attention. West Eur. Polit. 2014, 37, 886–902. [Google Scholar] [CrossRef]
  16. Shahab, S.; Clinch, J.P.; O’Neill, E. Impact-based planning evaluation: Advancing normative criteria for policy analysis. Environ. Plan. B Urban Anal. City Sci. 2019, 46, 534–550. [Google Scholar] [CrossRef]
  17. Bagheri, A.; Hjorth, P. Planning for Sustainable Development. Sustain. Dev. 2007, 15, 83–96. [Google Scholar] [CrossRef]
  18. Koelling, P.; Schwandt, M.J. Health systems: A dynamic system - benefits from system dynamics. In Proceedings of the Winter Simulation Conference, Orlando, FL, USA, 4 December 2005; p. 7. [Google Scholar]
  19. Winz, I.; Brierley, G.; Trowsdale, S. The use of system dynamics simulation in water resources management. Water Resour. Manag. 2009, 23, 1301. [Google Scholar] [CrossRef]
  20. Shahgholian, K.; Hajihosseini, H. A dynamic model of air pollution, health, and population growth using system dynamics: A study on Tehran-Iran (with computer simulation by the software Vensim). World Acad. Sci. Eng. Technol. 2009, 59, 245–252. [Google Scholar]
  21. Allington, G.R.H.; Li, W.; Brown, D.G. Urbanization and environmental policy effects on the future availability of grazing resources on the Mongolian Plateau: Modeling socio-environmental system dynamics. Environ. Sci. Policy 2017, 68, 35–46. [Google Scholar] [CrossRef] [Green Version]
  22. Meadows, D.H.; Meadows, D.L.; Randers, J.; Behrens, W.W., III. The Limits to Growth; Universe Books: New York, NY, USA, 1972; 205p. [Google Scholar]
  23. Simonovic, S.P. World water dynamics: Global modeling of water resources. J. Environ. Manag. 2002, 66, 249–267. [Google Scholar] [CrossRef]
  24. Shen, Q.; Chen, Q.; sin Tang, B.; Yeung, S.; Hu, Y.; Cheung, G. A system dynamics model for the sustainable land use planning and development. Habitat Int. 2009, 33, 15–25. [Google Scholar] [CrossRef]
  25. Mutani, G.; Todeschi, V.; Beltramino, S. Energy consumption models at urban scale to measure energy resilience. Sustainability 2020, 12, 5678. [Google Scholar] [CrossRef]
  26. Bagheri, A.; Hjorth, P. A framework for process indicators to monitor for sustainable development: Practice to an urban water system. Environ. Dev. Sustain. 2007, 9, 143–161. [Google Scholar] [CrossRef]
  27. Macmillan, A.; Connor, J.; Witten, K.; Kearns, R.; Rees, D.; Woodward, A. The societal costs and benefits of commuter bicycling: Simulating the effects of specific policies using system dynamics modeling. Environ. Health Perspect. 2014, 122, 335–344. [Google Scholar] [CrossRef] [Green Version]
  28. Chung, B.G. The Korean model of ODA. Asian Educ. Dev. Stud. 2013, 3, 46–57. [Google Scholar] [CrossRef]
  29. Kim, E.M.; Kim, P.H.; Kim, J. From Development to Development Cooperation: Foreign Aid, country ownership, and the Developmental State in South Korea. Pac. Rev. 2013, 26, 313–336. [Google Scholar] [CrossRef]
  30. Lim, E.M. Evolution of Korea ODA Policy. Vestn. Rudn. Int. Relat. 2015, 1, 15–23. Available online: http://journals.rudn.ru/international-relations/article/view/10365/0 (accessed on 17 April 2021).
  31. Byambadorj, T.; Amati, M.; Ruming, K.J. Twenty-first century nomadic city: Ger districts and barriers to the implementation of the Ulaanbaatar City Master Plan. Asia Pac. View. 2011, 52, 165–177. [Google Scholar] [CrossRef]
  32. Uddin, S.M.N.; Li, Z.; Gaillard, J.C.; Tedoff, P.F.; Mang, H.P.; Lapegue, J.; Huba, E.M.; Kummel, O.; Rheinstein, E. Exposure to WASH-borne hazards: A scoping study on peri-urban Ger areas in Ulaanbaatar, Mongolia. Habitat Int. 2014, 44, 403–411. [Google Scholar] [CrossRef]
  33. Choi, C. Inexorable rise of ger in mongolia: Demolition for redevelopment or conservation for improvement? Int. Rev. Public Adm. 2012, 17, 121–141. [Google Scholar]
  34. Sigel, K.; Altantuul, K.; Basandorj, D. Household needs and demand for improved water supply and sanitation in peri-urban ger areas: The case of Darkhan, Mongolia. Environ. Earth Sci. 2012, 65, 1561–1566. [Google Scholar] [CrossRef]
  35. Puntsagnamjil, M.-A. Study on the Driving Mechanism of Residential Waste Separation Behavioral Intention. Ph.D. Thesis, Incheon National University, Incheon, Korea, 2020. [Google Scholar]
  36. ADB. MON: Darkhan Waste Management Improvement Project; ADB: Ulaanbaatar, Mongolia, 2020. [Google Scholar]
  37. Byamba, B.; Ishikawa, M. Municipal solid waste management in Ulaanbaatar, Mongolia: Systems Analysis. Sustainability 2017, 9, 896. [Google Scholar] [CrossRef] [Green Version]
  38. Ban, H.; Hwang, Y.; Lim, M.; Ochir, C.; Lee, K. Daytime profile of residential PM2.5 concentrations in a ger, a traditional residence in Mongolia. Korean J. Public Health 2017, 54, 23–30. [Google Scholar] [CrossRef] [Green Version]
  39. NSOM. Socio-Economic Situation of Mongolia 2019/1; ADB: Ulaanbaatar, Mongolia, 2019. [Google Scholar]
  40. Goverment of Mongolia. Mongolia Voluntary National Review 2019 Implementation of the Sustainable Development Goals Government of Mongolia Government of Mongolia. 2019, pp. 1–95. Available online: https://sustainabledevelopment.un.org/content/documents/23342MONGOLIA_VOLUNTARY_NATIONAL_REVIEW_REPORT_2019.pdf (accessed on 17 April 2021).
  41. ADB. Darkhan Wastewater Management Project Wastewater Management for Darkhan. September 2014. Available online: https://www.adb.org/projects/documents/mon-darkhan-wastewater-management-sep-2014-tacr (accessed on 17 April 2021).
  42. Erdenebayar, E.; Dos Santos, K.; Edwards, A.; Dugersuren, N.O.; Ochir, C.; Nriagu, J. Environmental injustice and childhood lead exposure in peri-urban (ger) areas of Darkhan and Erdenet, Mongolia. BMC Public Health 2019, 19, 1–11. [Google Scholar] [CrossRef] [PubMed] [Green Version]
  43. Chultem, B.; Sonomdagva, C.; Byambatseren, C.; Matsumi, Y. Characterising Seasonal Variations and Spatial Distribution of Ambient Pm2.5 Concentration Based on Short-Term Monitoring in Darkhan City. Proc. Mong. Acad. Sci. 2018, 58, 18–27. [Google Scholar]
  44. Timofeev, I.; Kosheleva, N.; Kasimov, N. Health risk assessment based on the contents of potentially toxic elements in urban soils of Darkhan, Mongolia. J. Environ. Manag. 2019, 242, 279–289. [Google Scholar] [CrossRef] [PubMed]
  45. Al-Khatib, I.A.; Monou, M.; Abu Zahra, A.S.F.; Shaheen, H.Q.; Kassinos, D. Solid waste characterization, quantification and management practices in developing countries. A case study: Nablus district - Palestine. J. Environ. Manag. 2010, 91, 1131. [Google Scholar] [CrossRef] [PubMed]
  46. Henry, R.K.; Yongsheng, Z.; Jun, D. Municipal solid waste management challenges in developing countries - Kenyan case study. Waste Manag. 2006, 26, 92–100. [Google Scholar] [CrossRef] [PubMed]
  47. Zhuang, Y.; Wu, S.W.; Wang, Y.L.; Wu, W.X.; Chen, Y.X. Source separation of household waste: A case study in China. Waste Manag. 2008, 28, 2022–2030. [Google Scholar] [CrossRef] [PubMed]
  48. Vassanadumrongdee, S.; Kittipongvises, S. Factors influencing source separation intention and willingness to pay for improving waste management in Bangkok, Thailand. Sustain. Environ. Res. 2018, 28, 90–99. [Google Scholar] [CrossRef]
  49. Manaf, L.A.; Samah, M.A.A.; Zukki, N.I.M. Municipal solid waste management in Malaysia: Practices and challenges. Waste Manag. 2009, 29, 2902. [Google Scholar] [CrossRef] [PubMed]
  50. Rai, R.K.; Nepal, M.; Khadayat, M.S.; Bhardwaj, B. Improving Municipal Solid Waste Collection Services in Developing Countries: A Case of Bharatpur Metropolitan City, Nepal. Sustainability 2019, 11, 3010. [Google Scholar] [CrossRef] [Green Version]
  51. Boldero, J. The Prediction of Household Recycling of Newspapers: The Role of Attitudes, Intentions, and Situational Factors. J. Appl. Soc. Psychol. 1995, 25, 440–462. [Google Scholar] [CrossRef]
  52. Welfens, M.J.; Nordmann, J.; Seibt, A. Drivers and barriers to return and recycling of mobile phones. Case studies of communication and collection campaigns. J. Clean. Prod. 2016, 132, 108–121. [Google Scholar] [CrossRef] [Green Version]
  53. Challcharoenwattana, A.; Pharino, C. Wishing to finance a recycling program? Willingness-to-pay study for enhancing municipal solid waste recycling in urban settlements in Thailand. Habitat Int. 2016, 51, 23–30. [Google Scholar] [CrossRef]
  54. Sukholthaman, P.; Sharp, A. A system dynamics model to evaluate effects of source separation of municipal solid waste management: A case of Bangkok, Thailand. Waste Manag. 2016, 52, 50–61. [Google Scholar] [CrossRef] [PubMed]
  55. Do Valle, P.O.; Rebelo, E.; Reis, E.; Menezez, J. Combining behavioral theories to predict recycling involvement. Environ. Behavior. 2005, 37, 364–396. [Google Scholar] [CrossRef]
  56. Wang, F.S. Deterministic and stochastic simulations for solid waste collection systems - A SWIM approach. Environ. Model. Assess. 2001, 6, 249–260. [Google Scholar] [CrossRef]
  57. Breukelman, H.; Krikke, H.; Löhr, A. Failing Services on Urban Waste Management in Developing Countries: A Review on Symptoms, Diagnoses, and Interventions. Sustainability 2019, 11, 6977. [Google Scholar] [CrossRef] [Green Version]
  58. Di Nola, M.F.; Escapa, M.; Ansah, J.P. Modelling solid waste management solutions: The case of Campania, Italy. Waste Manag. 2018, 78, 717–729. [Google Scholar] [CrossRef]
  59. Tam, V.W.; Li, J.; Cai, H. System dynamic modeling on construction waste management in Shenzhen, China. Waste Manag. Res. 2014, 32, 441–453. [Google Scholar] [CrossRef] [PubMed]
  60. Hjorth, P.; Bagheri, A. Navigating towards sustainable development: A system dynamics approach. Futures 2006, 38, 74–92. [Google Scholar] [CrossRef]
  61. Aracil, J. Introducción a la Dinámica de Sistemas; Alianza Editorial: Madrid, Spain, 1979; 398p. [Google Scholar]
  62. Barlas, Y. Formal aspects of model validity and validation in system dynamics. Syst. Dyn. Rev. 1996, 12, 183–210. [Google Scholar] [CrossRef]
  63. Kim, K.Y. Volume-Based Waste Fee System in Korea; Korea Sharing Program: Seoul, Korea, 2012; pp. 1–132. [Google Scholar]
  64. Fortmann-Roe, S. Insight Maker: A general-purpose tool for web-based modeling & simulation. Simul. Model. Pract. Theory 2014, 47, 28–45. [Google Scholar]
  65. WHO. Global Health Observatory Data Repository. Burden of Disease from Inadequate Water, Sanitation and Hygiene in Low- and Middle-Income Countries. Available online: http://apps.who.int/gho/data/view.main.INADEQUATEWSHv (accessed on 17 April 2021).
  66. UNICEF NC for, P.H. Mongolia’ s Air Pollution Crisis: A Call to Action to Protect Children’s Health. Uaanbatar. 2017. Available online: https://www.unicef.org/mongolia/Mongolia_air_pollution_crisis_ENG.pdf (accessed on 17 April 2021).
Figure 1. Map of ger district (bagh in Mongol) 15, Darkhan, Mongolia. Own work based on Google Maps, n.d.
Sustainability 13 04595 g001
Figure 2. Construction process of DARKHAN-15 model. Source: Own work, based on Aracil and Barlas [61,62].
Sustainability 13 04595 g002
Figure 3. Basic structure of DARKHAN-15. Source: Own work.
Sustainability 13 04595 g003
Figure 4. DARKHAN-15 stock and flow diagram. Source: Own work.
Sustainability 13 04595 g004
Figure 5. Educated households applying the policy under 15 different scenarios. Source: own work.
Sustainability 13 04595 g005
Figure 6. Results of domestic waste management and source separation under scenario WMPS1+ and five different education levels. Source: Own work.
Sustainability 13 04595 g006
Figure 7. Results of domestic waste management and source separation under scenario WMPS1- and five different education levels. Source: Own work.
Sustainability 13 04595 g007
Figure 8. Results of domestic waste management and source separation under scenario WMPS2+ and five different education levels. Source: Own work.
Sustainability 13 04595 g008
Table 1. Simulation scenario conditions.
WMPS1+WMPS1-WMPS2+
Funding & maintenance infrastructure conditions
Cost of waste management infrastructure (KOICA) -total- EUR 281,000 EUR 281,000 EUR 281,000
Lighting infrastructure Budget -total-EUR 2,310,000 EUR 2,310,000 EUR 2,310,000
Waste Management infrastructure maintenance (Local government) - monthly-EUR 167,000 EUR 167,000 EUR -
Frequency of waste collection (days/month)30303
Levels of people’s response to action policies
Reeducation rate (by social recognition and public participation)[50, 0.0001; 200, 0.0005; 400, 0.001; 600, 0.01; 800, 0.05; 1000, 0.8; 1500, 0.11][100, 0.0001; 300, 0.0005; 550, 0.001; 800, 0.01; 1000, 0.05; 1300, 0.8; 1700, 0.11][50, 0.0001; 200, 0.0005; 400, 0.001; 600, 0.01; 800, 0.05; 1000, 0.8; 1500, 0.11]
Knowledge effect[400, 0.001; 600, 0.002; 800, 0.005; 1000, 0.01] [400, 0.0005; 600, 0.001; 800, 0.002; 1000, 0.005] [400, 0.001; 600, 0.002; 800, 0.005; 1000, 0.01]
Incentive-based factors effect0.370.370
Situational factors effect0.530.530
Funding alternatives
  A EUR 9,600
  B EUR 19,200
  C EUR 28,800
  D EUR 38,400
  E EUR 48,000
Total simulated scenarios
WMPS1+AWMPS1-AWMPS2+A
WMPS1+BWMPS1-BWMPS2+B
WMPS1+CWMPS1-CWMPS2+C
WMPS1+DWMPS1-DWMPS2+D
WMPS1+EWMPS1-EWMPS2+E
Source: Own work based on similar applications of reference [35,45].
Table 2. Results on pollution and diseases in three different scenarios.
UnitInitial SituationABCDE
WMPS1+Quality water consumedUnitless0.51230.51230.51310.52010.52590.5387
Indoor air pollution (PM 2.5)μg/m3176176176172164160
Diseases attributable to water% people0.0170.0170.0170.0170.0170.016
Children with respiratory disease ‰ people0.410.410.40.40.390.38
WMPS1-Quality water consumedUnitless0.51230.51230.51290.51340.51690.5174
Indoor air pollution (PM 2.5)μg/m3176176176175175174
Diseases attributable to water% people0.0170.0170.0170.0160.0140.014
Children with respiratory disease‰ people0.410.410.410.410.410.41
WMPS2+Quality water consumedUnitless0.51230.51230.51280.5190.52340.5309
Indoor air pollution (PM 2.5)μg/m3176176176174172169
Diseases attributable to water% people0.0170.0170.0170.0170.0170.016
Children with respiratory disease ‰ people0.410.410.410.410.410.4
Source: Own work.
Publisher’s Note: MDPI stays neutral with regard to jurisdictional claims in published maps and institutional affiliations.

