
Commercial Vacancy Prediction Using LSTM Neural Networks


1
Department of Urban Design and Planning, Hongik University, Seoul 04066, Korea
2
Department of Urban Policy and Administration, Incheon National University, Incheon 22012, Korea
*
Author to whom correspondence should be addressed.
Sustainability 2021, 13(10), 5400; https://0-doi-org.brum.beds.ac.uk/10.3390/su13105400
Submission received: 2 April 2021
/
Revised: 30 April 2021
/
Accepted: 7 May 2021
/
Published: 12 May 2021
(This article belongs to the Special Issue Sustainable Regeneration of Degraded Urban Structures and Fabric)
Abstract
:Previous studies on commercial vacancy have mostly focused on the survival rate of commercial buildings over a certain time frame and the cause of their closure, due to a lack of appropriate data. Based on a time-series of 2,940,000 individual commercial facility data, the main purpose of this research is two-fold: (1) to examine long short-term memory (LSTM) as a feasible option for predicting trends in commercial districts and (2) to identify the influence of each variable on prediction results for establishing evidence-based decision-making on the primary influences of commercial vacancy. The results indicate that LSTM can be useful in simulating commercial vacancy dynamics. Furthermore, sales, floating population, and franchise rate were found to be the main determinants for commercial vacancy. The results suggest that it is imperative to control the cannibalization of commercial districts and develop their competitiveness to retain a consistent floating population.
1. Introduction
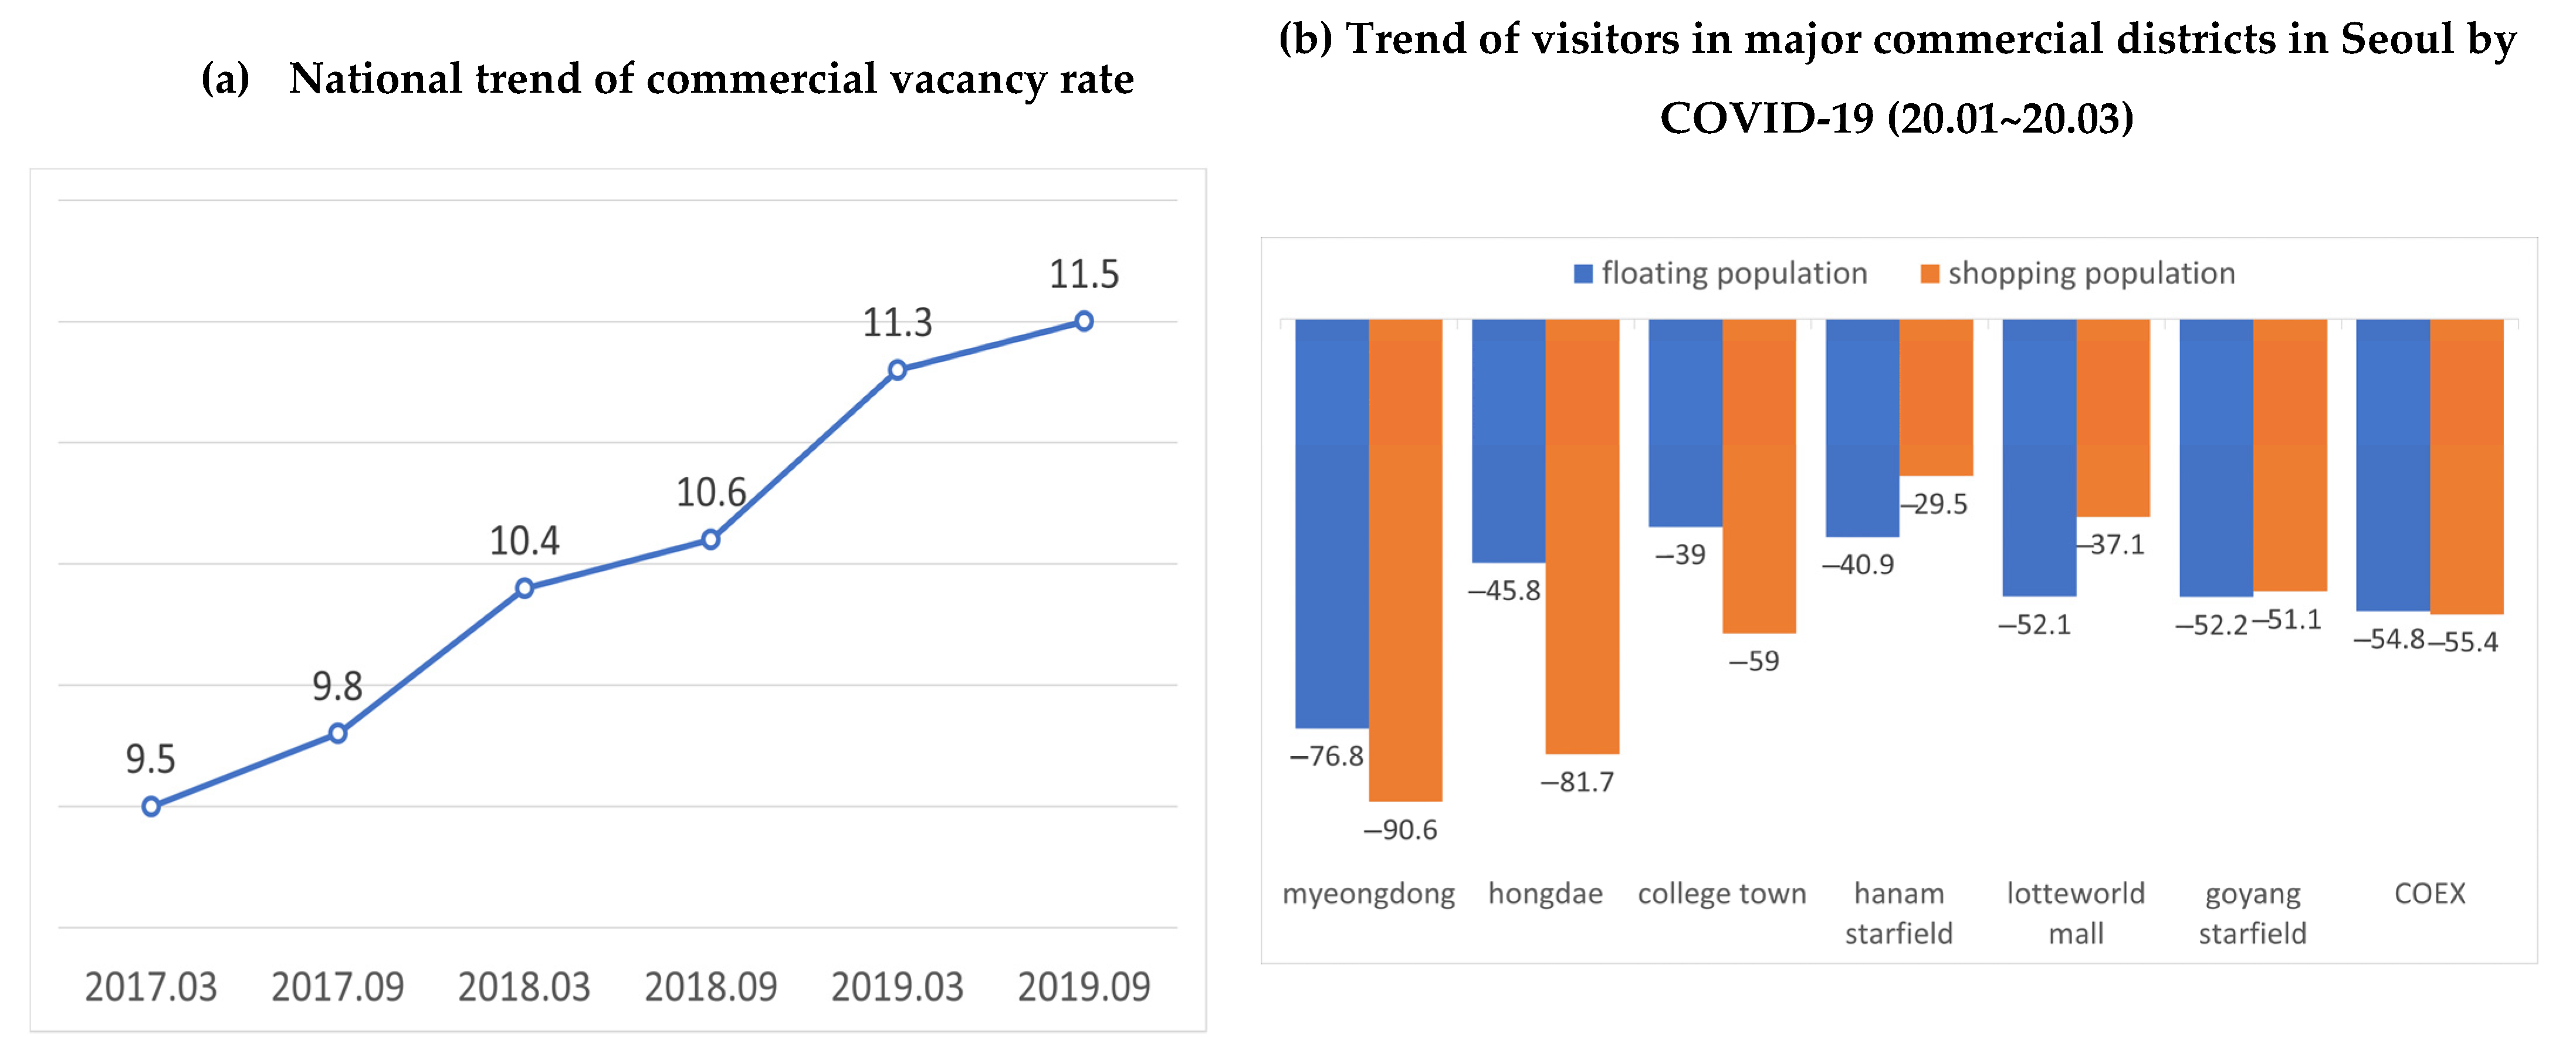
Commercial vacancy recently emerged as a critical urban issue in South Korea. According to the 2018 commercial real estate rental trends report by the Korea Real Estate Board (KREB), the shopping mall vacancy rate has been increasing steadily since it exceeded 10% in the second half of 2017, and some major commercial districts exceeded 20% (Figure 1a). Considering the situation in Seoul, where the average vacancy rate is approaching 12%, the vacancy issue should be discussed carefully and with urgency.
One of the primary reasons for this increase in commercial vacancies is that the supply of retail stores has increased significantly through rising construction and building remodeling in major commercial districts, while demand has fallen due to shrinking consumption. As large shopping centers in these areas have absorbed a floating population, small, owner-operated local businesses face an escalating vacancy rate. Worse, due to COVID-19, sales and floating populations are rapidly decreasing in commercial districts. As shown in Figure 1b, between the last quarter of 2019 and the first quarter of 2020, the pandemic led to a drastic drop in sales in both main and local commercial districts. As a result, although rental contract guarantee periods are for five years, the average rental period in Seoul is now only approximately 1.7 years, reflecting an unstable market situation.
There are various reasons for vacancies in commercial buildings, including the conflicting interests of landlords and tenants, supply–demand imbalance, and building usage limitations. Aside from economic situations and social issues, many studies have attributed commercial vacancies to size, location, and the managing entity. To solve the issue, they have highlighted physical improvements and use programs for empty commercial buildings. According to previous research, causes of vacancy in commercial buildings include business type, accessibility, floating population, average sales, and location of the commercial district, in addition to external economic conditions and societal problems. Such characteristics were found to significantly influence the longevity and closure rates of businesses located in a commercial district [1,2,3,4,5].
Furthermore, the growth and decline of a commercial district based on time-series change also affects the total number of businesses and percentage of food service businesses there, ultimately exerting a significant influence on survival rates. Accordingly, such growth and decline is closely related to the survival or closure of a commercial building; therefore, it is essential for studies on commercial vacancy to reflect changes in a commercial district based on time trends. Nonetheless, previous studies of commercial districts have mainly focused on rent analysis using the hedonic price function during a specific time frame. Few studies have been conducted on the vacancy rate of commercial buildings by reflecting the time-series change of commercial districts.
This study aims to develop an algorithm for predicting commercial vacancy rate dynamics using a long short-term memory (LSTM) model based on opening and closure data for 2,940,000 commercial facilities in Seoul. Since the physical, economic, and social patterns within a commercial district pertaining to commercial vacancies may have different causes and effects depending on time and space, a high-level analysis using spatial big data is required. Therefore, there is an urgent need to develop a prediction model that can accurately analyze and predict trends so that the appropriate strategies and policies can be implemented more effectively. By developing a vacancy rate prediction model based on a systematic and accurate deep-learning method, we can lay the foundation for a prediction system using spatial big data and use it for baseline data for establishing policy to vitalize local commercial districts in the future.
2. Literature Review
2.1. Commercial Vacancy, Survival, and Closure
As of 2017, 25% of all South Koreans were self-employed, placing Korea fifth among 35 OECD countries for self-employment (OECD, 2017). Competition among self-employed businesses has become intense as the Baby Boomer generation retires and young people increasingly start their own businesses due to difficulties in finding employment. Meanwhile, the business environment is worsening, and business closures have been rising because of an increase in the minimum wage and reduced consumption as the economy stagnates. In these circumstances, the percentage of business closures, as opposed to those starting up in Korea, was over 72% in 2019, and more than 50% of businesses now close within three years of operation [6]. Such a high level of closures among owner-operated businesses has led to increasing commercial vacancies, followed by unstable employment, increased social costs, and enormous economic loss for individuals and the country. To reduce the closure rate of owner-operated businesses and lower the vacancy rate, scholars have conducted a wide range of studies on the factors influencing these.
Hardin III & Wolverton [7,8] (2000, 2001) predicted vacancy rates and rent levels using the two-stage least squares (TSLS) model by dividing 118 commercial buildings in Atlanta into several categories (image, possibility, scope of commercial district, and purchasing power of commercial district). Wheaton and Torto [9] (1988) conducted a study of office markets in the United States and identified a rental adjustment mechanism based on vacancy rate. The analysis showed an actual rent decrease of 2% in response to the 1% “excess vacancy” derived from the difference between market vacancy rate and natural vacancy rate.
Ahn and Sung [10] (2003) analyzed the starting point and longevity of owner-operated businesses. They examined factors that would determine the longevity of a business based on the Cox proportional hazards model. Their analysis showed a large variation in the longevity of owner-operated businesses depending on their owner’s gender and age when starting the business, marital status, and region.
Sanderson, Farrelly, and Thoday [11] (2006) compared the natural vacancy rates of office markets in large cities worldwide and discovered that these were highest in the United States and lowest in Europe. Their analysis showed that the natural vacancy rate was low in markets where urbanization and development were actively taking place, from a spatial perspective.
Nam [12] (2017) derived factors that affect the closure of owner-operated businesses in Korea using the Cox proportional hazards model. This analysis showed that such closures are determined by consumer price index, rent, regional gross product, population and growth rate, business history, size, and number of competing businesses.
Many scholars have conducted studies using statistical models such as regression analysis and the Cox proportional hazards model to derive different variables that affect the sustainability and closure of businesses and analyze their longevity and survival rates. However, most of the studies had limitations in predicting changes in commercial districts and suggesting future policies, since they identified the problems over a specific time frame or analyzed the impact of issues based on old data. Moreover, due to insufficient data, they could not perform microscopic spatial analysis beyond analyzing vacancy and closure rates for an entire region.
2.2. Deep-Learning-Based Prediction Model: LSTM
Early advancements in computer technology since the 1960s were accompanied by models that analyzed changes in space and traffic patterns to make predictions. Since S. Stowers developed a prediction model using multiple regression analysis in 1966, the statistical model has proven useful for analyzing the relationship between land-use distribution and other driving factors, and for predicting various urban changes based on the principle of economic/market equilibrium. Moreover, prediction models for real estate prices and sales were also developed based on statistical techniques using time-series analysis, such as the autoregressive integrated moving average model (ARIMA) or vector autoregressive model (VAR) [13,14,15].
However, these statistical models based on conventional regression analysis have met with disapproval due to several limitations. The modeling processes are too static. Aggregated macro-scale data should be used because of limited data collection and technology. Moreover, the linear model’s assumption, which deviates from reality, has limited applicability to the market’s nonlinear movement in real life.
In that vein, a time-series prediction method using neural networks, in place of a conventional regression analysis method, has emerged as the amount of data has increased and machine learning algorithms have developed in recent years.
Nguyen and Cripps [16] (2001) built a model for artificial neural networks to forecast the sales prices of private homes in Rutherford County in Tennessee. They compared the predictive power of the artificial neural network model with multiple regression analysis and proved that the former had greater predictive power. Similarly, Limsombunchao (2004) [17] developed a prediction model using an artificial neural network that took multiple variables into account (such as house size, wear and tear, housing type, and location) and compared the model with the hedonic price model. He concluded that the artificial neural network had greater predictive power. Furthermore, Newman et al. [18] (2016) and Lee and Newman [19] (2017) developed a prediction model using an artificial neural network for forecasting the distribution of vacant homes in growing and declining cities in the United States. They verified the model’s reliability through four methodologies and confirmed the feasibility of the neural network model as a means to predict spatial patterns.
As active research takes place in relation to deep-learning, studies have also emerged using the LSTM networks model, which is one of the recurrent neural network (RNN) algorithms that exhibit excellent performance in teaching time-series data [20,21,22,23,24]. Cha et al. (2018) [25] introduced an LSTM model that rectified the shortcomings of RNN and improved its performance. They compared the model with the existing multivariate discriminant analysis, non-time-series algorithm model, and deep-learning algorithm model. Their analysis showed that the RNN and LSTM models based on the deep-learning time-series algorithm were useful for predicting bankruptcy. Meanwhile, Temur et al. [26] (2019) forecast house sales prices using the LSTM and ARIMA models based on housing price data between 2008 and 2018. By comparing the accuracy of these models, they demonstrated the outstanding predictive power of neural network models. Furthermore, Siami Namini et al. (2018) also proved that the LSTM-based model reduced the error rates and improved the prediction by 85% compared to ARIMA [27].
As proven by many scholars, deep-learning-based models have greater predictive power than regression or time-series models that use conventional statistical methods. In particular, the predictive power of the LSTM model has been validated in many studies, although most of these were limited to discussions of the time unit and prediction of real estate prices and traffic volumes, and they failed to discuss the space unit alongside the time unit.
3. Literature Gaps and Research Objective
This research is distinctive from other studies related to commercial building closure and vacancy in three ways.
First, due to difficulty in securing data, most previous studies analyzed changes in commercial districts and the real estate market across an entire region from a macroscopic perspective. In this study, we constructed more accurate and detailed data of more than 2,940,000 individual commercial stores in terms of closure date, rent, and sales for each commercial building, and we analyzed the trends and impacts of vacancies in a more precise manner.
Second, this study used vacancy data that directly showed the decline of commercial districts for analyzing vacancy trends and causes, instead of using business closures or survival rates. In doing so, we identified declining commercial districts and established a foundation for policy suggestions. Most studies related to commercial districts have analyzed closure rates or survival rates to identify the decline or growth of a commercial district based on their findings. However, high closure rates and short business longevity do not necessarily indicate a stagnant economy. The closure rate of businesses within a growing commercial district is likely to be high because rent prices rise rapidly, and the competition to enter a growing commercial district is higher than for one that is in decline. Thus, a business of a certain type or size that can afford higher rent would quickly replace existing businesses. For this reason, we analyzed the risk that a commercial district was facing decline and derived factors using commercial vacancy rates to accurately survey the market’s economic condition.
Third, we used time-series data to analyze changing trends in commercial districts and predicted commercial vacancy rates. As for previous studies related to closure and vacancy, most studies have analyzed the survival rate of commercial buildings over a certain time frame and the cause of closures. Even though studies using the Kaplan–Meier method and the Cox proportional hazards model have analyzed past trends and proposed future policy on that basis, baseline data have limited applicability for predicting declining commercial districts in the future and establishing more adequate countermeasures. For this reason, this study aimed to examine the time-series trend and predict the pattern of commercial vacancy rates using a deep-learning-based prediction model to provide more realistic and futuristic baseline data for policymaking.
Therefore, the primary objectives of this research were two-fold: (1) to examine the LSTM as a feasible option for predicting vacancy patterns of commercial districts and (2) to identify the influence of each variable on prediction results for understanding both causes and consequences of the pattern dynamics and establishing evidence-based decision-making on the primary effects of vacancy. Considering that the closure rate of small businesses is steadily growing, it is critical to analyze and identify the cause of vacancy in each commercial district and forecast vacancy rates accurately for establishing optimal countermeasures.
4. Data and Methods
4.1. Study Area and Commercial Vacancy Data
This study used the city of Seoul in Korea as its study area. We constructed vacancy data for analysis based on information about the opening and closure of over 2,940,000 stores according to the Seoul Credit Guarantee Foundation. To directly reflect the COVID-19 pandemic and achieve a more realistic estimation of vacancy rates, we used data from the first half of 2019 to the first half of 2020, including January 2020 (when the first COVID-19 patient was reported in Korea) and estimated vacancy rates for the second half of 2020.
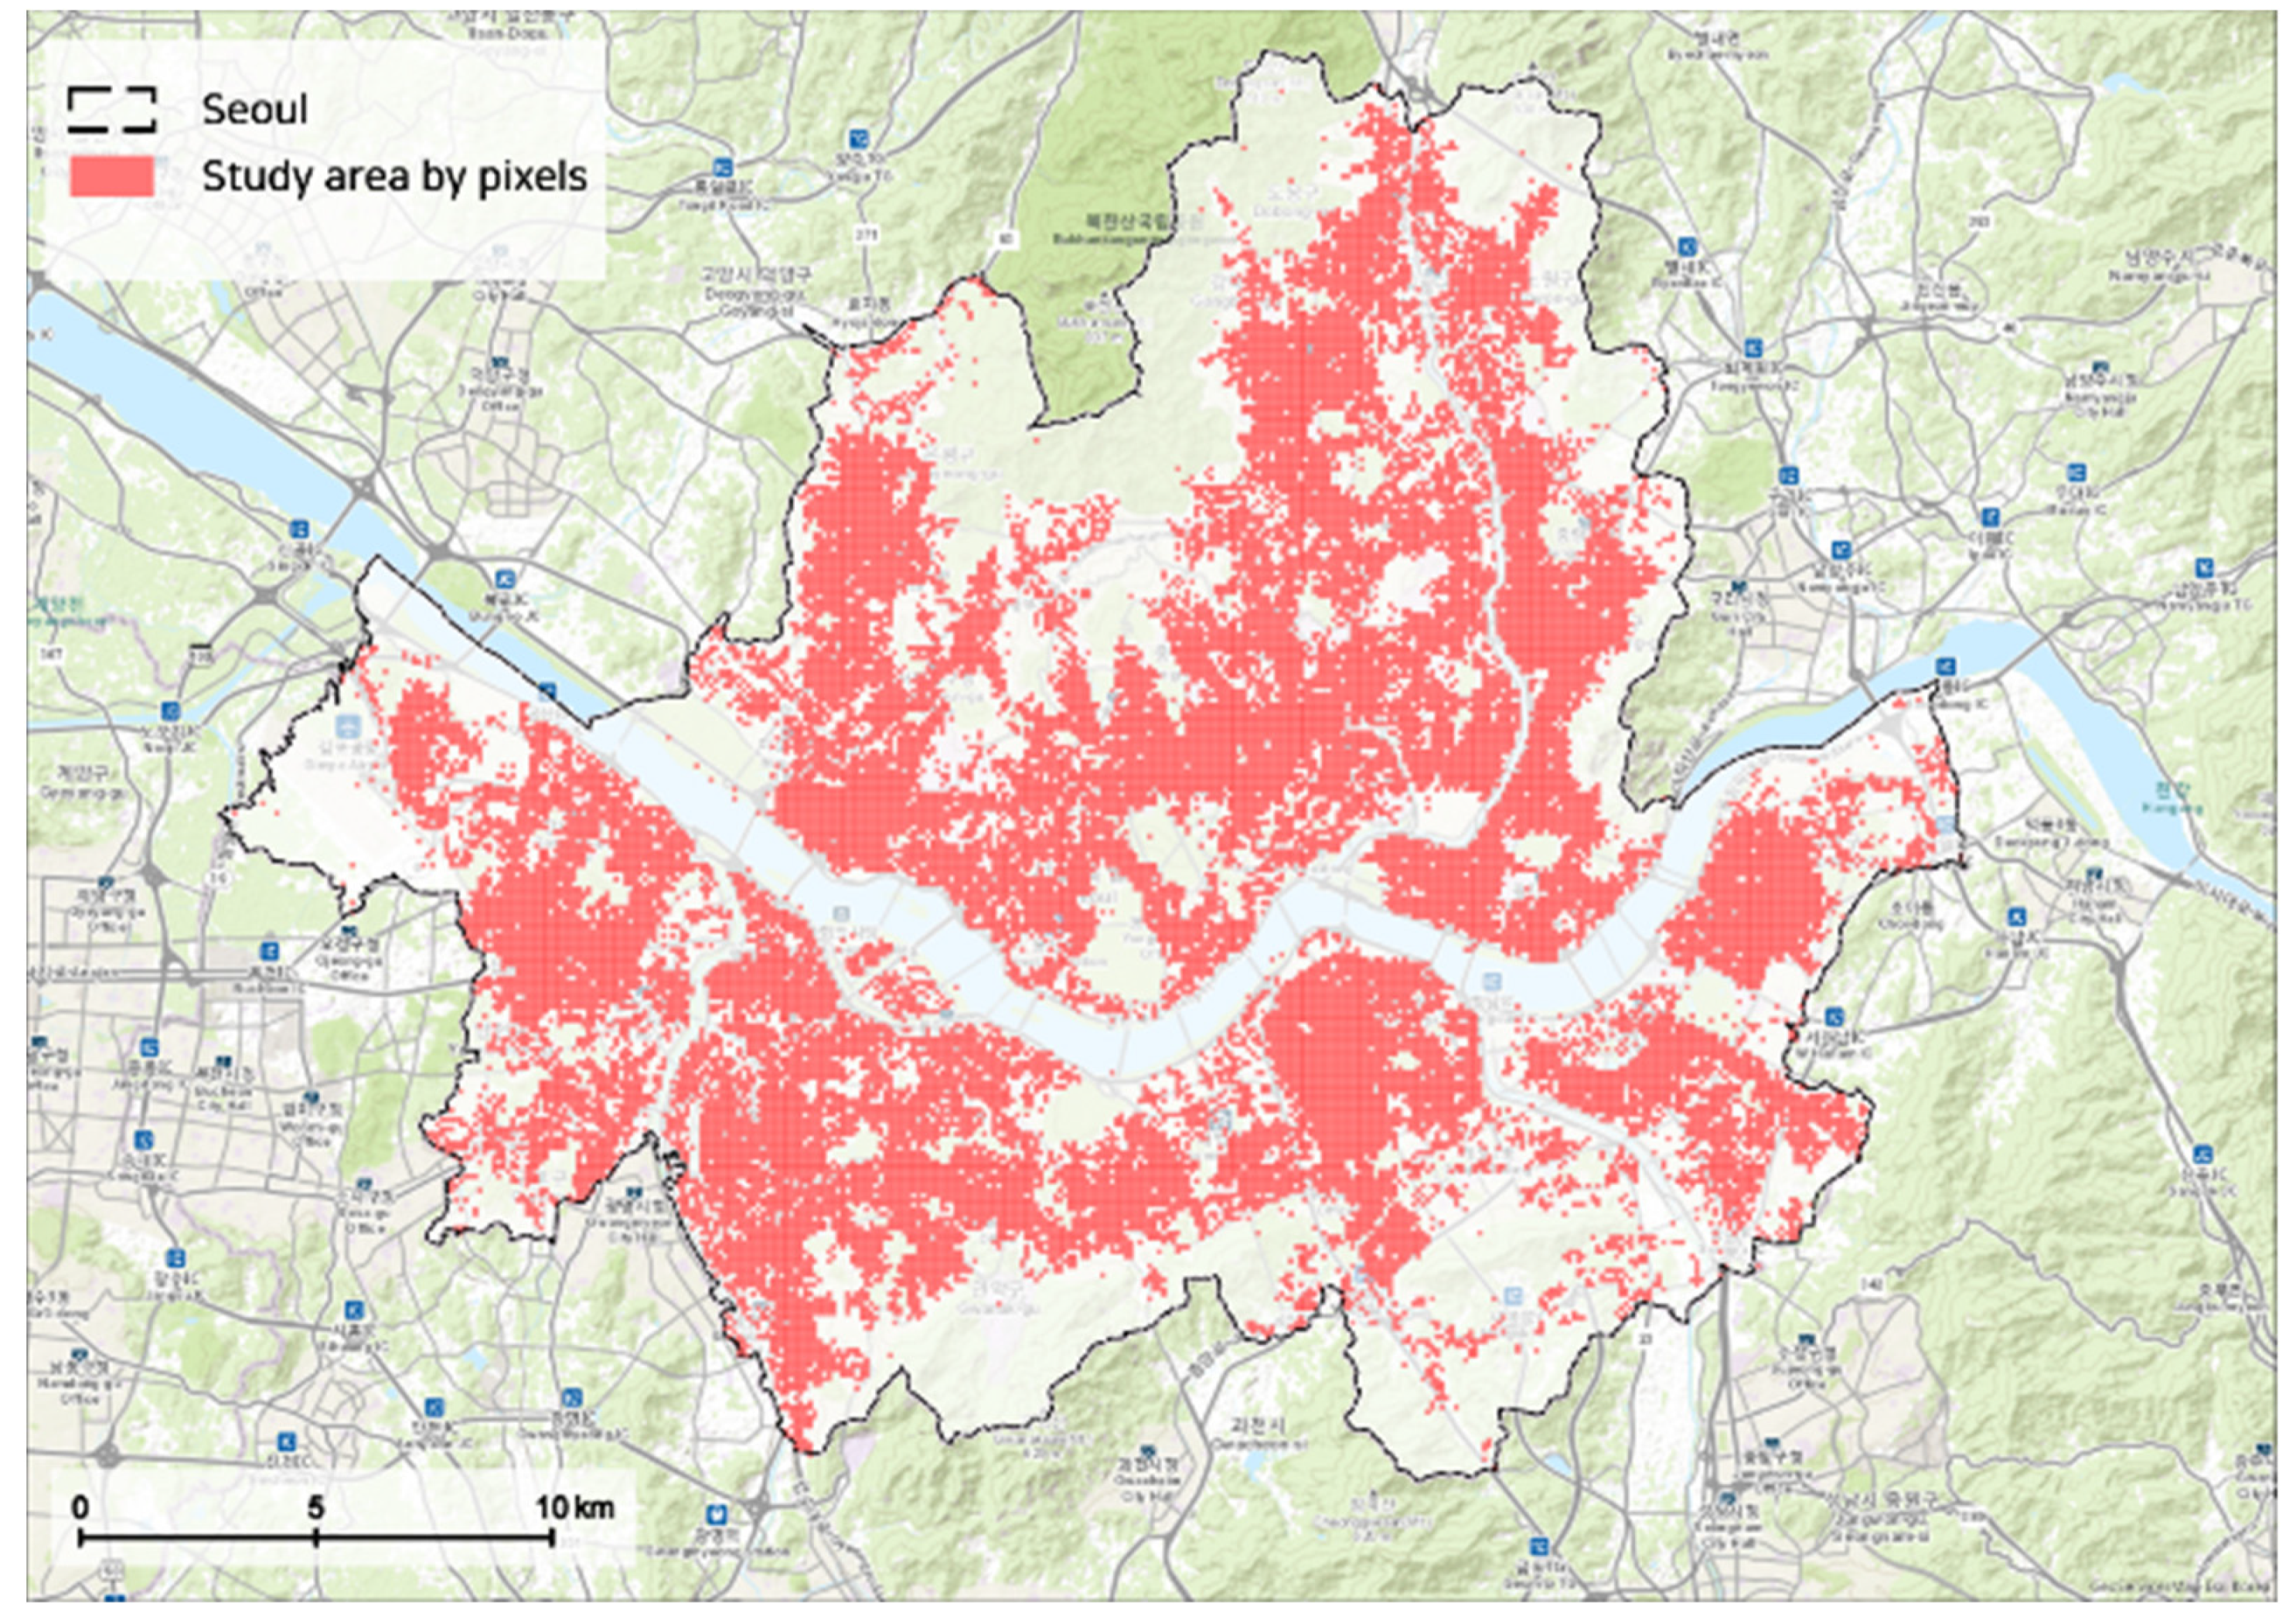
To implement the LSTM-based prediction model, we pixelated the commercial vacancy data on each building and set up a 100 m × 100 m grid as the analysis unit by taking the computer’s performance and Seoul’s area into consideration. After dividing the entire area into 63,972 grids and excluding grids with no commercial buildings due to topography (river, mountain, vacant property, military base), we used 26,937 grids to predict future commercial vacancy rates and analyze the determinant factors (Figure 2).
For analysis, we used information on the opening and closure of 2,940,000 individual commercial facilities from the Seoul Credit Guarantee Foundation and calculated commercial vacancy rates in four stages by:
- (1)
- Analyzing of the number of businesses in each commercial building.
- (2)
- Calculating the total number of vacant stores in each commercial building by month, based on opening and closure data.
- (3)
- Spatializing the commercial building data (vacancy, sales, rent, etc.) by 26,937 pixels.
- (4)
- Calculating the semi-annual commercial vacancy rate:
As shown in Table 1, the average commercial vacancy rate in Seoul from the first half of 2019 to the first half of 2020 increased from 6.56% to 7.94%. Due to unstable market conditions related to COVID-19, this increased by 0.9% in the first half of 2020, compared to the second half of 2019.
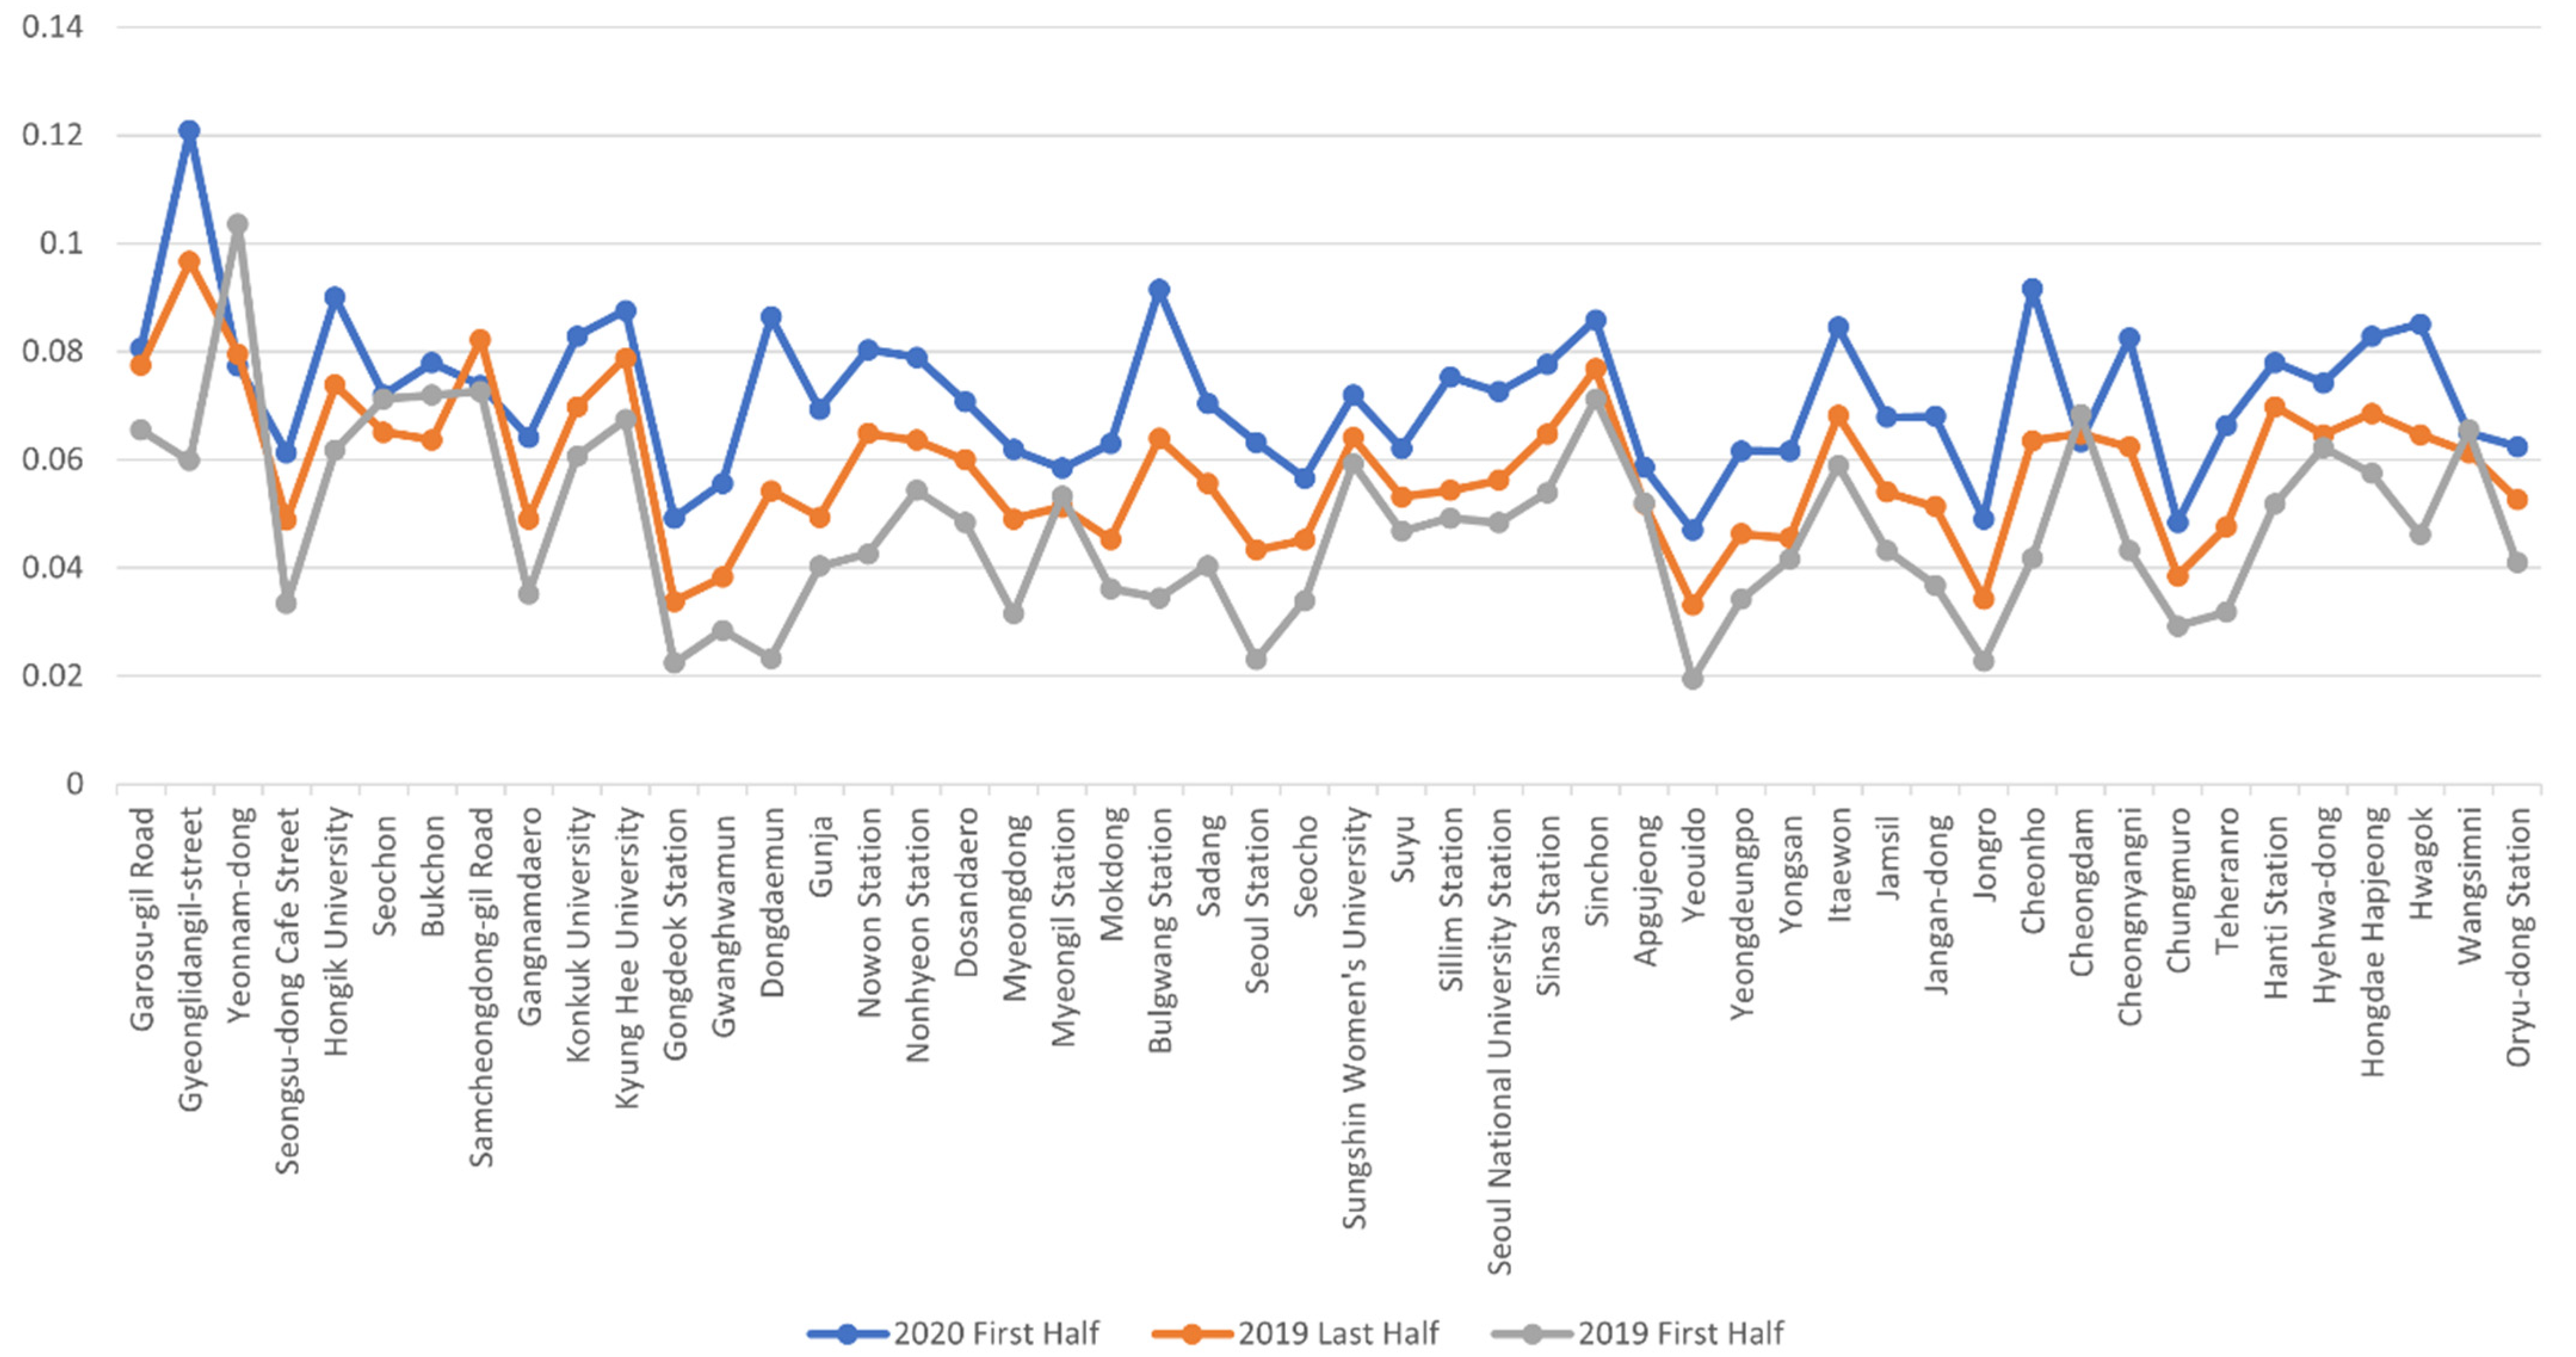
Nonetheless, considering floating population and store sales, the vacancy rate during the first half of 2020 was not as high as expected. This can be interpreted as a result of the economic policy that had been implemented during the first half of 2020 in the form of an emergency relief fund. It is also possible that some business owners did not report closures to avoid loss of premium on their store at the time of closing. If the government does not offer sufficient funding to support small business owners, commercial building closure and vacancy rates are expected to increase rapidly in 2021. Moreover, an analysis of the vacancy rates for 50 major commercial districts in Seoul, based on a calculation of the commercial vacancy rate of each building, clearly showed a trend of increasing vacancy rates in 43 (86%) commercial districts (Figure 3).
4.2. Variables
Since the prediction results can differ significantly by the variable selection, the causal mechanism contributing to commercial vacancy was identified based on a literature review. We then derived nine variables and conducted an analysis by considering the availability of data and Seoul’s regional characteristics. The primary causes were classified into three categories: (1) individual structure factor [9,28,29,30], (2) location factor [31,32,33], and (3) local economic factor [3,28,29,34,35] (Table 2). Of the nine variables, we used four from data on individual commercial buildings from the Seoul Credit Guarantee Foundation, except for de facto population and floating population. As for de facto population, floating population, and survival rate (new business and total), we used a block unit, which was the smallest of the available data units. After preprocessing the vacancy rate data and factor variable data, we reprocessed them into units of 100 m × 100 m pixels.
The vacancy rate is an index showing the relative ratio of supply and demand, and rent and sales are typically noted as the primary cause of vacancy and closure [4,9,34,36]. Rental prices consist of deposits and monthly rent, so collecting accurate data is difficult. For this reason, most previous studies have used official land value data as a proxy variable on the premise that increased rent leads to an increase in land and housing prices. However, we secured the rental data from the Seoul Credit Guarantee Foundation and used these for analysis. To calculate rent conversion based on deposit and monthly rent, we applied 12%, which is the conversion rate of the average monthly rent in Seoul. The conversion formula was as follows:
Rent conversion = (deposit × 12%)/12 months + monthly rent
For sales data, we used sales data for each business according to the Seoul Credit Guarantee Foundation. The analysis showed that each business’s sales increased by 7.4% from 74,015,000 KRW ($65,382) during the first half of 2019 to 79,519,000 KRW ($70,244) during the first half of 2020. In particular, in commercial districts with a high density of floating population and de facto population such as Gangnam-daero and Seoul Station, sales were found to be high. Subsequently, the model assumed that high rent and low population density would be affected by an increase in commercial vacancies.
Furthermore, commercial districts with a large percentage of franchises are more likely to have potential renters who are willing to pay higher rent for a longer period than small business owners. Because large-size buildings are generally used for the franchises of large corporations, it was assumed that a higher ratio of large-size buildings and franchises indicated an increase in commercial vacancies.
Lastly, business survival rate was also used as an influencing factor for vacancy because it also reflects market stability and economic conditions. Survival refers to continuous business operation without closure from the start to a certain point in time. The survival rate of businesses by year increased by 1.6%, from 73.9% during the first half of 2019 to 75.5% during the first half of 2020. Meanwhile, in commercial districts where gentrification has been increasing, such as Itaewon and Hongdae, the survival rate was found to be low. This model assumed that a low business survival rate would result in increased commercial vacancies.
4.3. Methods
This study aimed to analyze commercial vacancy rate patterns and influencing factors using a more detailed unit of analysis. It also aimed to predict the commercial vacancy rate for the second half of 2020. Most studies about commercial vacancy and survival rates have focused on identifying the factors influencing businesses’ survival within a commercial district using the Cox proportional hazards model and Kaplan–Meier model. Despite the statistical merits of the regression model, there are several issues, namely assumptions on equal variance, independence, and normality; the problem of multicollinearity; and the problem of reacting sensitively to singular values.
For this reason, we developed a prediction model based on a neural network to overcome the limitations of statistics-based prediction models with strict statistical assumptions that have difficulty reflecting the changes in complex environmental variables or sensitive situations. By contrast, a deep-learning model can be interpreted even when an input variable is incomplete and there are wide fluctuations. It can be applied to a small or irregular data set. In particular, LSTM-based prediction models are proven to have excellent predictive power in time-series analysis as they are made to remember previous inputs more efficiently than regular RNN [37,38]. For this reason, we selected LSTM as a learning algorithm.
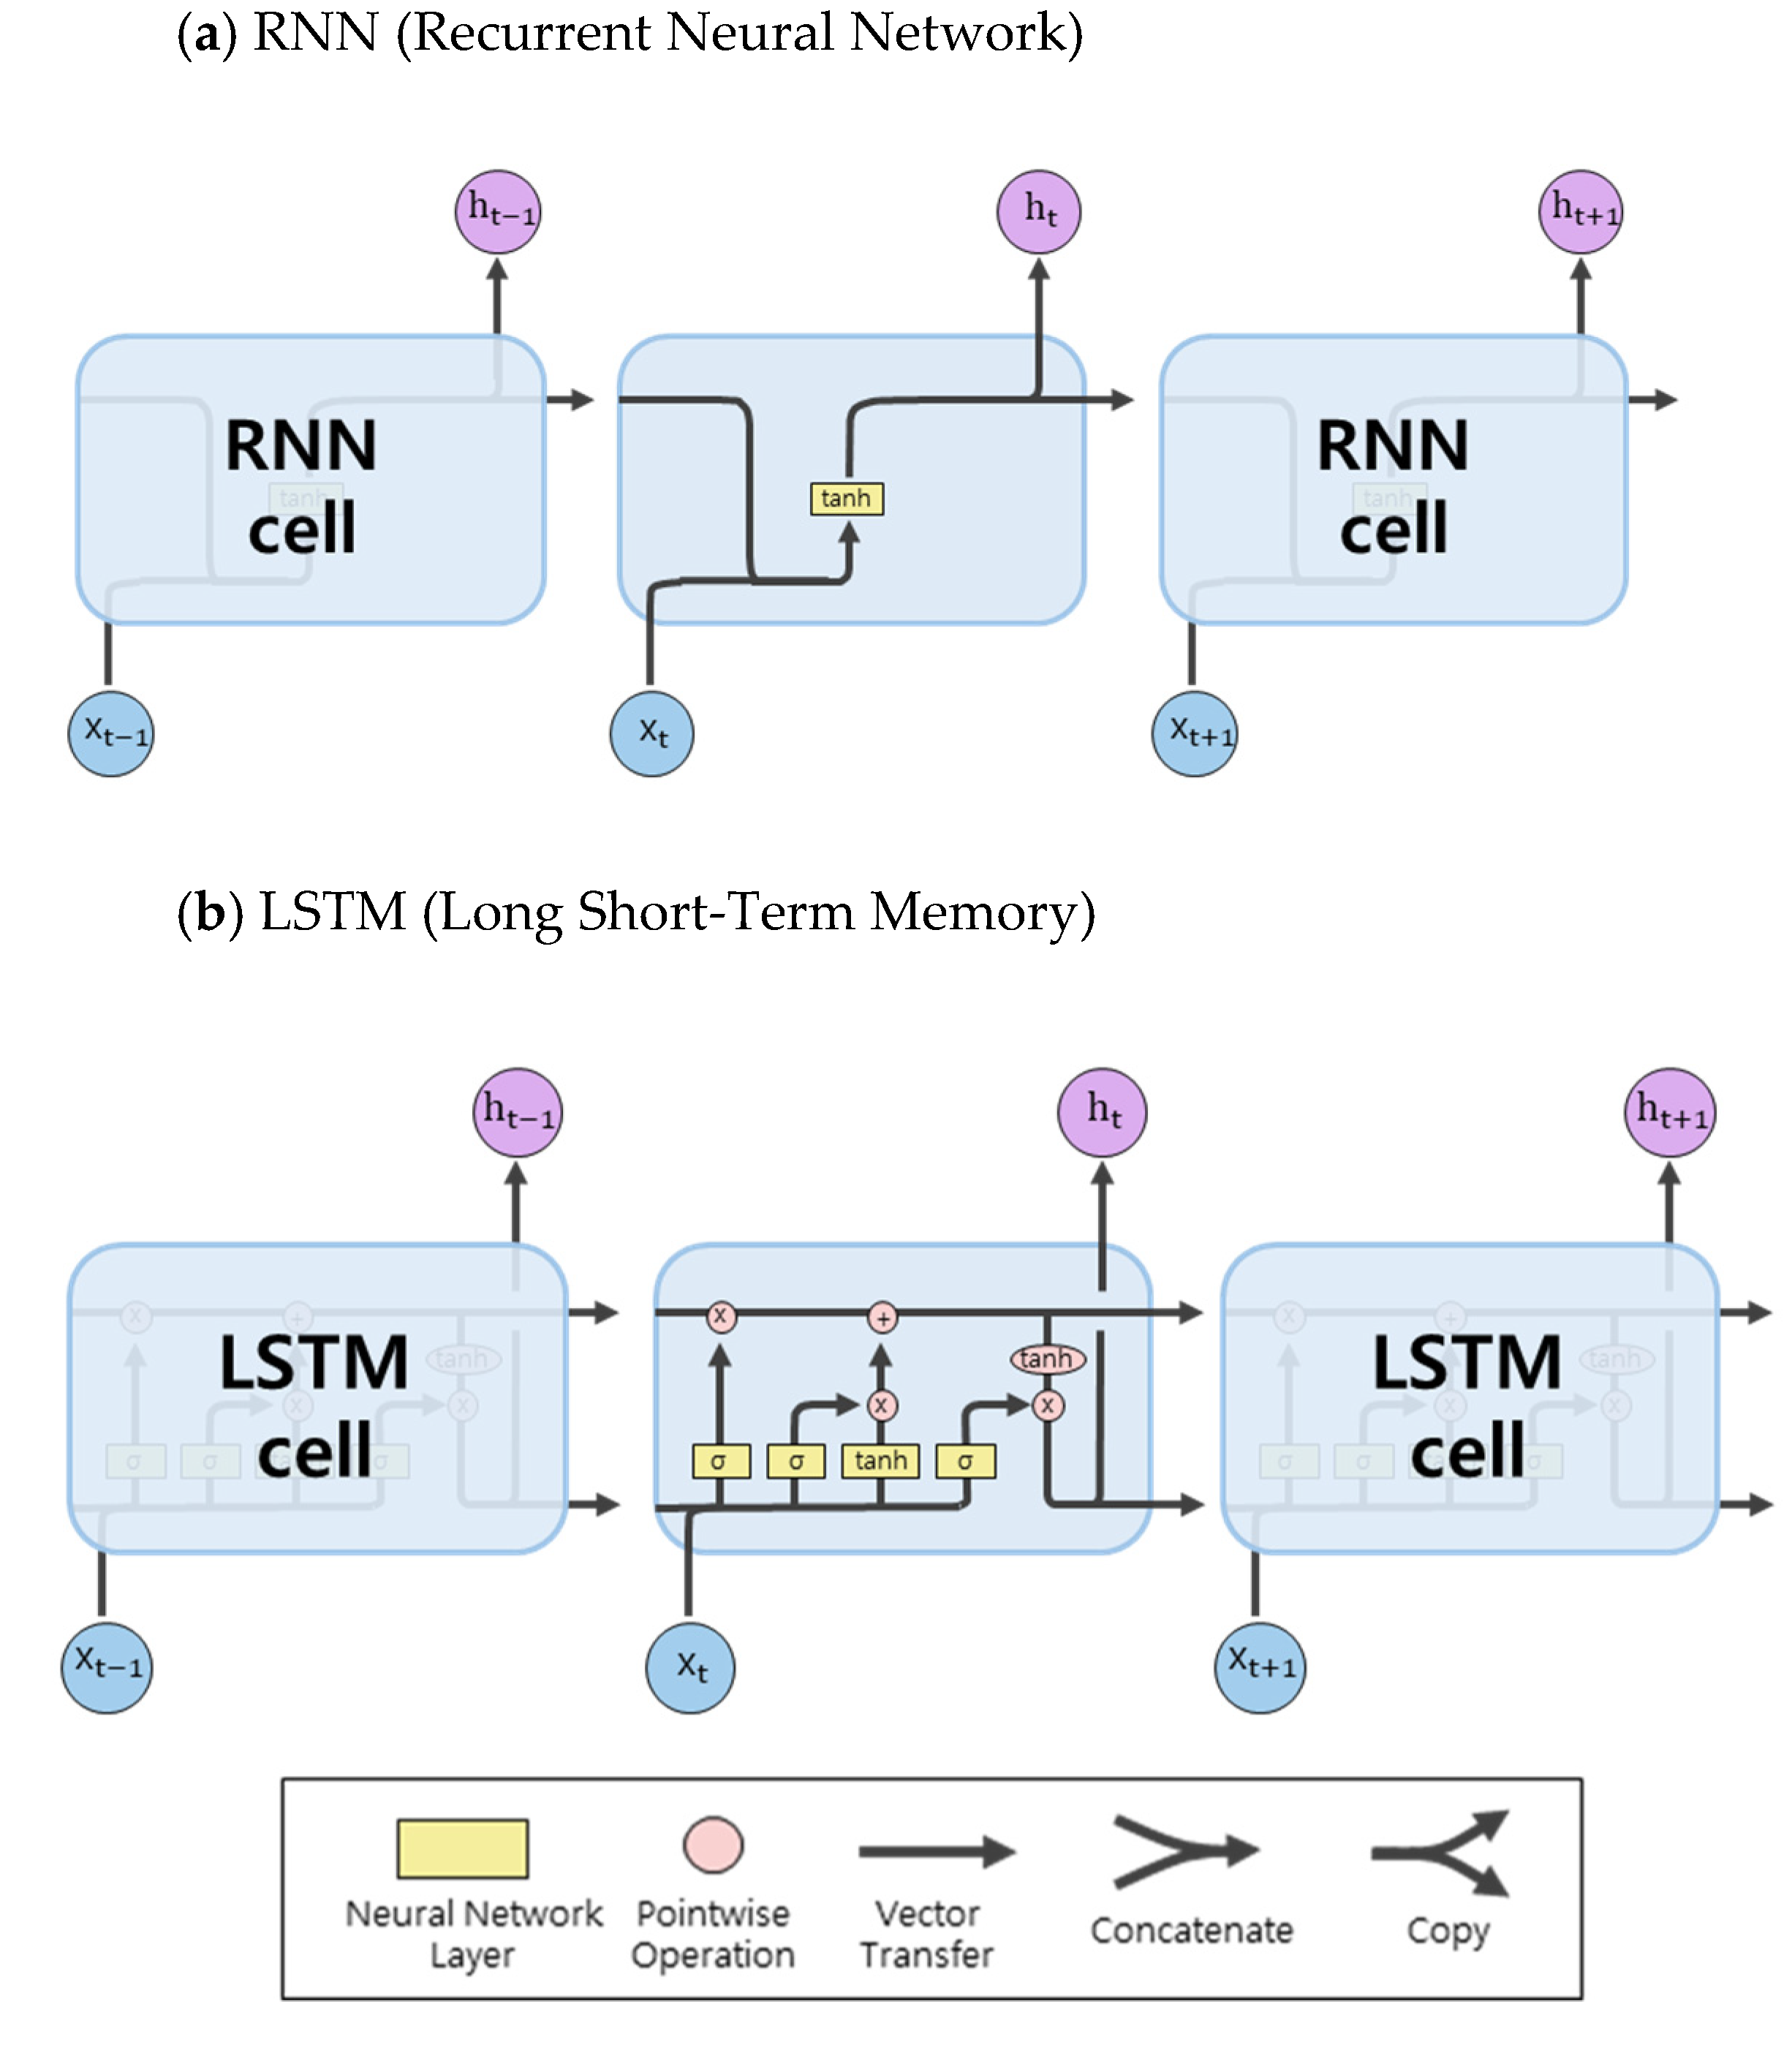
Among various deep-learning-based prediction models, RNN resolves issues with traditional neural networks and learns previous inputs by considering temporal sequence. Traditional neural networks such as the convolutional neural network (CNN) and artificial neural network (ANN) fail to sufficiently reflect the correlation with previous inputs and lack consistency. When pertinent information is distant from the point where the information is used in time-series data analysis, RNN has a vanishing gradient problem, which significantly reduces learning ability [39,40]. To overcome long-term dependencies of RNN, LSTM was proposed. All RNNs have a recurrent neural network module in the form of a chain, and the structure exists in a simple form. Although LSTM has the same structure, the internal recurrent module has a different structure (Figure 4). As shown in Figure 4b, LSTM is a particular network structure with three “gates.” These gates in LSTM play a crucial role in selectively influencing the information at each point in time. In a fully connected network that uses the sigmoid activation function (with output between 0 and 1), all information is delivered when the gate is open (sigmoid output = 1), and no information is delivered when the gate is closed (sigmoid output = 0) [41,42]. However, because some studies reveal that LSTM might not extract the nonlinear characteristics of data, the size of the dataset should be monitored [43].
Since LSTM delivers outstanding performance in processing time-series data inputs based on this structure and process, LSTM was used for prediction as it can learn time-series data without any losses.
5. Results
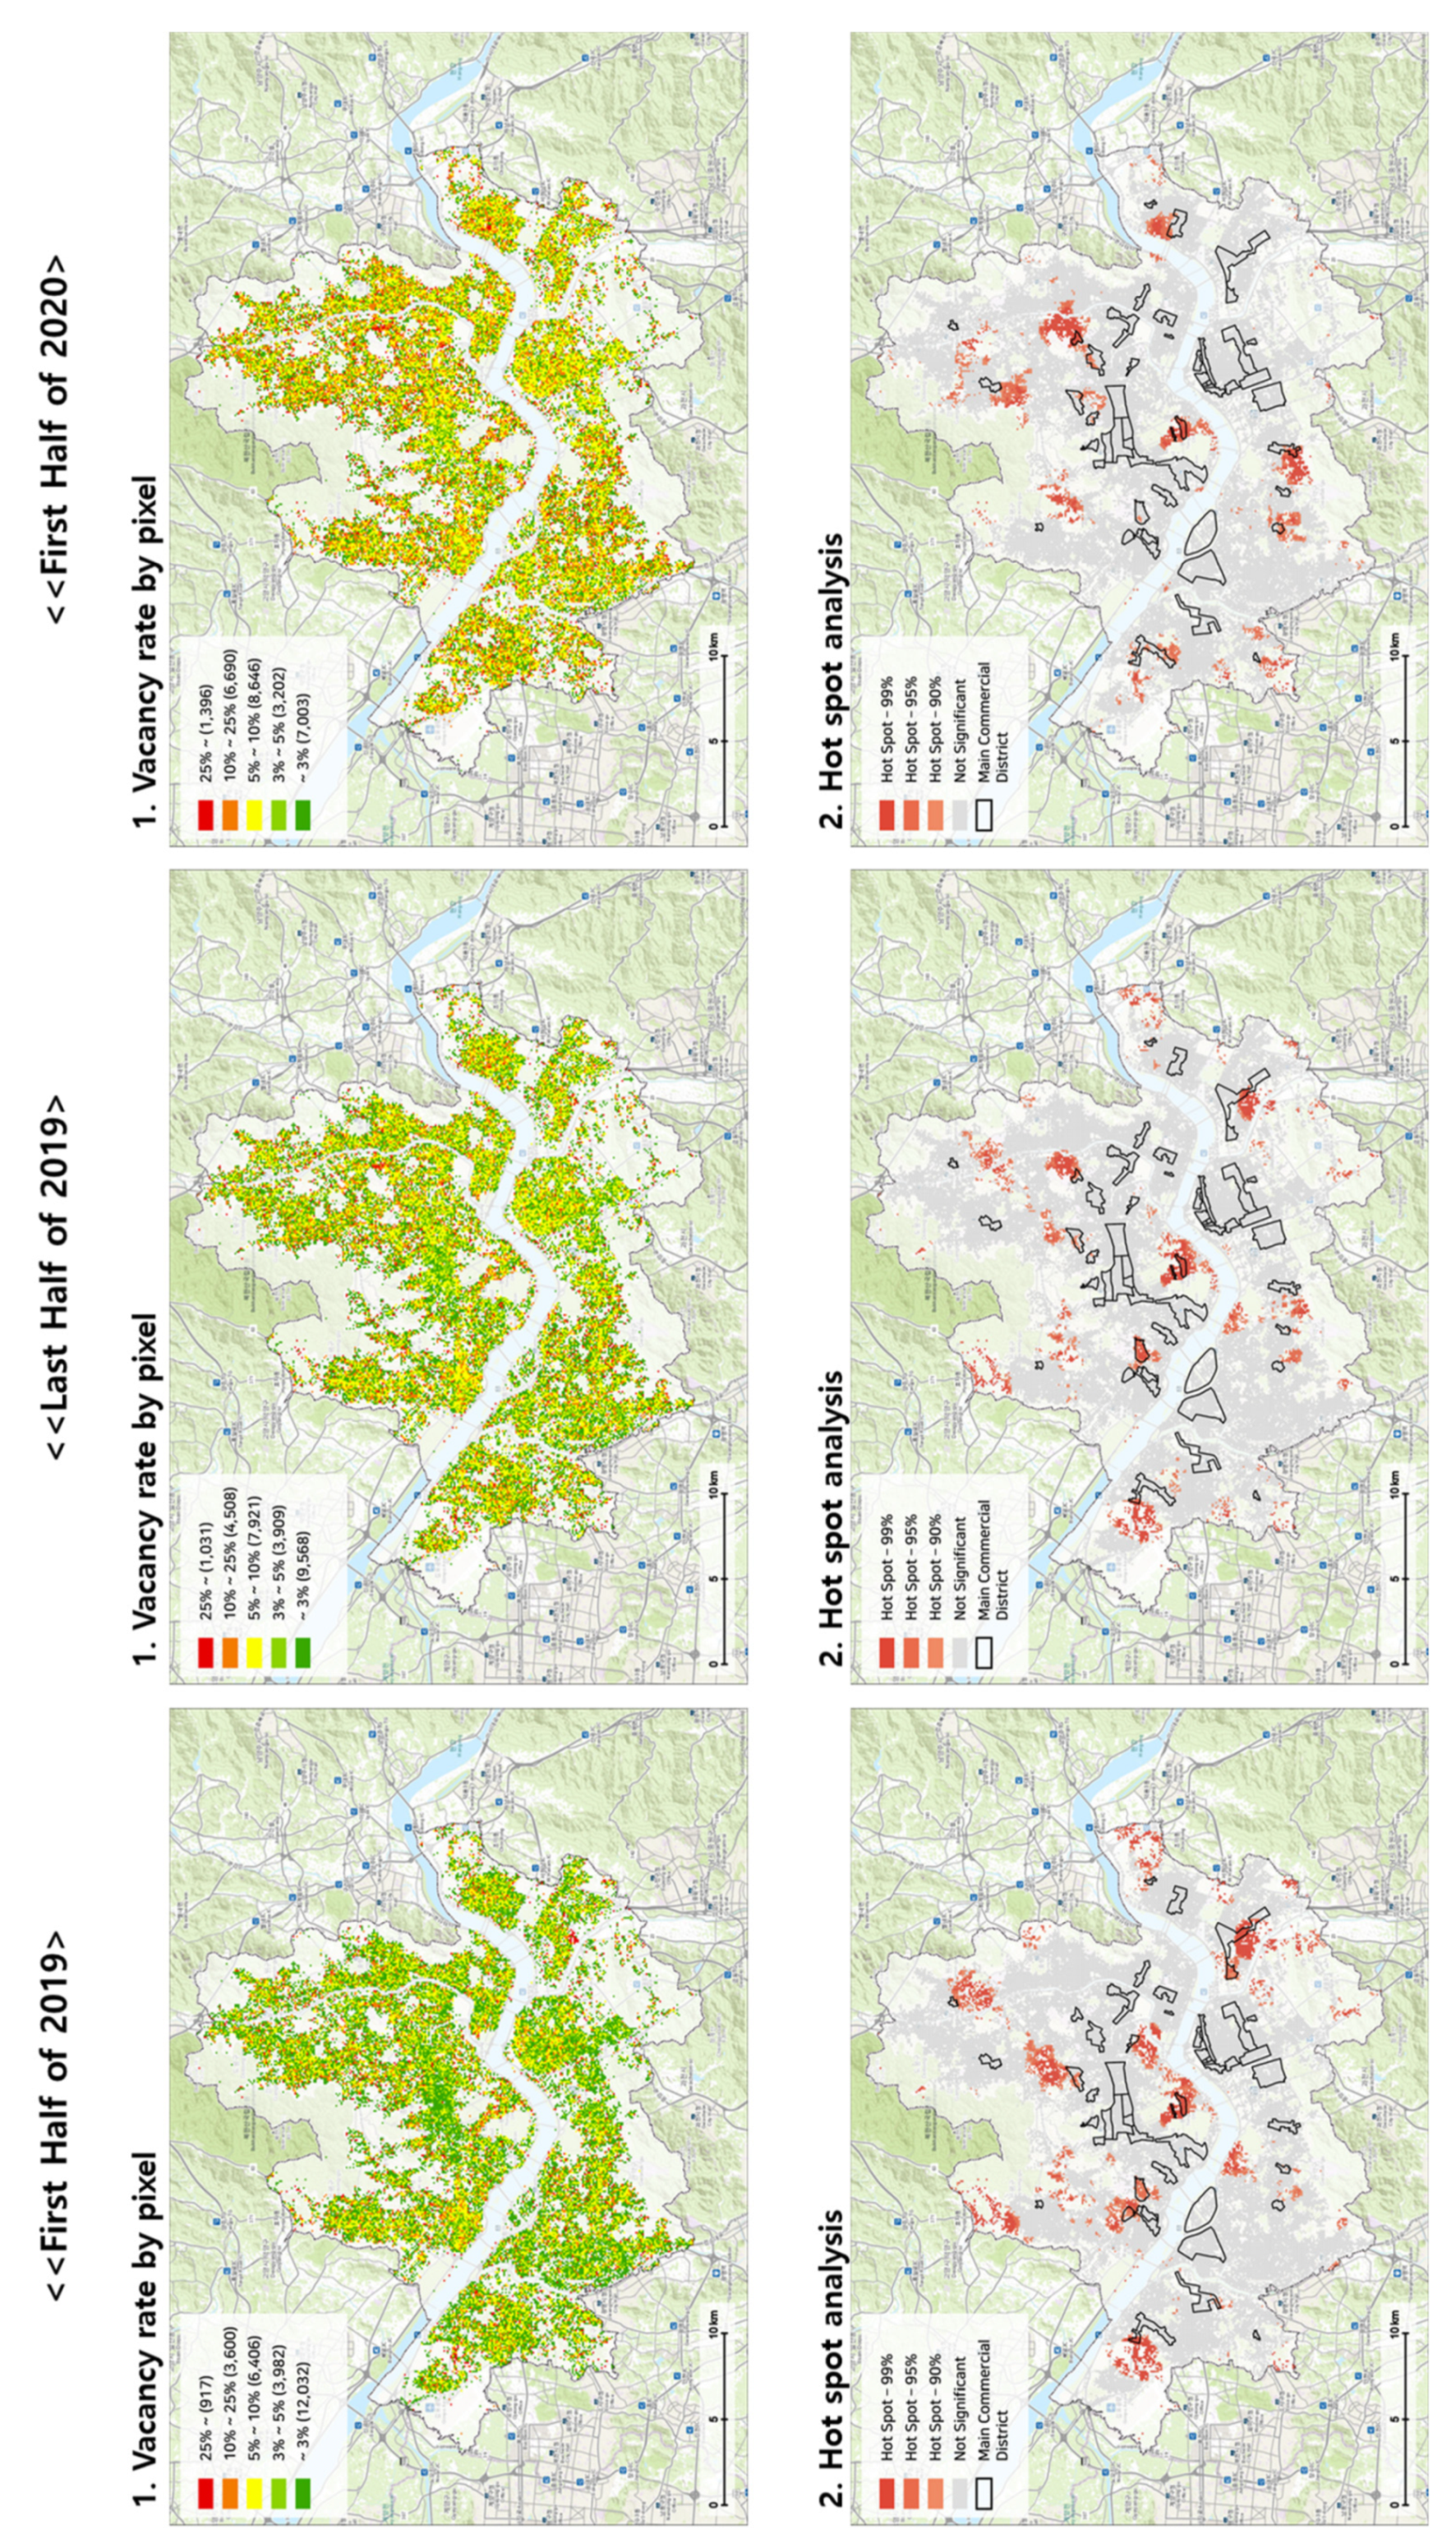
Before forecasting commercial vacancy rate, we examined the data by analyzing basic statistics of variables used in constructing an RNN-based LSTM model (Table 3). The vacancy rate increased by about 21% from 6.56% during the first half of 2019 to 7.94% during the first half of 2020. Hot spot analysis was also conducted to identify the spatial distribution of risk areas (Figure 5). This analysis showed a high vacancy rate in the commercial districts centering on Itaewon, where gentrification has been intensifying since the mid-2010s. In addition, the percentage of 100 m × 100 m pixels with a vacancy rate of 25% or higher steadily increased from 917 during the first half of 2019 to 1396 during the first half of 2020.
As the vacancy rate increased during the last three quarters, the franchise ratio also increased. During the first half of 2020, when the COVID-19 pandemic began to worsen, gross sales per business decreased by about 3.5%, compared with the second half of 2019. This may be attributed to the characteristics of franchises, which are less affected by economic recession, such as that caused by the pandemic, than other small businesses. Steadily increasing rental prices, despite declining sales and de facto population, are likely to affect future increases in vacancy rate.
In this study, an LSTM-based prediction model was constructed in three stages using nine variables that affect commercial vacancy. First, we validated the accuracy of the LSTM-based prediction model by comparing the actual commercial vacancy rate during the first half of 2020 with the estimated commercial vacancy rate for the first half of 2020. Second, the commercial vacancy rate for the second half of 2020 was forecast, and the vacancy risk areas were derived through hot spot analysis. Finally, the influence of the variables affecting the commercial vacancy rate was quantified for Seoul by scrutinizing the influence of the nine variables used in the analysis.
5.1. LSTM Output Statistics: Validation
Throughout the process of model construction, learning, and prediction, we used TensorFlow, a Python-based deep-learning framework. Before forecasting, we examined the reliability of the model. Analyzing the accuracy of visual data purely based on spatial data has limitations, so we used two indices (mean absolute error, root mean squared error) to analyze the model’s performance objectively. The formulas are as follows:
Using the above formulas, we presented a more efficient model for predicting the vacancy rate by comparing the actual commercial vacancy rate in the first half of 2020 with an estimated vacancy rate derived through the deep-learning model. To construct an optimal model, we set up the algorithm to derive root mean squared error (RMSE) and mean absolute error (MAE) values for every 1000th training session and validated the prediction accuracy. MAE and RMSE values closer to 0 indicated smaller disparity between estimated and actual values; hence, there was higher accuracy in the prediction model. As shown in Table 4, the iteration for MAE and RMSE showed that several training sessions (epochs) was followed by decreasing tendency and improved accuracy. Because there was no significant change in statistical values after 20,000 epochs, we set the number of model training sessions to be 20,000, to avoid the over-fitting issue. When the number of epochs was set at 20,000, MAE was 0.005, and RMSE was 0.009. Compared to the actual average vacancy rate from the first half of 2020 (7.94%), it derived 93.7% accuracy with 6.3% error.
5.2. Possible Scenario of Vacancy Patterns by the Second Half of 2020
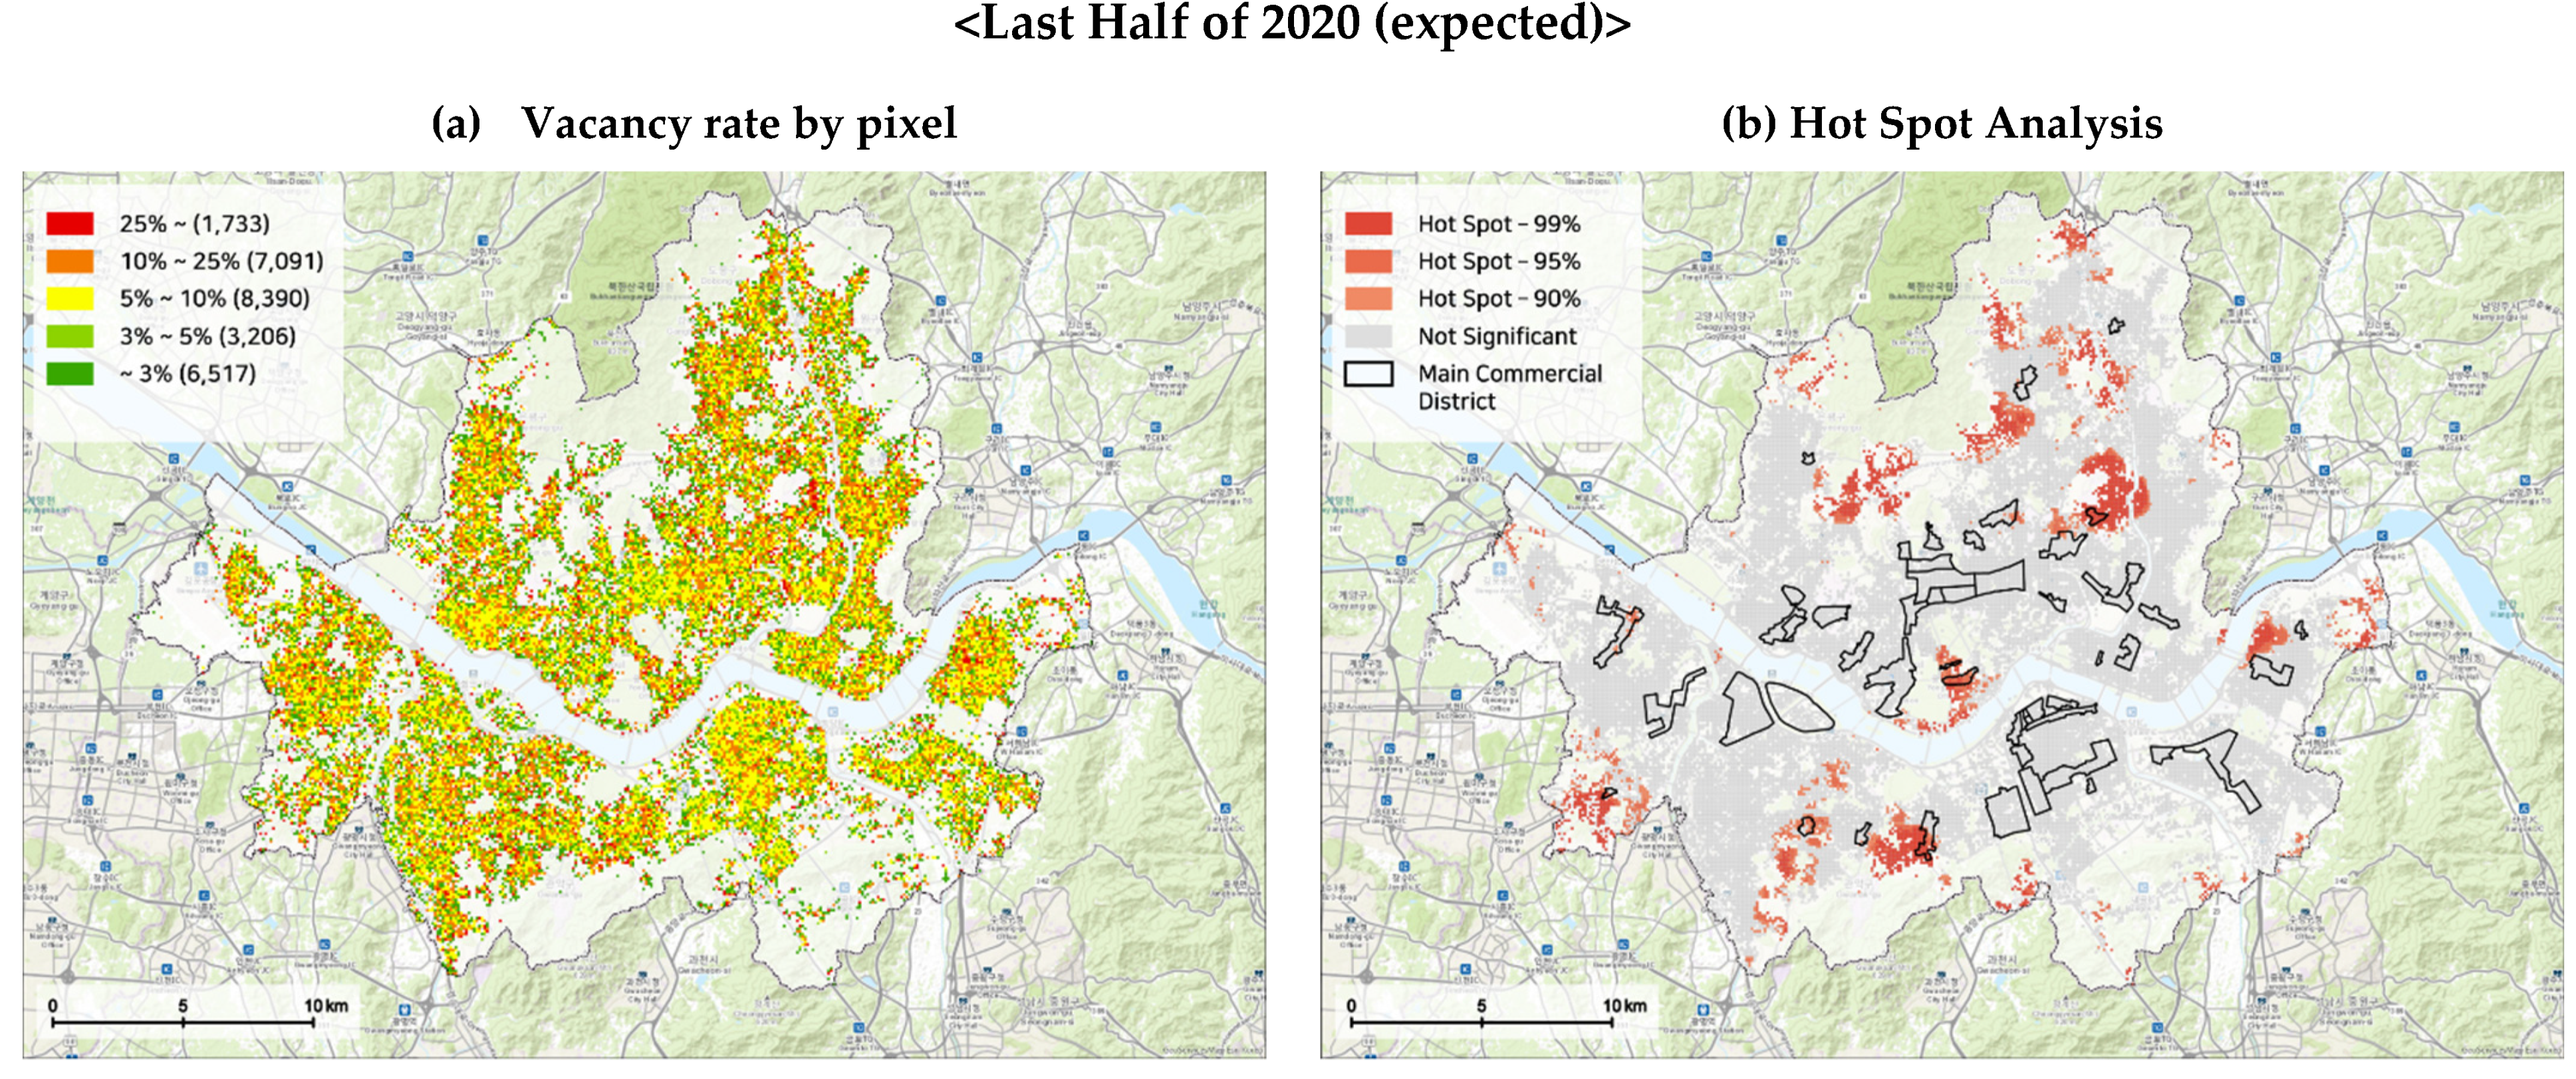
After verifying the reliability of the model through the above process, we estimated the average commercial vacancy rate in Seoul in the second half of 2020 based on the prediction model developed in this study. It was estimated to be 9.67% and forecast to increase by 47.4%, compared with the first half of 2019 (Table 5). In addition, over 37% of pixels were estimated to have a minimum vacancy rate of 10%; the pixels with a 25% vacancy rate or higher were estimated to have doubled, compared with the first half of 2019 (Figure 6a). This study examined the spatial distribution of the predicted results through hot spot analysis (Figure 6b). This analysis showed that vacancies are likely to increase in commercial districts centering on college campuses (①) and secondary industries such as manufacturing businesses in the southwest region (②, ③) during the second half of 2020. Both the commercial districts around college campuses and manufacturing businesses have been adversely affected by the COVID-19 pandemic. As for the commercial districts around college campuses, the main cause of decline was the change in teaching by most universities in Seoul to non-face-to-face courses during the first half of 2020. Due to a decrease in the number of students in the commercial district around college campuses, the decline in floating population and sales-led commercial vacancy escalated. As for the commercial districts around manufacturing businesses, individual telecommuting was not possible because of the nature of the industry. The occurrence of a COVID-19 case often leads to group transmission within the surrounding area, which ultimately caused the operation rate to decline by up to 72.8%. It is believed that such worsening financial conditions have led to the closure of manufacturing businesses and resulted in increased commercial vacancy rates.
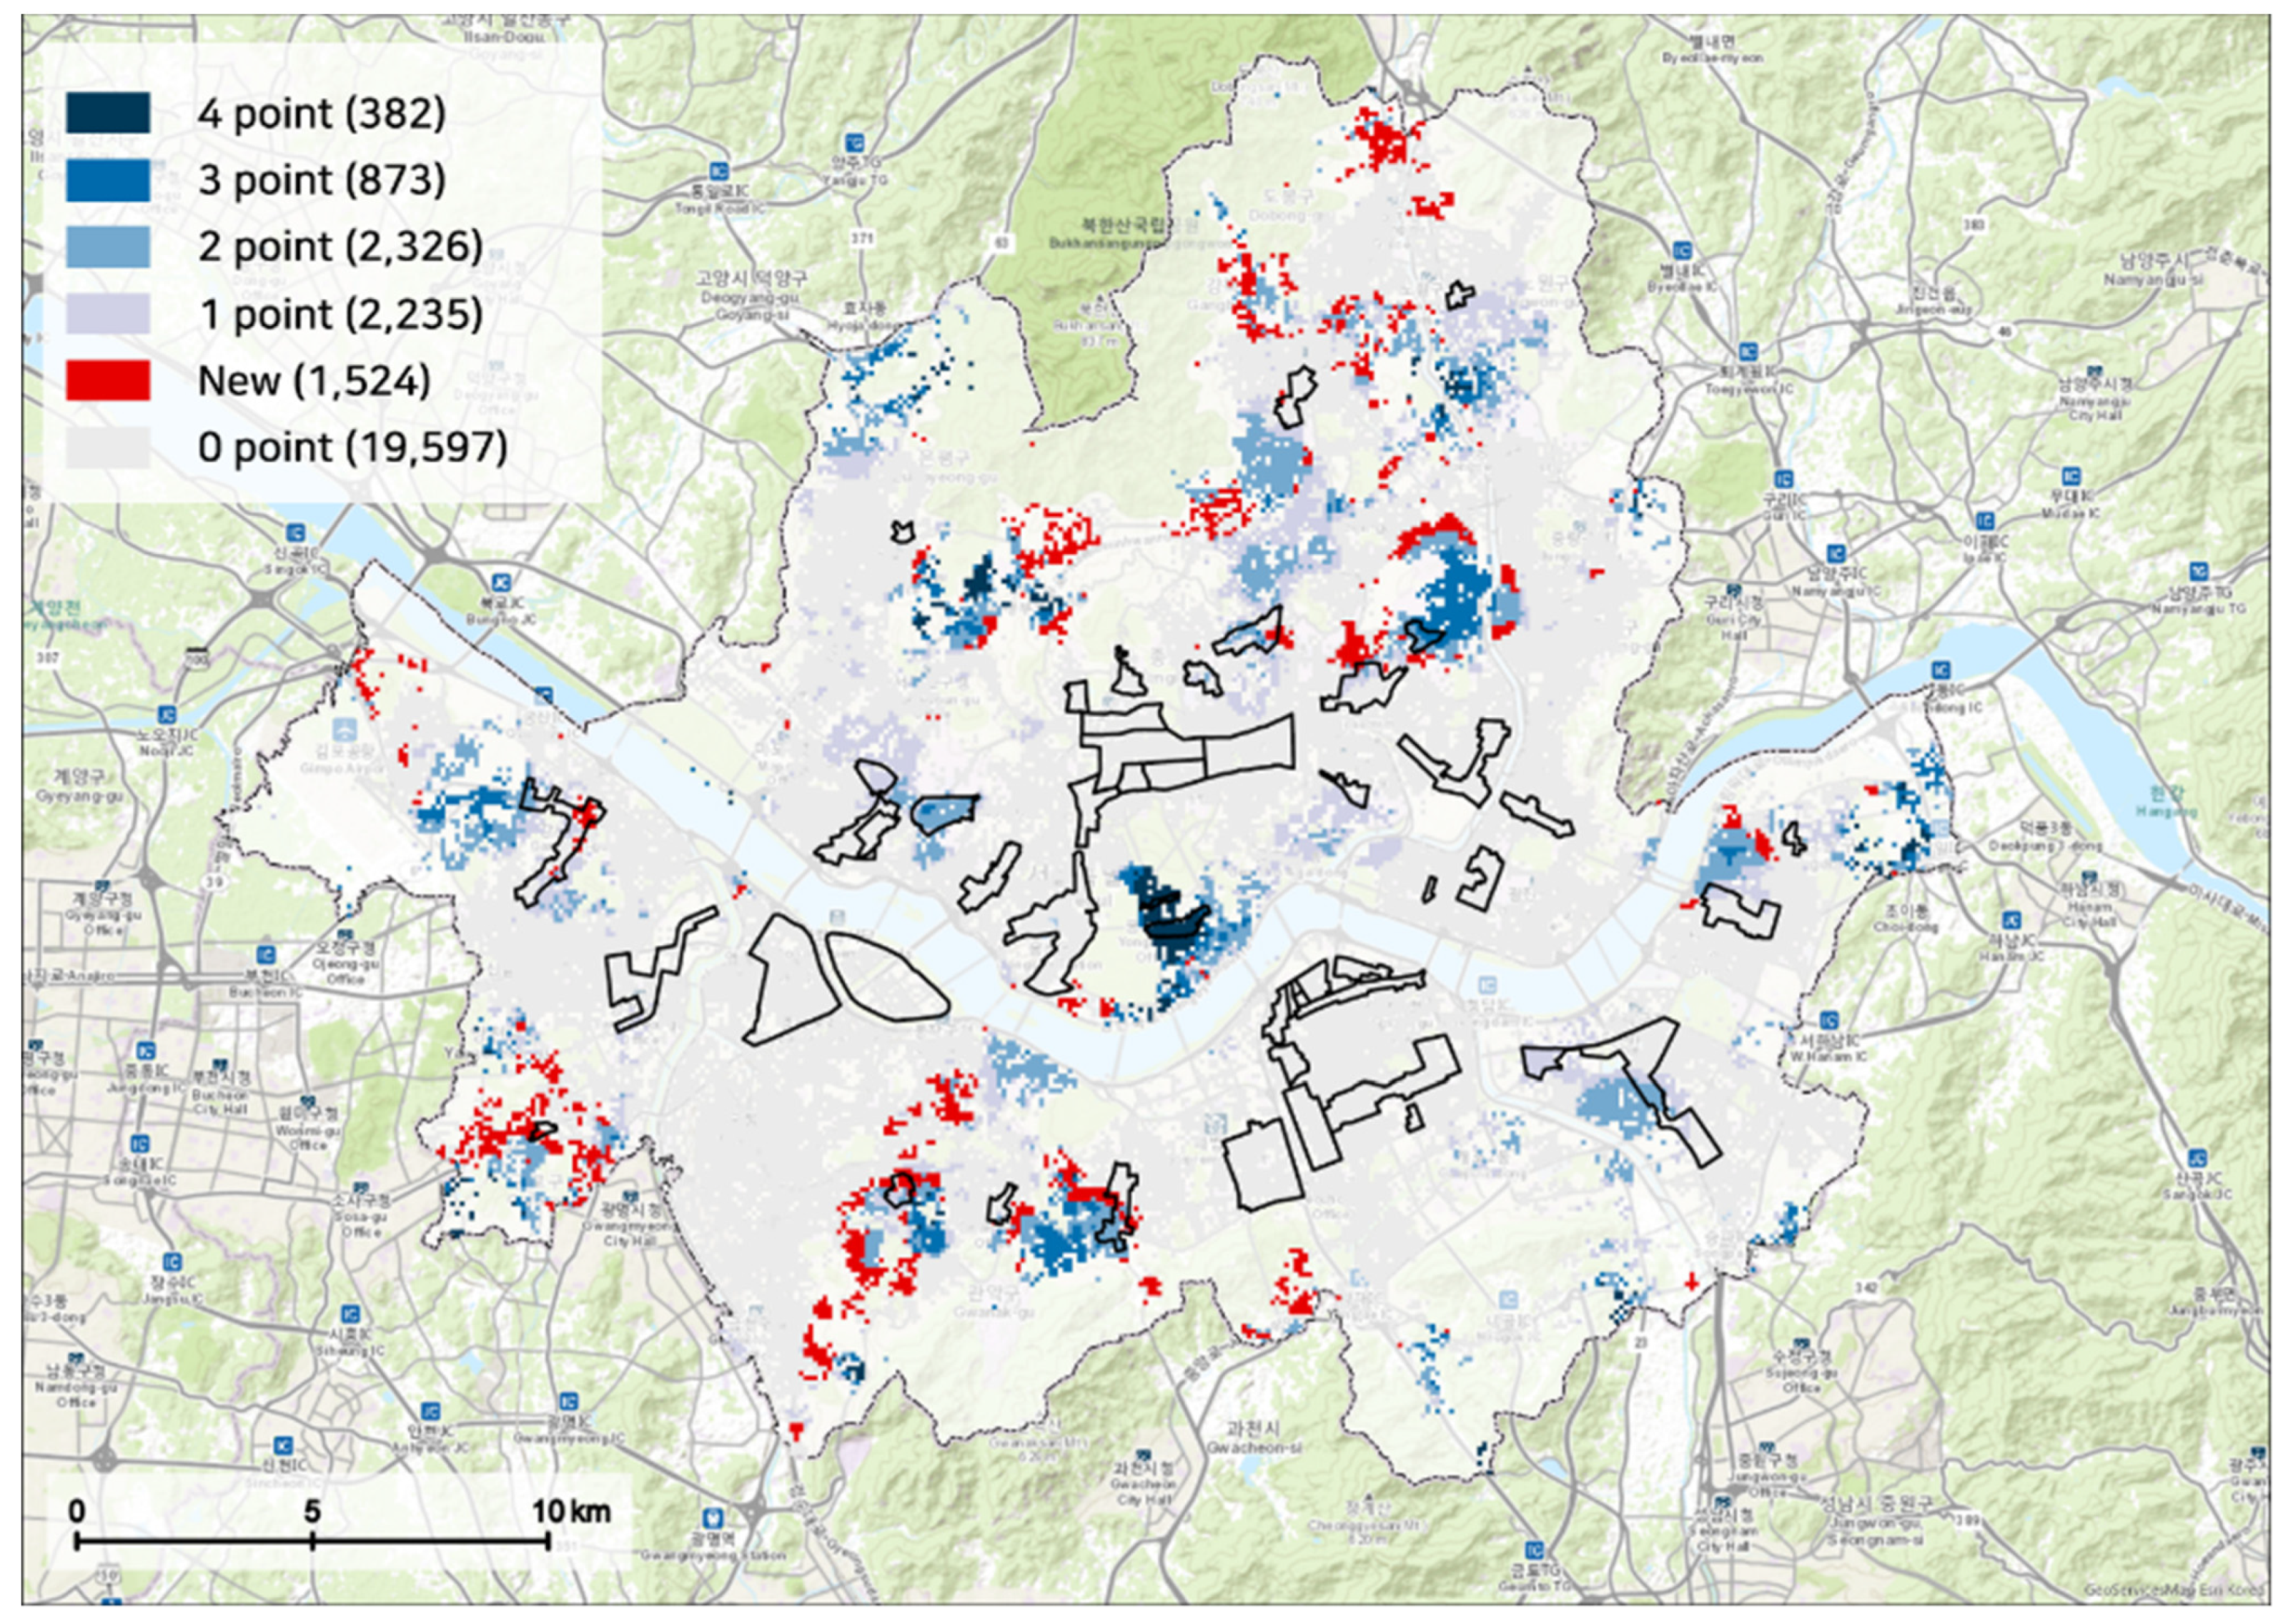
To understand the spatial distribution of areas at risk of commercial building vacancy in time-series, we conducted hot spot analysis on commercial vacancy rates from the first half of 2019 to the second half of 2020. A composite score map was created based on the results of each time frame, as follows (Figure 7). The vacancy risk area that belongs to a hot spot was given a score of 1 within 90% confidence interval, where only a model analyzed the risk area for the pixel. Areas that belong to the hot spot in all four different time periods were given a full score of 4. Among all hot spot areas, 5.2% of these were found to be risk areas for all four different time frames. These areas are characterized by increased rent following gentrification and a decrease in floating population after losing their distinctive regional characteristics. Because these issues are in progress, they had a prolonged vacancy rate, posing a severe problem in the area. The area marked in red on the composite score map is the current non-vacancy risk area, but it is estimated to have a serious vacancy rate in the second half of 2020. These are the manufacturing districts on the southwest side and the college campuses on the northeast side.
5.3. Infleunce of Vacancy Determinants
To quantify the influence of each factor, the influence analysis method developed by Pijanowski, et al. in 2001 was used. By dropping one variable from each model and repeating the LSTM training process, the influence of each variable on model performance was identified based on nine different versions of the model. Based on the statistical outputs of each dropped variable model, we can determine if the model produces a lower RMSE value than the full model, meaning that the factor may not be a strong indicator for predicting commercial vacancies in Seoul. Since all nine alternative models created higher output statistics than the full model, every factor proved to influence an increase in vacancies. Table 6 indicates each excluded variable, RMSE output, and each variable’s influence ranking from low to high (1 = highest and 9 = lowest). The probability training cycles vary from 10,000 to 25,000.
The model produced the lowest RMSE value for dropping sales, indicating that this factor had a stronger influence on the model than other factors. Furthermore, franchise ratio and annual business survival rate also showed a more substantial influence on increasing commercial vacancies. As expected, low sales are a primary factor that threatens a store’s survival, and as the number of large-scale businesses such as franchise stores increases, sales of existing small merchants can be at risk due to lack of brand loyalty.
The results of the influence test also indicated that individual building features such as area and height seem to influence increasing commercial vacancy, but only marginally. This may be partially because the floating population has a stronger influence than the de facto population. In other words, local visitors or transit users in the area (floating population) are more likely to use nearby cafés or stores, compared to residents or workers in a building. The de facto population may be more influential and powerful in cities with high income levels.
The data pertaining to individual buildings, such as the area and level of a building, were found to be less significant than other variables. This can be attributed to a lack of significant changes to the buildings, such as new construction or demolition during the time frame in question, or due to minor changes in variables. In future research, a much larger set of time-series data will quantify influence on the given variables more accurately.
6. Discussion
This study aimed to forecast the commercial vacancy rate in Seoul for the second half of 2020 based on data of the opening and closure of 2,940,000 businesses, and to analyze the factors influencing increases in vacancy. Before the main analysis, we reviewed previous studies on commercial districts and noted limitations due to insufficient data. Previous studies analyzed the characteristics of commercial districts at a certain point in time, as opposed to time-series changes and estimated growth or decline in commercial districts, based on information on closure rates or duration of a business’s operation. We overcame such limitations by securing actual commercial vacancy data that allowed a more direct analysis of a commercial district’s growth and decline, and quantified the factors influencing vacancy. The findings of this study can be summarized as follows.
First, the LSTM-based model proved to be a suitable alternative for predicting future possible commercial vacancy pattern dynamics. Through spatial accuracy analysis (MAE, RMSE) and hot spot analysis, we identified which areas had a higher rate of commercial vacancy. The prediction model forecast worsening vacancy rates in areas that are densely packed with manufacturing businesses and districts near college campuses adjacent to pre-existing vacancy risk areas. Therefore, it is necessary to provide proactive financial support for business owners in the secondary industry and self-employed businesses near college campuses. Based on the results, systematic and efficient planning policies can be established in commercial districts at high risk of vacancy in the near future.
Second, all nine variables were found to influence commercial vacancy rate. In particular, sales, floating population, and franchise rate were found to be the main determinants for commercial vacancies. To minimize commercial vacancy and secure market stability through policy intervention, it is imperative to control the cannibalization of commercial districts and develop the competitiveness of these to retain a consistent floating population. In reality, it is not easy to control the fluctuation of commercial districts based on market principles. Nonetheless, policy intervention is required to sustain the local economy. Thus, it is necessary to recognize the exact cause of vacancies, and to establish appropriate countermeasures.
Lastly, the prediction model generates not only statistical analysis but also intuitive diagrams and maps through hot spot analysis and spatial prediction. Thus, policymakers and small business owners who are not familiar with statistics and economic theories can establish a road map to manage the vacancy issue.
Despite the merits of this study, some limitations should be further addressed in future research. First, the findings of this study cannot accurately reflect rapidly changing economic conditions (such as those caused by COVID-19) domestically or internationally, because this study forecast the vacancy rate for the second half of 2020 based on previous time-series data. During the first half of 2020, when the first wave of the COVID-19 pandemic was sweeping the country, the Korean government implemented support programs such as emergency relief funds for small business owners and owner-operated businesses that suffered from the spread of virus. Even though commercial vacancy rates increased during the first half of 2020, compared to 2019, the estimation of the commercial vacancy rate for the second half of 2020, which was solely based on the pre-existing time-series patterns, is likely to be inaccurate because the COVID-19 pandemic is not reflected. Furthermore, since some business owners did not report the closures for avoiding their premium loss, the current seriousness of the vacancy issue might be underestimated in the half of 2020, and it could decrease the prediction accuracy. Therefore, it is imperative to develop a prediction model that considers a variety of scenarios based on a larger data set covering vacancies. Because commercial vacancy can respond to changes in floating population and the surrounding environment of a commercial district, it is essential to consider changes not only in Seoul but also in neighboring cities when estimating the vacancy rate of commercial buildings located on Seoul’s boundary. Therefore, it is necessary to consider constructing data from neighboring cities and developing a collaborative system. Third, since the characteristics of individual commercial facilities might have a spatial dependency on the closure and sales, the effects of spatial autocorrelation need to be further tested by follow-up research. Lastly, since LSTM modeling requires a geographic information system, deep-learning analysis ability, and a high-performance computing system, it might be difficult to apply the model in the professional planning field.
7. Conclusions
Overall, this research sought to forecast future possible commercial vacancy dynamics, quantify the influence of contributing factors, and suggest an initial guideline that can be used in future planning policies. We proved that LSTM-based predictions can be useful to forecast potential future commercial vacancy areas when a clear input data are available.
This research contributes to develop new methodological frameworks for prediction models, providing Furthermore, the forecasted results could also be useful to produce strategies for the expected consequences of commercial vacancy, providing the objective basis for establishing future policies. Of course, the prediction model is not perfect and needs improvements due to the realistic complexity of various socioeconomic, physical, and environmental interactions and non-linearity. Furthermore, it is also critical to determine appropriate accuracy verification methods for the data. Although this research used a conventional statistical approach, RMSE, the Bayesian Information Criterion (BIC) or Akaike’s information criterion (AIC) are widely used for time-series applications. Some studies reveal that BIC might be suitable for a large sample size [44]. However, we believe that the prediction model would be able to play a role as “a key analytical bridge between envisioning alternative urban development patterns and evaluating their impacts” if qualified theories and data are secured [45]. This research can be the starting point for understanding the trends of commercial districts and improving a more reliable prediction model.
Author Contributions
Conceptualization, J.L. and H.K. (Hyunwoo Kim); methodology, H.K. (Hyunwoo Kim); writing—original draft preparation, J.L.; writing—review and editing, super-vision, H.K. (Hyungkyoo Kim); funding acquisition, J.L. All authors have read and agreed to the published version of the manuscript.
Funding
This research was supported by the Ministry of Education of the Republic of Korea and the National Research Foundation of Korea (NRF-2019S1A5A8032562).
Institutional Review Board Statement
Not applicable.
Informed Consent Statement
Not applicable.
Data Availability Statement
Into applicable.
Acknowledgments
In this section, you can acknowledge any support given which is not covered by the author contribution or funding sections. This may include administrative and technical support, or donations in kind (e.g., materials used for experiments).
Conflicts of Interest
The authors declare no conflict of interest.
References
- Glennon, D.; Nigro, P. Measuring the default risk of small business loans: A survival analysis approach. J. Money Credit Bank. 2005, 37, 923–947. [Google Scholar] [CrossRef]
- Goldman, A.; Ramaswami, S.; Krider, R.E. Barriers to the advancement of modern food retail formats: Theory and measurement. J. Retail. 2002, 78, 281–295. [Google Scholar] [CrossRef]
- Klein, M. Survival Analysis: A Self-Learning Text; Springer: Berlin/Heidelberg, Germany, 2012. [Google Scholar]
- Ryu, K.; Lee, C. Structural relationship between rent and vacancy rate in the office rental market of Seoul. J. Korea Real Estate Anal. Assoc. 2012, 18, 91–102. [Google Scholar]
- Jung, E.; Sung, H. The effects of homogeneous and heterogeneous Spatial Clustering characteristics on retail sales in Seoul. J. Korea Plan. Assoc. 2016, 51, 63–83. [Google Scholar] [CrossRef]
- Lee, D.; Lee, J.; Cheon, S. Comparison of Survival Rate in Food Service Industry between Growing Commercial Districts and Declining Commercial Districts of Seoul. Korea Spat. Plan. Rev. 2020, 105, 65–84. [Google Scholar]
- Hardin, W., III; Wolverton, M. Micro-market determinants of neighborhood center rental rates. J. Real Estate Res. 2000, 20, 299–322. [Google Scholar] [CrossRef]
- Hardin, W.G.; Wolverton, M.L. Neighborhood center image and rents. J. Real Estate Financ. Econ. 2001, 23, 31–46. [Google Scholar] [CrossRef]
- Wheaton, W.C.; Torto, R.G. Vacancy rates and the future of office rents. Real Estate Econ. 1988, 16, 430–436. [Google Scholar] [CrossRef]
- Ahn, J.; Sung, J. An empirical study on the duration of self-employment. J. Labour Econ. 2003, 26, 1–30. [Google Scholar]
- Sanderson, B.; Farrelly, K.; Thoday, C. Natural vacancy rates in global office markets. J. Prop. Invest. Financ. 2006, 24, 490–520. [Google Scholar] [CrossRef]
- Nam, Y. Analysis on the Determinants of Exit of Self-Employed Businesses in Korea. Economic Studies. 2017, 5, 1–24. [Google Scholar] [CrossRef]
- Geoghegan, J.; Wainger, L.A.; Bockstael, N.E. Spatial landscape indices in a hedonic framework: An ecological economics analysis using GIS. Ecol. Econ. 1997, 23, 251–264. [Google Scholar] [CrossRef]
- Alig, R.J. Econometric analysis of the factors influencing forest acreage trends in the Southeast. For. Sci. 1986, 32, 119–134. [Google Scholar]
- Jadevicius, A.; Huston, S. ARIMA modelling of Lithuanian house price index. Int. J. Hous. Mark. Anal. 2015, 8, 135–147. [Google Scholar] [CrossRef]
- Nghiep, N.; Al, C. Predicting housing value: A comparison of multiple regression analysis and artificial neural networks. J. Real Estate Res. 2001, 22, 313–336. [Google Scholar] [CrossRef]
- Limsombunchai, V.; Gan, C.; Lee, M. House price prediction: Hedonic price model vs. artificial neural network. Am. J. Appl. Sci. 2004, 1, 193–201. [Google Scholar]
- Newman, G.; Lee, J.; Berke, P. Using the land transformation model to forecast vacant land. J. Land Use Sci. 2016, 11, 450–475. [Google Scholar] [CrossRef]
- Lee, J.; Newman, G. Forecasting urban vacancy dynamics in a shrinking city: A land transformation model. Isprs Int. J. Geoinf. 2017, 6, 124. [Google Scholar]
- Niemann, M.; Schmidt, J.H.; Neukirchen, M. Improving performance of corporate rating prediction models by reducing financial ratio heterogeneity. J. Bank. Financ. 2008, 32, 434–446. [Google Scholar] [CrossRef]
- Campbell, J.Y.; Hilscher, J.; Szilagyi, J. In search of distress risk. J. Financ. 2008, 63, 2899–2939. [Google Scholar] [CrossRef] [Green Version]
- Ok, J.; Kim, K. Bankruptcy prediction using an improved bagging ensemble. J. Intell. Inf. Syst. 2009, 15, 99–121. [Google Scholar]
- Crawford, G.W.; Fratantoni, M.C. Assessing the forecasting performance of regime-switching, ARIMA and GARCH models of house prices. Real Estate Econ. 2003, 31, 223–243. [Google Scholar] [CrossRef]
- Ezen-Can, A. A Comparison of LSTM and BERT for Small Corpus. arXiv 2020, arXiv:2009.05451. [Google Scholar]
- Cha, S.; Kang, J. Corporate Default Prediction Model Using Deep Learning Time Series Algorithm, RNN and LSTM. J. Intell. Inf. Syst. 2018, 24, 1–32. [Google Scholar]
- Temür, A.S.; Akgün, M.; Temür, G. Predicting housing sales in Turkey using ARIMA, LSTM and hybrid models. J. Bus. Econ. Manag. 2019, 20, 920–938. [Google Scholar] [CrossRef] [Green Version]
- Siami-Namini, S.; Tavakoli, N.; Namin, A.S. A comparison of ARIMA and LSTM in forecasting time series. In Proceedings of the 2018 17th IEEE International Conference on Machine Learning and Applications (ICMLA), Orlando, FL, USA, 17–20 December 2018; pp. 1394–1401. [Google Scholar]
- Lee, I.; Bae, J. Transition of building uses in the culture-based vitalization of commercial streets-a case study of Garosu-gil, Seoul. J. Urban Des. Inst. Korea Urban Des. 2013, 14, 127–140. [Google Scholar]
- Wheaton, W.C.; Torto, R.G.; Evans, P. The cyclic behavior of the Greater London office market. J. Real Estate Financ. Econ. 1997, 15, 77–92. [Google Scholar] [CrossRef]
- McMillen, D.P.; McDonald, J. Reaction of house prices to a new rapid transit line: Chicago’s midway line, 1983–1999. Real Estate Econ. 2004, 32, 463–486. [Google Scholar] [CrossRef]
- Reckien, D.; Martinez-Fernandez, C. Why do cities shrink? Eur. Plan. Stud. 2011, 19, 1375–1397. [Google Scholar] [CrossRef]
- Schilling, J.; Logan, J. Greening the rust belt: A green infrastructure model for right sizing America’s shrinking cities. J. Am. Plan. Assoc. 2008, 74, 451–466. [Google Scholar] [CrossRef]
- Atkinson, R. The evidence on the impact of gentrification: New lessons for the urban renaissance? Eur. J. Hous. Policy 2004, 4, 107–131. [Google Scholar] [CrossRef]
- Hendershott, P.H.; Lizieri, C.M.; Matysiak, G.A. The workings of the London office market. Real Estate Econ. 1999, 27, 365–387. [Google Scholar] [CrossRef]
- Shiller, R.J. Arithmetic repeat sales price estimators. J. Hous. Econ. 1991, 1, 110–126. [Google Scholar] [CrossRef] [Green Version]
- Chapple, K.; Zuk, M. Forewarned: The use of neighborhood early warning systems for gentrification and displacement. Cityscape 2016, 18, 109–130. [Google Scholar]
- Abdel-Nasser, M.; Mahmoud, K. Accurate photovoltaic power forecasting models using deep LSTM-RNN. Neural Comput. Appl. 2019, 31, 2727–2740. [Google Scholar] [CrossRef]
- Yildirim, O.; Baloglu, U.B.; Tan, R.-S.; Ciaccio, E.J.; Acharya, U.R. A new approach for arrhythmia classification using deep coded features and LSTM networks. Comput. Methods Programs Biomed. 2019, 176, 121–133. [Google Scholar] [CrossRef]
- Hochreiter, S. The vanishing gradient problem during learning recurrent neural nets and problem solutions. Int. J. Uncertain. Fuzziness Knowl. Based Syst. 1998, 6, 107–116. [Google Scholar] [CrossRef] [Green Version]
- Squartini, S.; Hussain, A.; Piazza, F. Preprocessing based solution for the vanishing gradient problem in recurrent neural networks. In Proceedings of the 2003 International Symposium on Circuits and Systems, ISCAS’03, Bangkok, Thailand, 25–28 May 2003; p. V. [Google Scholar]
- Aydin, O.; Guldamlasioglu, S. Using LSTM networks to predict engine condition on large scale data processing framework. In Proceedings of the 2017 4th International Conference on Electrical and Electronic Engineering (ICEEE), Ankara, Turkey, 8–10 April 2017; pp. 281–285. [Google Scholar]
- Mirza, A.H.; Cosan, S. Computer network intrusion detection using sequential LSTM neural networks autoencoders. In Proceedings of the 2018 26th Signal Processing and Communications Applications Conference (SIU), Izmir, Turke, 2–5 May 2018; pp. 1–4. [Google Scholar]
- Li, Z.; Li, J.; Wang, Y.; Wang, K. A deep learning approach for anomaly detection based on SAE and LSTM in mechanical equipment. Int. J. Adv. Manuf. Technol. 2019, 103, 499–510. [Google Scholar] [CrossRef]
- Zhu, L.; Li, L.; Liang, Z. Comparison of six statistical approaches in the selection of appropriate fish growth models. Chin. J. Oceanol. Limnol. 2009, 27, 457. [Google Scholar] [CrossRef]
- Landis, J.D.; Birch, E.; Wachter, S. Urban growth models: State of the art and prospects. Glob. Urban.; Penn Press: Philadelphia, PA, USA, 2011; pp. 126–140. [Google Scholar]
Figure 1.
(a) National commercial vacancy rate trend and (b) human traffic in the main commercial districts of Seoul pre− and post−COVID-19.
Figure 1.
(a) National commercial vacancy rate trend and (b) human traffic in the main commercial districts of Seoul pre− and post−COVID-19.

Figure 2.
Study area and analysis unit (100 m × 100 m grid).

Figure 3.
The trend of vacancy rates in 50 major commercial districts of Seoul.

Figure 4.
Basic structure of (a) RNN and (b) LSTM.

Figure 5.
Hot spot analysis by pixel on commercial building vacancy rates and vacancy risk areas (1st half of 2019–2nd half of 2020).
Figure 5.
Hot spot analysis by pixel on commercial building vacancy rates and vacancy risk areas (1st half of 2019–2nd half of 2020).

Figure 6.
(a) Commercial vacancy rate by pixel in the 2nd half of 2020 and (b) vacancy risk area based on hot spot analysis.
Figure 6.
(a) Commercial vacancy rate by pixel in the 2nd half of 2020 and (b) vacancy risk area based on hot spot analysis.

Figure 7.
Overlap of all four hot spot analyses from 1st half 2019 to 2020 2nd half.


Table 1.
Commercial vacancy rate based on the opening and closure of commercial buildings.
| 1st Half of 2019 | 2nd Half of 2019 | 1st Half of 2020 | |
|---|---|---|---|
| Average for Seoul | 6.56% | 6.95% | 7.94% |
| Change compared to the previous 6 months | - | +0.39% | +0.99% |
Table 2.
Types and descriptions of variables.
| Category | Variable | Format (Unit) | Description |
|---|---|---|---|
| Individual structure factor | Levels of a building | Building (F) | Above-ground levels of a building |
| Area of a building | Building (m2) | Floor area of a building | |
| Location factor | De facto population | Block (N) | Persons whose addresses are in Seoul and who create administrative demands |
| Floating population | Block (N) | - | |
| Franchise ratio | Building (%) | The ratio of franchise commercial buildings among total commercial buildings | |
| Local economic factor | Rent | Building (KRW) | (deposit × 12%)/12 + monthly rent |
| Sales per business | Building (KRW) | Sales based on approved credit card transactions | |
| Survival rate of a new business | Block (%) | Survival rate of start-up businesses that remained in business for 3 years or longer | |
| Survival rate by year | Block (%) | Survival rate of start-up businesses that remained in business for 5 years or longer |
Table 3.
Basic statistics of dependent and independent variables.
| Variables | Average of the 1st Half of 2019 | Average of the 2nd Half of 2019 | Average of the 1st Half of 2020 | |
|---|---|---|---|---|
| Dependent variable | Vacancy rate (%) | 6.56 | 6.95 | 7.94 |
| Independent variable | Above-ground levels (F) | 4.85 | 4.85 | 4.85 |
| Area of a building (m2) | 455.71 | 455.95 | 455.92 | |
| De facto population (N) | 726,954 | 726,842 | 719,934 | |
| Floating population (N) | 140,687 | 140,031 | 142,356 | |
| Franchise ratio (%) | 4.05 | 4.09 | 4.12 | |
| Rent (1000 KRW) | 1753.7 | 1773.1 | 1853.0 | |
| Business sales (1000 KRW) | 74,015.4 | 82,364.1 | 79,519.7 | |
| Survival rate of start-up businesses (%) | 51.2 | 51.7 | 52.9 | |
| Annual survival rate (%) | 74.2 | 74.3 | 76.0 |
Table 4.
LSTM statistical output: Iteration, MAE, and RMSE.
| Model | Iteration | MAE | RMSE |
|---|---|---|---|
| 1 | 1 | 0.706 | 0.799 |
| 2 | 1000 | 0.030 | 0.069 |
| 3 | 5000 | 0.015 | 0.033 |
| 4 | 10,000 | 0.009 | 0.019 |
| 5 | 15,000 | 0.007 | 0.013 |
| 6 | 20,000 | 0.005 | 0.009 |
Table 5.
Seoul’s average commercial vacancy rate and areas with over 10% vacancy.
| 1st Half of 2019 | 2nd Half of 2019 | 1st Half of 2020 | 2nd Half of 2020 (Expected) | |
|---|---|---|---|---|
| Average vacancy rate | 6.56% | 6.95% | 7.94% | 9.67% |
| Change compared to the previous 6 months | - | +5.9% | +14.2% | +21.8% |
| Number of pixels with over 25% vacancy rate (%) | 917 (3.4%) | 1031 (3.8%) | 1396 (5.2%) | 1733 (6.4%) |
| Number of pixels with 10–25% vacancy rate (%) | 3600 (13.4%) | 4508 (16.7%) | 8646 (32.1%) | 8390 (31.1%) |
Table 6.
Variable influence outputs by dropping one variable per model.
| Category | Variable | Highest Training Probability | RMSE | Model Influence * |
|---|---|---|---|---|
| Individual structure factor | Levels of a building | 20,000th | 0.0104 | 7 |
| Area of a building | 18,000th | 0.0093 | 9 | |
| Location factor | De facto population | 20,000th | 0.0099 | 8 |
| Floating population | 18,000th | 0.0169 | 4 | |
| Franchise ratio | 20,000th | 0.0222 | 2 | |
| Local economic factor | Rent | 20,000th | 0.0147 | 5 |
| Sales per business | 19,000th | 0.0257 | 1 | |
| Survival rate of a new business | 20,000th | 0.0138 | 6 | |
| Survival rate by year | 20,000th | 0.0184 | 3 |
* The small number in “model influence” indicates a bigger influence.
Publisher’s Note: MDPI stays neutral with regard to jurisdictional claims in published maps and institutional affiliations. |
© 2021 by the authors. Licensee MDPI, Basel, Switzerland. This article is an open access article distributed under the terms and conditions of the Creative Commons Attribution (CC BY) license (https://creativecommons.org/licenses/by/4.0/).
Share and Cite
MDPI and ACS Style
Lee, J.; Kim, H.; Kim, H. Commercial Vacancy Prediction Using LSTM Neural Networks. Sustainability 2021, 13, 5400. https://0-doi-org.brum.beds.ac.uk/10.3390/su13105400
AMA Style
Lee J, Kim H, Kim H. Commercial Vacancy Prediction Using LSTM Neural Networks. Sustainability. 2021; 13(10):5400. https://0-doi-org.brum.beds.ac.uk/10.3390/su13105400
Chicago/Turabian StyleLee, Jaekyung, Hyunwoo Kim, and Hyungkyoo Kim. 2021. "Commercial Vacancy Prediction Using LSTM Neural Networks" Sustainability 13, no. 10: 5400. https://0-doi-org.brum.beds.ac.uk/10.3390/su13105400
Note that from the first issue of 2016, this journal uses article numbers instead of page numbers. See further details here.