1. Introduction
One of the main drivers of environmental damage in the form of climate change is the emission of greenhouse gases (GHGs) in the production of energy, and in particular electricity. Due to the increase in the burning of fossil fuels since the industrial revolution, the increase in concentration of these GHGs in our atmosphere has resulted in a warming effect on the planet [
1]. There are many ways in which emissions can be reduced and the implementation of all of the possible strategies improves the chances of meeting the targets set out by the EU.
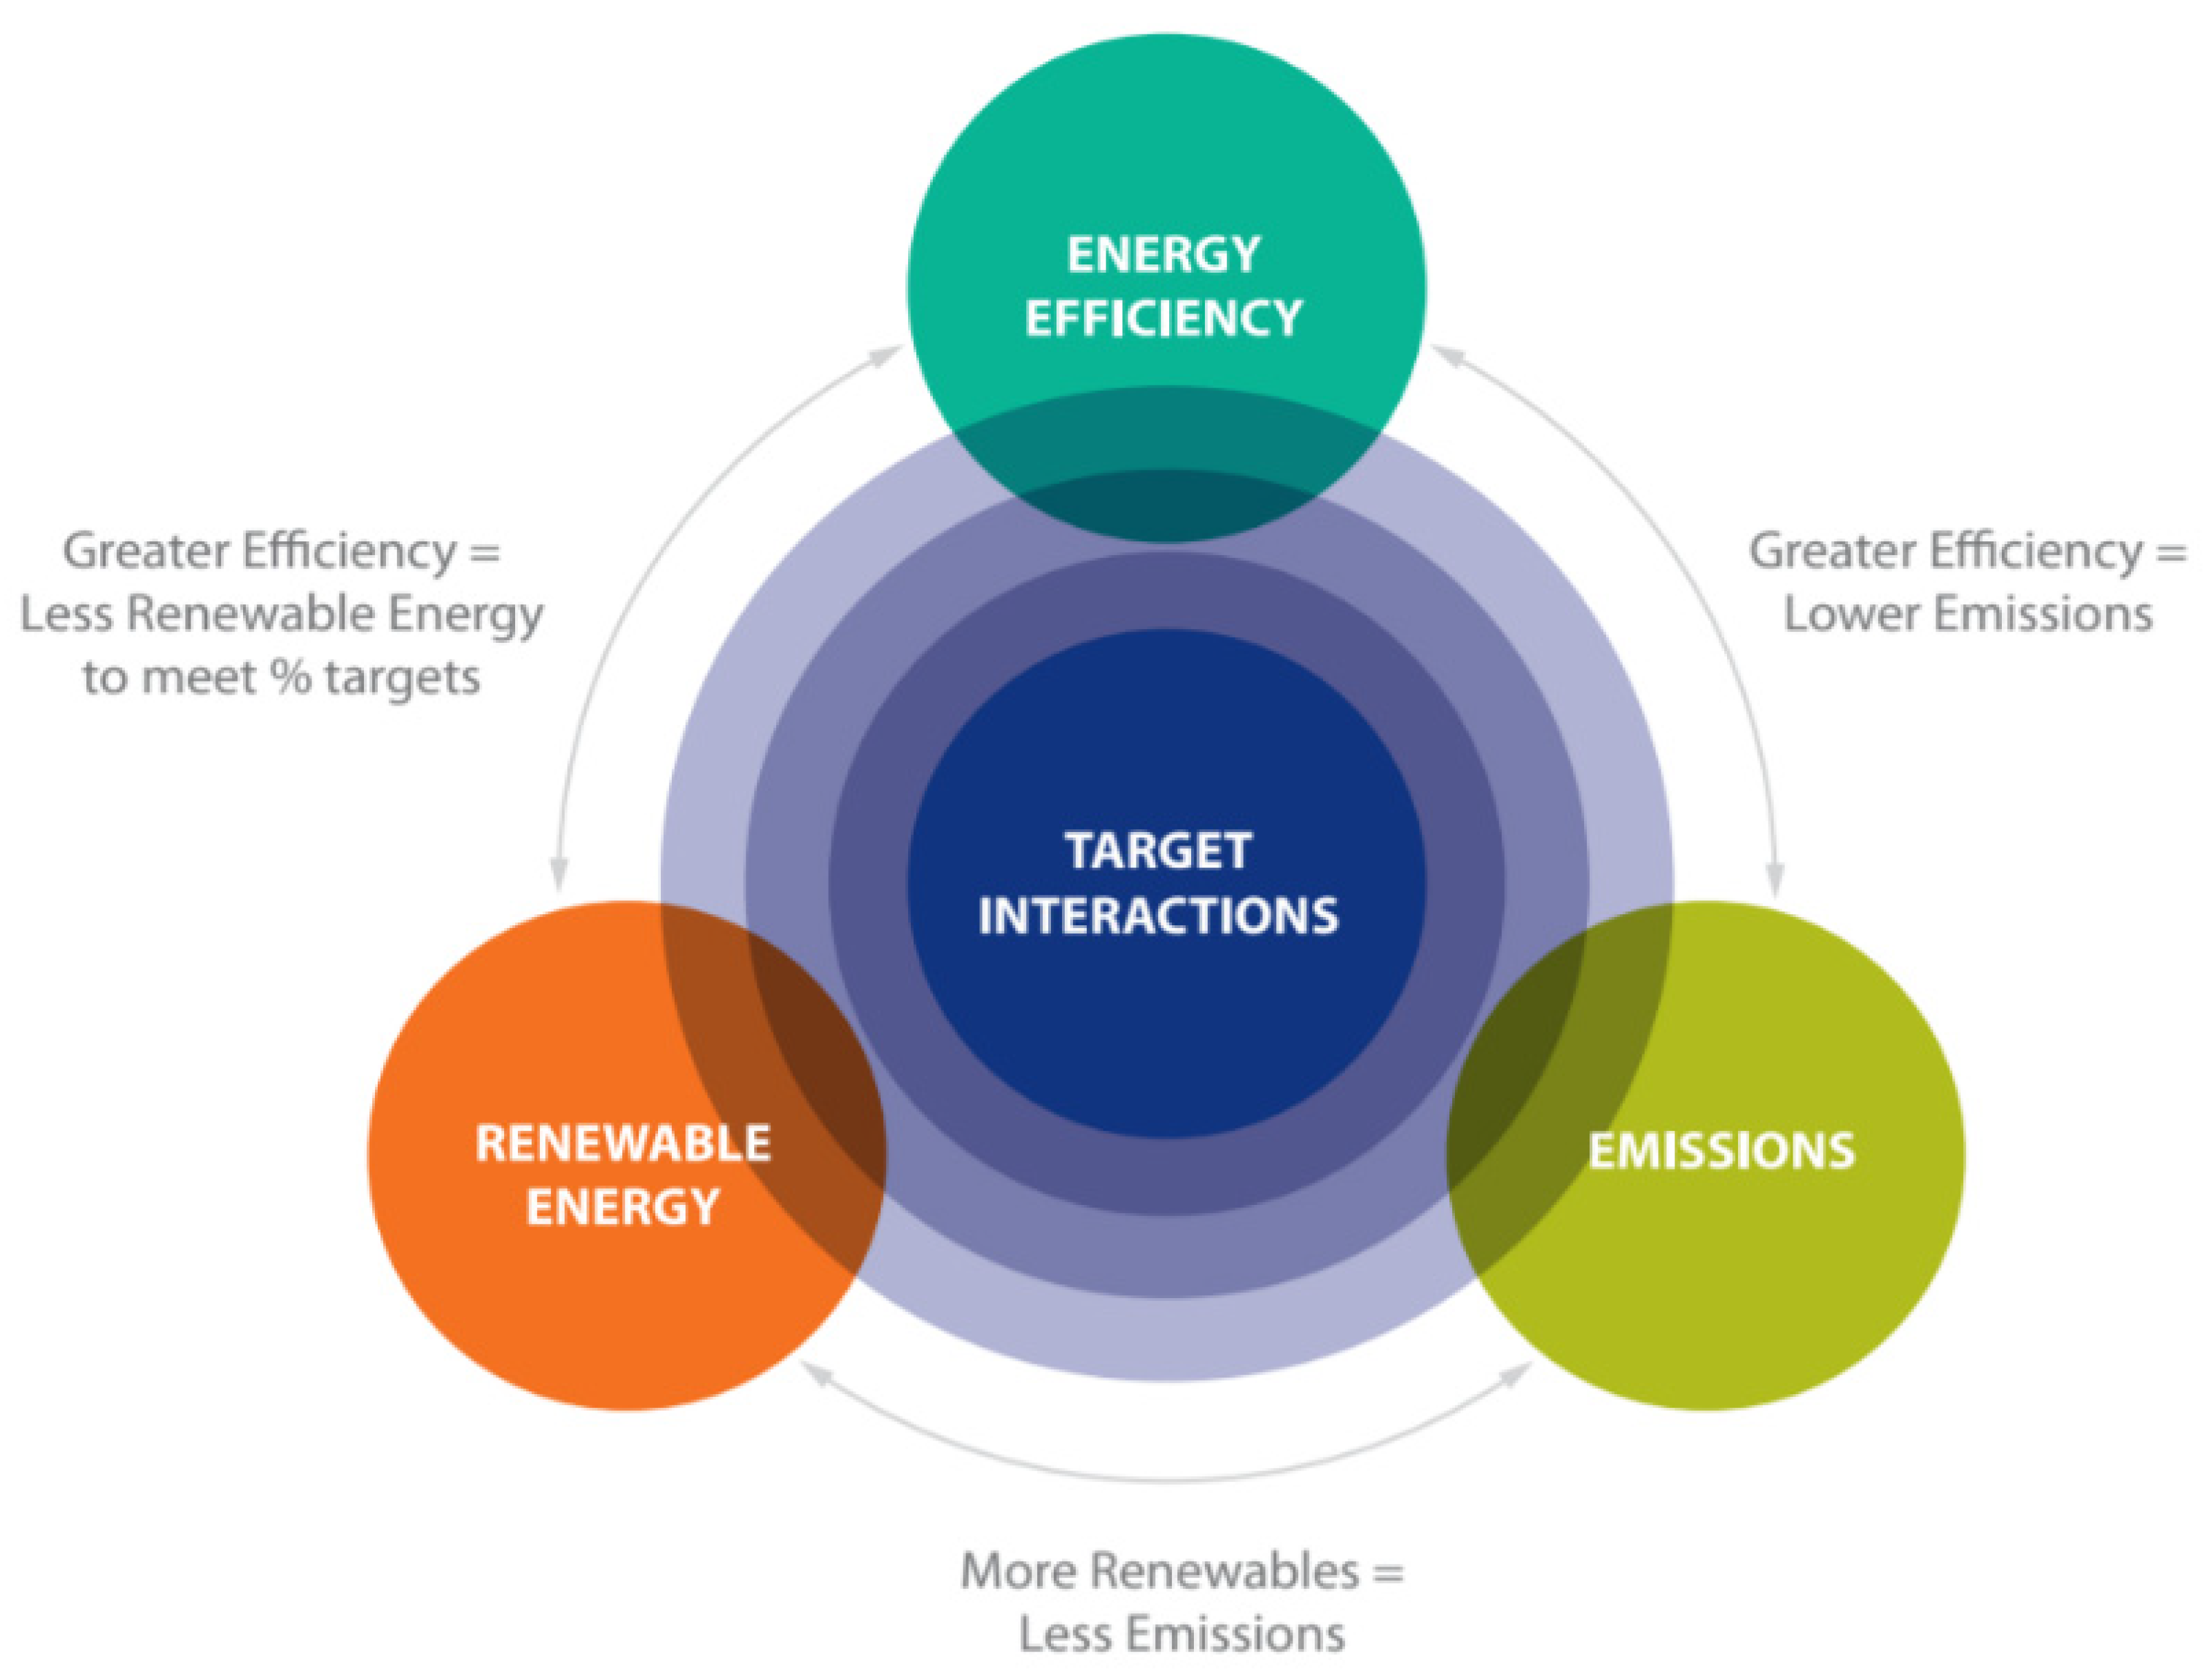
Figure 1, below, shows how our climate targets interact with one another. By improving the energy efficiency, the demand for energy decreases, because less energy is required to perform the same basic task, e.g., electricity for agricultural water-heating. By decreasing the demand for energy, the proportion of energy that is generated through renewable sources increases, because the total energy has decreased. In the same way, by reducing the demand for energy through improvements in energy efficiency, the amount of fossil fuels burned is reduced. The same works for increasing the quantity of energy produced from renewable energy. For this reason, all avenues to reducing energy demand and increasing renewable energy production must be explored. For example, in thermal power plants using fossil fuels to produce electricity, only about 55% of the energy stored within the fuel is converted to electricity as remaining energy is lost as heat [
2]. Other losses which occur in the production of electricity are distribution and parasitic losses. The net supply efficiency of electricity in Ireland in 2017 was 49%, which means that 51% of the energy produced was lost [
2].
Contrasting to renewables the inefficiency of fuel sources such as coal and peat, as well as the higher carbon intensity of those fuels highlight the importance of investment in the renewable energy space in order to reduce GHG emissions in the production of electricity, as electricity accounted for 27% of the energy used in Ireland in 2018 [
4]. An important point to note is that in the production of electricity from non-combustible renewable sources such as wind, solar and hydro (not pumped hydro storage), there are no transformation losses incurred, as there is no energy lost in the production of electricity from these sources. There are still some losses that occur in the transport of the electricity generated, and there may be some energy required to produce the electricity from these sources also. These losses are much smaller than the transformation losses incurred when producing electricity.
Reducing electricity consumption by way of increasing the efficiency of appliances and of electrical water-heating systems have a large impact on reducing Ireland’s GHG emissions [
5]. This is because as we reduce the demand for electricity the fuel mix becomes more renewable as fewer fossil fuels need to be burned to make up the demand.
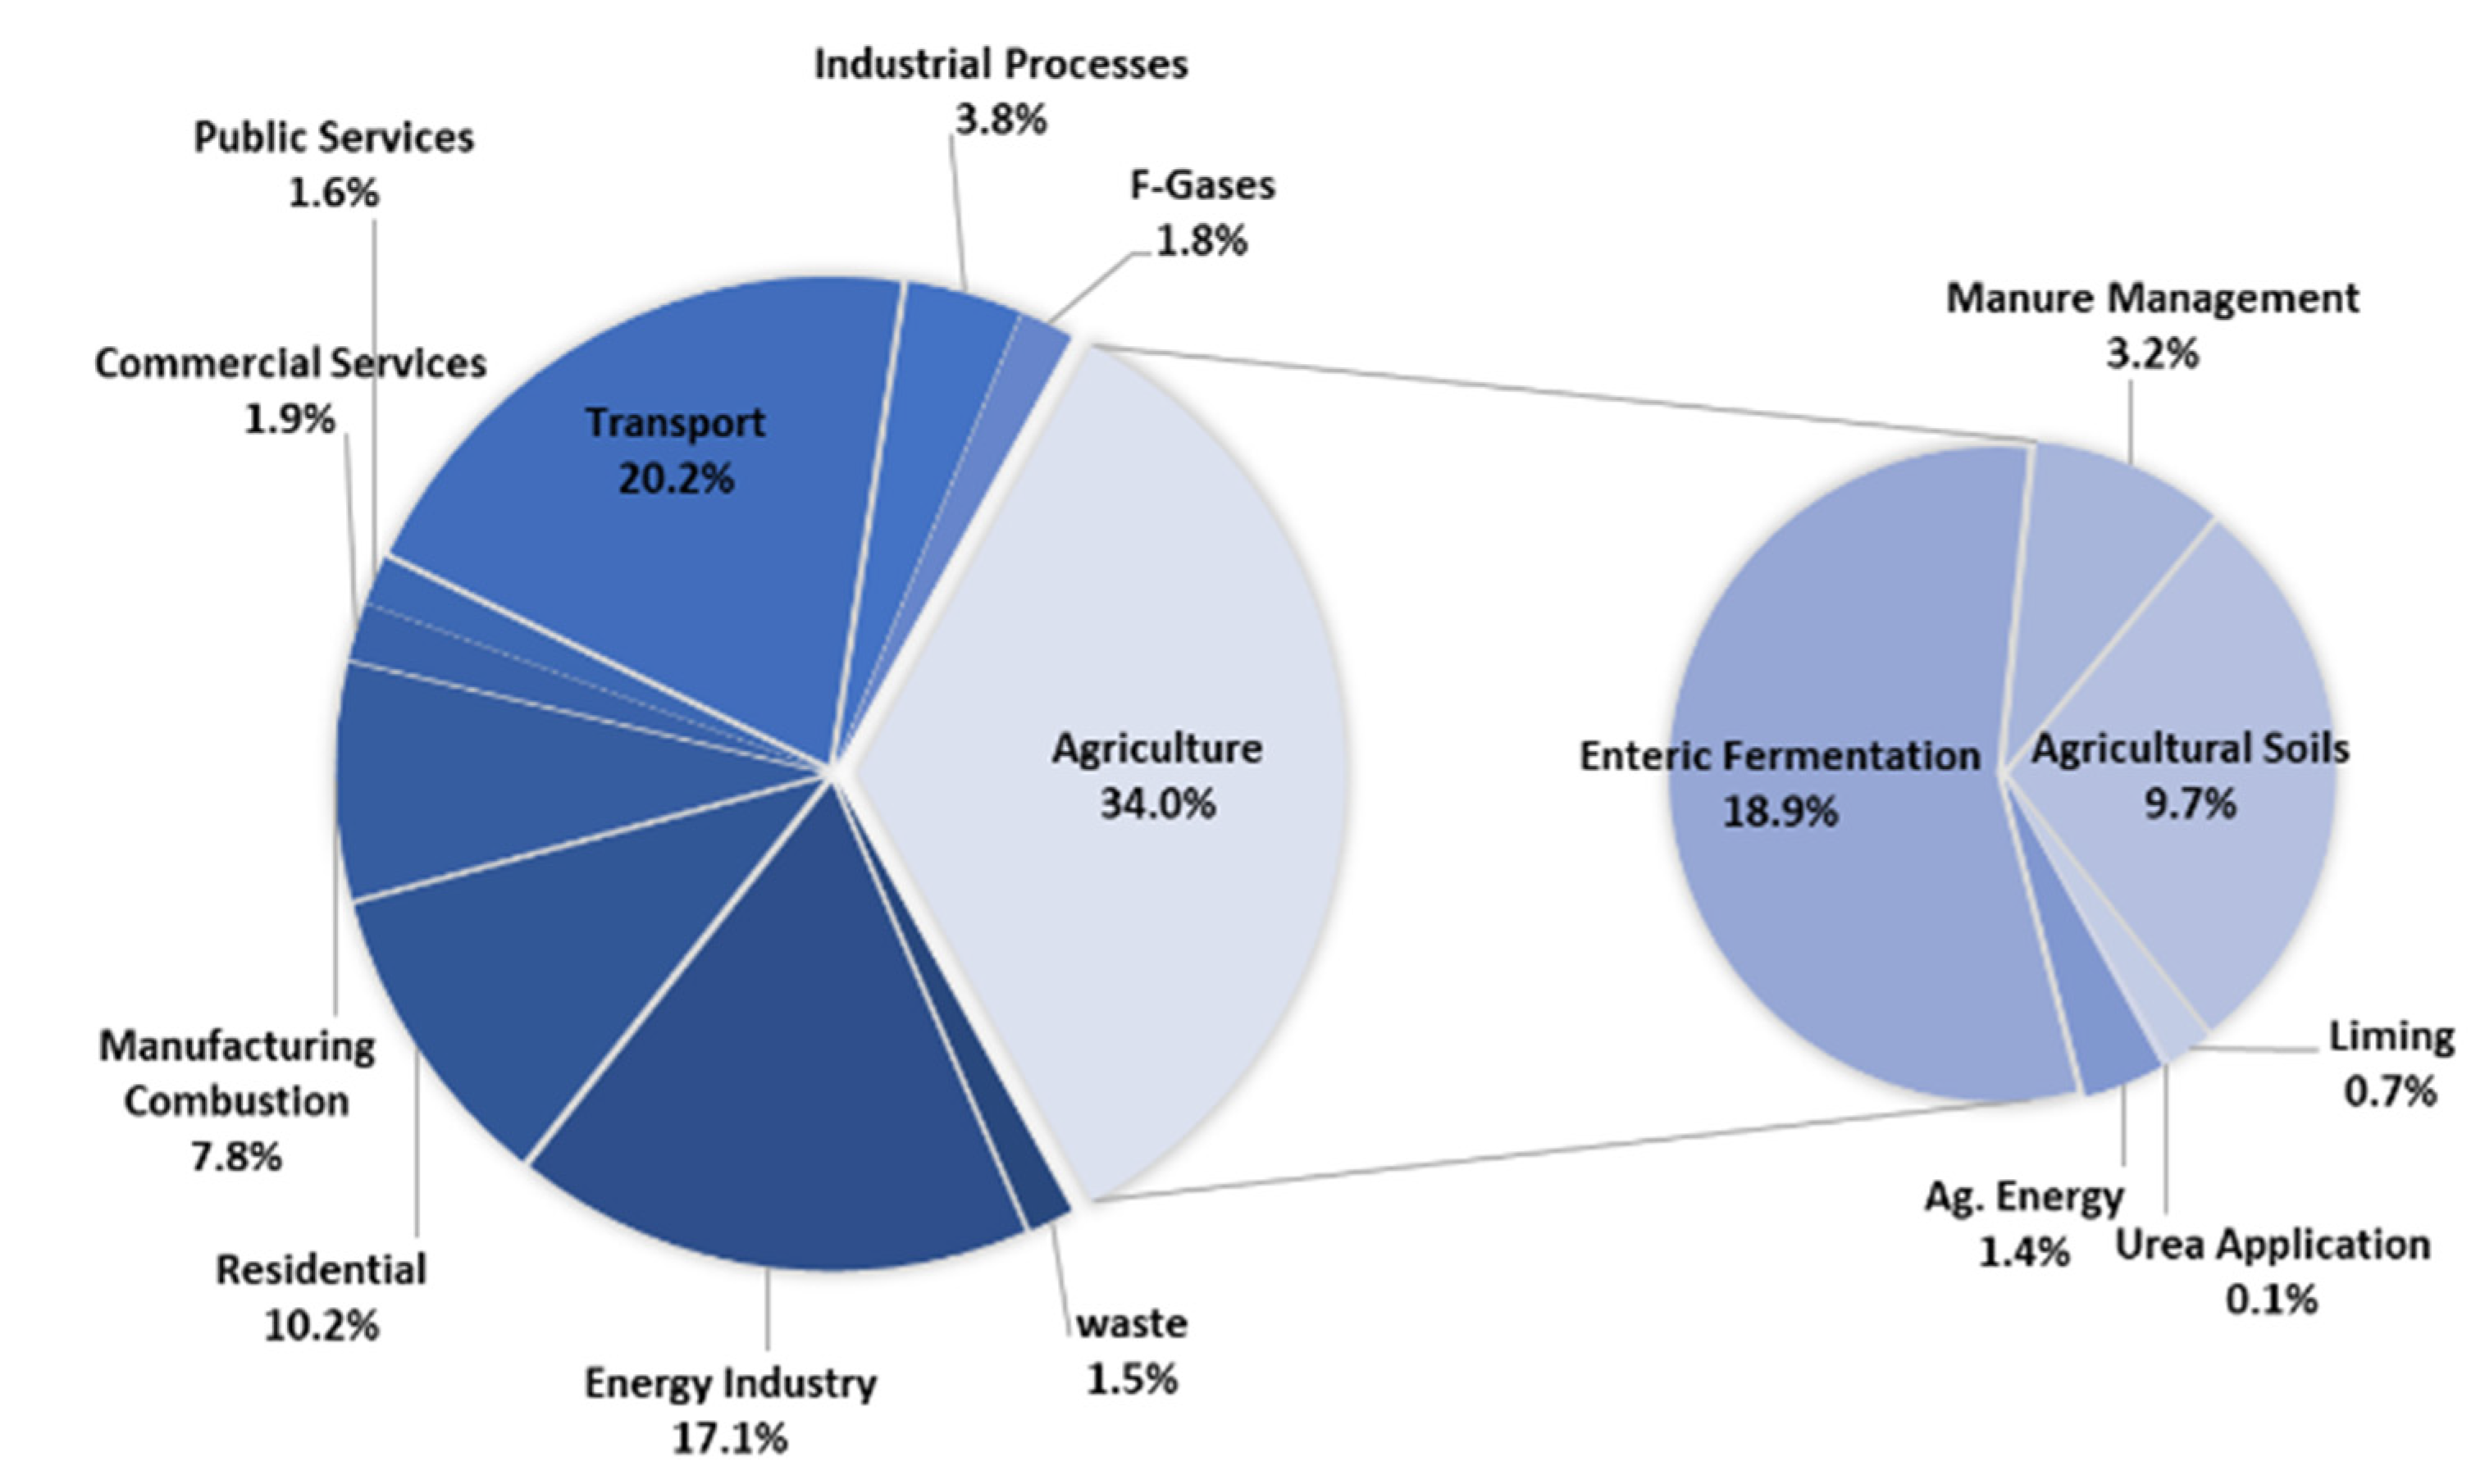
Currently, the agriculture sector in Ireland is responsible for 34% of Ireland’s total GHG emissions, equating to 45% of Ireland’s non-Emissions Trade Scheme (ETS) emissions [
6]. The contribution of each industry to Ireland’s GHG emissions is shown in
Figure 2. It can be seen that agriculture is the largest contributor to Ireland’s GHG emissions. Due to the high proportion of Ireland’s non-ETS emissions coming from this sector, it is imperative that energy emissions in this sector are reduced if the targets set by the EU are going to be met.
In the agriculture sector, emissions have increased year on year since 2014 according to the Sustainable Energy Authority Ireland (SEAI) and the Environmental Protection Agency (EPA) [
4,
7]. This contrasts greatly with the general trend in emissions in Ireland which have been reducing, see
Figure 3. The main reason suggested by the EPA for this is an increase in dairy cow numbers, up 27% over the past five years, which equates to an increase of over 300,000 dairy cows [
7]. The increase in dairy cows is the result of the milk quota’s abolition in 2015 [
8]. Although abolition of the quotas has resulted in increased incomes for Irish dairy farmers, failure to improve efficiency in practices has resulted in an increase in emissions over this time [
8]. Most of the emissions in agriculture are non-energy related, and a large proportion of these non-energy-related emissions are difficult to avoid without the reduction of the herd numbers [
9]. Therefore, in order to see any significant reduction in emissions from agriculture, dairy farmers will have to be much more efficient in terms of their energy use.
Maintaining low total bacteria count and a low thermoduric count is important for maintaining milk quality on dairy farms, and one way this is achieved is through using the correct cleaning procedures. Hot water is required for washing milking equipment and the bulk tank on dairy farms. Temperatures of 65 °C to 75 °C are required for cleaning the milking equipment, and 60 °C to 70 °C for cleaning the bulk tank [
11]. Water temperatures will drop during the washdown procedure, so according to Glanbia, starting temperatures of 70–75 °C are essential [
12]. The quantity of hot water required on dairy farms fluctuates based on the frequency of milking and the size of the farm, so it is difficult to quantify the hot water required for an average farm on a daily basis. For the milking machines, roughly 10 litres of hot water are required per milking unit, and an average farm has 16 milking units [
11]. An 8000 L bulk tank, which is adequate for an average sized farm requires about 160 L of hot water for cleaning.
A method which has been used to reduce energy consumption in an industrial and residential setting has been the implementation of heat pumps for space and water heating. A study carried out by Hong and Howarth found that in 2009, 18% of energy used in the home was for water heating [
13]. They implemented a scenario to estimate the energy savings that could be incurred by using heat pumps instead of the more popular gas and electric heaters, for domestic hot water in residential and commercial setting. The findings were that if heat pumps were used instead, total emissions from fossil fuels in residential and commercial use would be 26% lower [
13]. It was concluded following the study that heat pumps are an effective method of reducing GHG emissions in water heating [
13].
Upton et al. analysed the electricity consumption of 22 Irish dairy farms along with their daily and seasonal trends to identify the strategies which could reduce electricity usage on dairy farms and also maximise the use of electricity during off peak hours to reduce costs [
14]. An interesting result found that 20 of the 22 dairy farms studied were using electric water heaters [
14]. The study also found that 60% of the direct energy used in the farm was electricity, and of that electricity used, 80% was used in the milking parlour [
14]; the two practices that used the most energy were milk cooling (31%) and water heating (23%) [
14].
Gas boilers and liquefied petroleum gas (LPG) instant boilers are also common methods of heating water in dairy farms [
15]. Both of these are lower in emissions in comparison to the electric storage heaters due to the lower carbon intensities of the fuels. However, as the production of electricity is based more on renewables all the time, this may not be the case for the entire life cycle of a new system which is installed, which should be considered when purchasing a new water heater. Oil boilers were a popular choice, but they have higher installation costs and cause greater emissions due to the higher carbon intensity of the fuel. In terms of renewable water-heating technologies, solar thermal is an option, but according to Upton et al., it can only supply around 40% of the total hot water demand [
15]. Heat pumps are another renewable technology that can be used for water heating. Heat pump water heaters work on the basis of a reverse refrigeration cycle, which means they can transfer low grade heat into useable heat to increase the temperature of the water. There are three main heat pump technologies: water source heat pumps (WSHPs), ground source heat pumps (GSHPs) and air-source heat pumps (ASHPs).
Heat pumps have advantages compared to other systems because of their ability to heat water efficiently due to their high coefficient of performance (COP). The COP of a heat pump refers to the amount of heat energy supplied by the heat pump, divided by the amount of energy consumed by the heat pump.
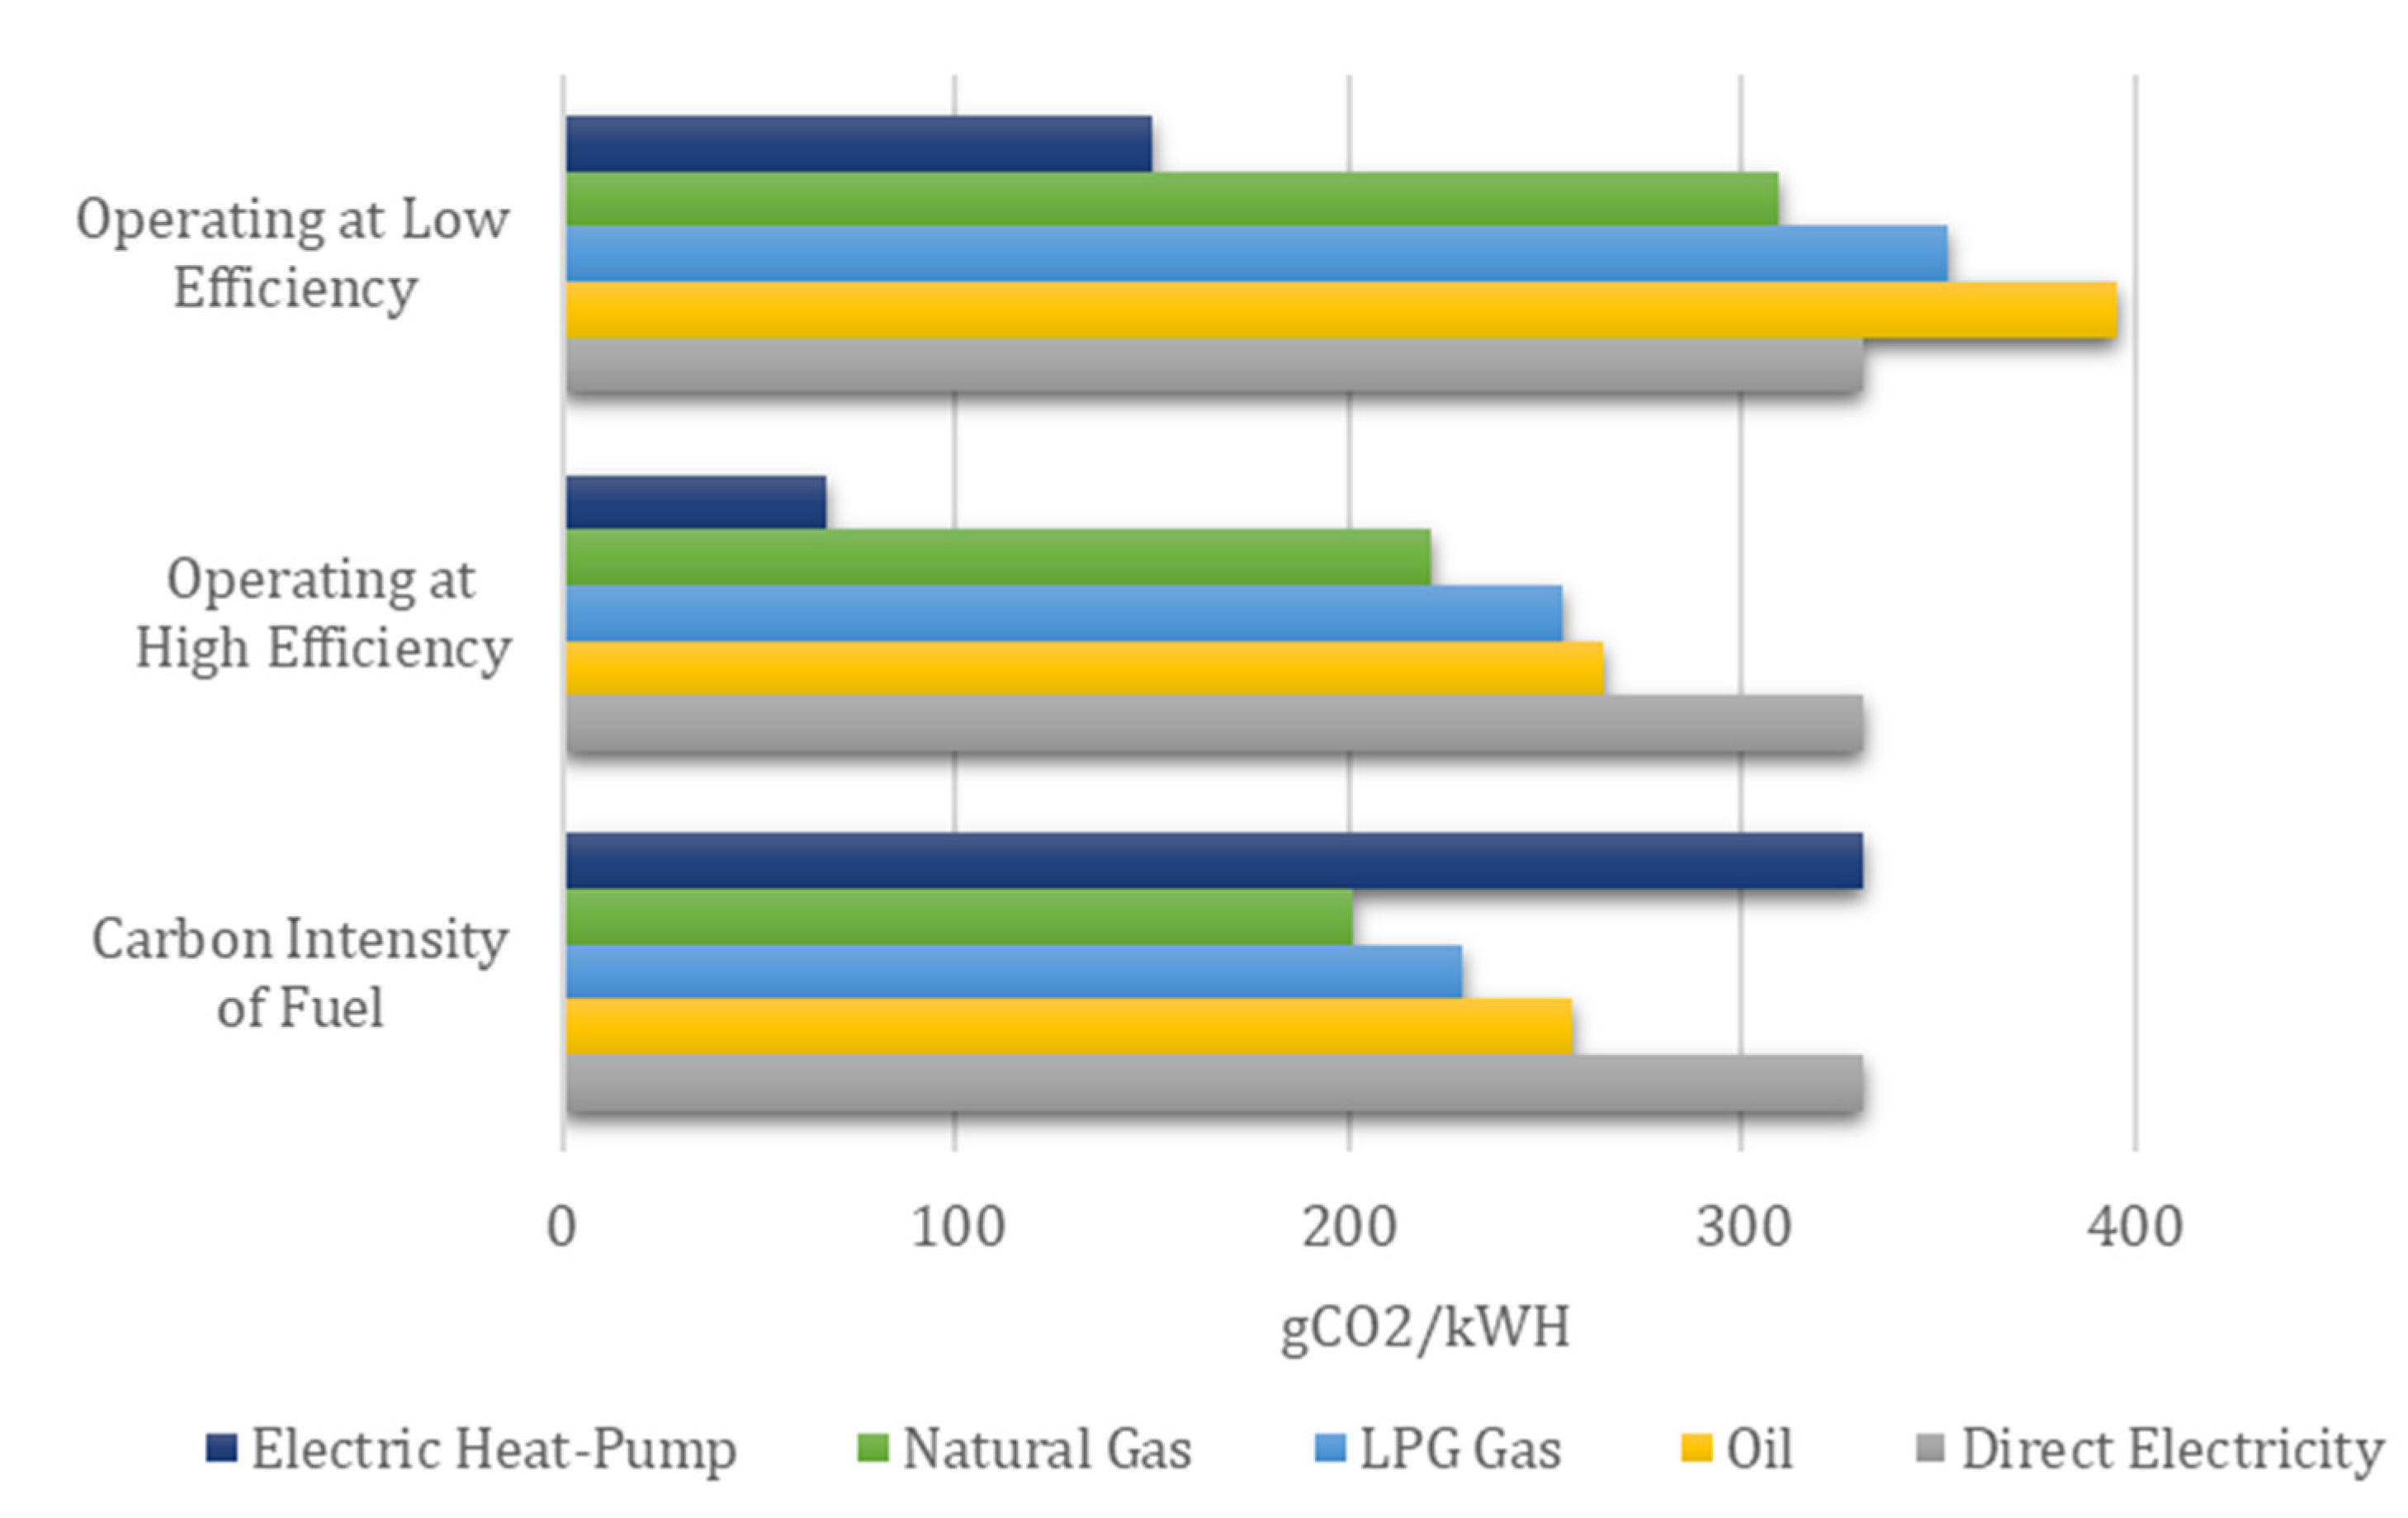
Figure 4 shows each type of water heater with emissions (excluding solar as it has no emissions).
Table 1 shows the information in
Figure 4 in a tabular format. It can be seen from
Figure 4 that the COP of the heat pump seems to make it much more efficient in terms of carbon emissions produced per unit of useful heat. Due to the lack of education in heat pump technology, higher initial cost and a history of limited availability, the uptake of heat pumps in Irish dairy farming has been limited. However, there are now grants available in Ireland by the SEAI for businesses which reduce the initial purchase cost of heat pumps [
16].
There are many different types of heat pump which could be used in the application of dairy farming, but the type which would be most applicable to all farms would be the air-source heat pump water-heater (ASHPWH) [
17]. Other heat pumps are more expensive to install and may not be possible to install in certain farms, and therefore this study will deal with ASHPWHs in particular. In this study the performance of an ASHPWH system is of interest for the application of dairy farming in Ireland. A study by Upton et al. [
18] investigated the performance of an ASHPWH with an electric heating element for the dairy farm application. The heat pump was used to heat the water to 55 °C, and the electric heating element was then used to heat the water to 80 °C. The study used usable water as a metric for the performance of the heat pump and it defined usable water as water between the temperatures of 60 °C and 80 °C [
18]. This is the temperature range for which the water is deemed usable for washing down the bulk tank and the temperature range for cleaning the milking machines is 65 °C to 75 °C. The temperature of the water in the tank may not be the temperature that the water will be at when it reaches the bulk tank and milking machines, so a higher threshold for useable water temperature is used in this study to account for this. The metric of L/kWh was used to compare the performance of the heat pump water heater with an electric emersion element only water heater. The ASHPWH was able to produce 15.12 L/kWh in comparison to 9.66 L/kWh with the electric emersion heater [
18].
Upton’s study found that the maximum amount of usable water which could be drawn out of the system was found when the water was mixed during the heating process. This study aims to use the same metrics to compare an ASHPWH with some of the other options available to a dairy farmer looking to improve the energy efficiency of their farm, in particular the performance of an air-source heat pump water-heater (ASHPWH) system, manufactured by Kronoterm, is analysed for its ability to reduce emissions in the application of dairy farming in Ireland. For this study usable water is in line with Glanbia’s recommendation of greater than 70 °C [
12].
ASHPWHs are very sensitive to their ambient conditions, but ambient temperature has the largest effect as the amount of energy available to the heat pump from the air decreases as temperature decreases. In general terms, as the ambient temperature increases, the COP of the heat pump increases and as the ambient temperature decreases, so does the COP. The true relationship though is slightly more complex, the COP of the heat pump is related to the difference between the ambient temperature and the temperature of the heat sink. This is why as the temperature of the water increases within the ASHPWH, the COP decreases. As the difference in temperature between the ambient conditions and the heat sink increases, it becomes more difficult for the system to draw useful heat from the air, and therefore it uses more power per unit of useful heat which it supplies to the heat sink. This relationship has been shown in multiple studies, which aimed to compare the performance of ASHPs during different periods of the year. For example, in a study carried out by Ji et al. which was carried out in China [
19], the COP increased from 2 at 4.5 °C average temperature to 3.42 at 31 °C average temperature. A similar study carried out by Zhang et al. investigated the COP of a heat pump over each season, in order to find the seasonal performance factor (SPF) of an air-source heat pump [
20]. The study found that the COP during the winter, at an average ambient temperature of 0 °C was 2.61, which increased to 4.82 during spring and autumn with an average temperature of 25 °C and increased further during summer to 5.66 for an average temperature of 35 °C [
20]. These studies show how great an effect the ambient temperature of the environment can have on the performance of air-source heat pumps.
3. Results
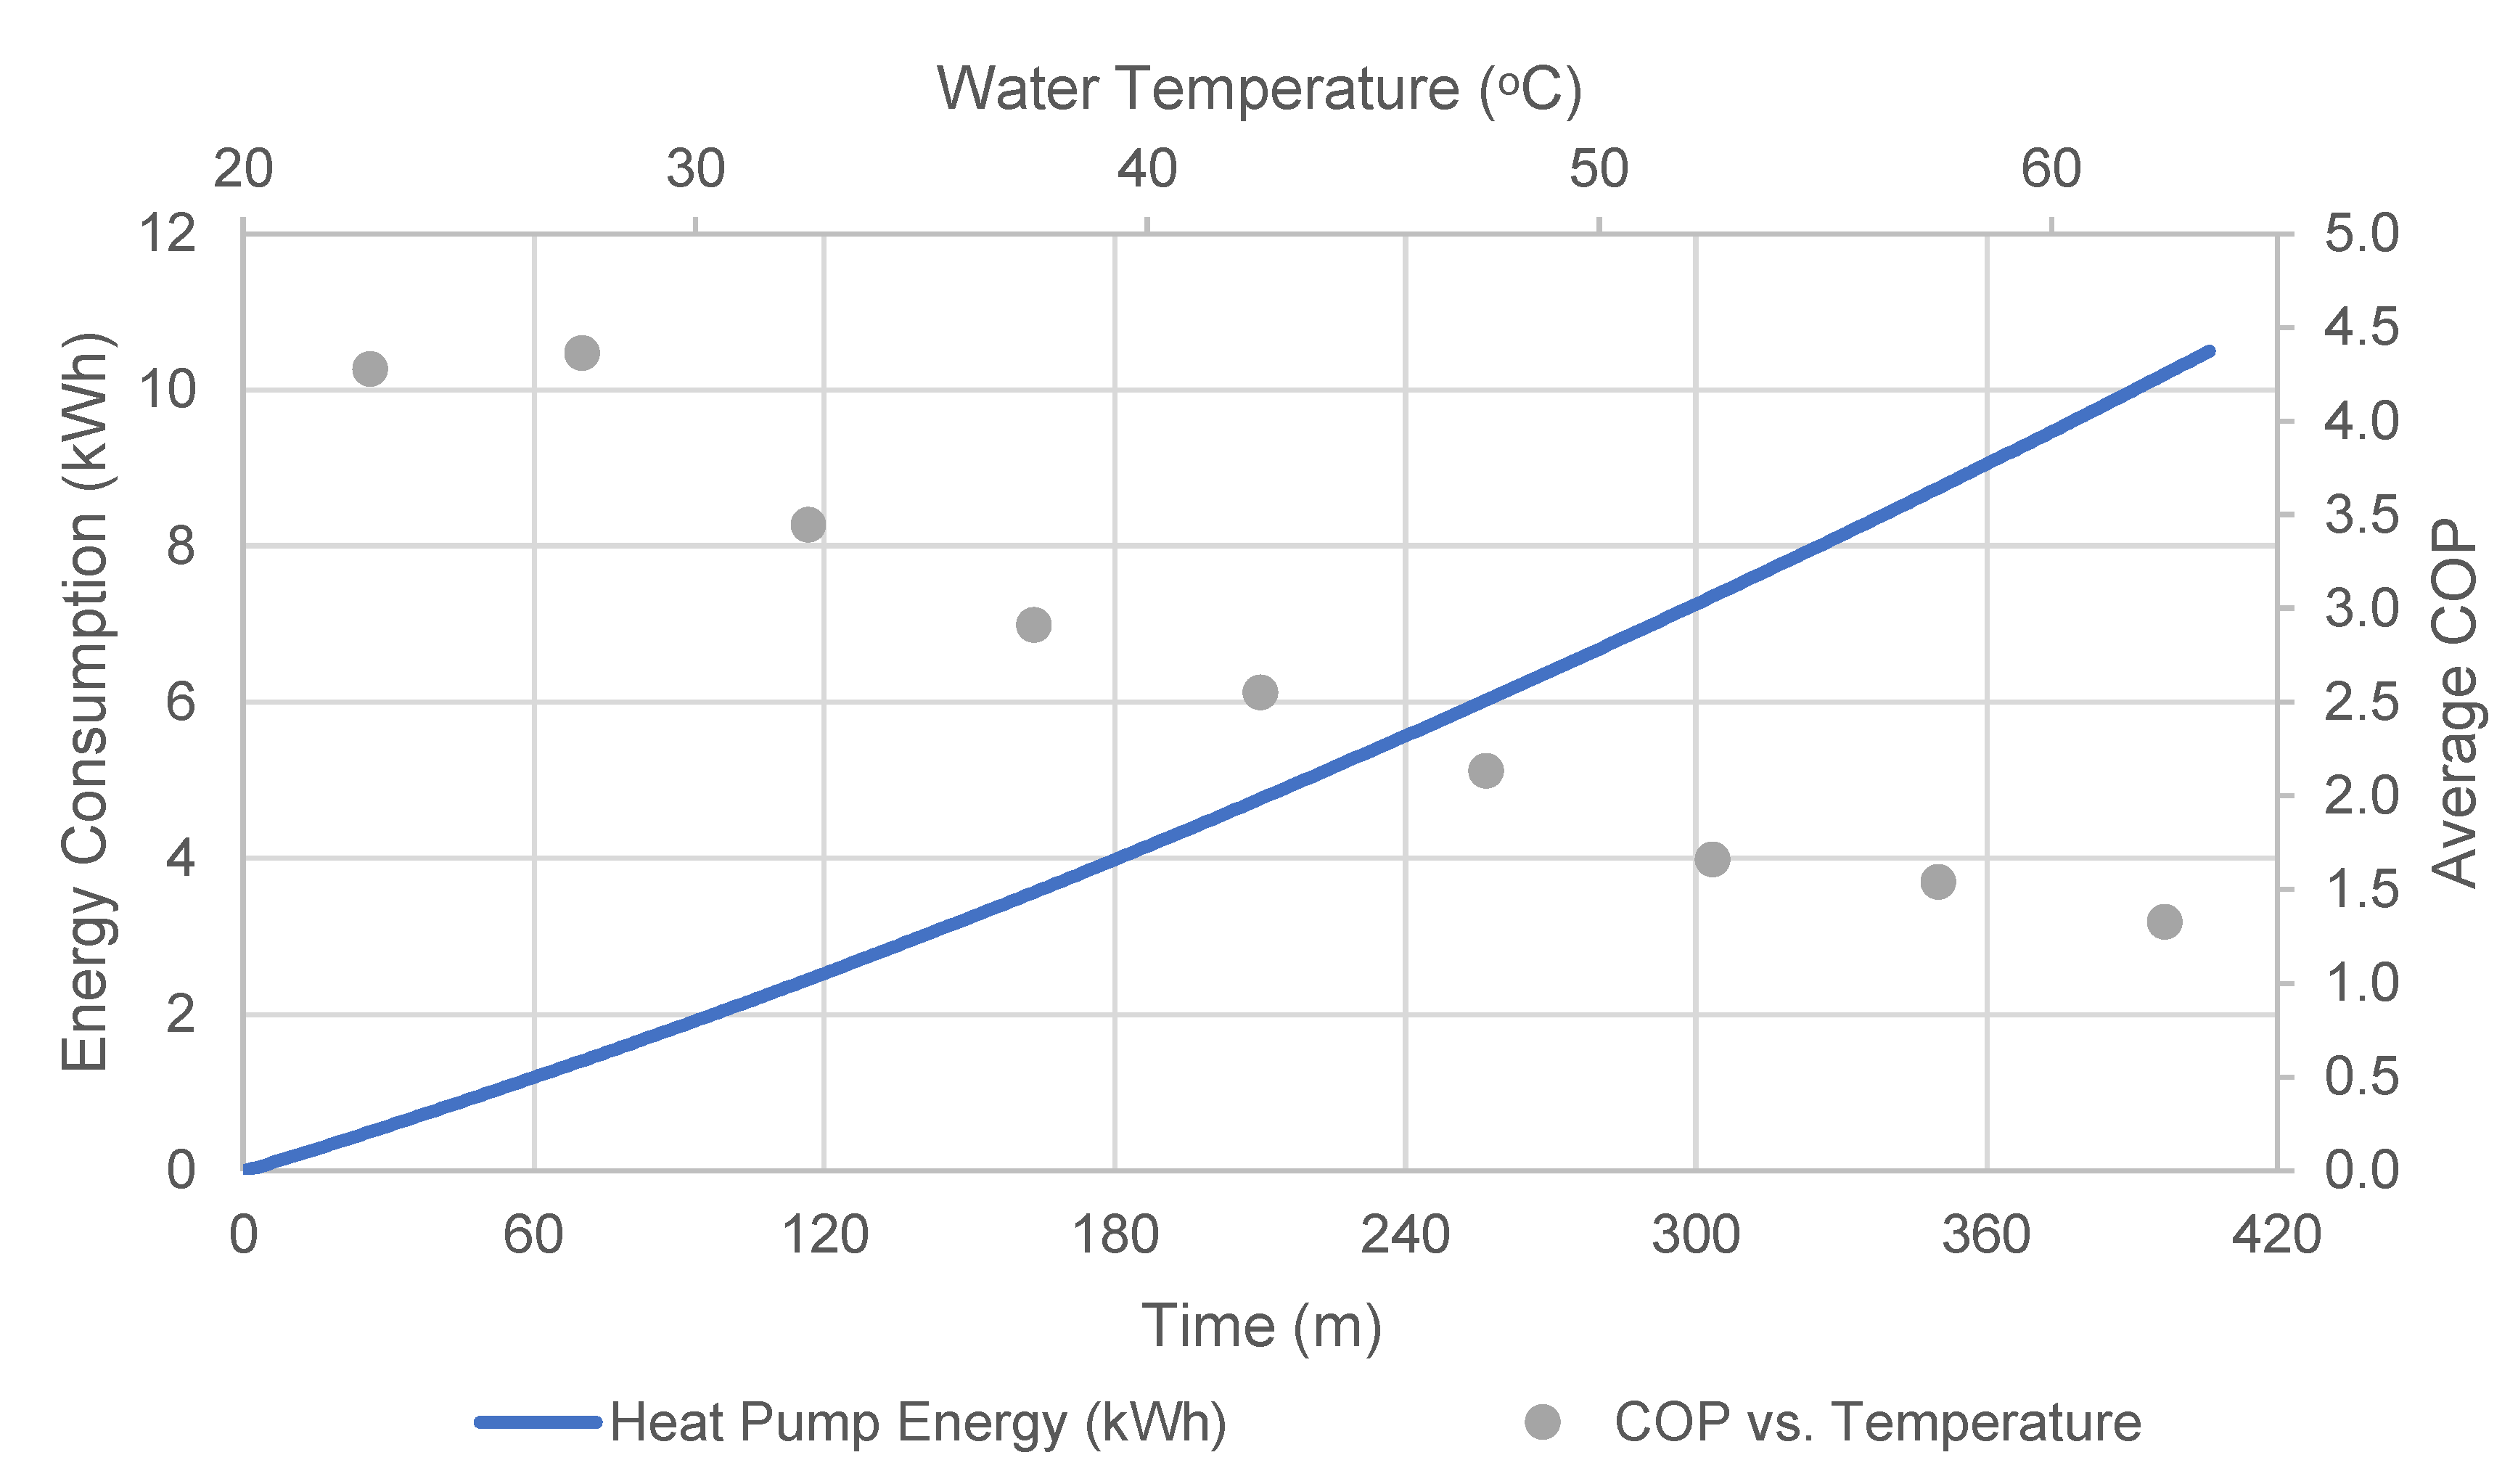
The tests carried out on the heat pump were done to benchmark its performance under normal operating conditions. The results in
Figure 6 show that the heat pump used in this test had high efficiency at lower water temperatures with a COP of 4.3 for the temperature range of 20–30 °C. The efficiency of the heat pump reduced significantly as the temperature of the water increased. This was expected, as the COP for heat pumps decreases as the discharge temperature increases. Although the heat pump is more efficient than other water heater technologies even at higher water temperatures, it is not as efficient as some of the heat pumps which were seen in the literature such as one in the study by Ibrahim et al. [
25] where the COP of the heat pump was still greater than 2.5 at temperatures around 55 °C. The COP of 2.27 for a full cycle is also at the lower end of what was seen in the literature, although most of the studies did not heat the water as high as 65 °C, which did have an impact on the results of the experiment. If the heat pump had been run to 55 °C the COP of the cycle would have been 2.66 which would be comparable with some of the studies in the review of heat pump water heaters by Hepbasli et al. [
26]. The performance of an ASHPWH is dependent on ambient temperature and humidity and therefore the COP may change throughout the year. For this reason, in cooler climates it has been seen that locating an ASHPWH indoors can improve the average COP over the year and does not affect space heating bills significantly [
27]. Some of the studies cited in that review of water heaters also began with lower initial water temperatures, which would result in a higher COP [
26]. The temperature varies by month and by storage method, but a normal range for Ireland is between 8 and 14 °C [
28]. In practice, the initial water temperature may be lower than that used in this study but do not affect the overall findings. Although the COP of the heat pump decreases significantly at higher water temperatures (see
Table 4) it would still be worth using the heat pump at these higher temperatures as the efficiency of the system is still higher than it would be with an electric water heater.
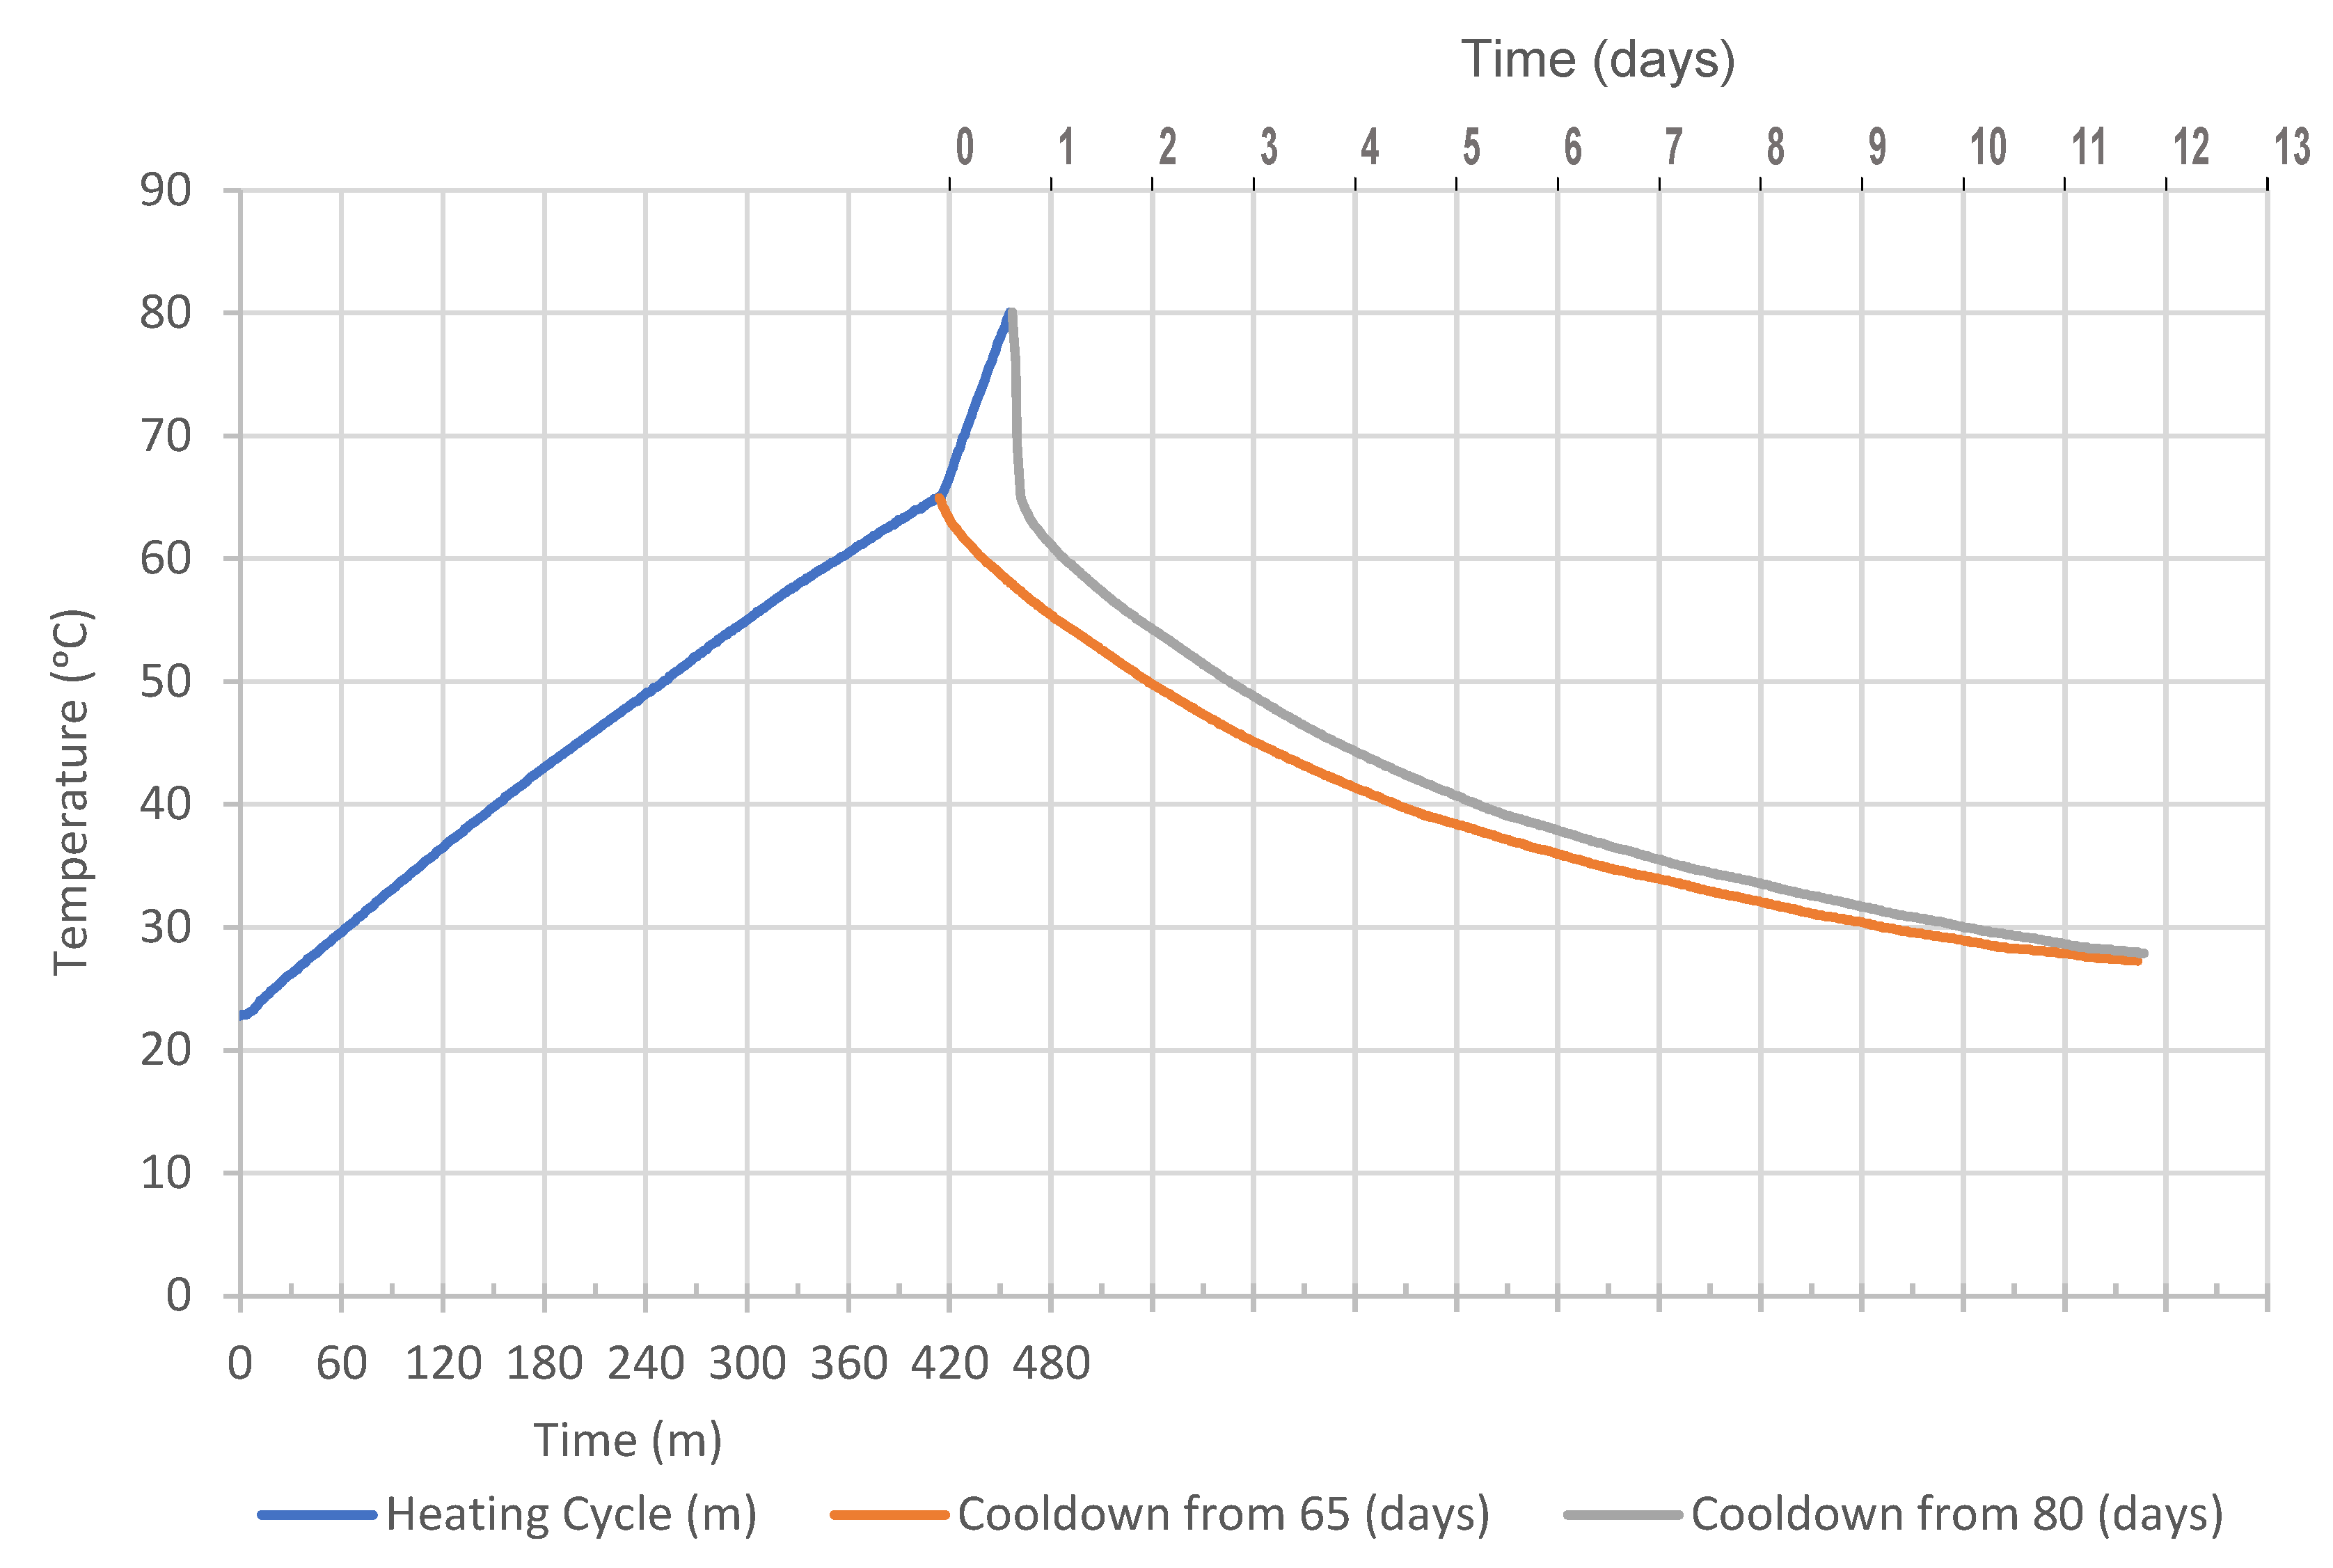
Another key performance indicator of any water-heating system is the time taken to heat the water to a given temperature. The time taken to heat the water from 20–65 °C was 6 h and 46 min. This is a significant amount of time, but it should be noted that the amount of water being heated is also quite large at 450 L. The heat pump is significantly slower to heat water than a typical gas boiler and the instant LPG instant water heater, and therefore the farmer should be aware of this and heat water in advance. The heat pump has a slow rate of temperature loss, which can be seen from the orange line in
Figure 7, and therefore in order to save energy costs, the heat pump system should be run to at least 65 °C at the night rate of electricity. The electric heaters can then be used to heat the water to useable temperatures shortly before it is needed. In comparison to the other types of water heater, a gas system would have greater heat losses as gas water-heater tanks are more difficult to insulate due to the internal combustion. The instant water heater has no standby losses, which could mean that for small farms with little water usage, such a system may be ideal. A key performance metric for energy use in water heaters is sizing. If the system is too large it usually leads to excess energy use over time. As more water is heated than needed, heat loss from the system can be quite significant and therefore this is another important factor for a farmer to consider.
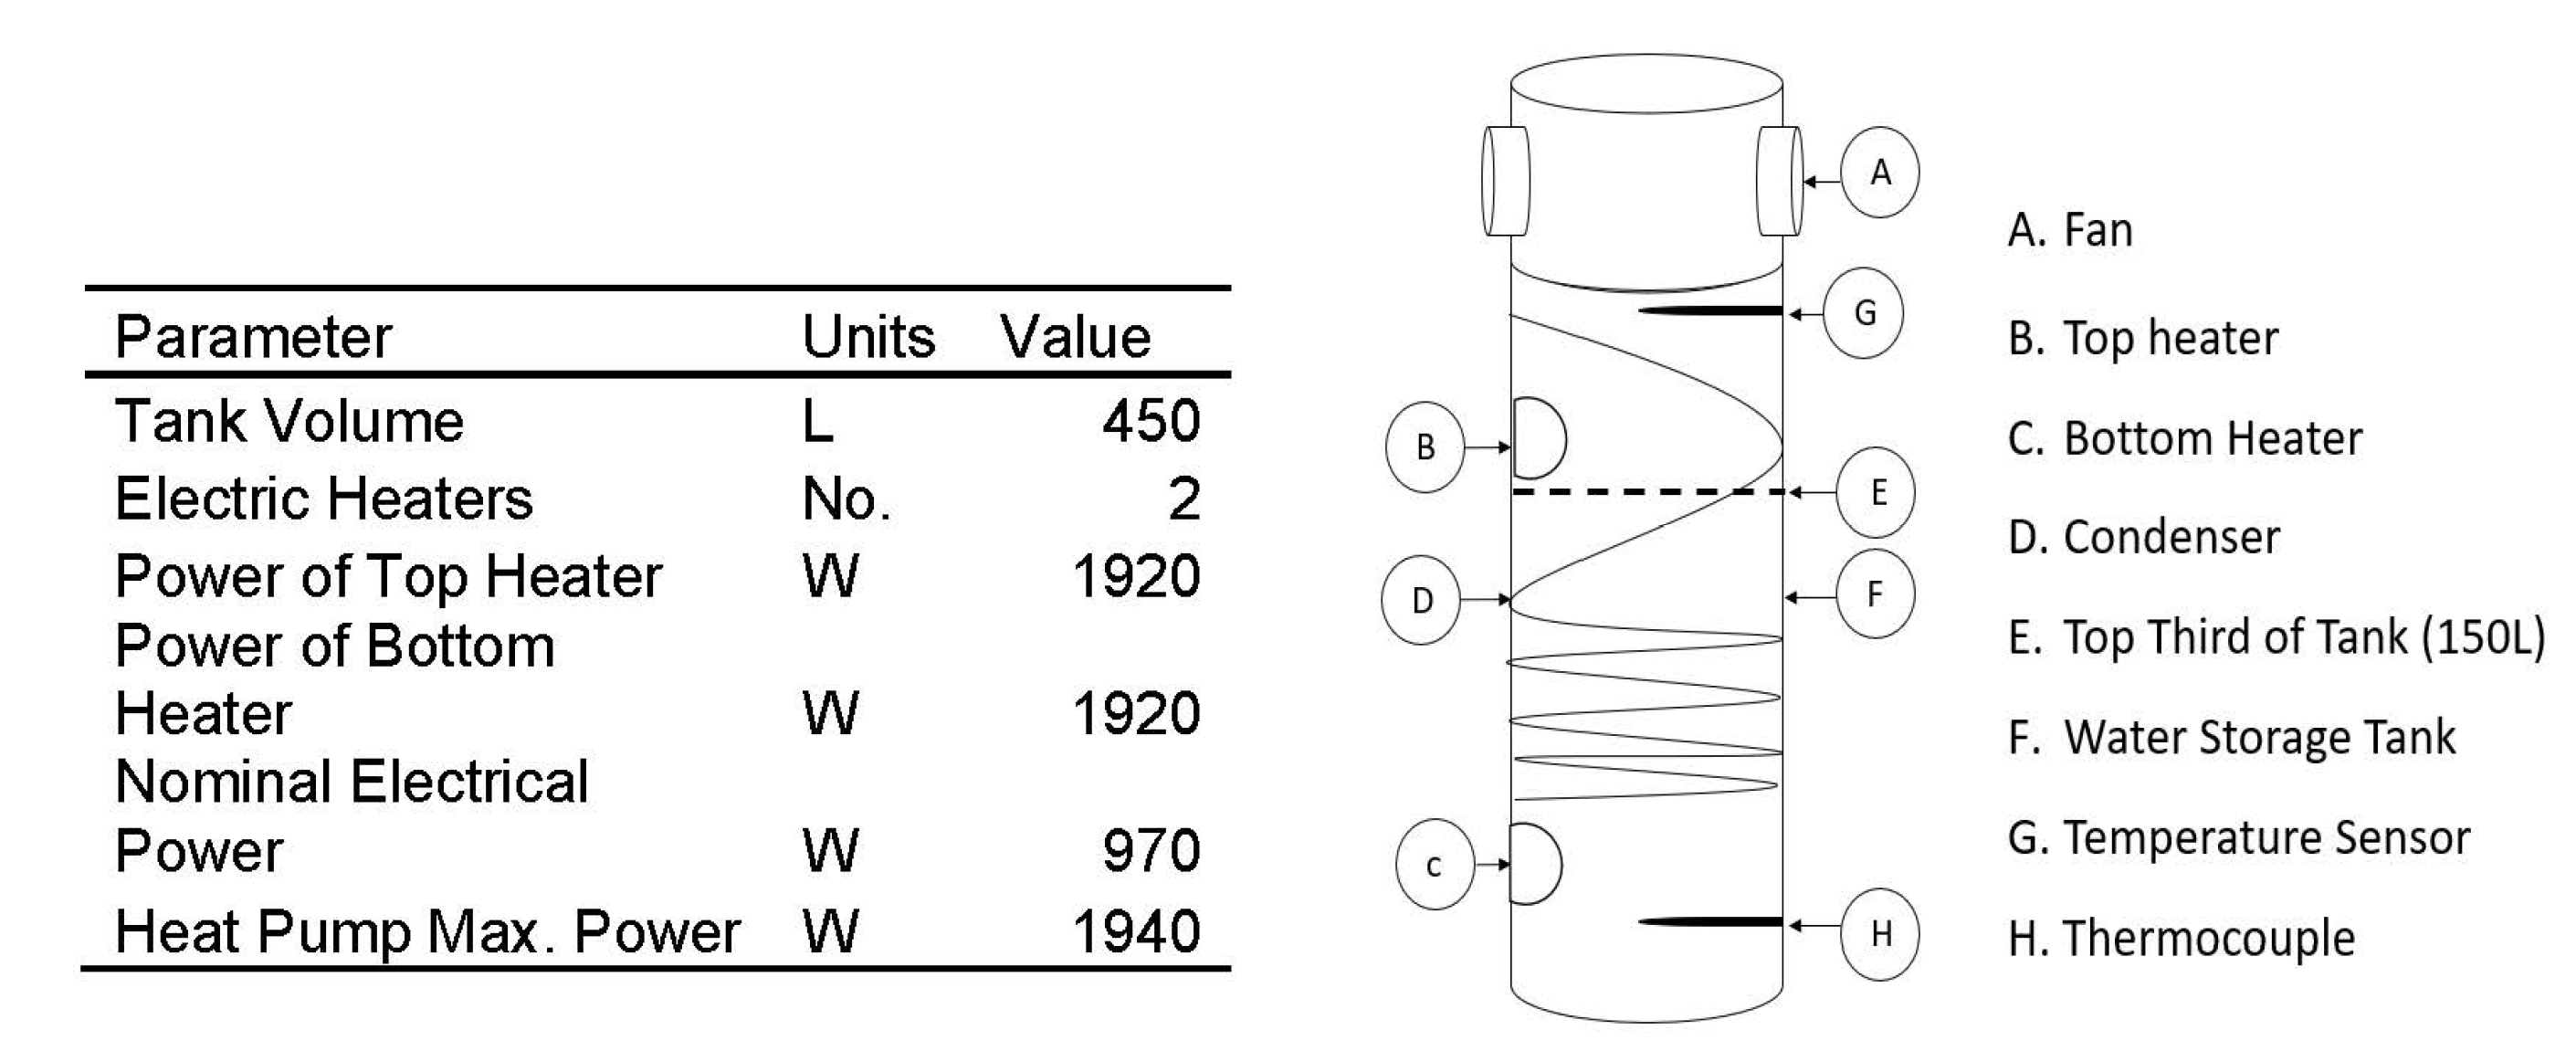
Despite the heat pump using more energy towards the end of the cycle, the rate of temperature increase falls, this means that at higher temperatures, the heat pump uses more energy and takes longer to heat the water. It should be mentioned that when the heat pump is used to heat the water, the water heats relatively uniformly. This is because the system uses a wrap-around condenser which can be seen in
Figure 5. The uniform heating of the tank was checked with a thermocouple which was placed near the bottom of the tank as seen in
Figure 5.
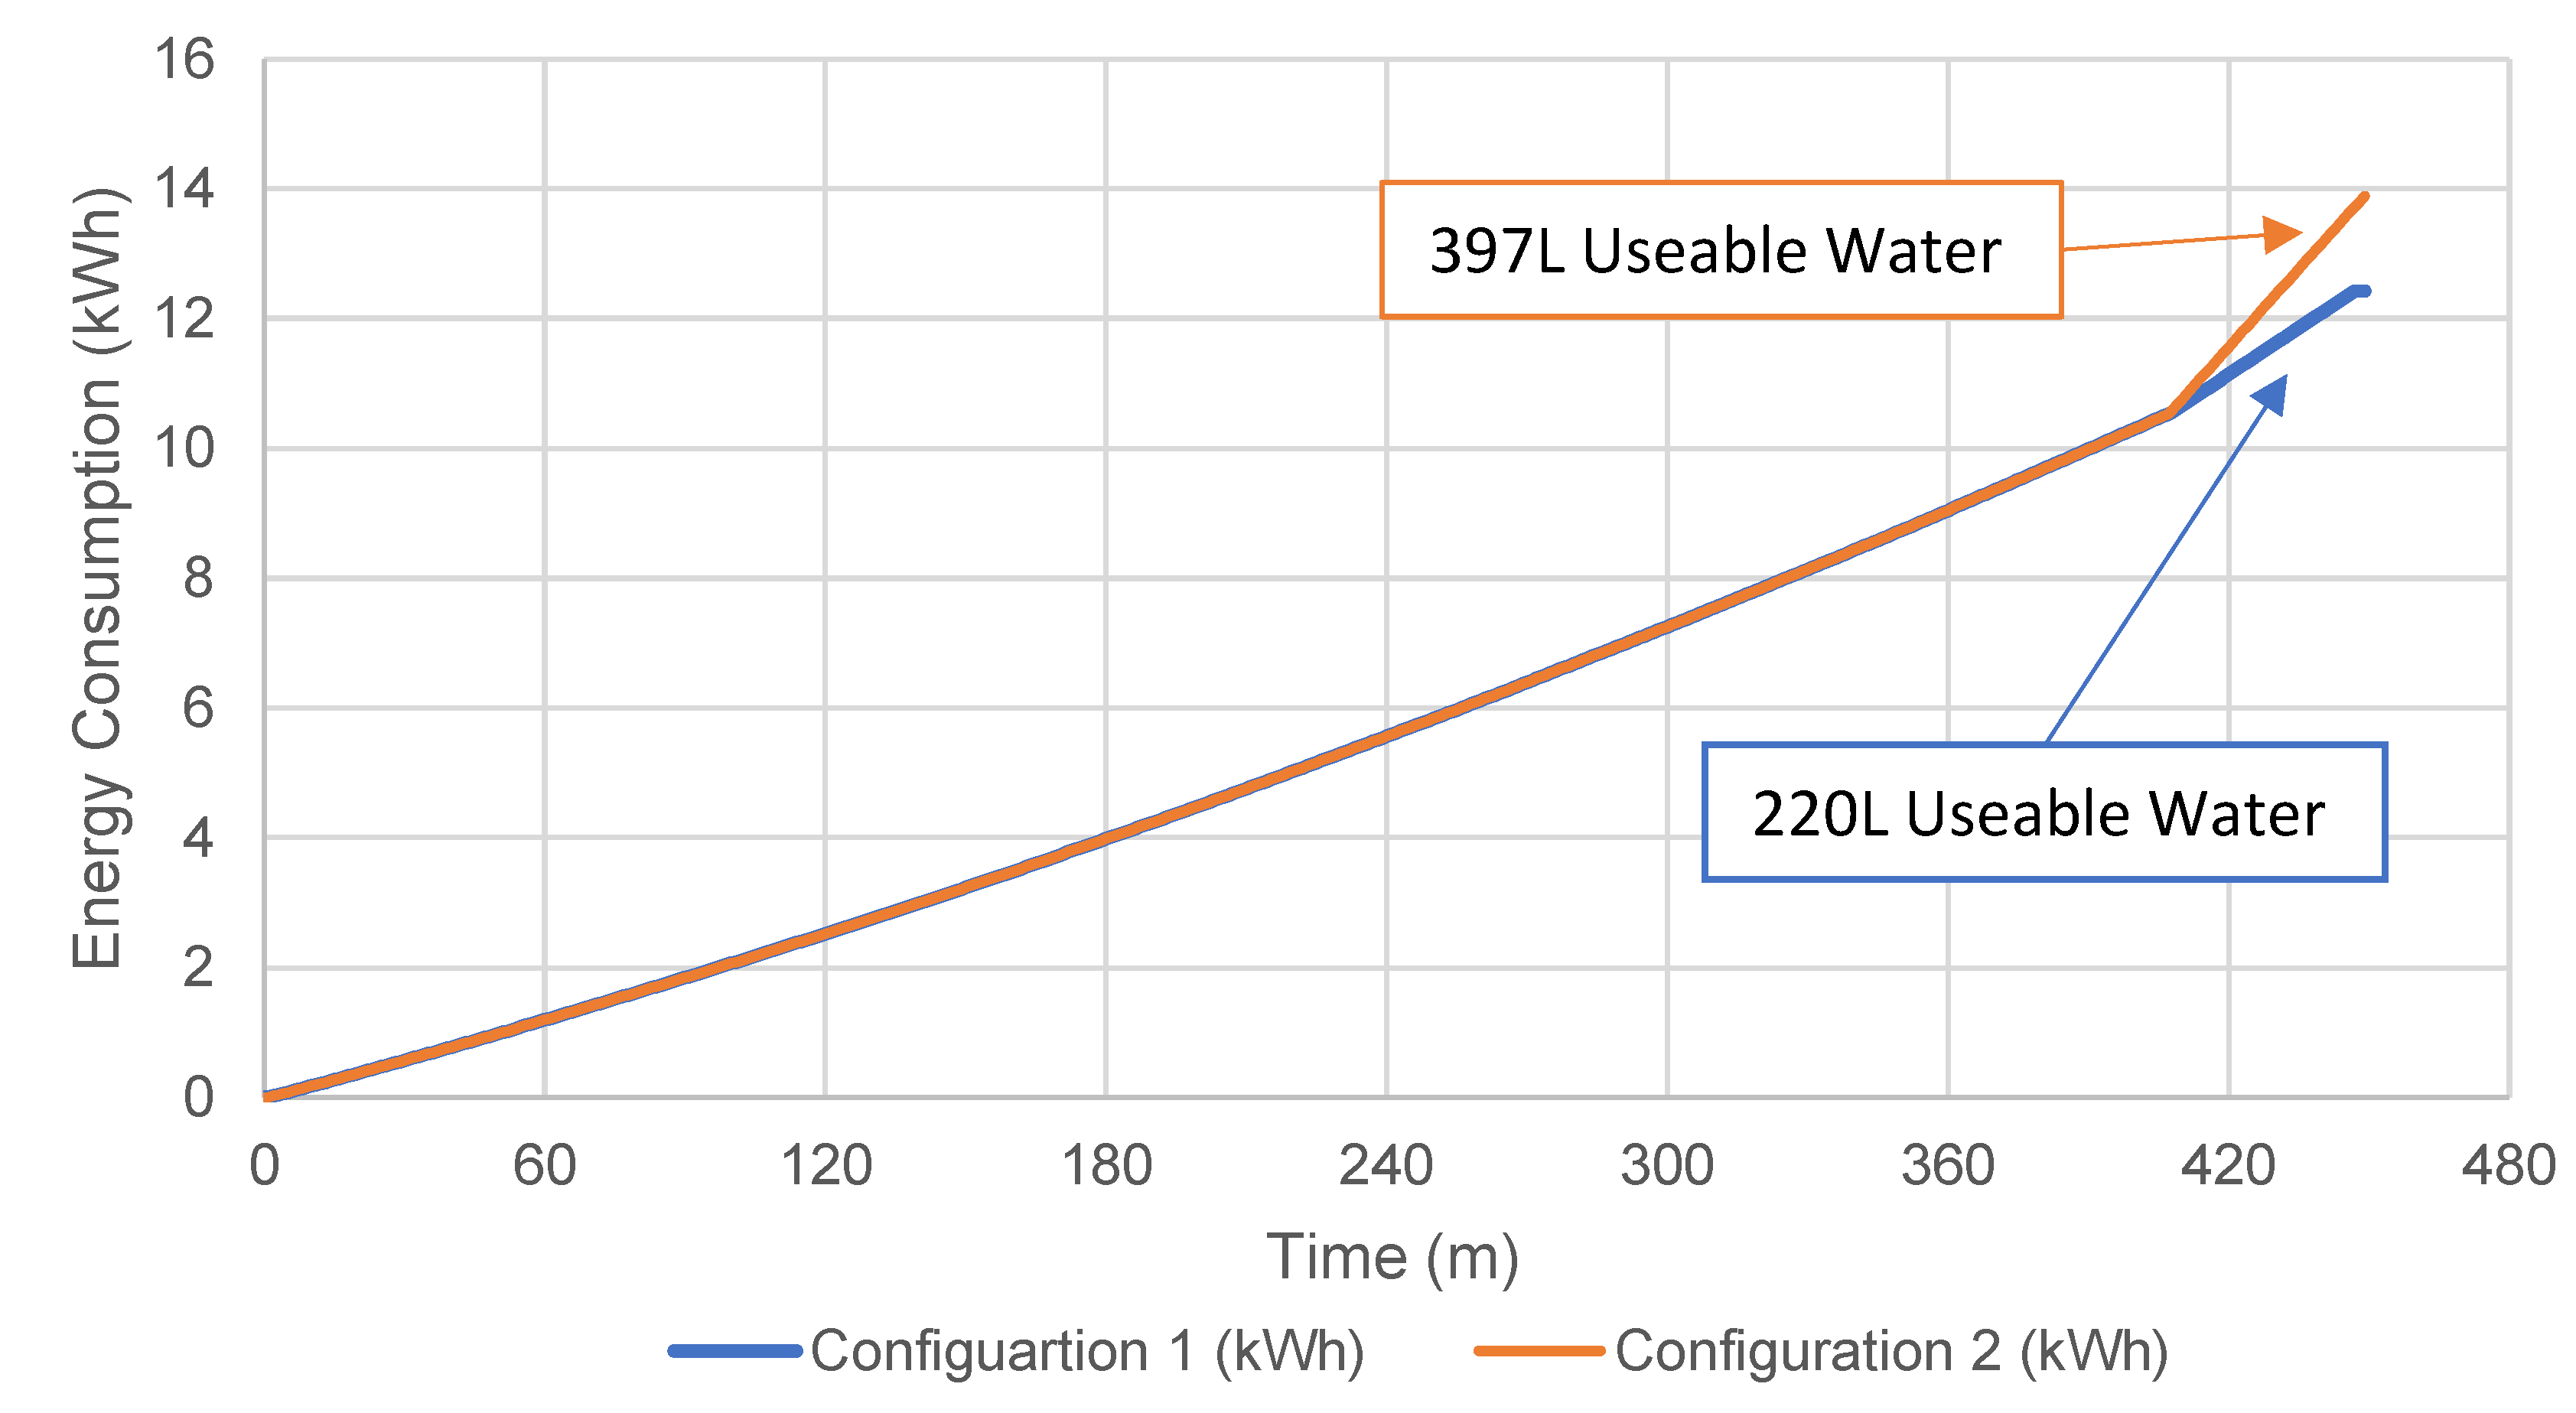
With regards to the energy used for the full cycle, the total energy when only the top heater was used was 12.4 kWh and using both heaters the energy used was 13.82 kWh, see
Table 5. This shows one potential issue with this system, which is that it will not heat the full tank to 80 °C. The top heater heats only roughly the top third of the tank due to thermal stratification, which means that 1.91 kWh of energy is required to heat the top third of the tank from 65–80 °C, see
Table 6. The energy consumption over time for both configurations is shown in
Figure 8. The system has a built-in thermostat which shuts off the system when it reaches 80 °C. This is located near the top of the tank as shown in
Figure 5 and therefore, due to the thermal stratification in the tank caused by the top heater, the whole tank is not heated to 80 °C. Thermal stratification is common in water heaters containing multiple heating elements, particularly when the tank has a large aspect ratio and is an important tool used in designing hot water tanks to reduce the need to reheat the whole tank [
29]. One way to solve this issue which would also improve the performance of the heat pump system would be to mix the water while the emersion heaters are being used, as this was noted to improve the L/kWh value in Upton’s study [
18]. This improves the performance of the system in terms of L/kWh as it ensures that the full tank is heated to the set-point temperature. The difference in quantity of useable water is large, especially when considering that only 1.42 kWh more electricity is used to heat the remaining portion of the tank. The reason for this is that the useable water temperature in this study is considered above 70 °C, and therefore only the top portion of the tank can be considered as usable water when only the top heater is used between 65 and 80 °C. The remaining energy used to heat the water to this temperature is not wasted, as the tank has a very low rate of temperature decline. As cold water enters the system, it will push the hotter water to the top of the tank, and therefore the top heater can be used again to heat this portion of the tank.
Comparison to Other Water Heaters
A system, capable of supplying up to 120 L of water at 85 °C in 10 min, is an instant water heater by LPG Flogas [
30]. The system has lower efficiency than the ASHPWH. There is no information available regarding the efficiency of the system, but as it is a gas system, an estimate of 90% efficiency has been used. A 90% efficiency will be assumed for the gas boiler also. The heat pump meanwhile has a COP of 2.27 up to 65 °C and then an electric heater of ~99% efficiency is used to heat the water to the set point temperature. The gas system however uses a less carbon intensive fuel, which is a clear advantage over the heat pump system in the current climate. One of the most obvious advantages of the gas system is that it can produce water much faster than the heat pump, which takes 7.5 h to heat 397 L of usable water from a starting temperature of 20 °C.
The other water heater compared to the heat pump system was a solar flat plate collector of 9 m
2. The method used to size the solar collector was described in the methodology section and the solar radiation information was taken from the Met Eireann website in the sunshine section [
31]. Solar systems, similar to the heat pump system used in this study do not heat the water to useable temperatures. The majority of the heating is done by the solar collector when the sun is shining but a backup heater is used to heat the water up to the desired temperature. Because a lot of the water heating will be done by the backup heater, especially in winter and in overcast conditions, it is important that the backup heater is efficient in terms of both cost and carbon emissions. Two backup heating options will be considered in this comparison. The more common option is the electric backup heater, but perhaps the more efficient and cost-effective option is a gas backup heater. Gas is cheaper per kWh and is also a cleaner source of energy than electricity. In terms of a comparison with the heat pump, both systems offer a renewable method of heating water, they both take a relatively longer time to heat water unless the backup source is used and they are both relatively expensive in comparison to the gas system. Both the heat pump and the solar system could be more cost effective using the available government grants, which would offset some of the difference in price.
First, comparing the performance of the systems with reference to their energy efficiency and their carbon intensities—
Table 7 shows the results of the calculations detailed in the comparison section of the methodology section of the report. It can be seen from
Table 7 that regarding efficiency, the heat pump has the highest efficiency in terms of L/kWh, followed by the solar with electric backup. However, the solar with gas backup is more efficient than the heat pump with respect to its carbon emissions. It contributes to 25% less emissions when compared to the heat pump.
The carbon intensity of natural gas is much less than that of the carbon intensity of electricity, which is why the solar with gas backup is less carbon intensive than the solar with electric backup. The solar with electric backup is more carbon intensive and less fuel efficient than the heat pump, which is perhaps why it was deemed an unsuitable investment option by Upton et al. [
32]. The solar with electric backup was pointed to as the most efficient option by Ibrahim et al. [
25], but this is not the case in Ireland as
Table 7 shows. In a country where the carbon intensity of electricity is lower and the solar radiation is more constant throughout the year, it is possible that the solar with electric backup could be the most efficient option.
It appears from the analysis of the results in
Table 7 that the best overall option by efficiency and carbon emissions is the solar with gas backup. The installation of this sort of solar system may be unfeasible for a lot of farmers due to high initial costs, and if this is the case the heat pump is the next best option. Because the heat pump can be installed almost anywhere, and as it has a lower initial cost it would still be a very good option. The gas system is also a good option as it compares very closely in terms of emissions with the heat pump, which may not have been expected prior to the analysis. It should be pointed out that this comparison is a high-level overview and does not go into the details that may arise, like heat loss from the tanks and variability in terms of ambient temperature and solar radiation. The heat pump is still likely to be related to less emissions over its life cycle due to the ever-decreasing carbon intensity of electricity, which fell from 635 gCO
2/kWh to 331 gCO
2/kWh from 2005 to 2020.
In terms of comparing the cost of the systems,
Table 7 shows the results of the calculations discussed. All running costs shown in
Table 7 are in euros. The cost of operating the systems per litre and per day assuming that the amount of usable water heated is 397 L per day is shown and this is extrapolated out to show the yearly cost under these conditions. It can be seen that again the solar with gas backup performs better than the heat pump, but the heat pump outperforms the other systems. If it was possible to operate the heat pump on only night rate electricity it would be 17.5% cheaper to operate than the solar with gas backup, but it is unlikely that this would be possible for dairy farmers unless there is only one milking carried out per day. Because the solar with gas backup system would be more expensive to purchase and install than the heat pump, it is possible that the heat pump would yield a better return on investment over its life cycle.
The solar with electric backup and the gas system are more expensive to operate than the heat pump and they are also less efficient and more carbon intensive than the heat pump, which means that they are probably not as good an investment idea as the heat pump. It should also be pointed out that for small farms where hot water use is less than around 200 L per day the instant gas heater could be a very good option. The overall cost difference over the year period will decrease, and as the heat pump is more expensive to purchase than the gas system it could be a better investment for the farmer.
The heat pump system offers some advantages over the water heaters traditionally used in dairy farms. Its greater efficiency and cheaper running costs should serve as motivation to implement these systems in dairy farms in Ireland and in other countries with cool temperate climates. The higher efficiency of heat pumps is such that if 25% of Irish dairy farmers switched from electric emersion heaters to heat pumps as much as 4.7 ktCO2eq. could be saved per year. This would be a saving of roughly 3.2% of total emissions from electricity use in dairy farms in Ireland. There are also some disadvantages to the system such as long heating cycle times, but the inconvenience of this can be negated by setting the system to heat water on a specific schedule to suit the milking times in the dairy farm.


