
A Model to Manage Cooperative Project Risks to Create Knowledge and Drive Sustainable Business


1
Department of Industrial Engineering, University of Beira Interior, 6201-001 Covilhã, Portugal
2
Department of Mechanical Engineering, Polytechnic Institute of Lisbon, 1959-007 Lisbon, Portugal
3
CTS Uninova, Centre of Technology and Systems, 2829-516 Caparica, Portugal
4
Department of Science and Technology, Universidade de Trás-os-Montes e Alto Douro, Quinta de Prados, 5000-801 Vila Real, Portugal
*
Authors to whom correspondence should be addressed.
Sustainability 2021, 13(11), 5798; https://0-doi-org.brum.beds.ac.uk/10.3390/su13115798
Submission received: 19 April 2021
/
Revised: 11 May 2021
/
Accepted: 19 May 2021
/
Published: 21 May 2021
(This article belongs to the Collection Project Risk Assessment and Corporate Behavior: Creating Knowledge for Sustainable Business)
Abstract
:Efficient cooperation between organizations across all the phases of a project lifecycle is a critical factor to increase the chances of project success and drive sustainable business. However, and according to research, despite the large benefits that efficient organizational cooperation provides to organizations, they are still often reluctant to engage in cooperative partnerships. The reviewed literature argues that the major reason for such a trend is due to the lack of efficient and actionable supportive models to manage organizational cooperative risks. In this work we propose a model to efficiently support the management of organizational cooperative risks in project environments. The model, MCPx (management of cooperative projects), was developed based on four critical scientific pillars, (1) project risk management, (2) cooperative networks, (3) social network analysis, and (4) business intelligence architecture, and will analyze in a quantitative way how project cooperative behaviors evolve across a bounded time period, and to which extent they can turn into a cooperative project risk (essentially potential threats). For this matter, the MCPx model will quantitatively analyze five key project cooperative behavioral dimensions, (1) communication, (2) information sharing, (3) trust, (4) problem solving and (5) decision making, which show how dynamic interactions between project stakeholders evolve across time. The implementation and functioning principles of the MCPx model are illustrated with a case study.
1. Introduction
In today’s complex, turbulent, and unpredictable business landscape, if organizations want to achieve success, meet market needs and demands, or even just survive, they must develop strategies that boost performance and innovation [1,2]. The literature argues that both innovation and performance strongly depend on how an organization’s C suit manages and motivates their employees to overcome daily challenges, such as different cultures, different time zones, different geographic locations, or different functions, while simultaneously nurturing the capacity and will to continuously learn and adapt [1,3]. The literature also shows that the adoption of an ambidextrous leadership style (characterized by the exploitation of present conditions to optimize current business model operations, while simultaneously exploring new opportunities that contribute to redefining business models by taking decisions in a pioneering, risky way) increases the chances of achieving sustainable competitive advantages [4,5]. In addition, the literature shows that the ability to work in cooperative networks in both organizational and individual levels is a critical factor for an organization to achieve success and generate actionable and unique knowledge [2,6,7,8]. In fact, the latest research in organizational theory and management argues that although individual knowledge and skills are important, the ability to work in cooperative networks is almost always twice as critical to achieve success [6,7,8].
Among several reasons, what makes organizations engage in cooperative networks with other organizations such as business partners, institutions, or universities, just to name a few, is the possibility they have to access the necessary resources (human, competencies, financial, logistic and so on) to properly respond to the increasing and complex market demands [8]. However, research shows that despite the benefits that cooperative networks can bring to organizations, such as the open innovation model [9], they are not engaging in it as much as it would be expected [10]. According to several literature reviews, the reason for such a trend is the lack of effective and efficient supportive models to manage such partnership types [8,11,12].
This work presents a heuristic model that aims at the efficient management of organizational cooperative networks, as a contribution to reduce the lack of existing supportive models to manage organizational cooperation. The proposed heuristic model, named MCPx (which stands for management of cooperative projects) was developed based on four essential scientific pillars: (1) project risk management, (2) cooperative networks, (3) social network analysis, and (4) business intelligence, as illustrated in Figure 1.
Concretely, the MCPx model quantitatively measures five key project cooperative behavioral dimensions as they emerge, develop and eventually disappear or continue within a bounded period of time, within a project social network. The five key project cooperative behavioral dimensions are: (1) communication, which identifies who communicates with whom related to project information, (2) information sharing, which identifies who shares with whom project-related information, (3) trust, which identifies who trusts whom regarding delicate project subjects, (4) problem solving, which identifies whom people go to in order to get support, advice or project-related information so that they can do their job, and (5) decision making, which identifies who usually makes decisions regarding project-related tasks and activities. Table 1 illustrates the individual contributions of each one of the four critical scientific pillars that support the development of the proposed model in this work.
1.1. Relevance and Novelty of the Conducted Research in This Work
The research conducted in this work addresses the problem of the lack of effective models to manage cooperation between organizations while they deliver projects. The research conducted in this work resulted in a heuristic model that contributes to answer the following research question: To what extent does cooperation between organizations that work together across all the phases of a project lifecycle impact project tasks and activities, and ultimately the global project outcome?
Having the research question along this line of thought, it can be concluded that the proposed model in this work directly addresses organizational cooperative project risks, namely behavioral cooperative risks, as mentioned before. The relevance of the conducted research in this work can be divided into four different dimensions.
First, and as the main objective of the research conducted in this work is the development of a heuristic model (the MCPx model), to help organizations to identify and efficiently manage cooperative project risks that may emerge as different organizations work together (cooperate) to deliver projects, by analyzing five key project cooperative behavioral dimensions across all the phases of a project lifecycle as mentioned before. This will enable organizations to clearly see how cooperation (behaviors) unfolded, and how they are unfolding, and to a certain extent predict how cooperation will evolve in the near future, based on the quantitative analysis of past collaborative initiatives. The benefit for organizations is that they can implement proactive actions (corrective or supportive measures) to reorganize and redirect cooperation to a desired level, and/or support and maintain existing cooperative behavioral patterns. This first dimension enabled by the proposed model in this work is in line with the latest research in the organizational management field that argues that first, cooperative networks supported by effective management models provide organizations strong benefits at both individual and collective levels [2,6,7,8], and second, that the adoption of a more hands-on management style (more control from the management regarding how cooperation emerges or evolves) in opposition to a more hands-off approach management style (less control from the management regarding how cooperation emerges or evolves, also known as a fix-it-as-you-go issue resolution approach), is by far more beneficial to increase the chances of success [6,15].
Second, the proposed model in this work enables organizations to quantitatively measure dynamic cooperative behaviors regarding five cooperative dimensions: (1) communication, (2) information sharing, (3) trust, (4) problem solving and (5) decision making, as mentioned before. This allows organizations not only to in a timely manner identify which behaviors may possibly turn into a risk (threats to project objectives) but also to take decisions in a more data-informed way (which are decisions that can be backed up with data that can be verified [16], instead of only relying on subjectivity (usually from senior managers) and gut feelings approaches, which, according to research, increases organizational performance and profitability [17,18].
Third, by applying the theory of social network analysis to analyze and monitor dynamic cooperative behaviors, the MCPx model is in line with the latest research in the social sciences that argues that the application of SNA metrics is by far the most appropriated technique to mirror human interaction and thus extract valuable and unique insight regarding how dynamic interactions between entities across a bounded period of time emerge and evolve [8,19,20,21,22].
Fourth, the proposed model in this work is efficiently aligned with the actual sustainability challenges and with the ongoing organizational transformation strategy and industry 4.0, according to research [23,24]. This happens as the model enables the identification of organizational cooperative behavioral patterns in a secure and timely manner supported by an intelligent system (business intelligence architecture) which automates the process of data collection, analysis, and reporting, resulting in huge resource savings. Still, this aspect contributes to solve the information modeling and processing as indicated by latest research [25]. By doing so, the proposed model in this work focuses not only on the short-term results, but also in the long-term results, enabling sustainability in organizations to turn into a holistic, consistent, and incremental growth process across time according to the following value-chain: the identification of (undesired or desired) organizational cooperative behaviors in a timely manner enables organizations to better respond to ongoing and future cooperative project challenges, which in turn optimizes allocation of necessary resources for ongoing or upcoming projects, which in turn will contribute to a leaner organizational and societal transformation, providing organizations sustainable competitive advantages in the economic, social, and environmental aspects.
1.2. Structure of the Present Work
This work is divided into seven sections. In Section 1 a brief introduction regarding the purpose of the research conducted in this work, its importance, and its relevance are presented. Section 2 presents a brief state of the art regarding the four critical scientific pillars that support the proposed model in this work. Section 3 presents the development and implementation of the proposed model in this work, where the four scientific pillars that support the proposed model will be addressed, highlighting the individual importance and contribution of each one of them to the proposed model. Section 4 presents an application case of the proposed model. Section 5 presents the major conclusions of the conducted research in this work, highlighting some of the benefits and limitations of the proposed model in this work. Section 6 presents the academic and managerial implications regarding the implementation and application of the proposed model in this work. Finally, in Section 7 we present a set of suggestions for future developments regarding the research conducted in this work.
2. Literature Review
2.1. Project Risk Management
The successful delivery of projects is critical for organizations because it is through projects, but not only, that organizations can execute their strategies, solve problems, satisfy needs, add value, capitalize on or exploit opportunities, adapt, change, learn, and innovate [2,8,13].
A project can be defined as a temporary endeavor with a defined start and end, and aims at the creation of a unique result, product, or service [13]. Project management can be defined as the application of knowledge and techniques to project activities across the different phases of a project lifecycle, aiming at the successful delivery of a project within the specific project constraints [13].
Risk management, in a general form, can be defined as a set of coordinated activities to direct and control an organization regarding risk [13,14]. Risk has two dimensions: (1) a positive dimension, usually called opportunities, and (2) a negative dimension, usually called threats [13,14]. Risk management can be defined as a combined and continuous process of decision analysis and proactive management, that should be taken as an integrative part of the organizational governance, design, structure, strategy, change, and culture of an organization [26,27]. Still, risk management should be supported, incentivized, and not policed, by internal or external experts to the organization [26,27].
Putting together the definition of project management and risk management, we can define project risk management. Project risk management results from the intersection between project management and risk management and can be characterized by the introduction of the best practices and standards regarding risk management into project management [28]. From this intersection new project risks types emerge. According to [28] there are four major project risks that result from the intersection between project management and risk management. They are: event risk, variability risk, ambiguity risk, and emergent risk. They are illustrated in Table 2.
Beyond the four major project risks types proposed by [28], research identifies also other risks in project management, such as cooperative risks that can emerge as organizations work together to deliver projects [29]. According to [29], such cooperative project risks can be classified in three different dimensions. They are: (1) behavioral risks, which represent risks related to the different types of relationships that are established between the different organizations or entities while they work together (cooperate) to deliver a project, (2) risk of assigning tasks to partners, which represent risks that result from how project tasks and activities are distributed by different organizations or network partners, and (3) risk of critical enterprises, which represents risks that are associated with cooperative network members who have exclusive competencies or resources.
The proposed model in this work will specifically address the behavioral risks in project management environments, which can be characterized by the way that different project stakeholders interact (exchange project-related emails, exchange project-related information, search for advice or support related to project matters, or general communication, just to name a few) within a bounded period of time (usually a project lifecycle phase). More concretely and as mentioned before, such behavioral risks will be identified and characterized by analyzing the five key project cooperative behavioral dimensions: (1) communication, (2) information sharing, (3) trust, (4) problem solving, and (5) decision making.
2.2. Cooperative Networks
The cooperative form of business has been around for more than 150 years [30]. However, this form of doing business has never remained constant throughout the years, varying between economic sectors, countries, and cultures [30]. Effective cooperation between organizations contributes to a higher ability to adapt to changes in the environment where they exist, enables a strategic position concerning inter-organizational networks, and assures flexibility when facing changes in the environment [31].
Cooperative networks can be defined as networks that comprise a variety of entities such as organizations, groups, people, or others, that exchange information, adjust activities, and share resources for the achievement of compatible goals [11]. For example, in a traditional supply chain network based on client–supplier where the interactions are coordinated with each other, there is in most cases no common goal, rather mutual benefits and a common plan which often is designed by a single entity [11]. Still, this form of doing business implies a certain division of labor among participants where the resulting aggregated value comes from the sum of a quasi-independent manner from individual value-generated contributions [11]. According to research [11,30,32], efficient organizational cooperative networks strongly depend on factors such as the reliance of the cooperative on reciprocity (information that is exchange in both directions between any two organizations), trust and interlocking directorates (where a member of one organization’s board of directors also serves on another organization’s board or within another organization’s management positions).
In this work the factors that characterize cooperative networks (aggregated value coming from the sum of individual contributions, reciprocity, trust, and more) will be addressed by the MCPx model. Such factors will be addressed as the MCPx model analysis of how the different project stakeholders interact by analyzing the already mentioned five key cooperative behavioral dimensions, which mirror some of the factors that characterize the form of joint work named cooperative networks.
2.3. Social Network Analysis in Organizations
Social network analysis (SNA) can be defined as a theoretical framework for modelling dynamic interactions between entities (persons, groups, organizations, and so on), that reveal how social structures emerge, evolve, disappear, and influence individual behaviors and vice versa across a period of time [20,21,33]. SNA quantitatively describes social structures by analyzing the interactions of entities that are within a given social structure (social network) [20,21]. In SNA entities are conceptualized as nodes or dots which in turn are linked by edges that represent their interactions [20,21,33]. The result of the conceptualization is a graph (social network) that is then analyzed using network-theoretic concepts also known as SNA metrics or measures [20,21,33]. SNA plays a critical role in understanding social capital challenges, and therefore is being continuously incorporated into organizational risk management departments as a supportive tool for decision making and risk analysis [8,34].
In project management the application of SNA has been growing in popularity within the latest years, essentially because it enables people to understand in a quantitatively way the extent to which project people and project organization behaviors impact on performance, innovation, social cohesion, information diffusion, trust, and so on [20,21]. Still, SNA in project management can be applied to study cooperation, collective and individual performance, cultural fit, unethical behavior, and fraud, just to name a few [35].
Across the reviewed literature there are many successful cases of the application of SNA in project management. For example, researchers applied SNA to identify key cooperative networks that emerge as organizations work together while delivering projects [8,19,20,21,36]. Some of them are as follows: (1) communication network (identifies who talks to whom regarding work-related matters), (2) advice network (identifies the people to whom others turn to, to get information to get their job done), and (3) trust network (identifies who shares project-related delicate information with whom).
Cross and Parker [36] applied SNA in organizations to study how dynamic cooperation emerges, evolves, and disappears as different organizations work together while delivering a project, and identified a set of key informal roles that exist within a cooperative network regardless of an organization’s structure or industry type. They are: (1) central connectors (represents central people or organizations that too many rely on for help, advise, trust, or other), (2) boundary spanners (represents people that connect different organizational pockets or departments, which sometimes are also called of information brokers), (3) peripheral people (represents experts, or isolated people or organizations, which may either be a SME (subject matter expert) with unique exerts, or a mis-fitted person or organization), and (4) energizers (represents people or organizations that energize a group or the complete cooperative network).
Researchers such as [20,21,37] suggest that social network centrality metrics such as in-degree, out-degree, average degree, betweenness degree, closeness degree, and eigenvector, are among most meaningful SNA centrality metrics that can be applied in organizations to identify valuable and unique insights, regarding how dynamic cooperation evolves across time.
Furthermore, they argue that the application of SNA centrality metrics in the analysis of dynamic cooperative networks are the ones that enable us to get unique insights, unlike traditional tools or techniques [2,8,20,21]. According to the reviewed literature, centrality in a social cooperative network refers to the structural location of a given entity within a network, and can be a measure of an entity’s influence, importance, control, and prestige [20,21,37]. Research shows that. for example, both in and out degrees can be an index of potential for the network’s activity, betweenness can be an index of communication control by bridging two different subgroups of a network, and closeness can be an index of the potential independence from network control [2,8,38,39].
Centrality is associated with the mix of formal and informal power within a cooperative social network [2,8,38,39]. This happens because according to several pieces of research, it is extremely difficult or impossible to distinguish formal from informal networks of cooperation within an organization [2,8,20]. All previous mentioned centrality metrics, but not only those, quantitatively capture an amount of a certain cooperative behaviors that ultimately will impact on project activities, objectives, and outcomes (success or failure) and therefore should not be neglected [2,8].
In this work the application of SNA will quantitatively measure the mix of formal and informal cooperative networks which will enable the characterization of the five key project cooperative behavioral dimensions ((1) communication, (2) information sharing, (3) trust, (4) problem solving, and (5) decision making). More concretely, the characterization of the five key project cooperative behavioral dimensions will be done by the application of SNA centrality metrics such as weighted total-degree, average weighted, total-degree, in-degree, and average in-degree.
2.4. Business INTELLIGENCE in Organizations
Business intelligence (BI) can be defined as a set of strategies, concepts, methods, and technologies that are applied by organizations for the data analysis of business information to improve business decision-making processes [39,40,41,42]. A typical BI architecture comprises a set of tools, methodologies, systematic processes, and frameworks, that collect, analyze, and transform—from both, internal and external sources—data into insightful, valuable, actionable, and meaningful information, which organizations can use to understand past, actual, and future business trends such as consumer behavioral patterns, or to efficiently support organizations in strategic decision-making processes [40,41,42]. An efficient BI architecture implies a dynamic organizational interconnected communication network, where information that is produced or acquired (both internal and external regarding sales, finance, human resources, engineering, marketing, just to name a few) can be easily accessed and readable [42]. Figure 2 illustrates a typical business intelligence architecture.
The process starts from left to right according to the arrows of the flow diagram, and goes across some of the major components such as data sources, data management systems, data warehouses, business analytics tools and techniques, and reporting or visualization tools and techniques.
The working process of the typical BI architecture displayed in Figure 2 goes as follows: First, data are collected from a given data source such as sales or finance departments, ERP systems, CRM systems, single files, or engineering departments. Second, collected information undergoes a data treatment process which very often is called ETL (extract, transform, and load data process). In this process, collected data from the most varied data sources are cleaned and transformed into a readable format according to user needs. Third, treated data are stored in data warehouses, which are considered as the BI component’s heart. A data warehouse is built with the purpose to serve the data analysis and reporting components, where only data from the ETL process are loaded [42]. Data warehouses are built on normalization standards, which are efficient for transactional systems [41,42]. For example, a normalization could be used to reduce redundancy and increase performance of queries for reports and analytics. BI systems and tools make use of data warehouses as sources of information to generate reposts and analysis. Fourth, collected, treated, and stored data will be qualitatively and quantitatively analyzed by the application of statistics and mathematical analytical tools and techniques. In this step three types of analytics are common [43]. The first, descriptive analytics, comprises the process of analyzing the past data. This means analyzing data from sales, marketing, or other areas, that were collected, treated, and stored into a data warehouse. The purpose of this first analysis is to understand what happened, or in other words, to identify the root causes for occurred business outputs and outcomes. The second, predictive analysis, concerns the process of estimating the likelihood of future business outputs and outcomes based on the analysis of past data. It is also known as a trend analysis [41,42]. The third, prescriptive analytics, concerns the process of finding ways and means to take advantage of findings acquired in the previous two analytical processes, and generate predictions about future events or trends. This process is usually carried out by using simulation techniques based on inferential statistic and computerization techniques [40]. Finally, the reporting and visualization BI system outputs information that can be readable in an efficient way enabling the connection of analyzed data to business strategies. In this stage, the results of the data analytics process can be visualized through several different methods such as strategic and tactical dashboards, scorecards, CSFs (critical success factors), KPIs (key performance indicators), and detailed or consolidated reports [42]. The proposed model in this work comprises the incorporation of a typical BI architecture in an automatic, efficient, accurate and timely manner to collect, prepare, transform, and analyze cooperative project data that mirror cooperative dynamic behaviors within a project social network, that takes place across the different phases of a given project lifecycle.
3. Model Development and Implementation
3.1. Model Development
As previously mentioned, the proposed model in this work developed based on four critical scientific pillars ((1) project risk management, (2) cooperative networks, (3) social network analysis, and (4) business intelligence), will analyze in a quantitative way how five key project cooperative behavioral dimensions ((1) communication, (2) information sharing, (3) trust, (4) problem solving and (5) decision making) emerge and evolve across the different phases of a project lifecycle, as different organizations work together to deliver cooperative projects. The four critical scientific pillars that support the development of the model proposed in this work are illustrated in Figure 3.
Figure 3 illustrates the four critical scientific pillars that support the development of the proposed model in this work: (1) project risk management (a), (2) cooperative networks (b), (3) social network analysis (c), and (4) business intelligence (d). A brief explanation of each of them is as follows:
Project Risk Management (Figure 3a)—this pillar can be divided into two sub-pillars: project management and risk management. The project management field provides the proposed model in this work with the definitions and structure of a typical project according to the Project Management Institute (PMI) [13]. These include the definition of a project, project phases, project lifecycle, project specific attributes and features, and so on. The risk management field provides the proposed model in this work with the definitions and approaches regarding the risk management standard processes according to the International Organization for Standardization (ISO) [14]. It covers the process of identifying, analyzing, measuring, treating, monitoring, and updating project risks. The risk management sub-pillar still contributes with three project major risks types that may emerge as organizations work together to deliver projects, as proposed by [29] (Figure 3a). They are: (1) pure risk or uncertainty, (2) project risks, and (3) cooperative risks. In this work, the cooperative risks will be addressed as the major project risk type, and in particular the behavioral risk types as illustrated in Figure 3a. As mentioned before, behavioral risk types are related to the types of dynamic relationships that are established between the different project partners across the delivery of a project.
Cooperative Networks (Figure 3b)—this pillar contributes the definitions, key factors that determine and define cooperation, and the importance of cooperation between organizations to achieve project success. As illustrated in Figure 3b, this pillar contributes to the translation from the official dynamic interactions from the upper layer where cooperation exists between organizations (which represents contractual relationships) into visible and measurable dynamic interactions that truly mirror the different interactions, behaviors, and dependencies among organizations that deliver projects in cooperative networks.
Social Network Analysis (Figure 3c)—this pillar contributes the tools and techniques to quantitatively analyze dynamic behavioral interactive data that takes place across the different phases of a project lifecycle as project stakeholders (people, groups or organizations) work together to deliver projects. SNA centrality metrics developed based on the graph theory (Figure 3c) are applied to quantify the five key project cooperative behavioral dimensions ((1) communication, (2) information sharing, (3) trust, (4) problem solving and (5) decision making), that evolve across all the different phases of a cooperative project lifecycle. This pillar provides the proposed model in this work the SNA centrality metrics such as in-degree, out-degree, total-degree, and total weighted-degree [37] which will quantify the five key project cooperative behavioral dimensions. Once the five key project cooperative behavioral dimensions have been quantified, conclusions regarding cooperative project behavioral risks can be outdrawn together with a social network analyst or with a project responsible team.
Business Intelligence (Figure 3d)—this pillar contributes the strategies and technologies, that organizations can use to analyze business information data and get unique and actionable business insight. This pillar provides the proposed model in this work the implementation steps of a typical organizational BI architecture, as well as the dynamic articulation between the different stages of data analysis, namely in three mentioned analysis types: (1) descriptive analyses (which, referring to data analysis, aims to answer questions such as what happened? how did we get here?), (2) predictive analysis (which based on analyzed data aims to answer questions such as where are we possibly heading to? what will happen in the future according to a given trend?), and (3) prescriptive analysis (which based on the other two analysis, aims to answer questions such as what should we do to get to a certain target?).
As previously mentioned, the proposed model in this work quantitatively analyses five key project cooperative behavioral dimensions that emerge and evolve as projects are being delivered by the joint work (cooperation) of different organizations.
To map, quantify, and analyze each one of the five key project cooperative behavioral dimensions-specific data, specific SNA centrality metrics are required as illustrated in Table 3. Table 3 illustrates the five key project cooperative behavioral dimensions (D1 to D5), the data sources for each of the five key project cooperative behavioral dimensions, the objectives of each of the five dimensions, and the SNA centrality metrics that are applied to quantify the five key project cooperative behavioral dimensions.
The required data to map and analyze the five key project cooperative behavioral dimensions will be collected by two methods: (1) cooperative project-related exchanged emails, and (2) cooperative project strategic surveys. The first method concerns the collection of information project-related emails within a given interval between t_1 and t_n, within a given project lifecycle. The second method concerns the collection of project-related information through the launching of a SNA strategic survey to all the cooperative project stakeholders that take part in the delivery of a cooperative project. The questions in the survey are not pre-determined, however they must capture valuable and unique information that enables the mapping of the different cooperative dimensions or networks. The questions are to be decided by a network analyst or the project responsible team. For example, regarding the information-sharing dimension (D1), one possible question could be, to whom do you go to get project-related activities or tasks information? Or, with whom do you share project-related information with on a daily basis? For example, for the decision-making dimension (D4) one possible question could be, who decides what to do regarding your project tasks or activities? Or, whom do you go to get approval regarding your project tasks or activities?
As it can be seen in Table 3 for each of the five key project cooperative behavioral dimensions, two SNA centrality metrics will be applied. For D1, the first metric concerns the identification of who is more or less central within a given project cooperative dimension, and the second metric concerns the evolution of a given dimension across the different phases of a project lifecycle by analyzing the average results of the cooperative project social network of the first metric applied. For example, for D1, the first metric is the weighted total-degree. This metric is non-directional (it does not matter who sends what to whom or who received what from whom) and maps the email communication channels within a cooperative project social network, and the number of emails that are comprised in each one of the email communication channels. For example, if a cooperative project social network has 7 organizations that work together in a given project lifecycle the n = to 7, which represents the number of organizations. If for example, project-related emails have only have been exchanged between organizations 1, 2, and 3, the number of email communication channels will be three (xji). This represents the number of links as illustrated in Table 3. The number of project-related exchanged emails within each of the three email communication channels, will give the respective weight of each communication channel. For example, if in the email communication channel 1 there were exchanged 50 project-related emails, then the weight of this email communication channel would be 50. For D1, the second metric, average weighted total-degree, is the simple average from the results of applying metric 1, weighted total-degree. For D2, the first metric, in-degree, regards the identification of who is more or less central in the information sharing network within the cooperative project social network. This metric is a directional metric, and takes into consideration the direction of the links from j to i, which in this case represents a preference or choice. For example, to map this network the required data arrives through a cooperative project survey that is launched to all entities (people, groups, or organizations) that are involved in the delivery of a cooperative project. The survey contains one or more questions that strategically target the required data to match the information sharing network. There are many different ways to formulate a question in such cases. For example, in this case the question could be: to whom do you go to get project-related information that helps you to do your work? Or still, with whom do you share with critical project-related information? The question could be still more specifically formulated, and target a specific subject as, for example: with whom do you share critical project-related information related to activity [name of activity]? Once data regarding the answer of the cooperative strategic project survey are collected, the information-sharing network can be mapped. In this case, each project stakeholder has nominated one or more project stakeholders as being the one that they share information with, or go to to get information from. Each given nomination from a project stakeholder to another project stakeholder is an outgoing link towards the nominee, where in turn, the nominee gains an in-link, which in other words, represents an in-degree of value 1. For D2, the second metric, average in- degree, is the average of the total number of in-links of each one of the cooperative project stakeholders, that were nominated in the information-sharing network. The same principle is applied for dimensions D3, D4, and D5, as illustrated in Table 3.
3.2. Model Implementation
The implementation of the MCPx model adopts the PMI´s project structure and definitions as is illustrated in Figure 4. Figure 4 illustrates a generic cooperative project lifecycle according to the PMI [13] project management standards, which is constituted by several different project phases that range from phase I up to phase n.
In each project phase are defined a set of project times that range from t_1 to t_n. The number of project times t is totally customizable and represent the times where project data are collected and analyzed. As mentioned before, data sources are exchanged project emails and strategic project surveys, as is illustrated in Figure 4 in grey and blue boxes, respectively. For example, in phase I two project times are defined as t_1 to t_2. For t_1, in the emails row, the graph or network inside the yellow box represents a given email communication network. In this case there are four different organizations, O1, O2, O3, and On. The links between the four organizations represent the number of mails that have been exchanged between the four organization within the period from t_1-1 and t_1. The links between organizations are weighted links and must be interpreted with the help of the legend illustrated at the right side of Figure 4. For example, between organization O1 and O2, the link represents a level 2 link. The levels in the legend of Figure 4 represent a quantity class of project exchanged emails, which also is fully customizable. For example, in phase I, between organizations O2 and On, in time t_1 in the emails row, there is no link between them. This means that within the period from t_1-1 and t_1, no project emails were exchanged between these two organizations. The links in the email communication network are undirected links. This means that the links have no particular direction. It means only that there have been emails sent from O1 to O2, and/or from O2 to O1.
Still in phase I in the survey row in project time t_1 is represented by the survey network. This network is a directed network, which means that the links between the different organizations have a direction. It means that the links are born of a function of nominations from one organization to another organization or organizations. For example, O1 has two in-links that come from organizations O3 and On. This means that for a given survey question launched, organizations O3 and On nominated O1.
For example, if the survey question was ‘from whom do you go to get advice or support regarding project tasks or activities?’, it would mean that organizations O3 and On have nominated O1 as the organization to go to in order to get support or advice for their project tasks and activities. In the case illustrated in the survey row for t_1, applying (3), the in-degree metric according to Table 3, organization O1 would get a value of two for the in-degree metric, and all the remaining organizations would get a value of one for the in-degree metric. This process is to be repeated in all the project times t_n, in all the different phases of a project lifecycle.
As mentioned before, the proposed model in this work is incorporated into a typical business intelligence architecture, in order to automatize and enhance the capabilities of the above illustrated process (which fairly describes the proposed model in this work). The integration of the proposed model in this work into a typical organizational BI architecture is illustrated in Figure 5.
Figure 5 illustrates a typical organizational business intelligence architecture adapted from [40,41,42], and the respective integration of the proposed model in this work illustrated in blue. The integration process can be described as follows: First, (1) information from the two mentioned sources (project emails and project surveys) regarding cooperative projects is collected in each project time t_n, and in each of the different phases of a cooperative project lifecycle. Second, collected data are stored in a temporary data base (2), which is a dedicated database to the proposed model in this work (the MCPx model). Third (3), collected data undergo a process of extraction and transformation, which represents the cleansing and translation of collected information in surveys and project emails stored in the dedicated database (MCPx Database). Fourth, (4) treated data (cleaned and transformed) are stored in a master database (data warehouse) in an appropriated and readable form. In this case data are stored in a matrixial form. Fifth (5), to the collected and transformed cooperative project data, several SNA centrality metrics such as in-degree, average degree, density and so on, (essentially SNA metrics based on graph theory) and statistics will be applied, in order to quantitatively analyze the five key project cooperative behavioral dimensions, which in turn will enable to quantify cooperative project risks. Sixth (6), the results of the application of SNA centrality metrics and statistics to cooperative project data will be displayed in a form of chart bars, trends, and graphs. The next step (7) comprises the decision-making phase where decision makers supported by the results outputted by the proposed model in this work will implement measures or actions either to change the direction of the ongoing organizational cooperative dynamic behaviors, or to support it towards the end of a given project phase. Finally (8), after a cooperative project has been accomplished, cooperative project lessons learned should be collected and added to the MCPx model´s database, to refine the overall process of data collection, treatment, and analysis. This could include for example the reformulation of some survey questions to get more insight regarding the different five cooperative dimensions that emerge and evolve across all the different phases of a project lifecycle
4. Application of the MCPx Model—A Case Study
4.1. Introduction to the Application Case
The following case study illustrates part of an extensive application of the proposed model in this work (the MCPx model) in the management of cooperative projects behavioral risks that was conducted by a market leader Food and Beverage company (denominated in this case study as organization 1) in mid-Europe across the year 2020. Organization 1 launched a project offer (denominated in this case study as project 1) to 7 other organizations from different areas that include mechanical installations, automation, processing engineering, and so on. Project 1 comprises the implementation of a new cheese production line to be executed in a period of 12 months. After analyzing the individual project proposals of each of the 7 organizations, organization 1 decided to go further with the execution of project 1, hiring organizations 2 and 3. All organizations accepted to take part in the case study which implies the application of the proposed model in this work. The case study consists of the application of the MCPx model across all the different phases of the lifecycle of project 1 in order to identify and monitor cooperative dynamic behavioral patterns that may threat the success deliver of project 1.
More concretely, the objective of the case study is to analyze the evolution of the five key project cooperative behavioral dimensions ((1) communication, (2) information sharing, (3) trust, (4) problem solving and (5) decision making) across the different phases of project 1´s lifecycle, and how these may evolve towards corporative project risk. Across this section of the present work, an extract of the case study conducted in phase II of project 1, and some major conclusions, will be presented. The analysis process that goes from the data collection, data extraction and transformation, application of SNA centrality metrics, and statistics until the reporting phase conducted in this case study, was supported by the integration of the proposed model in this work into an organization business intelligence architecture as illustrated in Figure 5. For this matter, a dedicated project mailbox (including mail server and accounts) was created where all the participating organizations in cooperative project 1, exchanged all project-related information across all the phases of the cooperative project 1′s lifecycle.
The project 1 surveys addressed to all the participating organizations in the cooperative project lifecycle were done through an online platform, where participants were asked to provide answers to the project survey questions. Both the dedicated project mailbox and the online platform were where project 1 participants answered project surveys, representing the MCPx database as illustrated in Figure 5 (2). Both project-related email data exchanges and project survey answers were collected at pre-defined times t within each of the different phases of the project lifecycle.
Once data were collected, it immediately underwent a transformation process by the application of an algorithm, which essentially transformed collected data into several quantitative matrixes. Next, the data were quantitatively measured by the application of SNA centrality metrics (weighted total-degree, average weighted total-degree, in-degree, average in-degree) as illustrated in Table 3. The final step performed by the business intelligence architecture is the output of weighted and undirected and directed graphs, as illustrated in Figure 6 in the next sub-chapter (4.2 Application of the MCPx model).
4.2. Application of the MCPx Model
Figure 6 illustrates the results in the form of a network of the application of the SNA centrality metrics to project 1 data collected in project 1 emails and project 1 surveys, between the period t_0 and t_5 in the planning phase (phase II).
The dimension´s results illustrated in Figure 6 represent the sum (regarding the communication dimension) and the average (regarding all the survey dimensions) results, from the analysis of all participants’ exchanged emails and answered surveys, from organizations 1, 2, and 3, which were constituted by 9, 12, and 6 project people, respectively.
To map the email network exchange in Figure 6, all project-related exchanged emails within the period between t_0 and t_5 in each project time t_n, were collected and analyzed. To map the four different project survey networks, data from project surveys were collected and analyzed.
As it can be illustrated in Figure 6, the time between any two-given ts is not constant. For example, between t_1 and t_2 there were 3 weeks of time elapsed, and between t_3 and t_4 there were 2 weeks of time elapsed.
The first dimension to be analyzed is the communication dimension between the period t_0 and t_5. In Figure 7 (communication in-degree evolution between t_1 and t_5) and Figure 8 (communication average in-degree evolution between t_1 and t_5), are illustrated the results of applying (1) and (2), according to Table 3, respectively, to the communication dimension illustrated in Figure 6.
As it can be seen in Figure 7 regarding the communication degree evolution between t_1 and t_5, there seems to be a certain balanced evolution regarding all the three organizations O1, O2, and O3. Nevertheless, organization O2 experienced a continuous increase from t_1 until t_5 regarding the email communication network. This immediately means that a substantial quantity of project-related emails were not shared with organizations 1, and 3. This trend can represent that, especially from t_2 onwards, that organization O2 has gained a substantial control over the email or communication network, when compared to the other two organizations. In fact, it almost doubled its size or domination, specially from t_3 onwards. This behavior could be a signal of a certain tendency to a future of an unbalanced communication network in the upcoming project phases.
Furthermore, this behavior is to a certain extent clear, when analyzed regarding the trend in the period between t_4 and t_5 regarding organizations 1 and 3 (which have a clear negative slope), while organization 2 is still increasing. Finally, the behavior illustrated in Figure 7 may represent a project cooperative behavioral risk, in the sense that it may lead to a large difference between organization 2 and organizations 1 and 3, regarding the amount of project-related information that flows across the email communication network. This could still be translated into poor communication and ultimately result in poor performance.
Figure 8 illustrates the evolution of the communication network regarding the average in-degree (or total-degree, once the email communication network is a non-directional network) between t_1 and t_5. As it can be observed the average trend is in line with what is observed in the individual trends in Figure 7. This represents that regarding the communication network there was a clear increase of exchanged project-related emails as the project moves along the time axes in phase II. However, between t_4 and t_5, there can be observed a negative tendency which is affected by the abrupt decrease of emails sent and received from Organizations 1 and 3 in the respective period of time.
Figure 9 (Information sharing in-degree evolution between t_1 and t_5) and Figure 10 (Information sharing average in-degree evolution between t_1 and t_5) illustrate the results of applying (3) and (4) according to Table 3, respectively, to the information sharing dimension illustrated in Figure 6.
To map the information sharing dimension illustrated in Figure 6 the following question was addressed to the elements of the three organizations that work together in cooperative networks across phase II of project 1: who shares or updates you with relevant project-related information on a regular basis? As it can be seen in Figure 9 regarding the information sharing in-degree, all three organizations have very different behaviors across the period t_1 to t_5. For example, organization 1, between t_1 and t_2 starts to share a high volume of information, however, after t_2 until t_4, it seems to have experienced an abrupt decrease in sharing project-related information with the other two organizations. Organization 2 presents a similar behavior as organization 1, but this occurs before organization 1. This behavior may reflect an action–reaction dynamic type explained by the reaction of organization 1 to the behavior of organization 2. Such behavior may be explained as follows: As organization 2 decreases the amount of information shared across the planning phase of project 1 between t_1 and t_2, organization 1 gets awareness of that behavior and replicates in the same way. The inverse is also observed as organization 2 increases the sharing amount of project-related information from t_3 onwards. The observed behavior illustrated in Figure 9 regarding organizations 1 and 2 may reflect a certain risk regarding the relationships between them, that can be translated into a certain insecurity regarding a particular project subject or subjects, in both organizations almost simultaneously.
On the other hand, organization 3 has had a stable behavior across the same period, regarding the amount of shared project-related information.
Figure 10 illustrates the average in-degree for the information sharing dimension. The evolution of this dimension also clearly reflects the change in behavior from organizations 1 and 2. This evolution may to a certain extent represent project delay risks, namely in time t_3, as organizations 1 and 2 coincide regarding the amount of shared project-related information. Such cooperative project risks may occur because some project tasks or activities may suffer some delay as organizations are waiting to get input from how the project is evolving.
Figure 11 (trust in-degree evolution between t_1 and t_5) and Figure 12 (trust average in-degree evolution between t_1 and t_5) illustrate the results of applying (3) and (4) according to Table 3, respectively, to the trust dimension illustrated in Figure 6.
To map the trust dimension illustrated in Figure 6, one question was addressed to the elements of the three organizations that worked together in cooperative networks across phase II of project 1. The question was: whom do you trust in to talk about project issues or optimizations within fearing a certain retaliation?
As it can be seen in Figure 11 there are very different evolutions between t_1 and t_5 regarding the three participating organizations. However, organization 2 has a constant behavior across the analyzed period of time when compared with the other two organizations. This immediately represents that both organizations 1 and 3 highly trust organization 2 when it comes to project-related issues or new ideas. However, the trust level decreases as the project evolves across the phase II towards organizations 1 and 3. One particular aspect can be observed in the behavior of organization 1. According to the evolution of the trust level of organization 2 illustrated in Figure 11, from time t_2 onwards organization 2 constantly keeps losing trust within the project social network, reaching an absolute zero vale from t_4 onwards. This clearly means that organization 1 has lost some credibility as the project evolves in phase II. This fact may be a consequence from what is observed in the evolution of the information sharing degree in Figure 9, where organization 1 seems to have followed or retaliated to the behavior of organization 2 regarding the amount of shared project-related matter.
As trust is one of the most important aspects in cooperative projects as mentioned in Section 2.2 Cooperative Networks, it can be concluded that project 1 tasks and activities may be negatively impacted by the trust dimension within phase II. This behavior can be further investigated by analyzing the average in-degree trust evolution between t_1 and t_5 in phase II of project 1, as illustrated in Figure 12. On average, the trust level within the project social network which is comprised by the members of organizations 1, 2, and 3 drops exactly to half from t_4 onwards, of the value observed in t_1. In this case, project managers and leaders should adopt measures to reestablish the necessary trust level within the project social network, so that the dynamic cooperative interactions get back to a desired level, and thus enhance the chances to achieve a successful project outcome for project phase II and onwards.
Figure 13 (problem solving in-degree evolution between t_1 and t_5) and Figure 14 (problem solving average in-degree evolution between t_1 and t_5) illustrates the results of applying (3) and (4) according to Table 3, respectively, to the problem-solving dimension illustrated in Figure 6.
To map the problem-solving dimension illustrated in Figure 6, one question was addressed to all elements of the three organizations that worked together in cooperative networks across phase II of project 1. The question was: whom do you turn to, to get effective help concerning your project tasks or activities?
As it can be seen in Figure 13 all three organizations have distinct behaviors regarding the problem-solving network across the analyzed period between t_1 and t_5 of project 1 in phase II. As in the previous analysis regarding the trust dimension in Figure 11, organization 2 has a constant evolution across the analyzed period, hitting the highest rate possible. This means that organization 2 is the organization whom the other two organization go to, to get expertise or relevant know-how or know-what regarding project tasks or activities. Both trust and problem-solving dimensions, concerning organization 2, places organization 2 in a particular important position within the project social network of project 1 in phase II. According to the results illustrated in Figure 11 and Figure 13, organization 2 is the organization on which the other two (organizations 1 and 3) strongly and steadily rely on when it comes to trust and problem-solving dimensions.
When analyzed together, i.e., the trust evolution in Figure 11 with the problem-solving evolution in Figure 13 for organization 2, one can immediately conclude that organization 2 has a central role within the mix of formal and informal project 1 social relationships. This may eventually turn into a problem at the long run, while in the short run may be a precious help for the development of project 1 in phase II. This could be explained as follows: If organizations 1 and 3 increase the level of dependence on organization 2 as being the one to go to to get help regarding project-related matters, it may lead to the emergence of bottlenecks and delays, as organizations 1 and 3 wait from support of organization 2. In this case it can be said that project 1 in phase II faces simultaneously two cooperative project behavioral risks. The first risk regards to risks associated to the assignment of tasks to project partners which can be divided into two sub-dimensions. The first sub-dimension concerns organizations that have disproportionate know-how and know-what levels when compared with other organizations. This may represent that there is a risk when assigning certain tasks or activities to cooperative project partners in the sense that they will not execute those activities or tasks without help from another organization or organizations. This may contribute to the non-compliance with project deadlines, milestones and so on, while simultaneously, the second dimension will overload other organizations with excessive help requests, leading to the emergence of bottlenecking, delays, or burn-outs, and ultimately will negatively impact project 1 objectives. The second risk regards the risk of critical enterprise which is characterized by having project partners within a cooperative network that have exclusive competencies, know-how, or know what. This may lead to the same already mentioned non-compliance outcomes, but also to the emergence of a non-healthy cooperative environment among the organizations that participate in a cooperative project.
Such a non-healthy cooperative environment may be characterized by the non-intentional relaxing of some partners regarding going to others (concerning the execution of project tasks and activities, but not only), where continuously more output is expected than would be expected and rational.
On the other hand, organization 3 has never been nominated as being an organization with problem-solving skills according to evolution of the problem-solving in-degree illustrated in Figure 13. It can be clearly seen that regarding this dimension (problem solving) organization 3 has a peripherical position within the project social network. In the context of phase II of project 1, putting together the four analyzed dimensions (communication, information sharing, trust, and now problem solving) it can be said that organization 3 shows indices of poor integration within the project social network. This may represent that there is a certain distance regarding cooperation between organization 3 and the other two organizations in phase II of project 1, between t_1 and t_5. These suspicions outdrawn by the analysis on project 1 behavioral data, should be cleared through follow-up interviews to access more accurately what might be going on regarding the cooperation between the three organizations that work together to deliver project 1 across phase II. However, Figure 14 shows that the average degree of the problem-solving network has increased between t_2 and t_3 and remained constant from t_3 onwards. The increase observed in Figure 14 between t_2 and t_3 is due to the increase problem solving in-degree of organization 1, which rises one degree between the same period.
Figure 15 (decision-making in-degree evolution between t_1 and t_5) and Figure 16 (decision-making average in-degree evolution between t_1 and t_5) illustrate the results of applying (3) and (4) according to Table 3, respectively, to the decision-making dimension illustrated in Figure 6.
To map the decision-making dimension illustrated in Figure 6 the following question was addressed to the elements of the three organizations that work together in cooperative networks across phase II of project 1: who most decides what, when, and how to execute project tasks or activities?
As it can be seen in Figure 15, organization 2 has once again a position of relevance within the decision-making dimension. While organization 2 has a constant evolution across the period between t_1 and t_5 of project 1 in phase II, organizations 1 and 3 have a variable behavior regarding the decision-making dimension. The evolution of the decision-making dimension illustrated in Figure 15 may represent a certain competition level between organizations 2, 1, and 3, but not between organizations 2 and 3. This can be explained as follows: According to Figure 15 the observed trend of organization 1 (increase in its importance regarding the decision-making dimension between the period t_1 and t_3) can be explained by the behavior observed in Figure 13 regarding the problem-solving dimension of organization 1. As organization 1 increases its importance in the problem-solving dimension, it simultaneously increases its position in the decision-making dimension. This occurs because these two dimensions (problem-solving and decision-making), are to a certain extent related—the one who knows, is often the one who decides.
However, organization 1 does not go far, and after reaching the top regarding the decision-making dimensions between t_3 and t_4, it abruptly drops to a zero level in t_5, which to a certain extent is related to the loss of trust, observed between t_4 and t_5, as illustrated in Figure 11, in the trust in-degree evolution dimension. Organization 3 on the other hand, even without having scored in the problem-solving dimensions, seems to benefit from the continuous lack of trust regarding organization 1 observed in Figure 11, while simultaneously holding a constant position within the project social network regarding the trust dimension. Finally, Figure 16 shows the average evolution of the decision-making in-degree between t_1 and t_5, and shows that the decision-making dimension suffers a slight increase between t_1 and t_4, which essentially reflects the evolution of organization 1 between the same period. Nevertheless, the decision-making dimension illustrated in Figure 16 has a positive evolution across phase II of project 1 between t_1 and t_5. This may be explained as follows: The observed trend may indicate a certain volatility regarding who is who and who plays what in the project 1 social network. This could mean that as the project 1 phase II evolves, the degree of power (in a mix of both formal and informal) across all participating organizations also evolves (increases). This trend may represent a certain lack of direction, or “holding command” risk regarding how this is being managed. However, the observed trend may still indicate a certain increase of empowerment of the organizations that cooperate in the delivery of project 1, which may be beneficial for the project in terms of finding new solutions, ideas, and a more flexible approach regarding change.
After the application of the MCPx model which enabled us to quantitatively analyze the five key project cooperative behavioral dimensions across phase II of project 1, project 1 top managers and/or project 1 leaders are now better informed (more data-informed) about the potential risks that such observed cooperative behaviors may comprise in the successful delivery of project 1. Finally, after conducting strategic follow-up assessments on those particular observed behaviors (trends) identified by the MCPx model, project 1 top managers and/or project 1 leaders can now properly develop better data-driven strategies to efficiently manage the analyzed five key project cooperative behavioral dimensions, and therefore increase the likelihood of project 1′s successful delivery.
5. Conclusions
This work presents a heuristic model that in a quantitative way analyzes the mix of formal and informal networks of relationships between organizations that work together (cooperate) to deliver projects by analyzing five key project cooperative behavioral dimensions, (1) communication, (2) information sharing, (3) trust, (4) problem solving and (5) decision making, that usually take place in cooperative projects. One advantage of the proposed model in this work is the analysis of the interaction between entities in a cooperative project environment which can be represented as single persons, groups, or entire organizations, as is the case in the presented case study. Another advantage of the proposed model in this work is that it can be scalable, without suffering any type of influence in the analysis process as it scales up. This happens because the proposed model is not affected by any type of estimation as, for example, the R2 value in linear regression calculations. The mathematical approach of the proposed model deals only with absolute results (pure quantitative results). Nevertheless, if there are a huge number of entities to be analyzed it is recommended to use indexation (ranging from 0 to1) instead of absolute numbers in the outputted results scale. As it has been seen across the case study, the application of the proposed model in this work is simple and straightforward. The same is to be said in relation to the results outputted by the proposed model. However, it is recommended that the interpretation of the results outputted by the application of the MCPx mode should be done by professionals in the social network analysis area. Furthermore, the results outputted by the MCPx model regarding the quantitative identification of cooperative behavioral trends or patterns should always be succeeded by follow-up assessments in order to clearly and accurately identify the real reasons and potential impacts of such behaviors or trends on project tasks and activities.
6. Academic and Managerial Implications
6.1. Proposed Model and Academic Implications
The developed research across this work culminated in a heuristic model (the MCPx model) developed based on four critical scientific pillars ((1) project risk management, (2) cooperative networks, (3) social network analysis, and (4) business intelligence architecture) to efficiently support the management of project cooperative risks by analyzing five key project cooperative behavioral dimensions. By doing so, the proposed model in this work contributes to create knowledge to manage cooperative risk projects, namely in the behavioral risks field as is illustrated in Figure 3a. The developed research across this work aims to contribute to each of the four critical scientific pillars that were used to develop the proposed model in this work in a holistic and interrelated way. This way, the relationships between concepts of project management, risk management, collaborative networks, social network analysis, and business intelligence become clearer and build the foundations to further research, as in each one of them is the context of the management of cooperative projects. In the pillar of the project risk management, the proposed model in this work contributes to a holistic, deeper, and accurate understanding of how cooperation really emerges and evolves across the different phases of a cooperative project lifecycle, and how such evolution may or may not be originating behaviors that to a certain extent represent cooperative risks to project activities and ultimately project outcome. This in turn may enable the development of new theoretical approaches regarding how to manage a project’s cooperative risks. In the cooperative networks pillar the proposed model in this work contributes to identify other factors (such as problem solving, information sharing, decision making and so on) besides trust, reciprocity, and interlocking of directorates, which can play a central role for an efficient and effective cooperative project network. In the pillar of SNA in organizations the proposed model in this work contributes to the development of new insights and discoveries regarding the importance and implications of the different mix of formal and informal cooperative project roles (identified by the application of SNA centrality metrics) within a project social network. Finally, in the business intelligence pillar the proposed model in this work contributes to the understanding of how organizations can benefit from the implementation of a BI architecture in boosting their organizational components and to better see the interrelations between areas such as risk management and human resource management, which could generate the development of new organizational theory, namely concerning the way cooperative work gets done in organizations in modern times.
6.2. Proposed Model and Managerial Implications
The proposed model in this work efficiently helps organizations in managing cooperative project risks as illustrated across the case study presented in this work. The application of the MCPx model enables organizations to, in a timely manner, and in an effective and quantitative way, access the variability evolution of the dynamic interactions (cooperative behaviors) that emerge and evolve among participants in cooperative projects. This in turn will enable organizations to take and implement actions to readjust undesired or support desired cooperative project behaviors before they turn into real project risks.
The ability to quantitatively measure the different cooperative behaviors that occur across the different phases of a project lifecycle enables organizations to take more data-informed decisions, rather than relying too heavily on gut feelings and on subject matter experts or even on influential opinions from people/organizations, which many times advise without having a sustainable quantitative basis, where, even worse than that, more often than not such advice is strongly biased.
The integration of the MCPx model into a BI architecture provides organizations accuracy, speed, and efficiency in identifying (most often hidden) cooperative behaviors across the different phases of a project lifecycle that emerge from the mix of formal and informal relationships. Furthermore, the integration of the MCPx model in a business intelligence architecture can be considered an intelligent predictive model. This happens if a substantial number of past projects are analyzed and a function of repeatable observed behaviors associated with certain project outcomes, a cooperative project critical success factor, can be identified. Then, such cooperative project critical success factors can be replicated in future cooperative projects and used as guides to manage future cooperative projects.
Finally, the proposed model in this work helps organizations to, in a smarter and faster way, address the ongoing organizational digital transformation and to pursue the actual and upcoming sustainability challenges, in a holistic and consistent way by efficiently focusing efforts on the achievement of short- and long-term goals and ultimately in the generation of sustainable business.
7. Further Developments
The continuous development of new SNA centrality metrics as critical enablers of gaining a deeper insight regarding the dynamic interactions between organizations that participate in cooperative project networks is recommended. However, the application of other SNA metrics rather than centrality should be also tested. It is also recommended that the proposed model in this work should be improved upon to be able to distinguish pure formal from pure informal relationships in project environments. By doing so, it would be possible not only to accurately quantify how much do informal and formal networks of relationships exists in cooperative projects, but also to clearly measure the real importance of informal and formal networks in the management of cooperative projects. It would also enable us to accurately correlate the importance of informal networks and formal and informal power in a cooperative project environment.
It is also suggested that deeper research should be conducted in terms of gaining access to email content matter in order to better get more insights regarding how communication takes place, but also the quality of the communication. For this matter joint work with GDPR regulators should be conducted in order to create legal mechanisms to enable deeper access to information generated in the work environment.
Finally, the incorporation of AI (artificial intelligence) advanced techniques such as ML (machine learning) or NN (neural networks) in the proposed model in this work should be considered in order to generate unique and actionable knowledge in a 360-degree approach, and estimate future outcomes (predictions) based on the analysis of past collaborative trends.
Author Contributions
Conceptualization, M.N. and A.A.; methodology, M.N. and A.A.; software, M.N. and A.A.; validation, M.N. and A.A. and C.S.; formal analysis, M.N. and A.A.; investigation, M.N. and A.A.; resources, M.N. data curation, M.N. and A.A.; writing—original draft preparation, M.N.; writing—review and editing, M.N. and A.A. and C.S.; visualization, M.N. and A.A.; supervision, M.N. and A.A. and C.S. All authors have read and agreed to the published version of the manuscript.
Funding
This research received no external funding.
Informed Consent Statement
Not applicable.
Data Availability Statement
Not applicable.
Conflicts of Interest
The authors declare no conflict of interest.
References
- Nuryakin, M. Competitive Advantage and Product Innovation: Key Success of Batik SMEs Marketing Performance in Indonesia. Acad. Strat. Manag. J. 2018, 17, 1–17. [Google Scholar]
- Nunes, M.; Abreu, A. Managing Open Innovation Project Risks Based on a Social Network Analysis Perspective. Sustainability 2020, 12, 3132. [Google Scholar] [CrossRef]
- Hansen, M. Collaboration: How Leaders Avoid the Traps, Create Unity, and Reap Big Results; Harvard Business School Press: Cambridge, MA, USA, 2009. [Google Scholar]
- Lutfihak, A.; Evrim, G. Disruption and ambidexterity: How innovation strategies evolve? Soc. Behav. Sci. 2016, 235, 782–787. [Google Scholar]
- Lee, K.; Woo, H.; Joshi, K. Pro-innovation culture, ambidexterity, and new product development performance: Polynomial regression and response surface analysis. Eur. Manag. J. 2017, 35, 249–260. [Google Scholar] [CrossRef]
- Workday Studios. In Good Company—Michael Arena, Chris Ernst, Greg Pryor: Organizational Networks. 2018. Available online: https://www.youtube.com/watch?v=6faV0v0yVFU (accessed on 12 January 2021).
- Arena, M. Adaptive Space: How GM and Other Companies are Positively Disrupting Themselves and Transforming into Agile Organizations; McGraw Hill Education: New York, NY, USA, 2018. [Google Scholar]
- Nunes, M.; Abreu, A. Applying Social Network Analysis to Identify Project Critical Success Factors. Sustainability 2020, 12, 1503. [Google Scholar] [CrossRef] [Green Version]
- Chesbrough, H. How to Capture All the Advantages of Open Innovation at HBR. 2020. Available online: https://hbr.org/podcast/2020/01/how-to-capture-all-the-advantages-of-open-innovation (accessed on 20 February 2021).
- Deichmann, D.; Rozentale, I.; Barnhoorn, R. Open Innovation Generates Great Ideas, So Why Aren’t Companies Adopting Them? Available online: https://hbr.org/2017/12/open-innovation-generates-great-ideas-so-why-arent-companies-adopting-them (accessed on 1 January 2020).
- Camarinha-Matos, L.M.; Afsarmanesh, H. Cooperative networks. In Knowledge Enterprise: Intelligent Strategies in Product Design, Manufacturing, and Management. PROLAMAT 2006. IFIP International Federation for Information Processing; Wang, K., Kovacs, G.L., Wozny, M., Fang, M., Eds.; Springer: Boston, MA, USA, 2006; Volume 207. [Google Scholar]
- Santos, R.; Abreu, A.; Anes, V. Developing a green product-based in an open innovation environment. Case study: Electrical vehicle. In Cooperative Networks and Digital Transformation. PRO-VE 2019. IFIP Advances in Information and Communication Technology; Camarinha-Matos, L., Afsarmanesh, H., Antonelli, D., Eds.; Springer: Cham, Switzerland, 2019; Volume 568. [Google Scholar]
- PMI® (Project Management Institute). Project Management Body of Knowledge (PMBOK® Guide), 6th ed.; Project Management Institute, Inc.: Newtown Square, PA, USA, 2017. [Google Scholar]
- ISO—The International Organization for Standardization. Available online: https://www.iso.org/home.html (accessed on 1 January 2021).
- Narsalay, R.; Kavathekar, J.; Light, D. A Hands-Off Approach to Open Innovation Doesn’t Work. 2016. Available online: https://hbr.org/2016/05/a-hands-off-approach-to-open-innovation-doesnt-work (accessed on 4 May 2021).
- Wigmore, I.; Rouse, M. January. 2013. Available online: http://whatis.techtarget.com/definition/data-driven-decision-management-DDDM (accessed on 4 May 2021).
- Abreu, A.; Nunes, M. Model to Estimate the Project Outcome’s Likelihood Based on Social Networks Analysis. KnE Eng. 2020, 5, 299–313. [Google Scholar] [CrossRef]
- Ladley, J.; Redman, T. Use Data to Accelerate Your Business Strategy. Harvard Business Review. 3 March 2020. Available online: https://hbr.org/2020/03/use-data-to-accelerate-your-business-strategy (accessed on 29 September 2020).
- Krackhardt, D.; Hanson, J. Informal Networks the Company behind the Charts; Harvard College Review: Cambridge, MA, USA, 1993; Available online: https://www.andrew.cmu.edu/user/krack/documents/pubs/1993/1993%20Informal%20Networks.pdf (accessed on 5 September 2020).
- Stefani, S.; Torriero, A. Formal and informal networks in organizations. In Advanced Dynamic Modeling of Economic and Social Systems. Studies in Computational Intelligence; Proto, A., Squillante, M., Kacprzyk, J., Eds.; Springer: Berlin/Heidelberg, Germany, 2013; Volume 448. [Google Scholar]
- Borgatti, S.P.; Everett, M.; Johnson, J. Analyzing Social Networks, 2nd ed.; Sage Publications Ltd.: London, UK, 2017. [Google Scholar]
- Arena, M.; Cross, R.; Sims, J.; Uhl-Bien, M. How to Catalyze Innovation in Your Organization. MIT. 2017. Available online: http://mitsmr.com/2rrgvqM.summerissue or https://www.robcross.org/wp-content/uploads/2017/10/how-to-catalyze-innovation-in-your-organization-connected-commons.pdf (accessed on 1 January 2020).
- DTM-EC—Digital Transformation Scoreboard 2017, Internal Market, Industry, Entrepreneurship and SMEs, European Commission. Available online: https://ec.europa.eu/growth/content/digital-transformation-scoreboard-2017_en (accessed on 10 January 2021).
- Digital Transformation Monitor of the European Commission. Germany: Industrie 4.0. 2017. Available online: https://ec.europa.eu/growth/tools-databases/dem/monitor/sites/default/files/DTM_Industrie%204.0.pdf (accessed on 3 April 2021).
- Putnik, G.D.; Varela, L.; Modrák, V. Intelligent Collaborative Decision-Making Models, Methods, and Tools. Math. Probl. Eng. 2018, 2018, 9627917. [Google Scholar] [CrossRef] [Green Version]
- Mohammed, H.; Knapkova, A. The Impact of Total Risk Management on Company’s Performance. Procedia Soc. Behav. Sci. 2016, 220, 271–277. [Google Scholar] [CrossRef] [Green Version]
- Davies, D. Risk management: Holistic risk management. Comput. Law Secur. Rev. 1997, 13, 336–339. [Google Scholar] [CrossRef]
- Hillson, D. How to Manage the Risks You Didn’t Know You Were Taking; Phoenix, A.Z., Ed.; Paper Presented at PMI® Global Congress 2014—North America; Project Management Institute: Newtown Square, PA, USA, 2014. [Google Scholar]
- Abreu, A.; Martins, J.D.M.; Calado, J.M.F. Fuzzy logic model to support risk assessment in innovation ecosystems. In Proceedings of the 2018 13th APCA International Conference on Automatic Control and Soft Computing (CONTROLO), Ponta Delgada, Portugal, 4–6 June 2018; pp. 104–109. [Google Scholar] [CrossRef] [Green Version]
- Karantininis, K.; Nilsson, J. The network form of the cooperative organization. In Vertical Markets and Cooperative Hierarchies; Springer: Dordrecht, The Netherlands, 2007; pp. 19–34. ISBN 978-1-4020-4072-6. [Google Scholar]
- Schalk, R.; Curşeu, P. Cooperation in organizations. J. Manag. Psychol. 2010, 25, 453–459. [Google Scholar] [CrossRef]
- Rindfleisch, A. Organizational Trust and Interfirm Cooperation: An Examination of Horizontal versus Vertical Alliances. Mark. Lett. 2000, 11, 81–95. [Google Scholar] [CrossRef]
- Durland, M.; Fredericks, K. An Introduction to Social Network Analysis. New Dir. Eval. 2006, 2005, 5–13. [Google Scholar] [CrossRef]
- Krivkovich, A.; Levy, C. Managing the People Side of Risk. McKinsey Global Institute. 2015. Available online: https://www.mckinsey.com/business-functions/risk/our-insights/managing-the-people-side-of-risk (accessed on 15 September 2020).
- Blacker, K.; McConnell, P. People Risk Management: A Practical Approach to Managing the Human Factors That Could Harm Your Business; Kogan Page Publishers: London, UK; CPI Group (UK), Ltd.: Croydon, UK, 2015. [Google Scholar]
- Cross, R.; Parker, A. The Hidden Power of Social Networks: Understanding How Work Really Gets Done in Organizations; Harvard Business School Press: Boston, MA, USA, 2004. [Google Scholar]
- Wasserman, S.; Faust, K. Social network analysis in the social and behavioral sciences. In Social Network Analysis: Methods and Applications; Cambridge University Press: Cambridge, MA, USA, 1994; pp. 1–27. ISBN 9780521387071. [Google Scholar]
- Liaquat, H.; Wu, A.; Choi, B. Measuring Coordination through Social Networks Quantitative Research Methods. 2013. Available online: https://www.semanticscholar.org/paper/MEASURING-COORDINATION-THROUGH-SOCIAL-NETWORKS-Liaquat-Wu/32db1daa63ae50a0eecc85d71e90d8dd5dfc404d (accessed on 4 May 2021).
- Nunes, M.; Abreu, A. A model to support OI collaborative risks applying social network analysis. In Boosting Collaborative Networks 4.0. PRO-VE 2020. IFIP Advances in Information and Communication Technology; Camarinha-Matos, L.M., Afsarmanesh, H., Ortiz, A., Eds.; Springer: Cham, Switzerland, 2020; Volume 598. [Google Scholar]
- Villegas-Ch, W.; Palacios-Pacheco, X.; Luján-Mora, S. A Business Intelligence Framework for Analyzing Educational Data. Sustainability 2020, 12, 5745. [Google Scholar] [CrossRef]
- Dedić, N.; Stanier, C. Measuring the success of changes to existing business intelligence solutions to improve business intelligence reporting (PDF). In Lecture Notes in Business Information Processing 268; Springer International Publishing: Cham, Switzerland, 2016; pp. 225–236. [Google Scholar]
- Olszak, C.M. Business Intelligence and Big Data: Drivers of Organizational Success; Auerbach Publications: Boca Raton, FL, USA, 2020; ISBN 9780367373948. [Google Scholar]
- Ponnambalam, K. Business Analytics Foundations: Descriptive, Exploratory, and Explanatory Analytics. Available online: https://www.linkedin.com/learning/business-analytics-foundations-descriptive-exploratory-and-explanatory-analytics/stages-of-business-analytics?u=77012418 (accessed on 10 May 2021).
Figure 1.
The four critical scientific pillars that support the MCPx model.


Figure 3.
Detailed view of the four critical scientific pillars used in the development of the MCPx model, (a) project risk management pillar, (b) cooperative networks pillar, (c) social network analysis pillar, and (d) business intelligence pillar.
Figure 3.
Detailed view of the four critical scientific pillars used in the development of the MCPx model, (a) project risk management pillar, (b) cooperative networks pillar, (c) social network analysis pillar, and (d) business intelligence pillar.

Figure 4.
Implementation framework of the MCP model.

Figure 5.
Integration of the proposed model in this work in a business intelligence architecture.

Figure 6.
Application of the MCPx model to the planning phase of a cooperative project.

Figure 7.
Communication in-degree evolution between t_1 and t_5.

Figure 8.
Communication average in-degree evolution between t_1 and t_5.

Figure 9.
Information sharing in-degree evolution between t_1 and t_5.

Figure 10.
Information sharing average in-degree evolution between t_1 and t_5.

Figure 11.
Trust in-degree evolution between t_1 and t_5.

Figure 12.
Trust average in-degree evolution between t_1 and t_5.

Figure 13.
Problem solving in-degree evolution between t_1 and t_5.

Figure 14.
Problem solving average in-degree evolution between t_1 and t_5.

Figure 15.
Decision-making in-degree evolution between t_1 and t_5.

Figure 16.
Decision-making average in-degree evolution between t_1 and t_5.


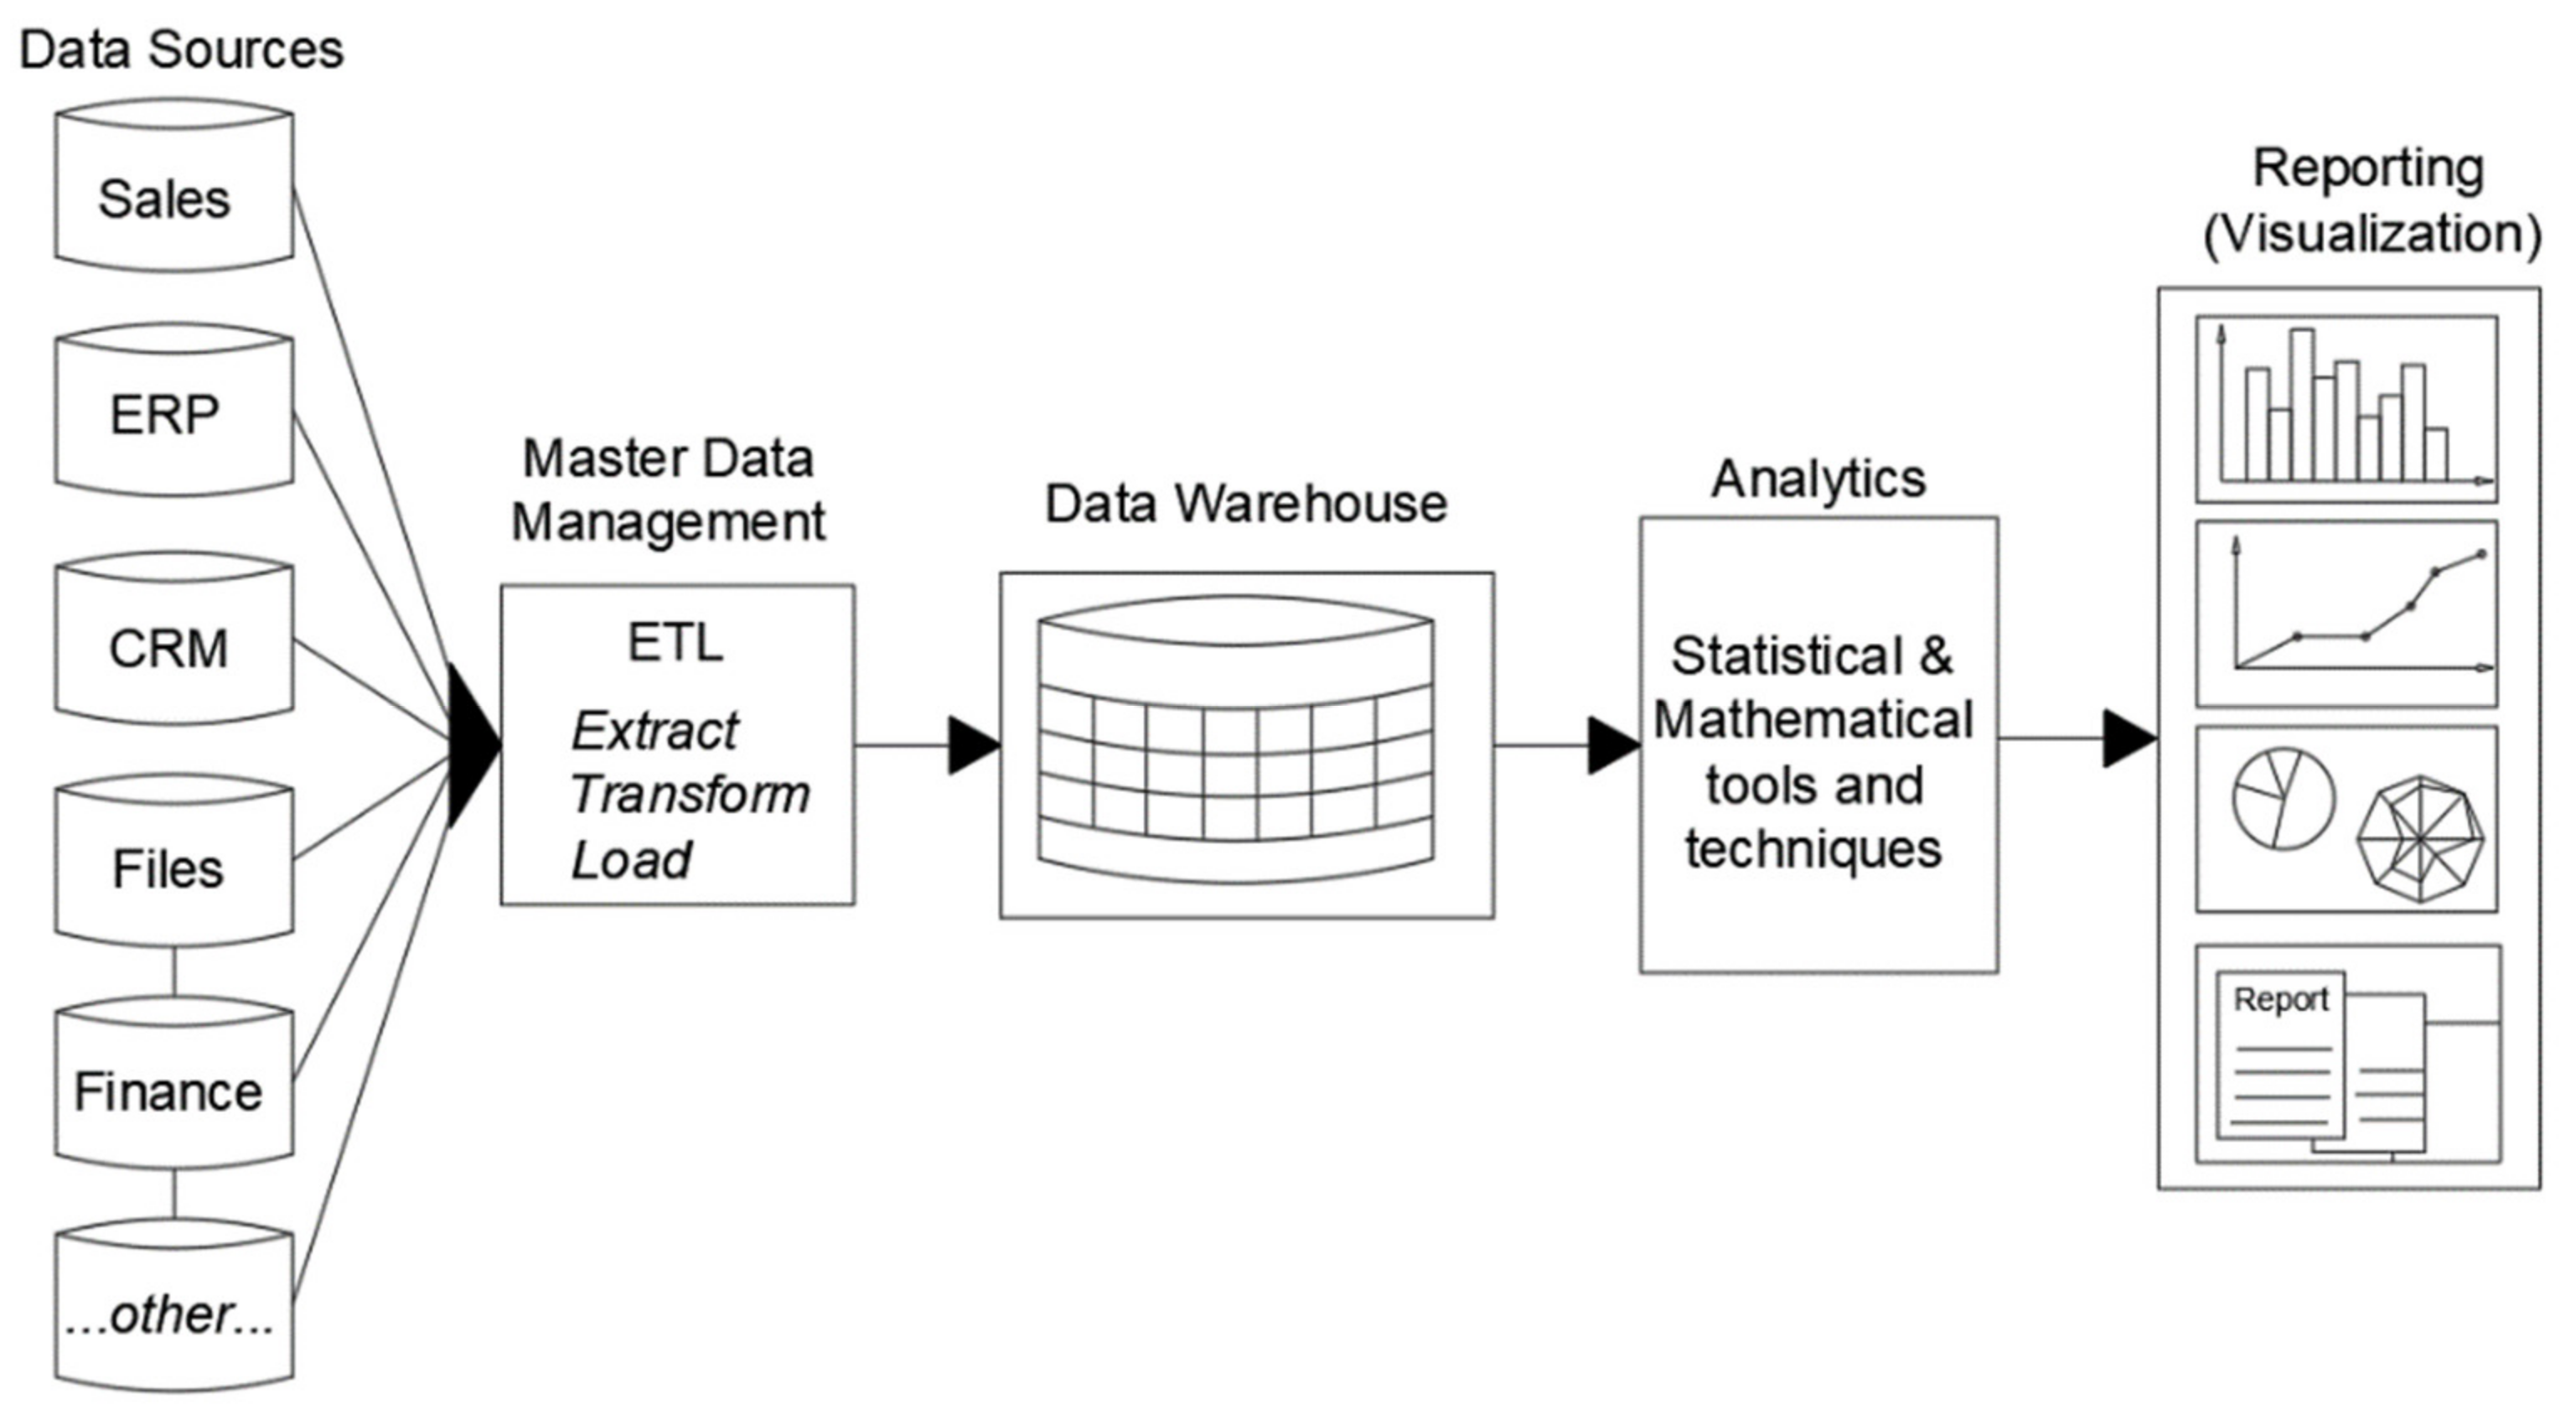
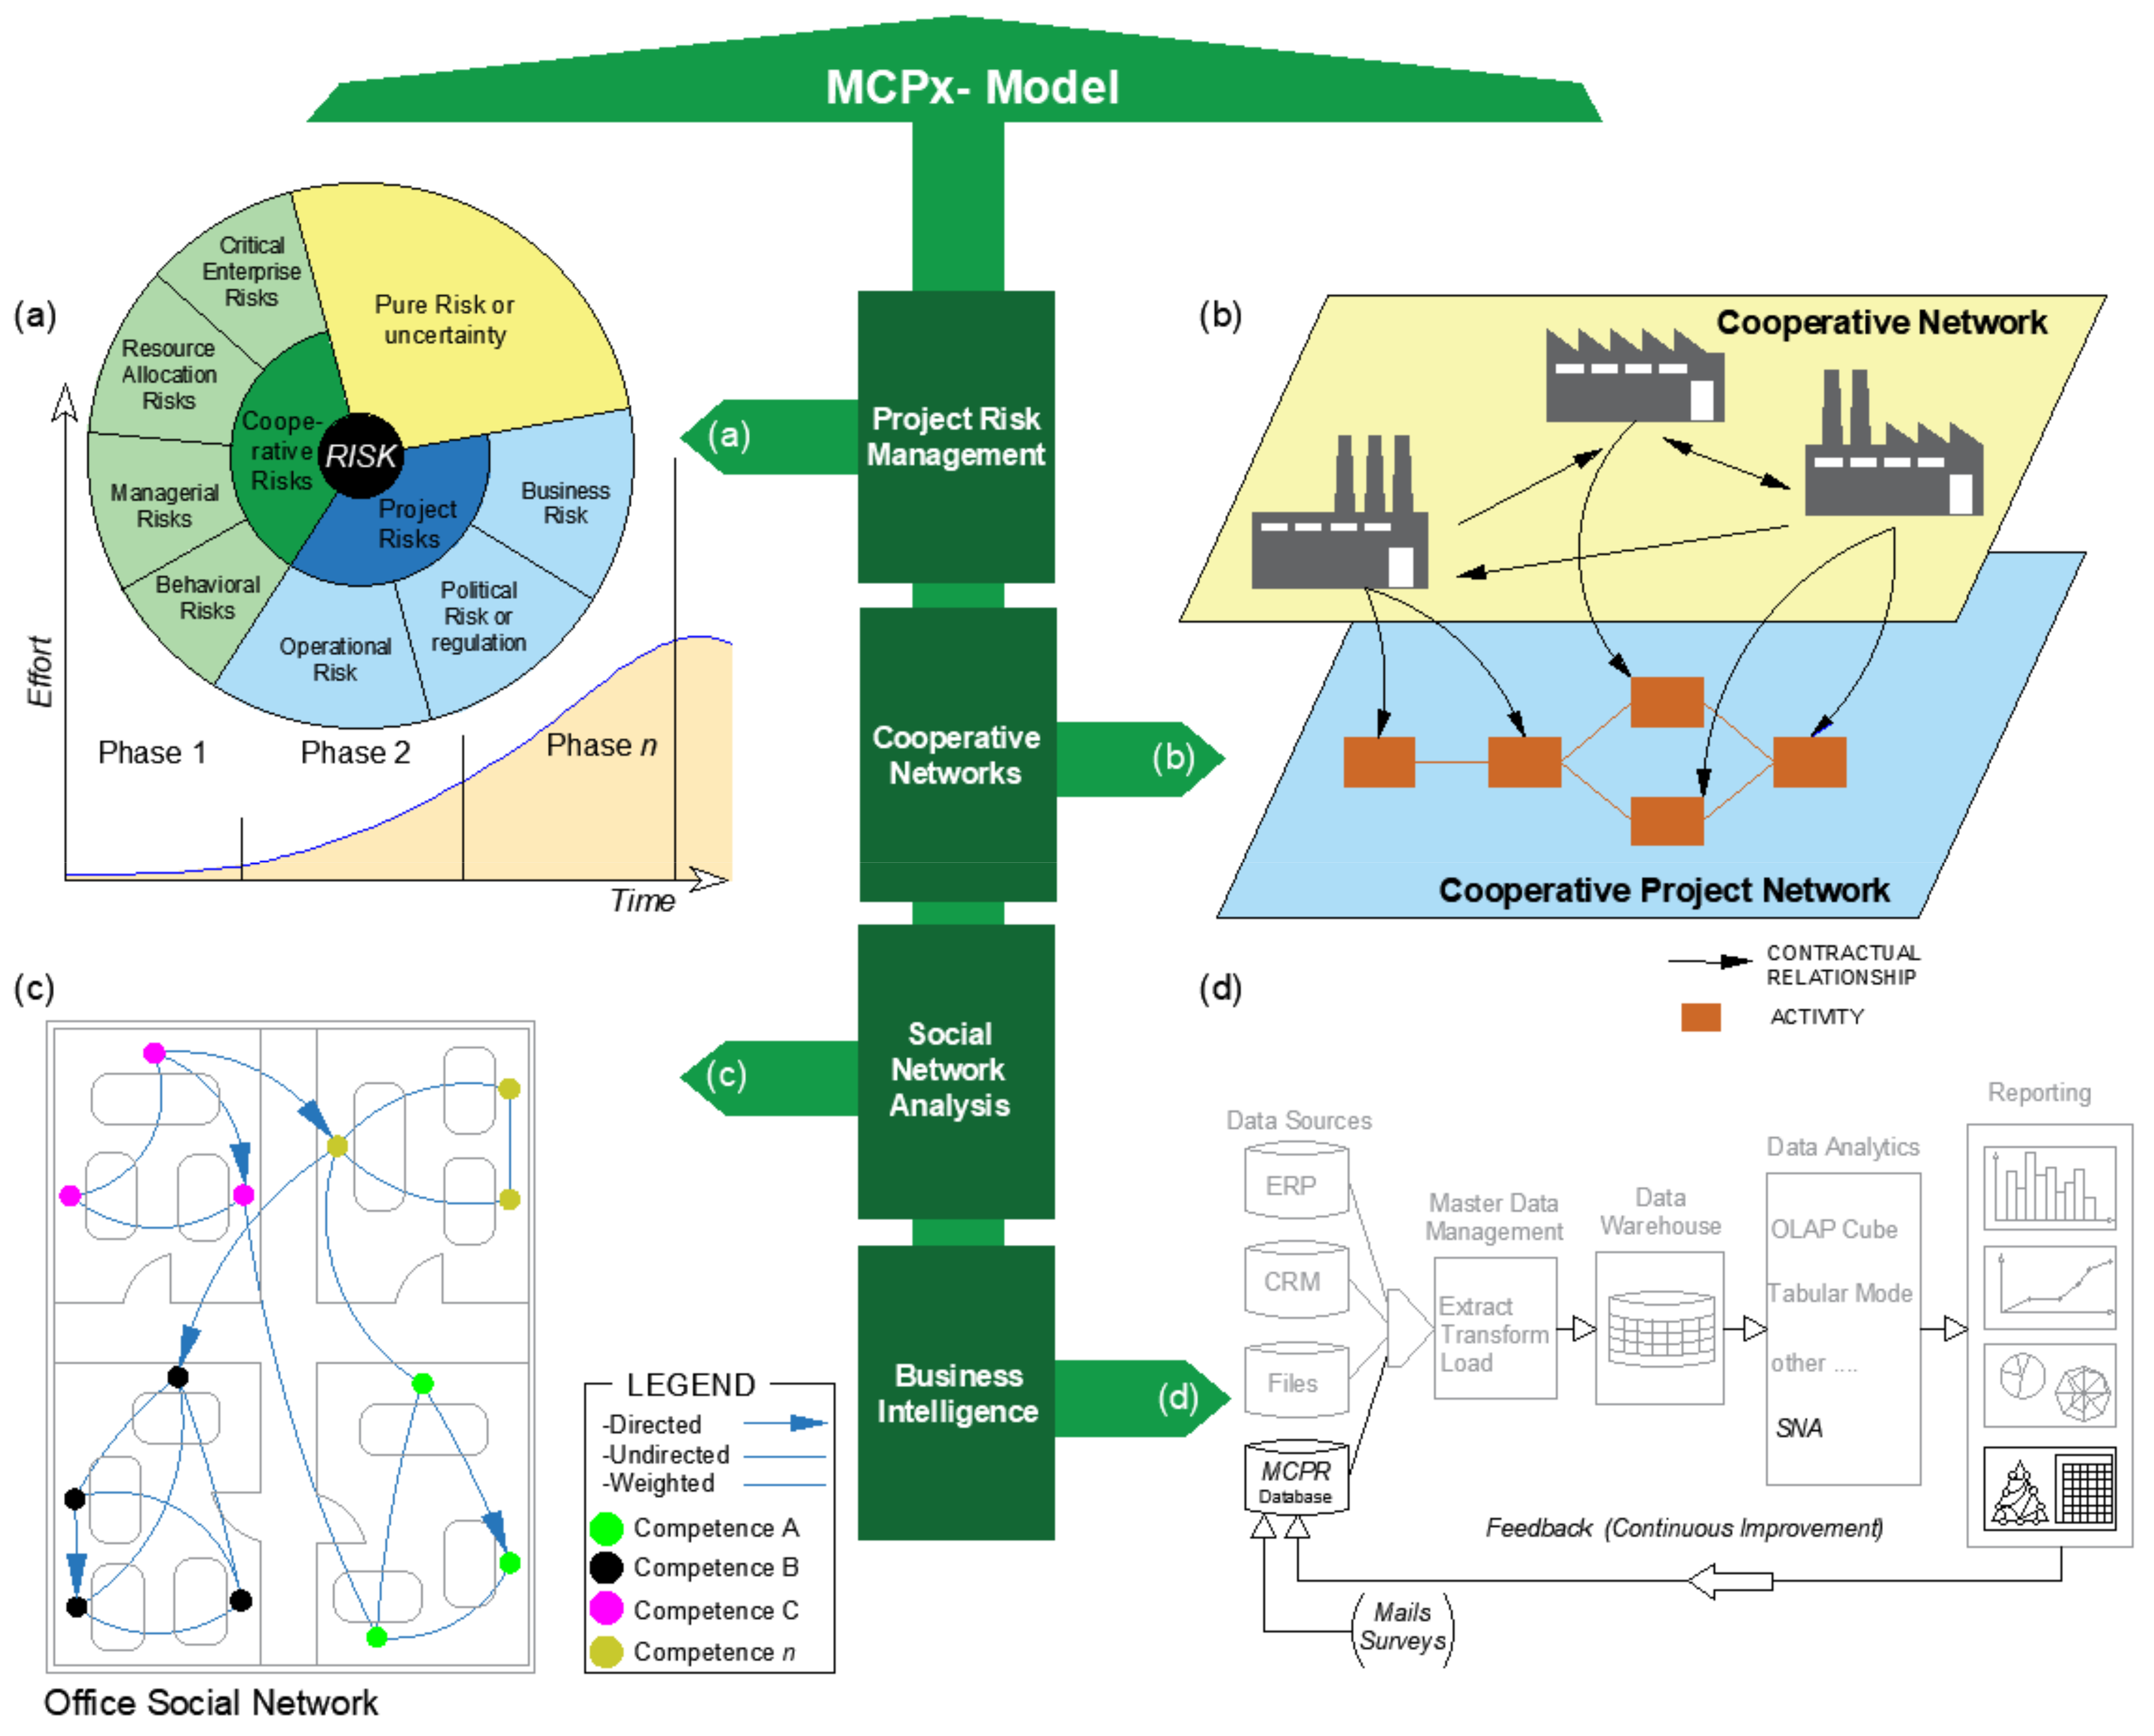
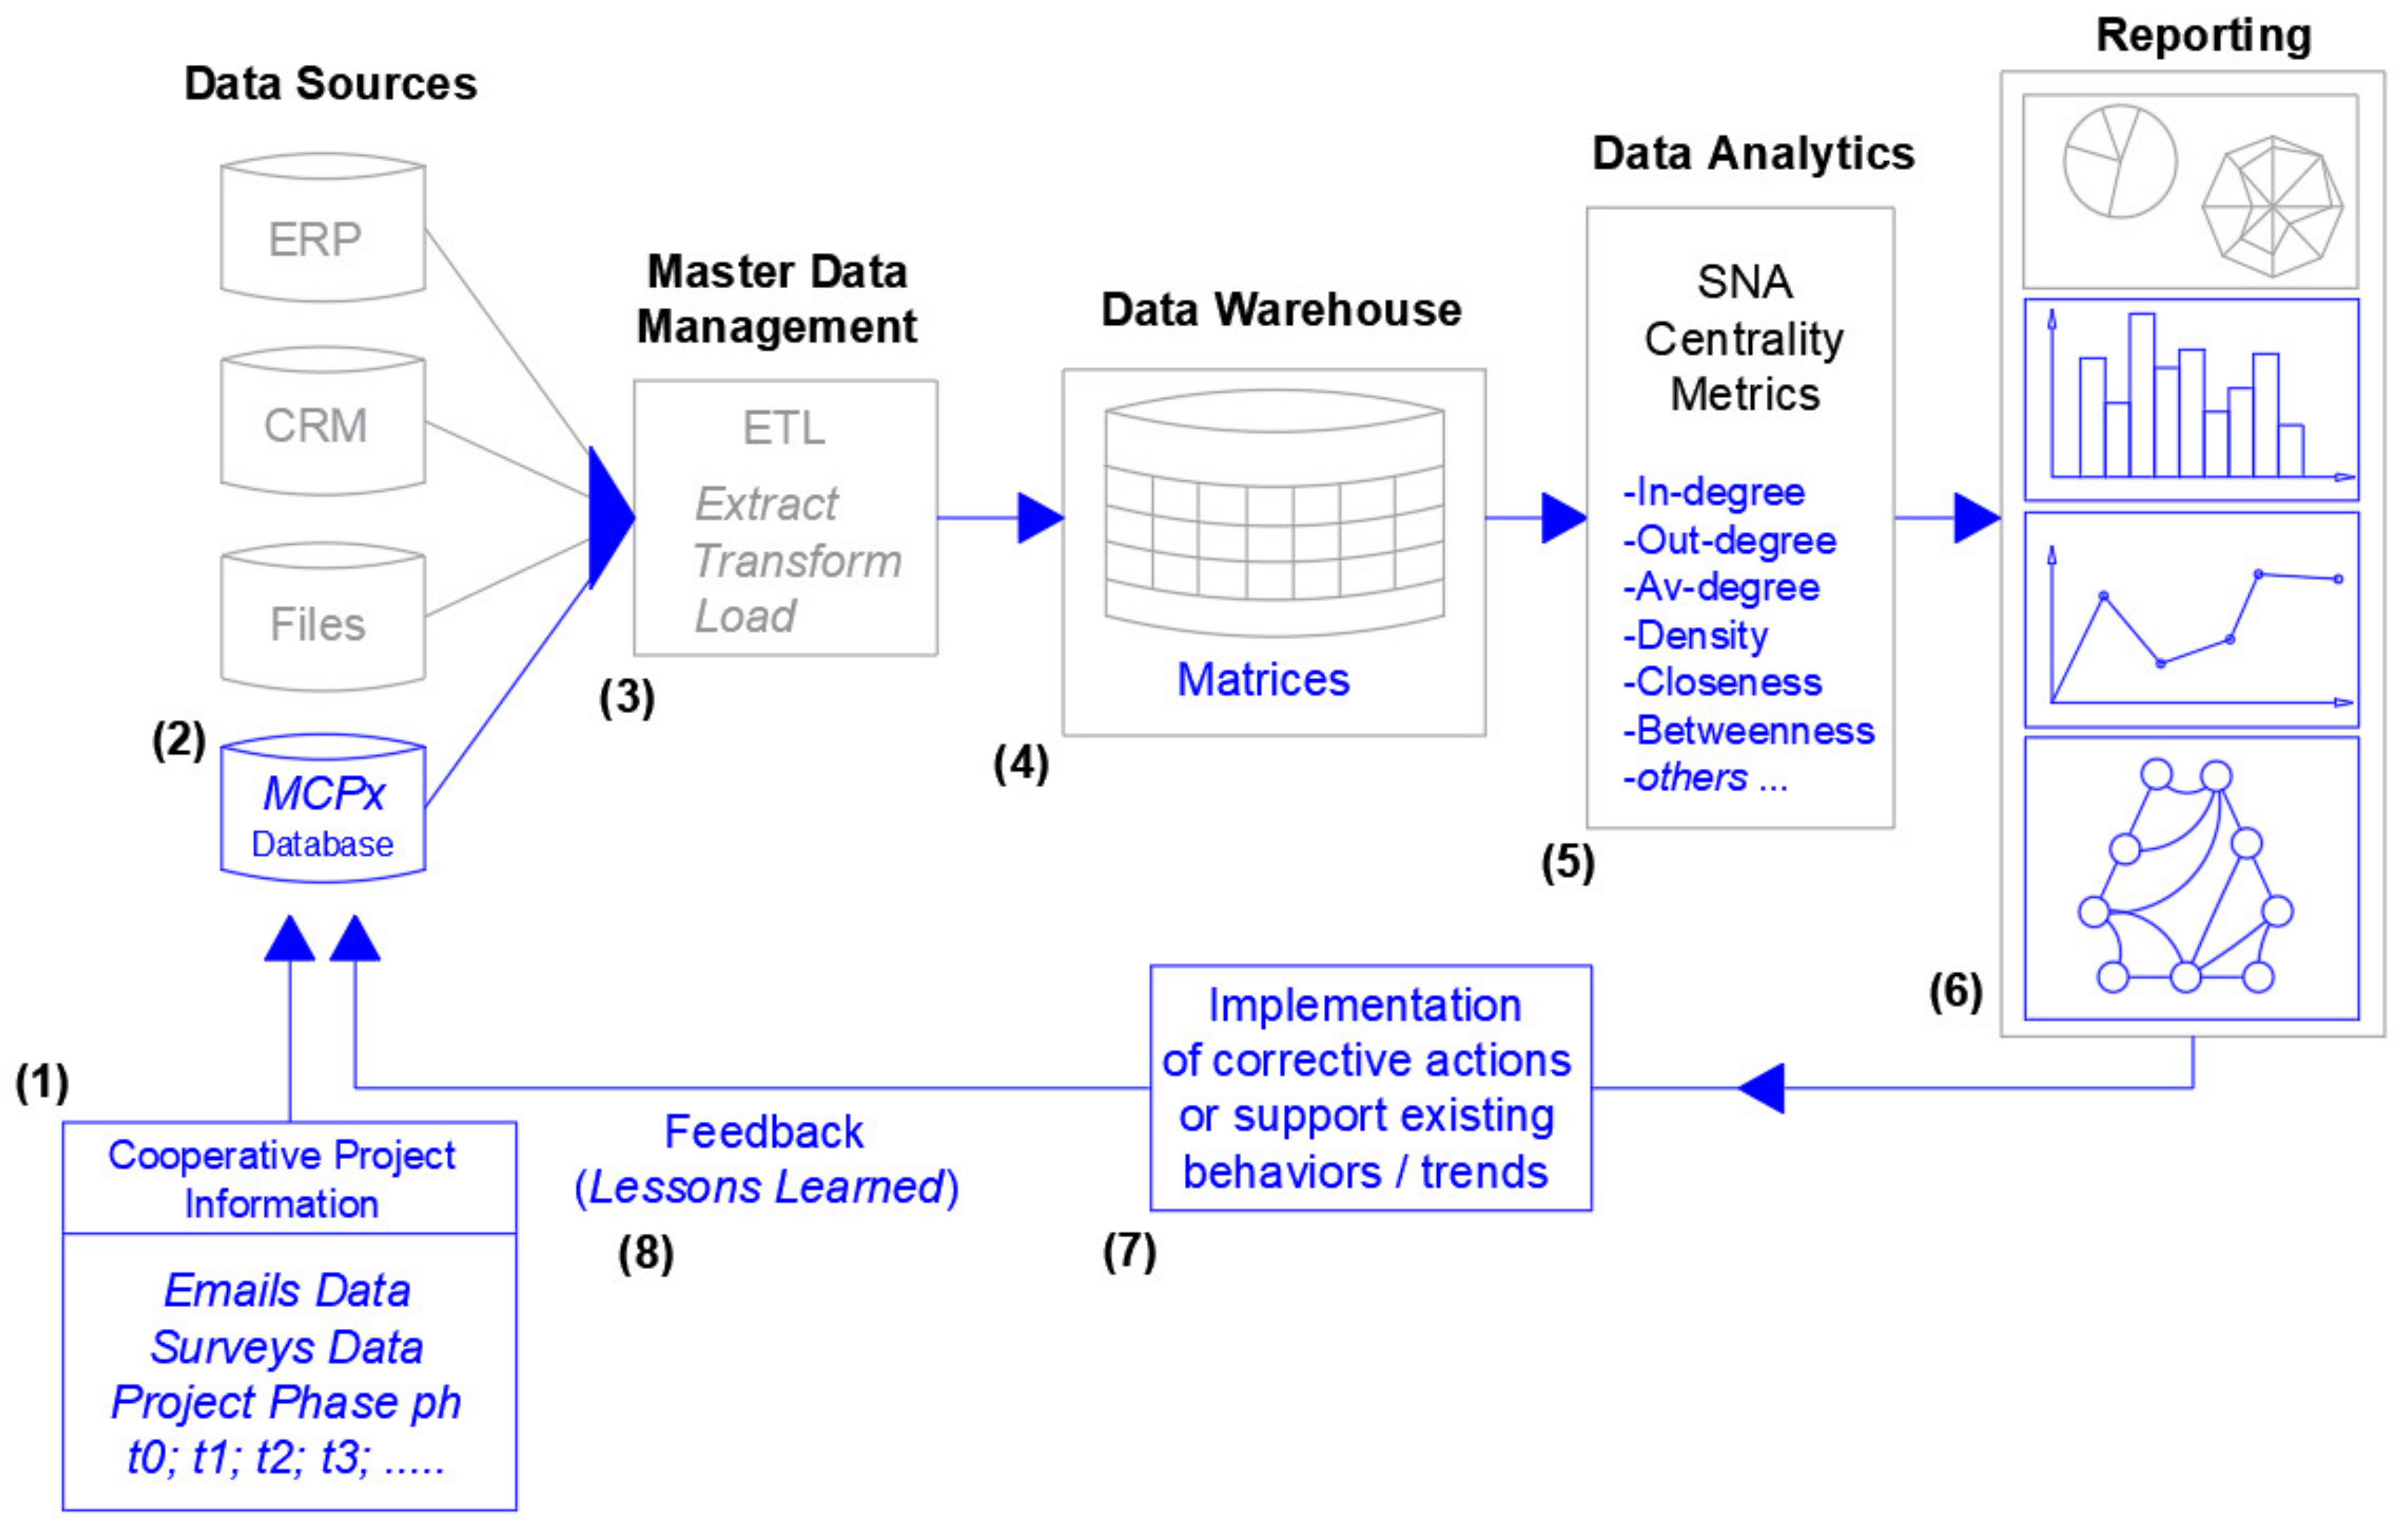
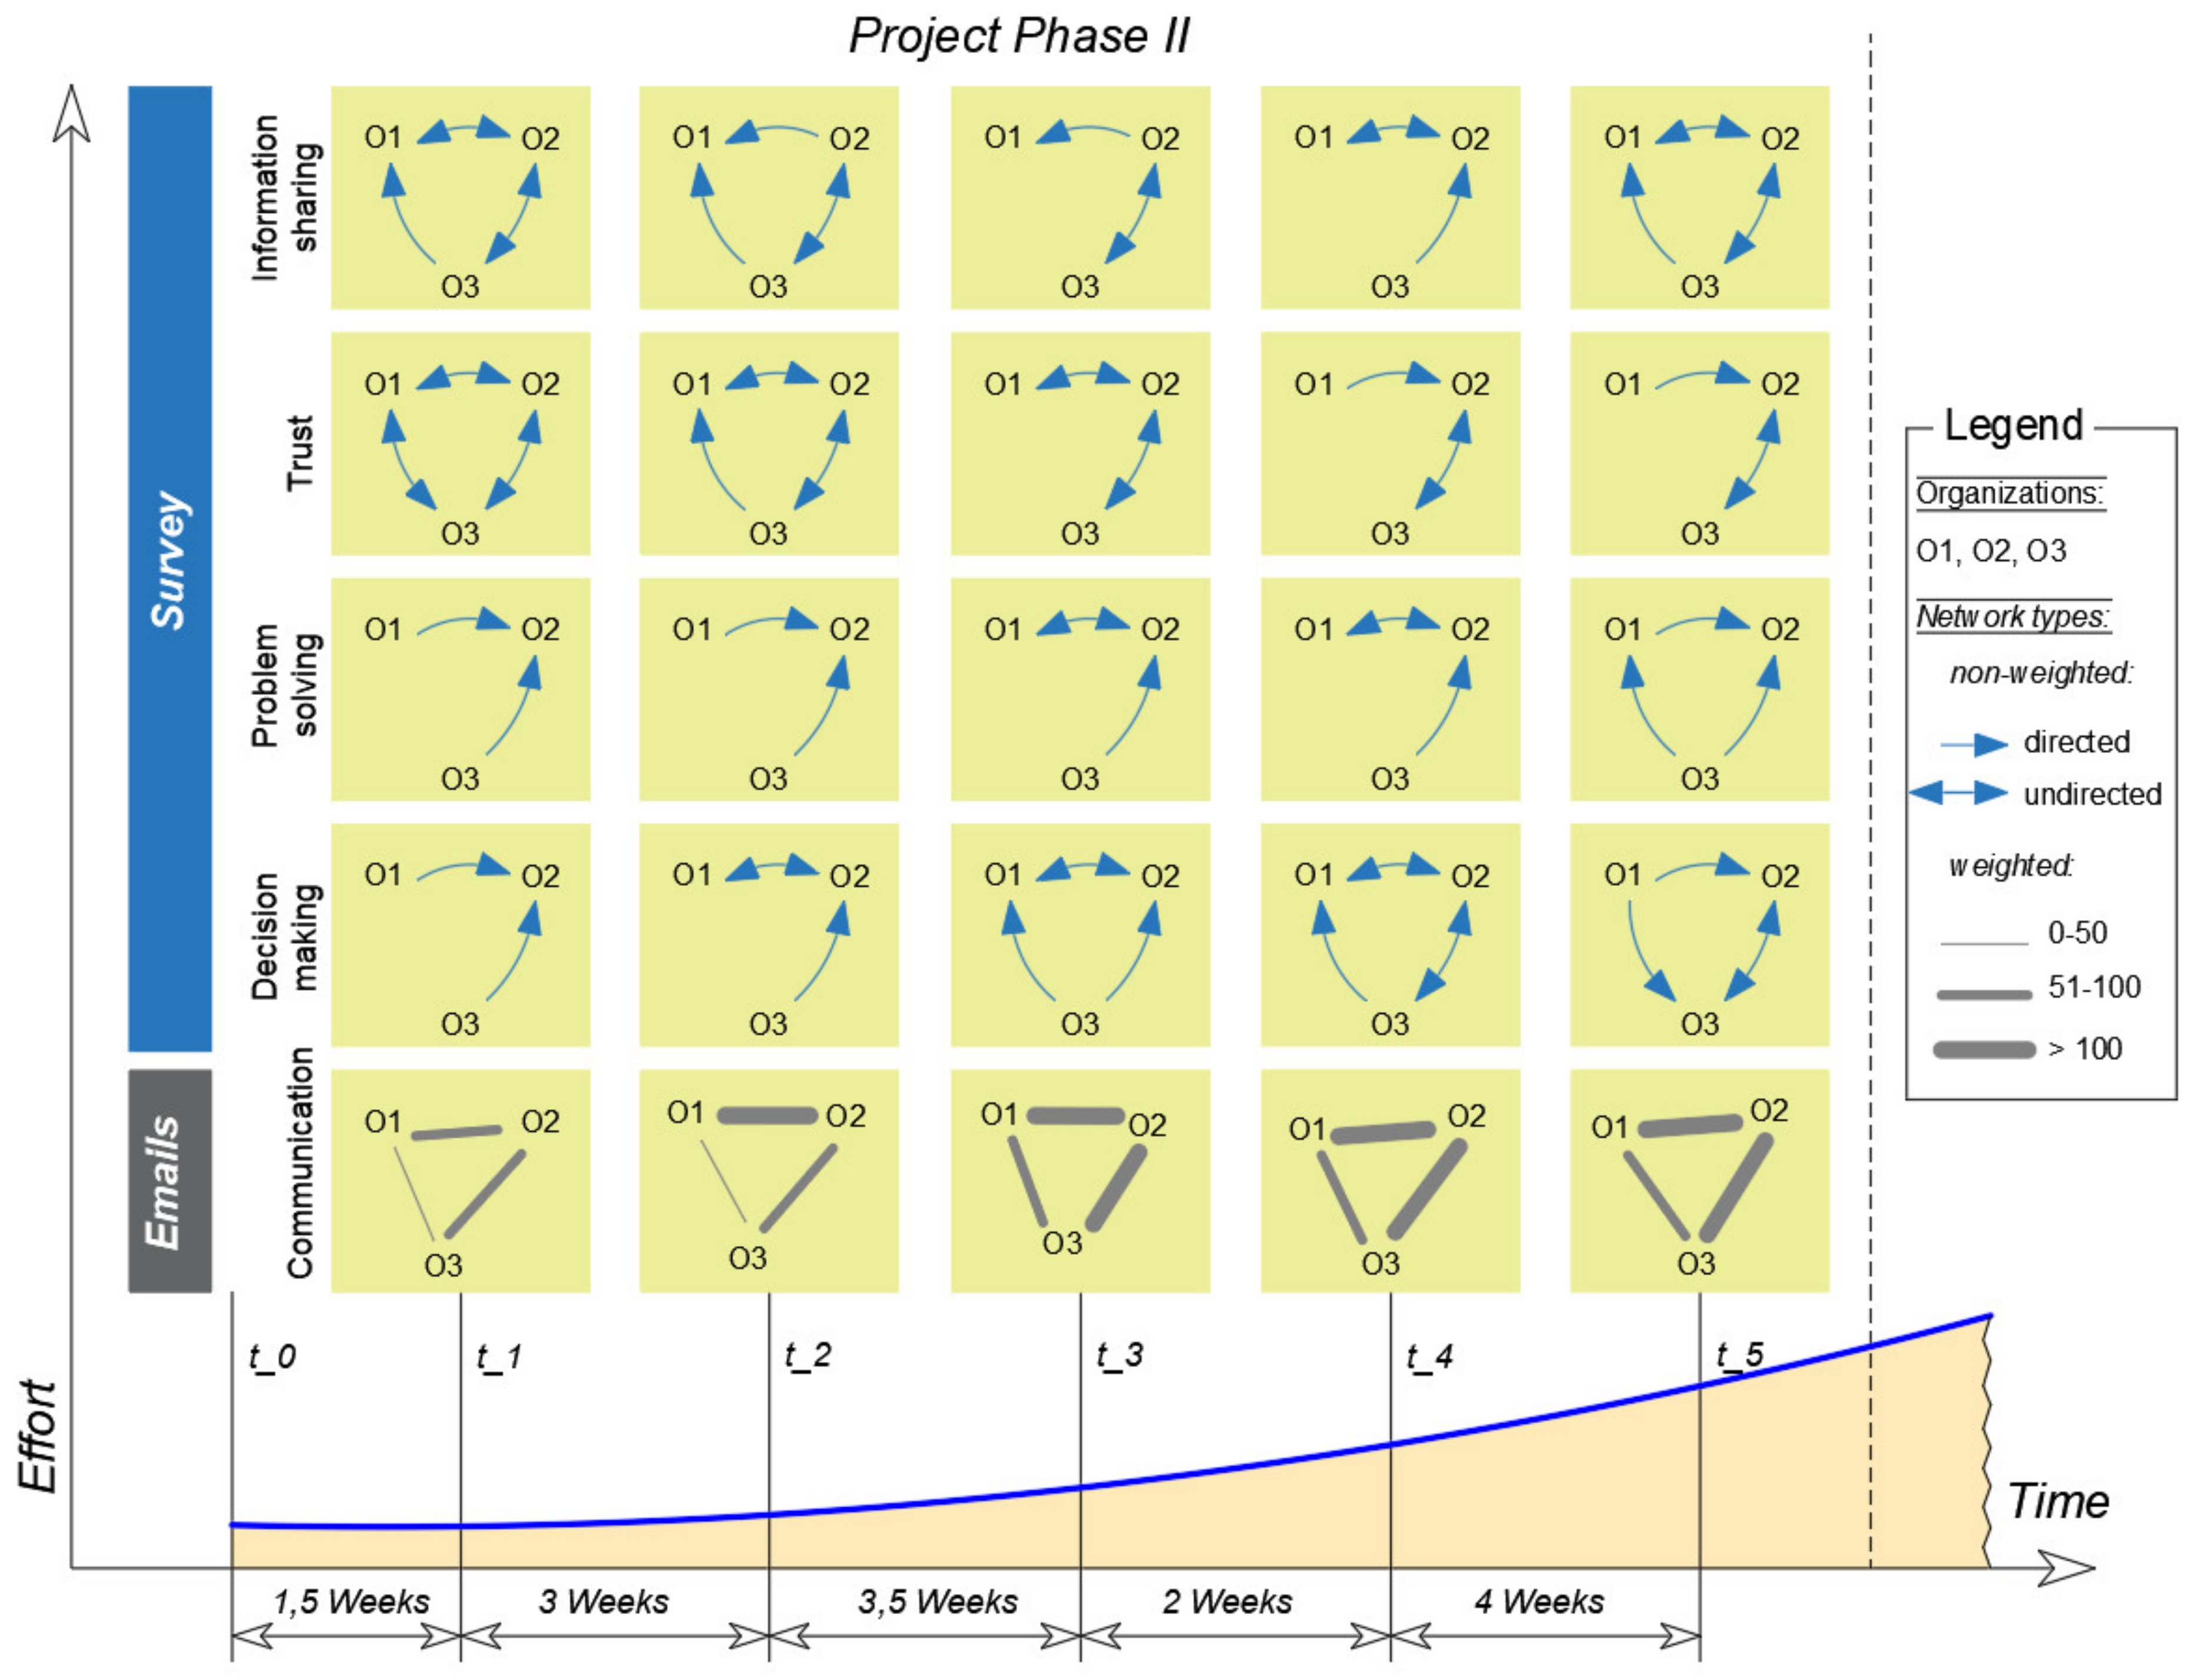
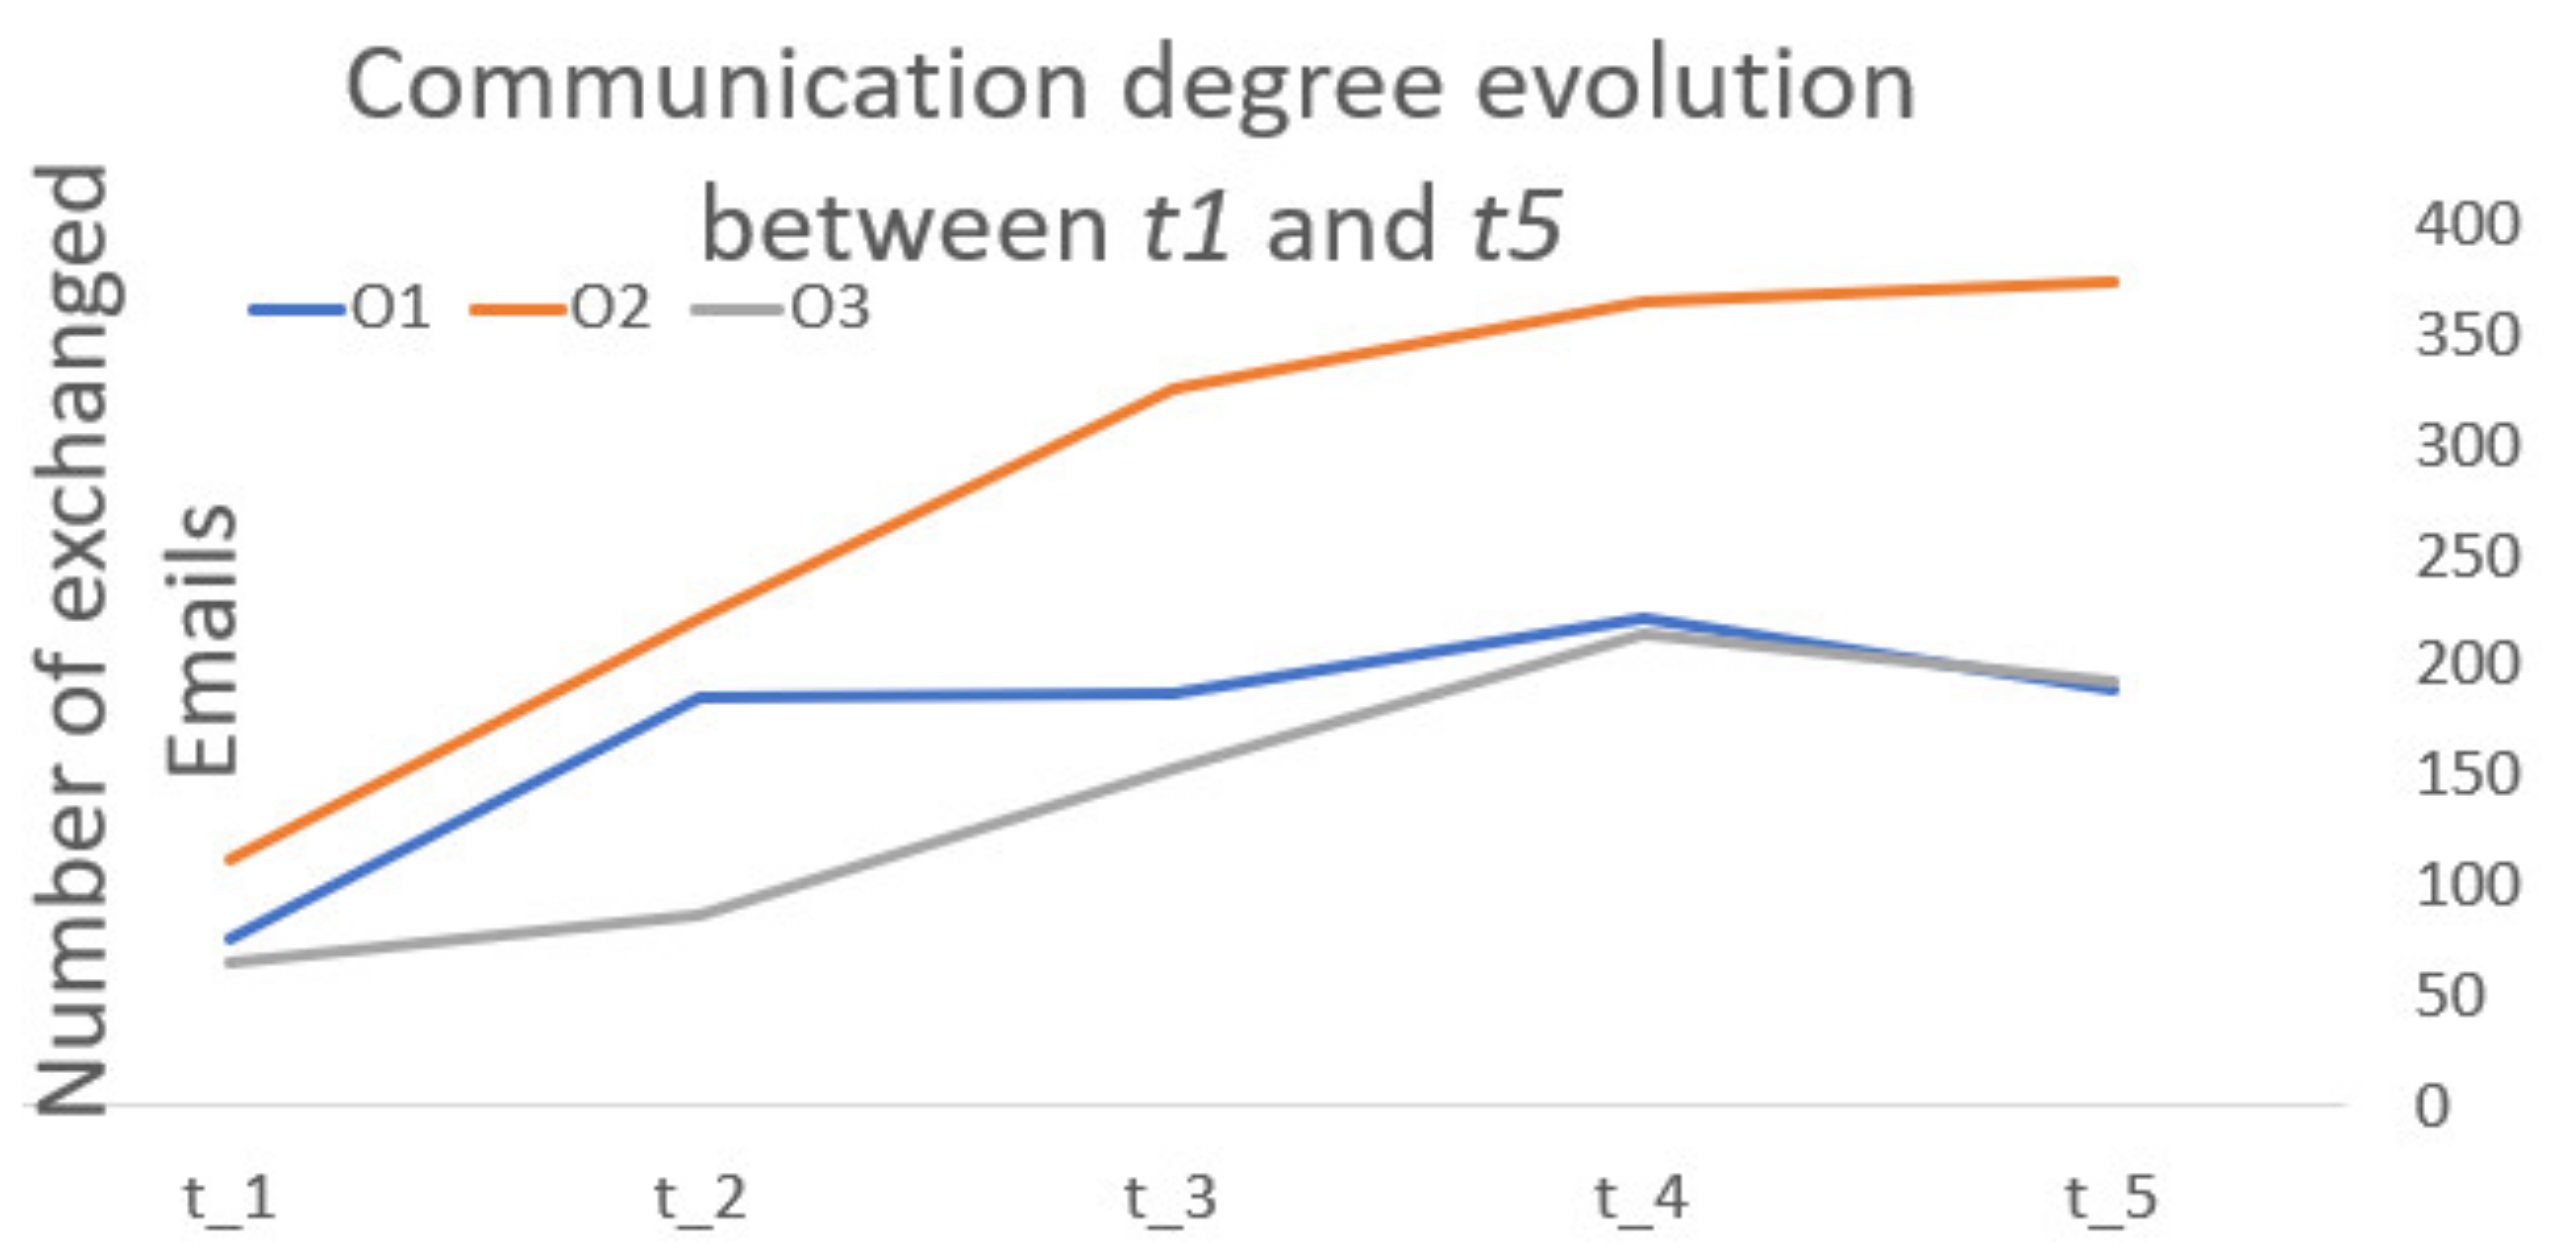
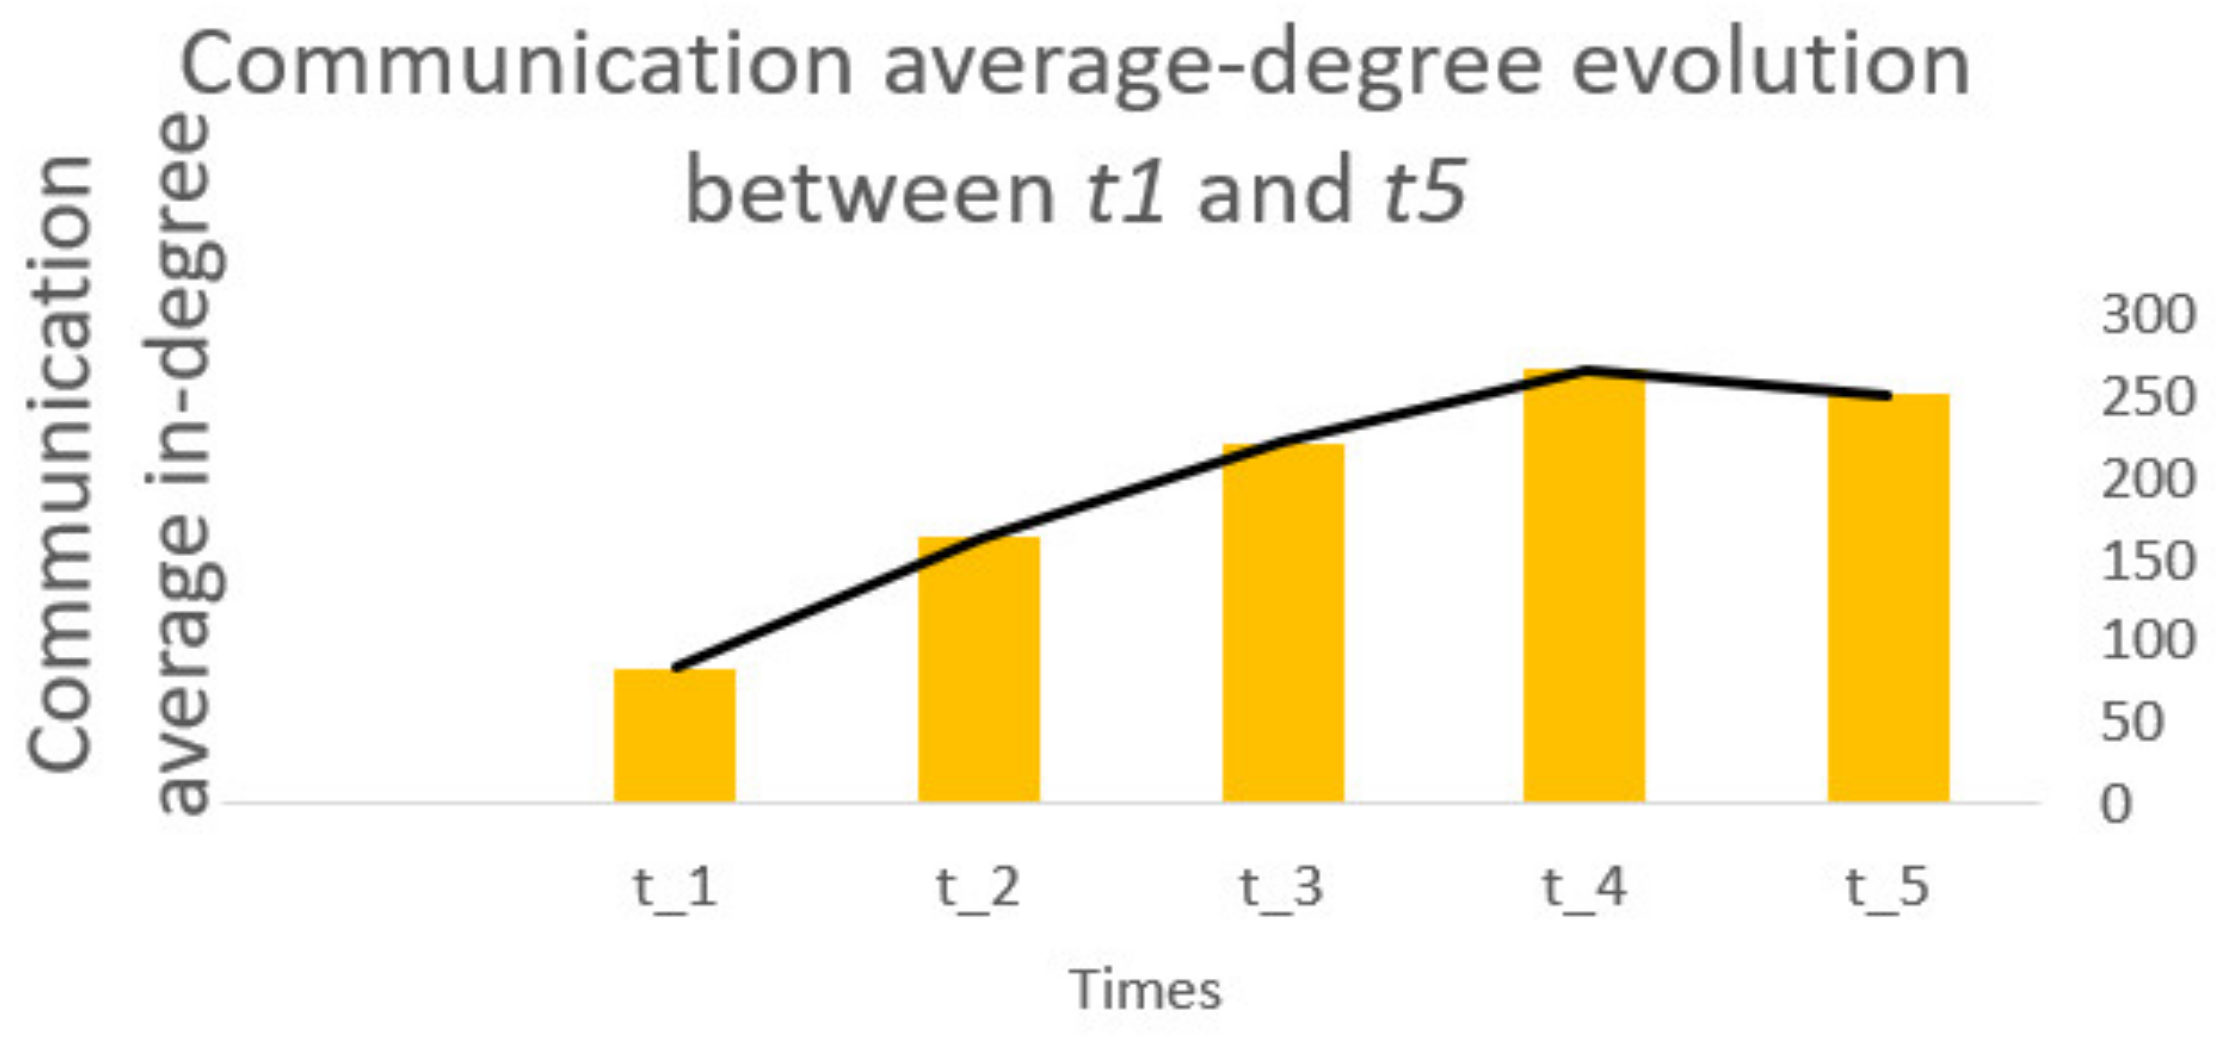
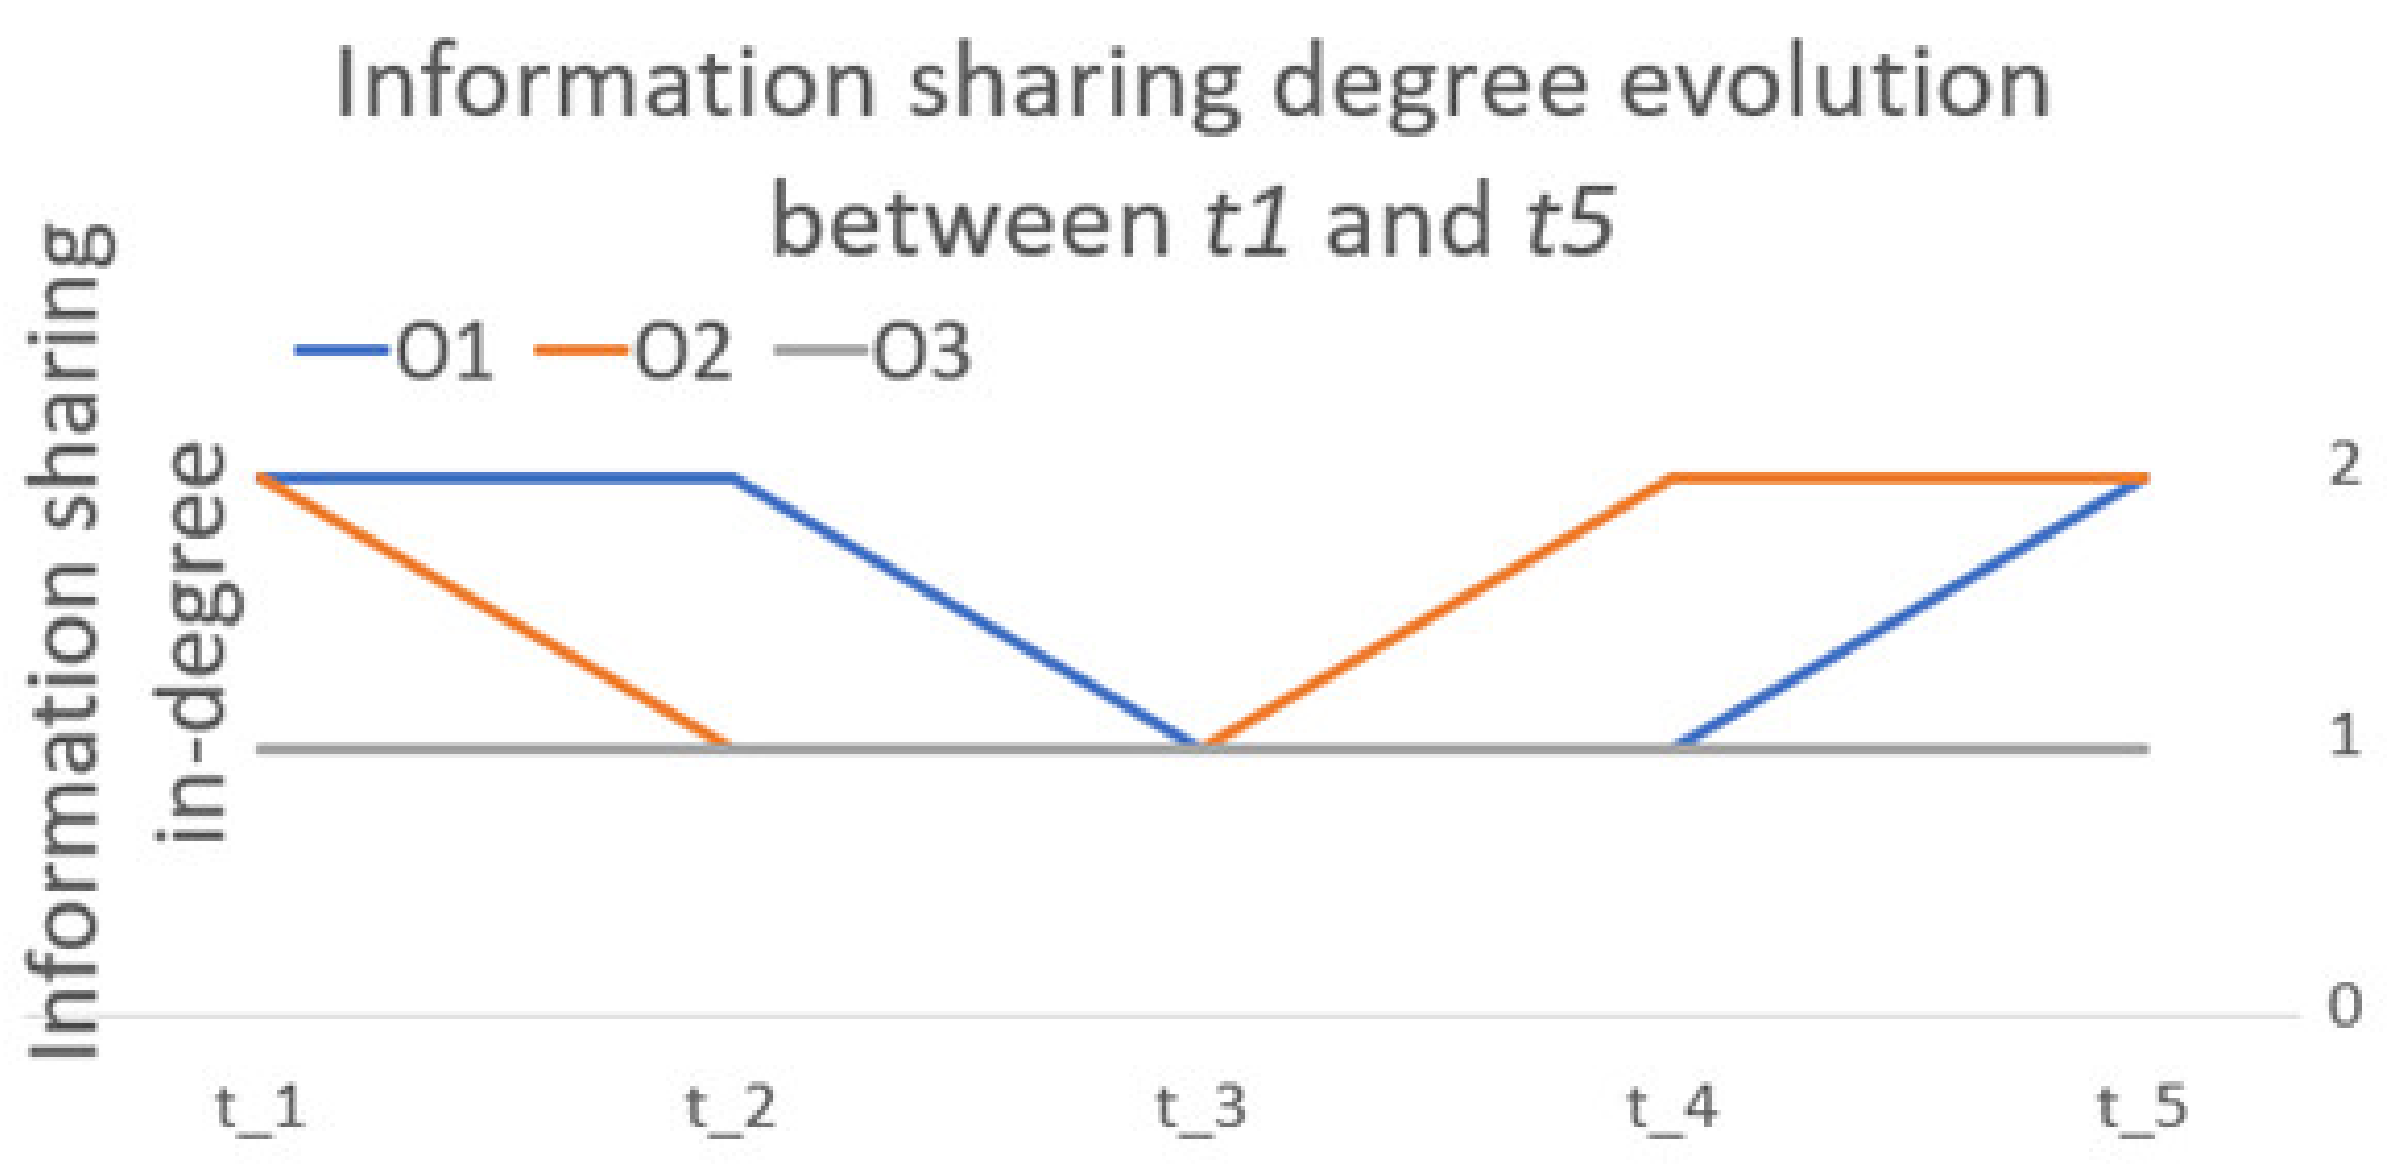
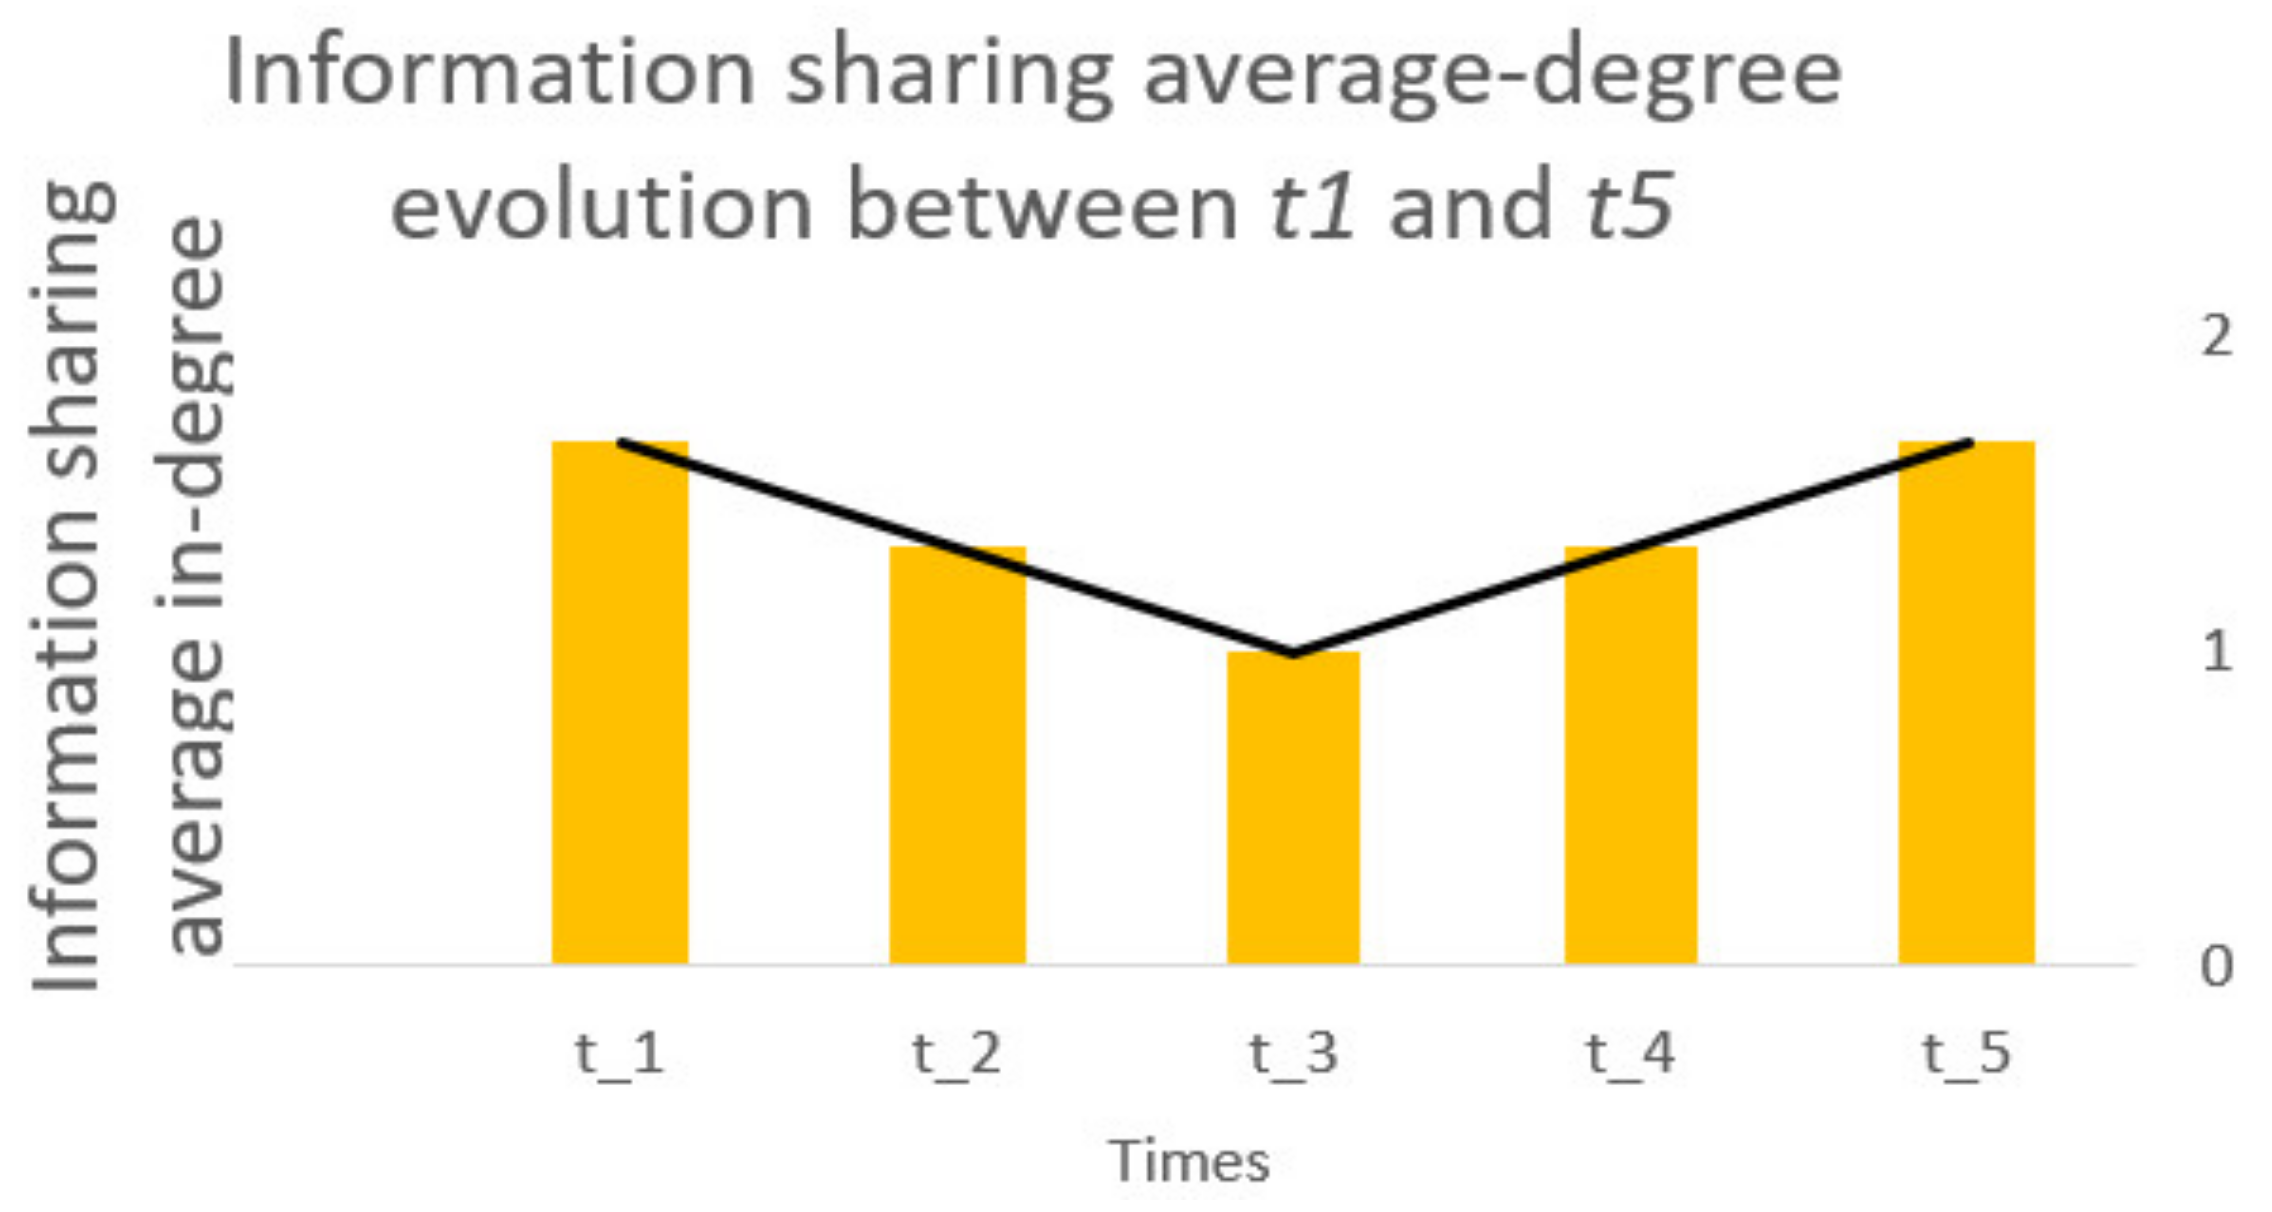
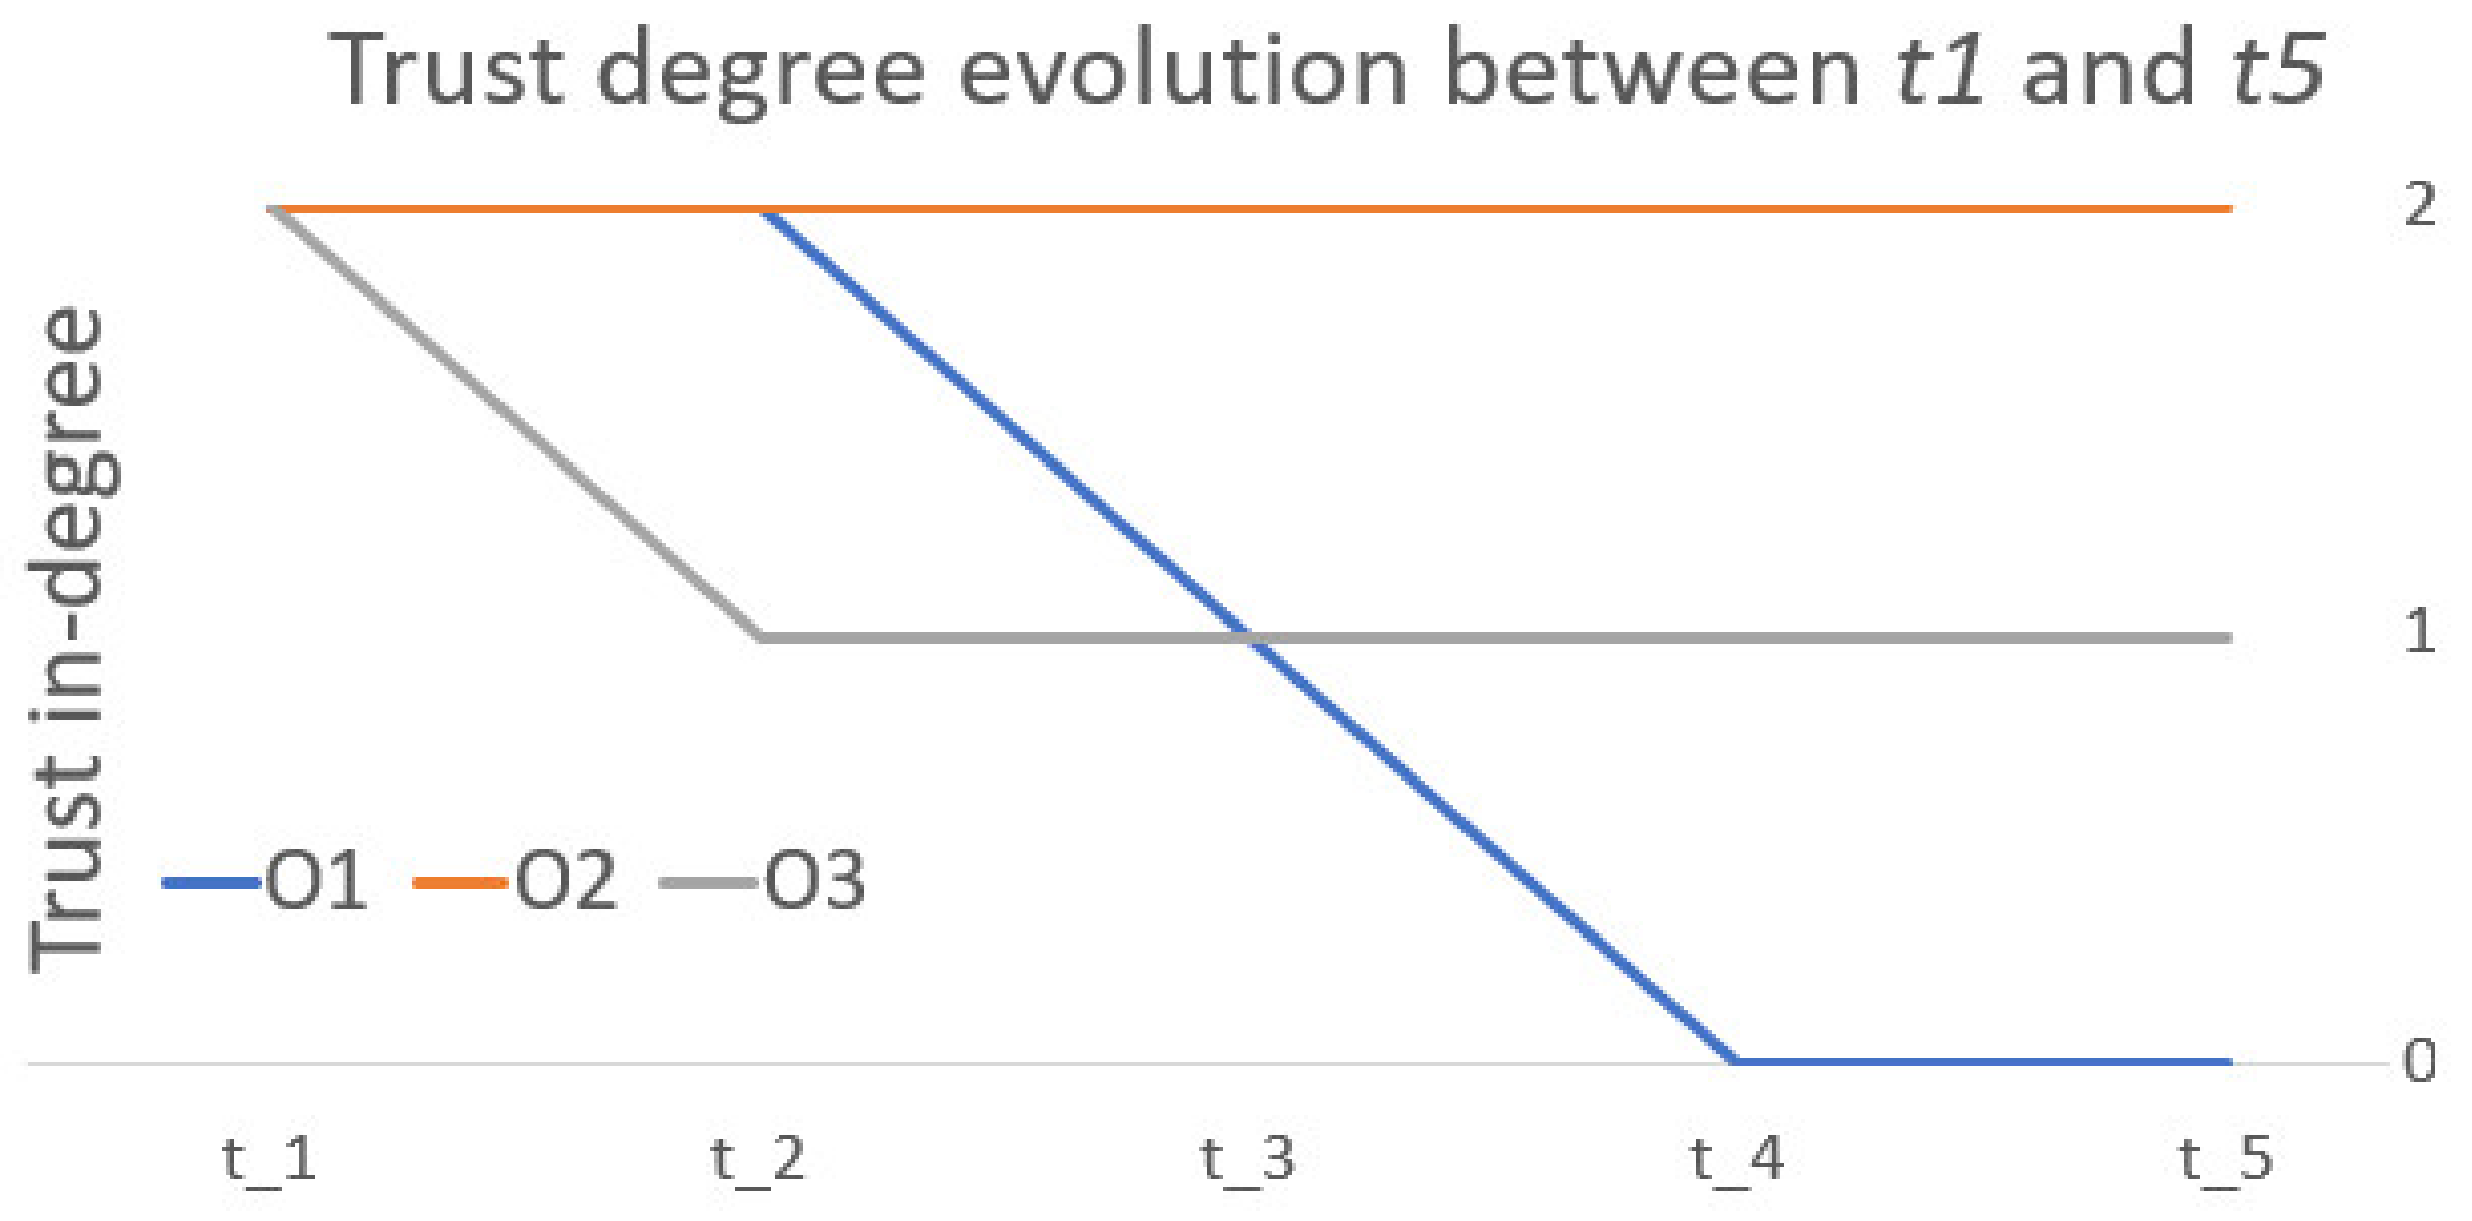
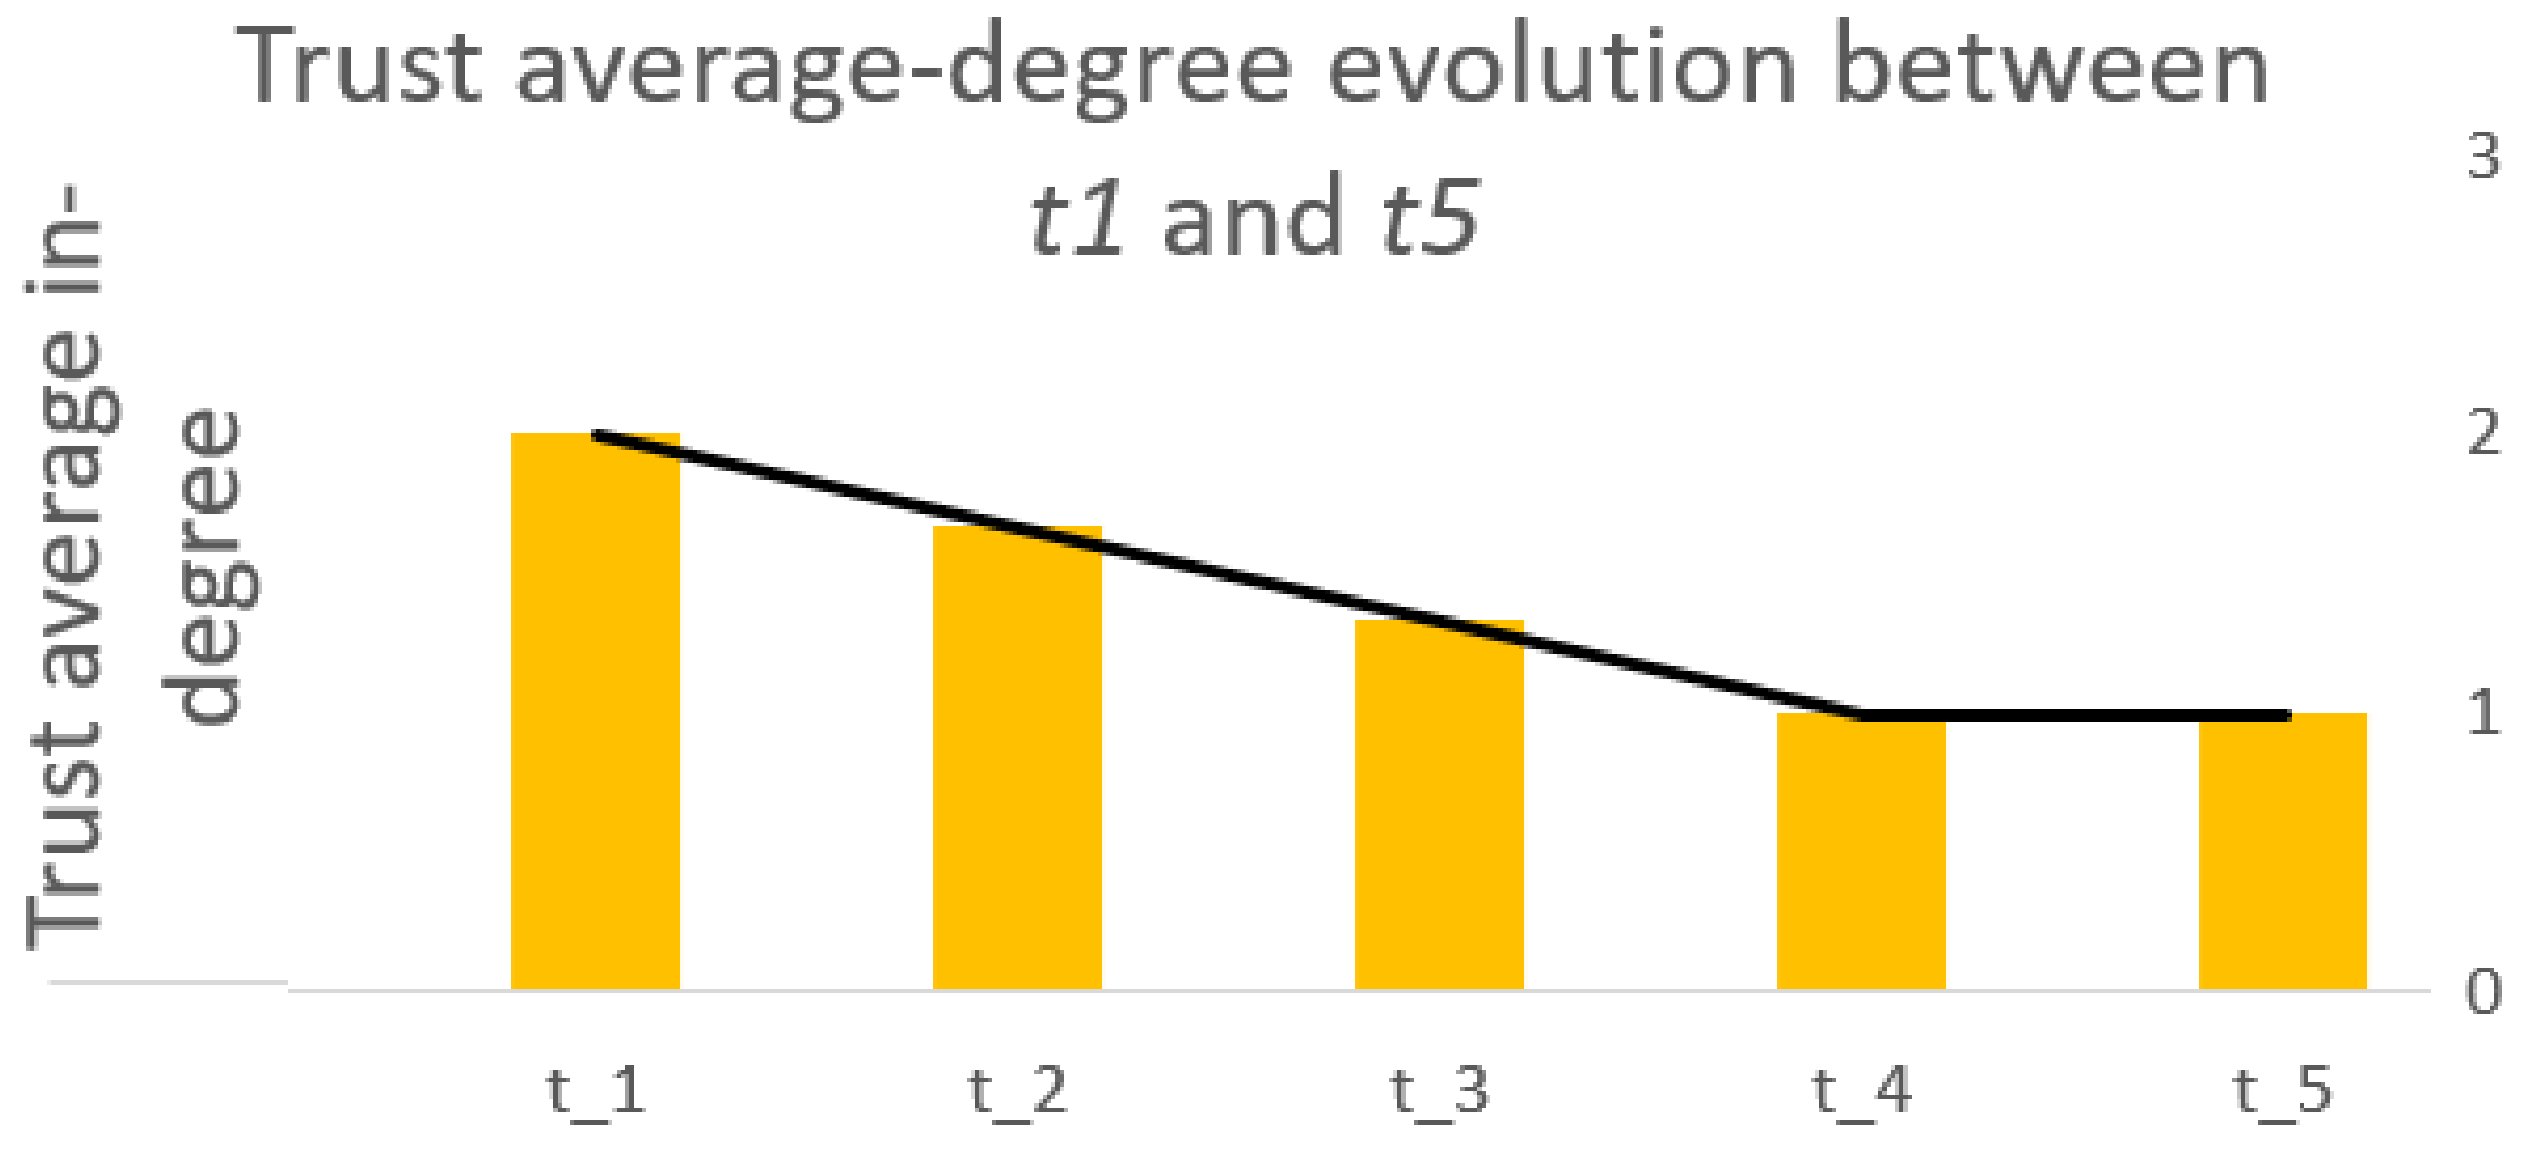
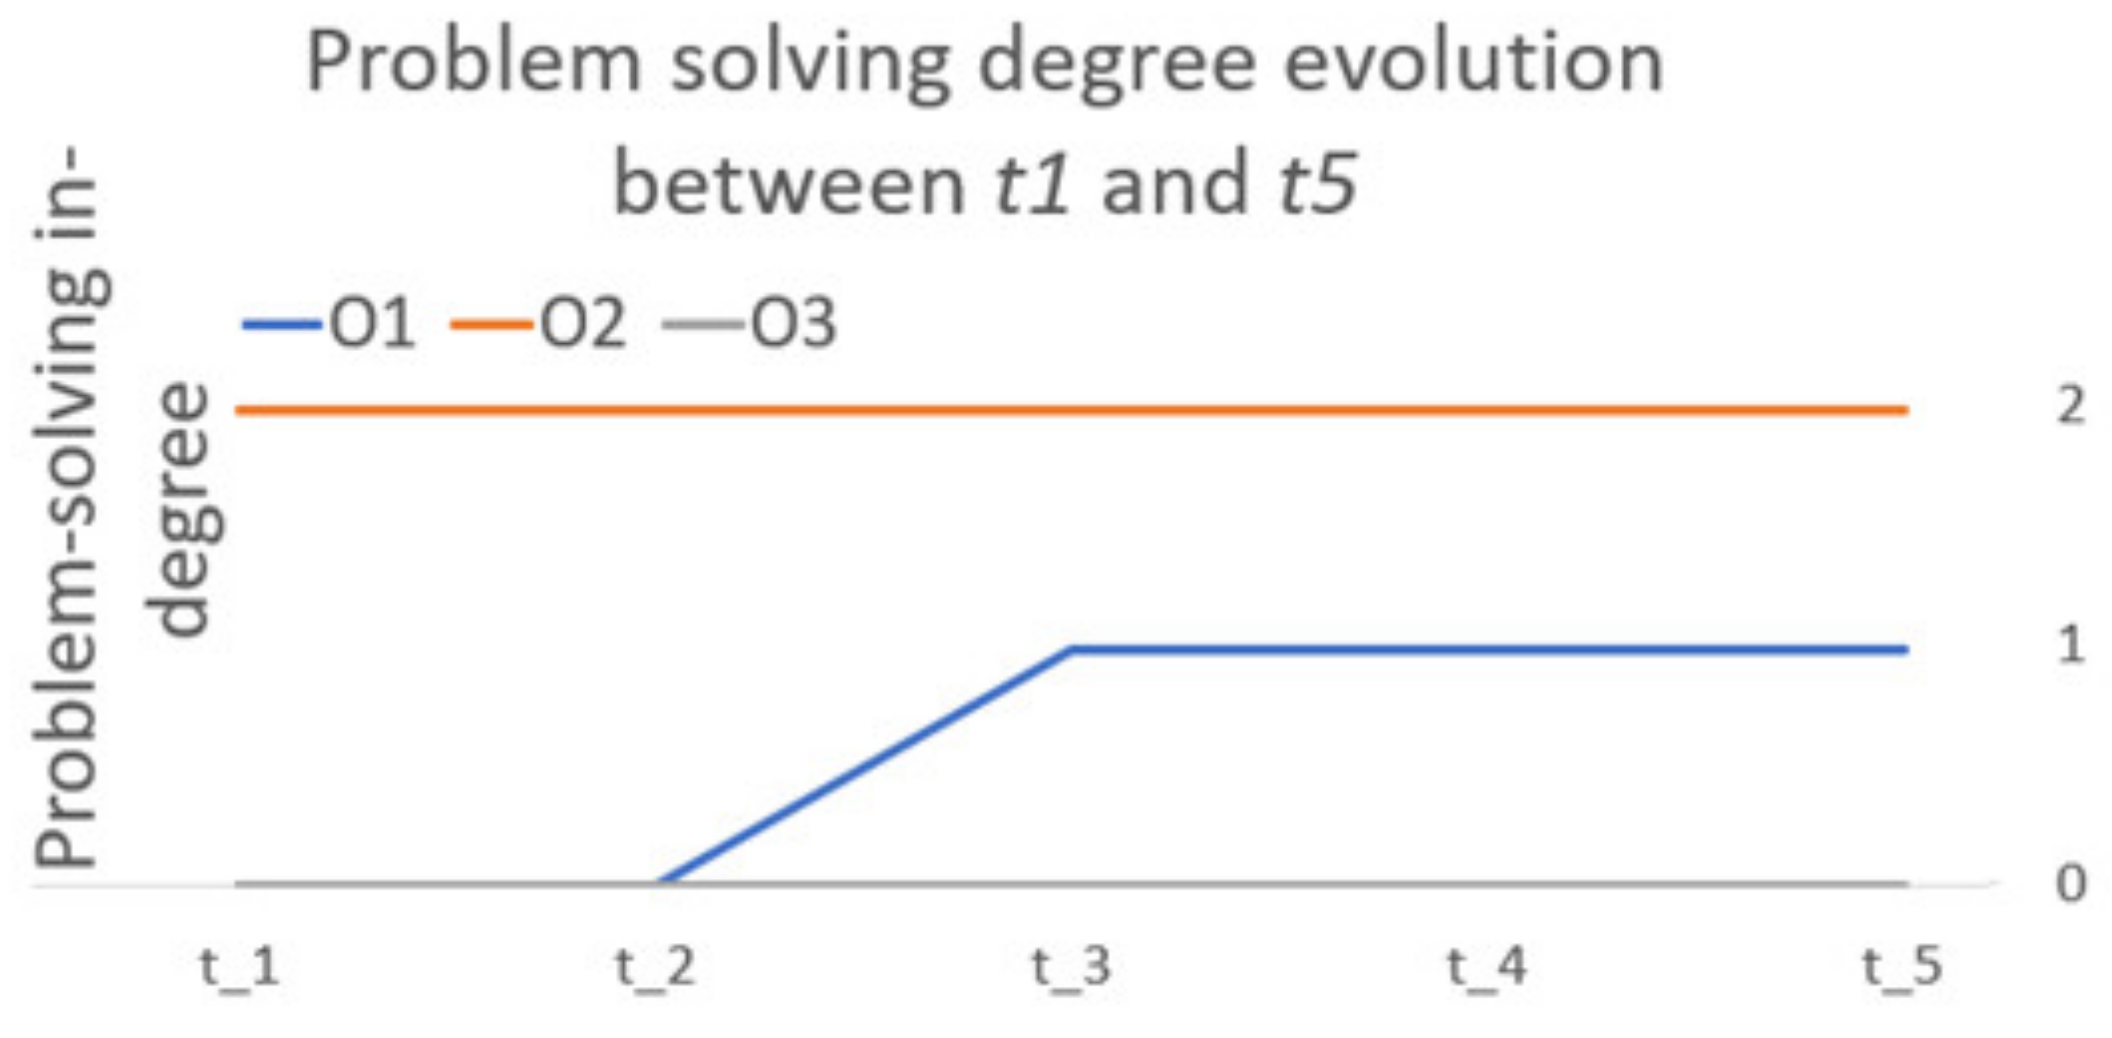
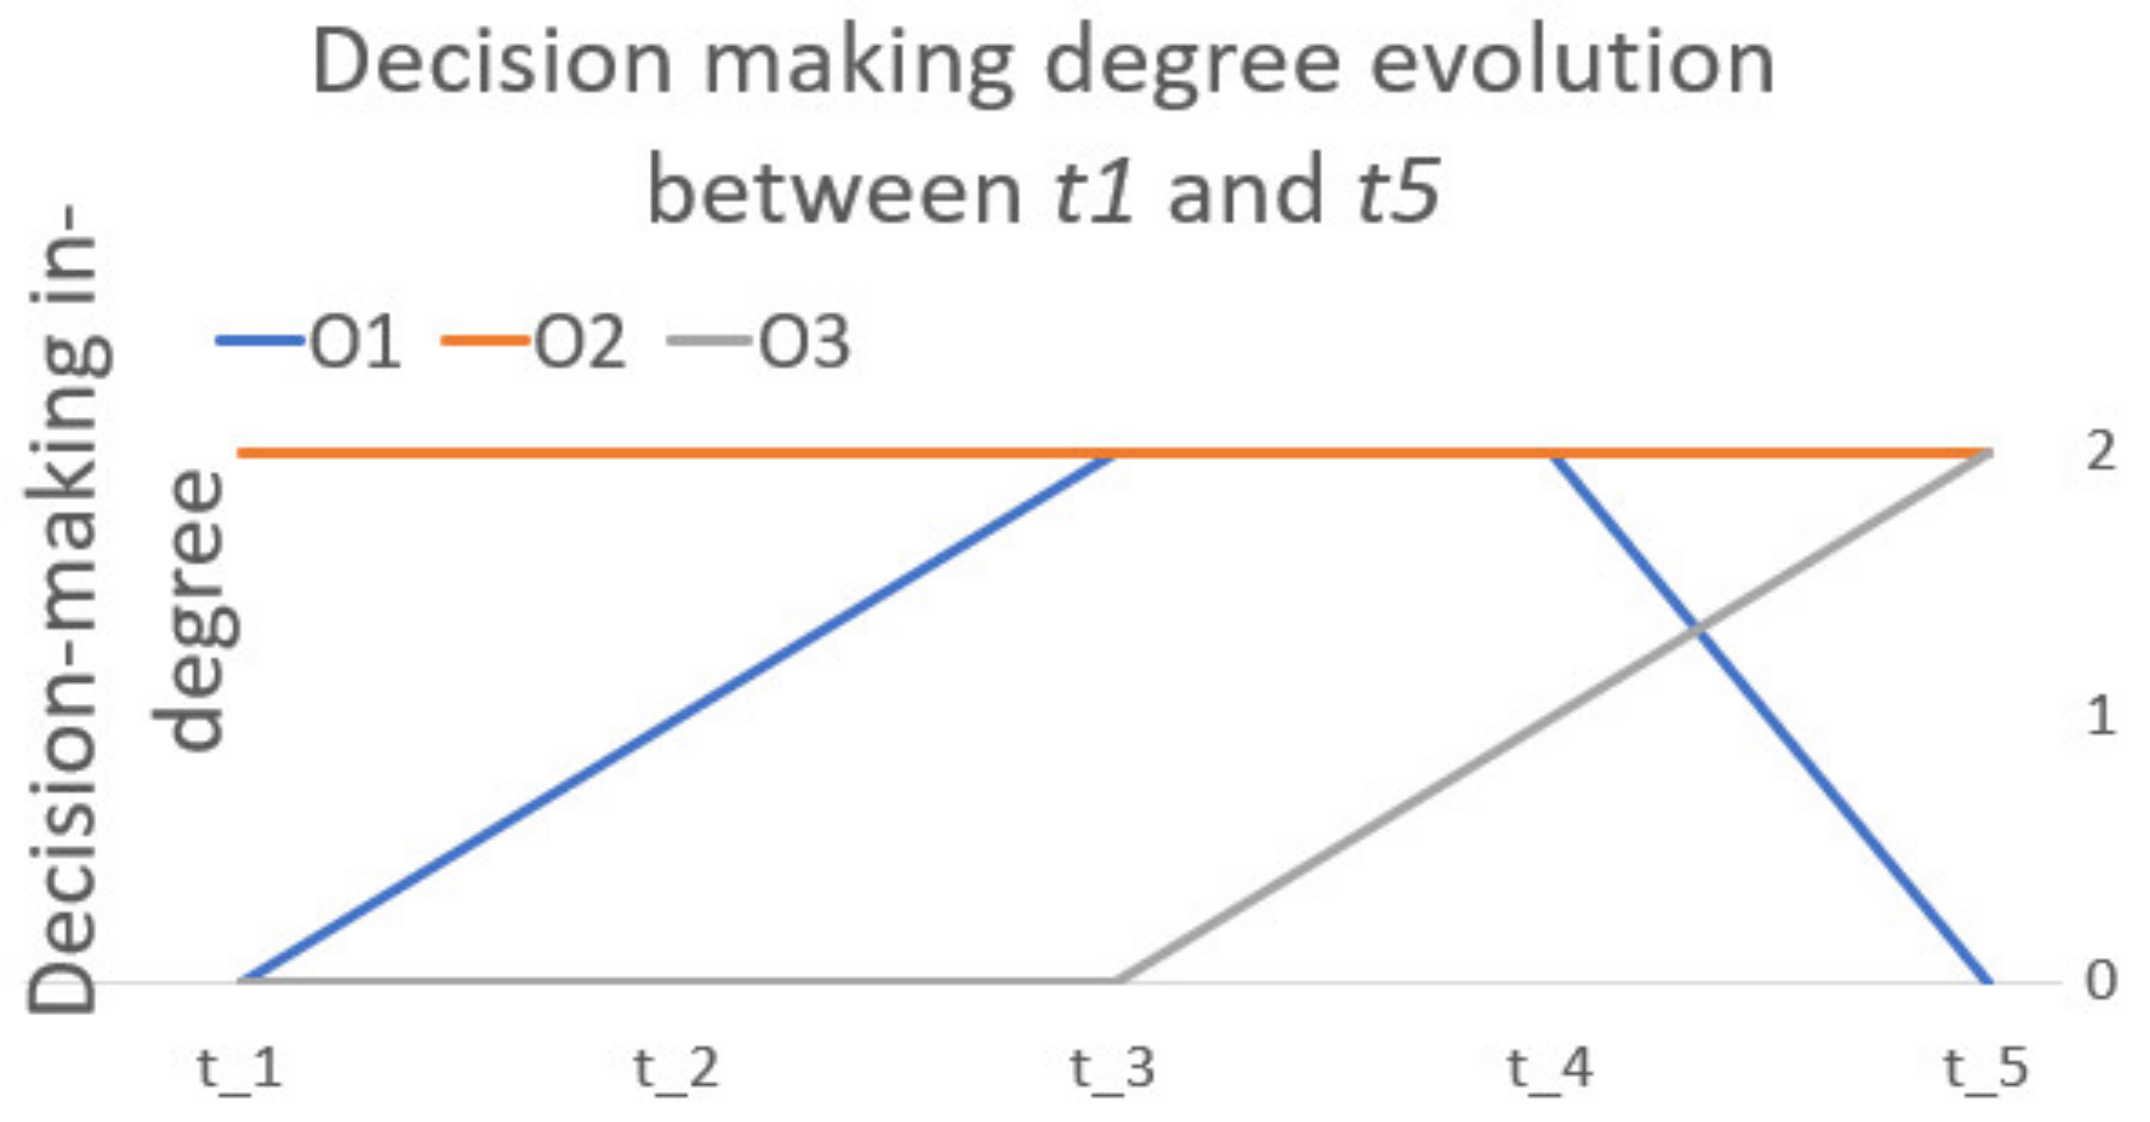
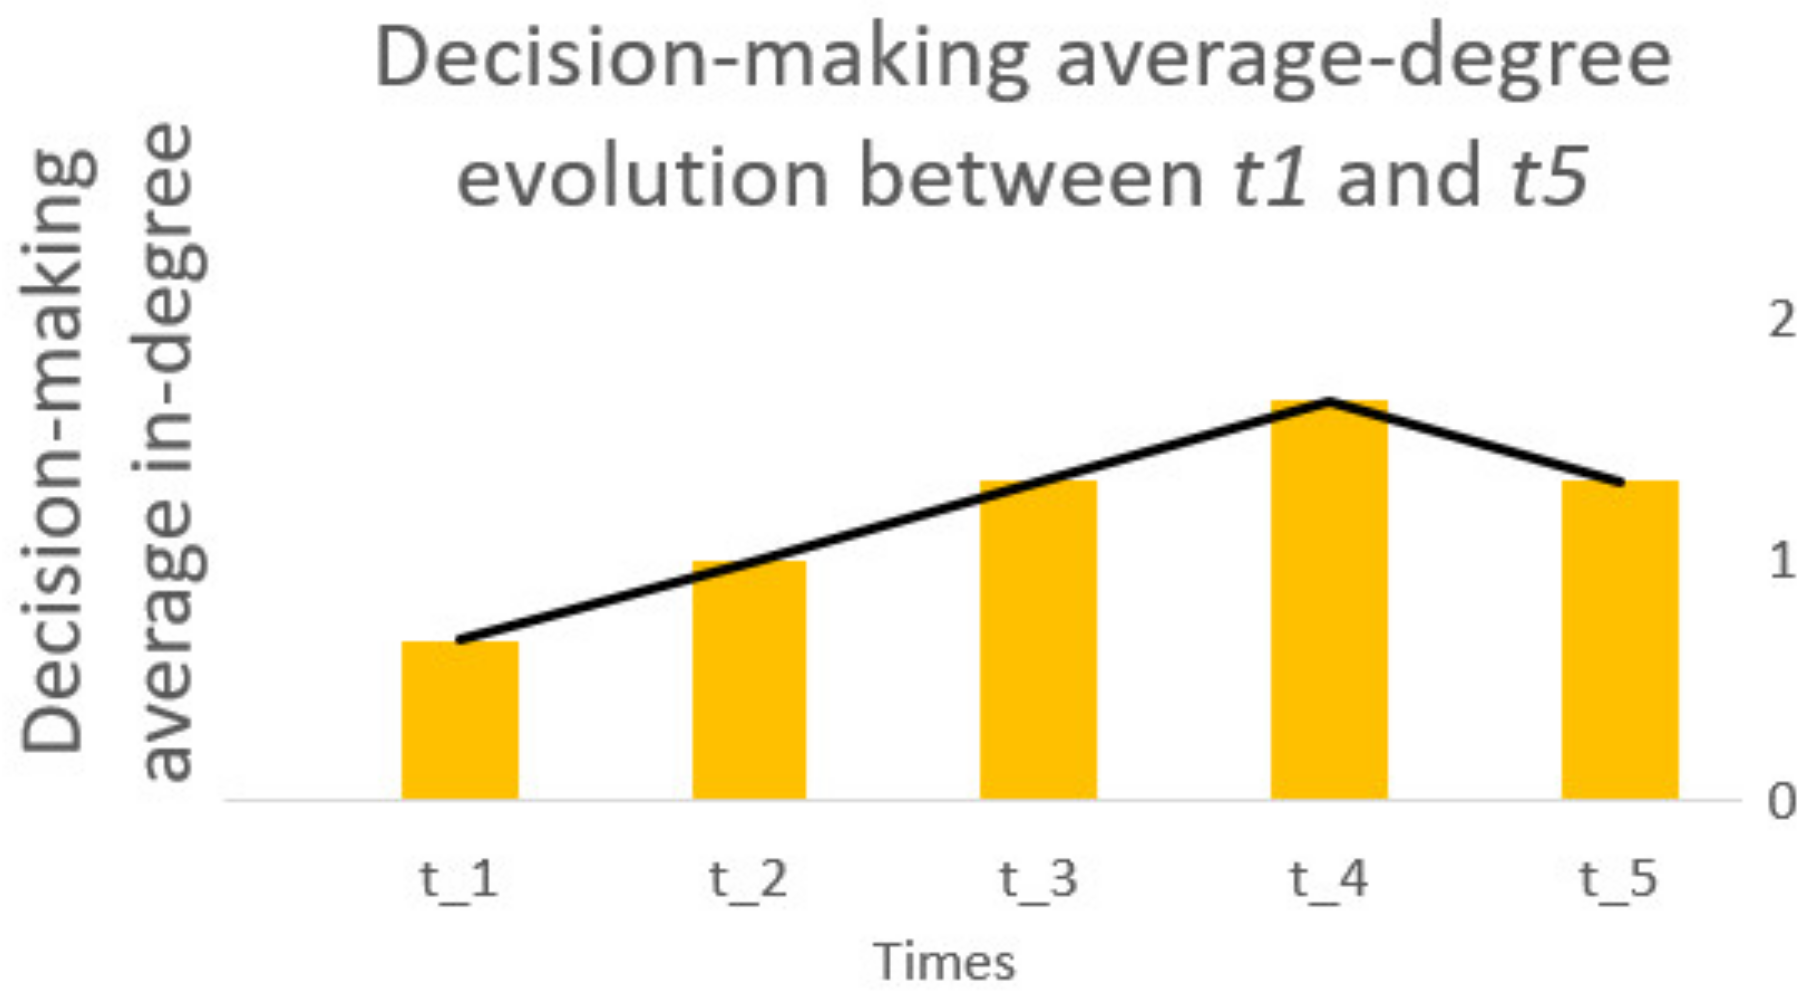
Table 1.
Four critical pillars that support the development of the MCPx model.
| Scientific Pillars | Brief Description Regarding Individual Contributions |
|---|---|
| Project Risk Management | Contributes with the definitions and structure of a typical project (lifecycle, phases, and so on) according to the Project Management Institute [13], and with the definitions and approach process of the risk management standard process according to the International Organization for Standardization [14]. |
| Cooperative Networks | Contributes with the definitions, importance, and key factors regarding cooperation principles between organizations. This work assumes the cooperative principle of performing joint work according to [11]. |
| Social Network Analysis | Provides the tools and techniques (essentially centrality metrics such as in-degree, out-degree, density, average degree, closeness and so on, based on the graph theory) which will quantitatively measure the five key project cooperative behavioral dimensions that emerge and evolve as organizations cooperate to deliver projects. |
| Business Intelligence | Contributes with the typical organizational business intelligence architecture (collecting, transforming, analysing data and reporting) that enables organizations to perform business data analysis in a timely and accurate manner so that they can take more data-informed decisions. |
Table 2.
Four major project risks types according to [28].
Table 2.
Four major project risks types according to [28].
| Risk Types | Brief Description | Recommended Management Approach |
|---|---|---|
| Event Risk | Also known as “stochastic uncertainty”, these are risks that relate to something that has not yet occurred, but if it comes to occur, will impact on one or more project objectives. | Risk Management Standards tools and techniques. |
| Variability risk | Also known as “aleatoric uncertainty “, comprising different possible known outcomes, but no one knows which one will really occur. | Advanced tools and techniques such as the Monte Carlo simulation. |
| Ambiguity risk | Also known as “epistemic uncertainty “, emerging from lack of knowledge or understanding (also called of know-how and know-what risks). These risks comprise the use of new technology, market conditions, and competitor capability, just to name a few. | Lessons learned (learning from experience). Simulations and prototyping. |
| Emergent risk | Also known as “ontological uncertainty “or “Black Swans”, these are risks unable to be identified because they are just outside one’s experience or mindset. Usually these types of risks arise from game-changers or disruptive innovations. | Contingency planning. |
Table 3.
MCP model´s social betwork analysis centrality metrics.
| Networks or Dimensions (D) | Data Sources | Objectives and Applied SNA Centrality Metrics | |
|---|---|---|---|
| D1: Communication | Emails: All exchanged email data between all organizations that participated in the different phases of a cooperative project lifecycle. This project-related information is to be collected at the end of each project timing t. | SNA Metric 1: Weighted Total-Degree | |
| (1) | |||
where:
SNA Metric 2: Average weighted total-degree | |||
| (2) | |||
where:
| |||
| D2: Information sharing | Survey: Addressed to all organizations that participated in the different phases of a cooperative project lifecycle. This project-related information, is to be collected in each project timing t. | SNA Metric 3: In-degree | |
| (3) | |||
where:
SNA Metric 2: Average In-degree | |||
| (4) | |||
where:
| |||
| D3: Trust | Survey: Addressed to all organizations that participated in the different phases of a cooperative project lifecycle. This project-related information is to be collected in each project timing t. | SNA Metric 1: In-degree (see (3)). Objective 1: Identify who is more or less central within the project trust network. It maps the trust network and identifies who discusses in confidence sensitive information and ideas, and to whom. SNA Metric 2: In-degree (see (4)). Objective 2: Map the evolution across the different project phases of the trust network. | |
| D4: Problem solving | Survey: Addressed to all organizations that participated in the different phases of a cooperative project lifecycle. This project-related information is to be collected in each project timing t. | SNA Metric 1: In-degree (see (3)). Objective 1: Identify who are the organizations that belong to a given project problem solving network. It maps the problem-solving network and identifies who knows what and how. SNA Metric 2: In-degree (see (4)). Objective 2: Map the evolution across the different project phases of the problem-solving network. | |
| D5: Decision making | Survey: Addressed to all organizations that participated in the different phases of a cooperative project lifecycle. This project-related information is to be collected in each project timing t. | SNA Metric 1: In-degree (see (3)). Objective 1: Identifies who are the decision-making organizations with the cooperative project network. SNA Metric 2: In-degree (see (4)). Objective 2: Map the evolution across the different project phases of the decision-making network |
Publisher’s Note: MDPI stays neutral with regard to jurisdictional claims in published maps and institutional affiliations. |
© 2021 by the authors. Licensee MDPI, Basel, Switzerland. This article is an open access article distributed under the terms and conditions of the Creative Commons Attribution (CC BY) license (https://creativecommons.org/licenses/by/4.0/).
Share and Cite
MDPI and ACS Style
Nunes, M.; Abreu, A.; Saraiva, C. A Model to Manage Cooperative Project Risks to Create Knowledge and Drive Sustainable Business. Sustainability 2021, 13, 5798. https://0-doi-org.brum.beds.ac.uk/10.3390/su13115798
AMA Style
Nunes M, Abreu A, Saraiva C. A Model to Manage Cooperative Project Risks to Create Knowledge and Drive Sustainable Business. Sustainability. 2021; 13(11):5798. https://0-doi-org.brum.beds.ac.uk/10.3390/su13115798
Chicago/Turabian StyleNunes, Marco, António Abreu, and Célia Saraiva. 2021. "A Model to Manage Cooperative Project Risks to Create Knowledge and Drive Sustainable Business" Sustainability 13, no. 11: 5798. https://0-doi-org.brum.beds.ac.uk/10.3390/su13115798
Note that from the first issue of 2016, this journal uses article numbers instead of page numbers. See further details here.