1. Introduction
1.1. Environmental Risk in Restaurant Industry
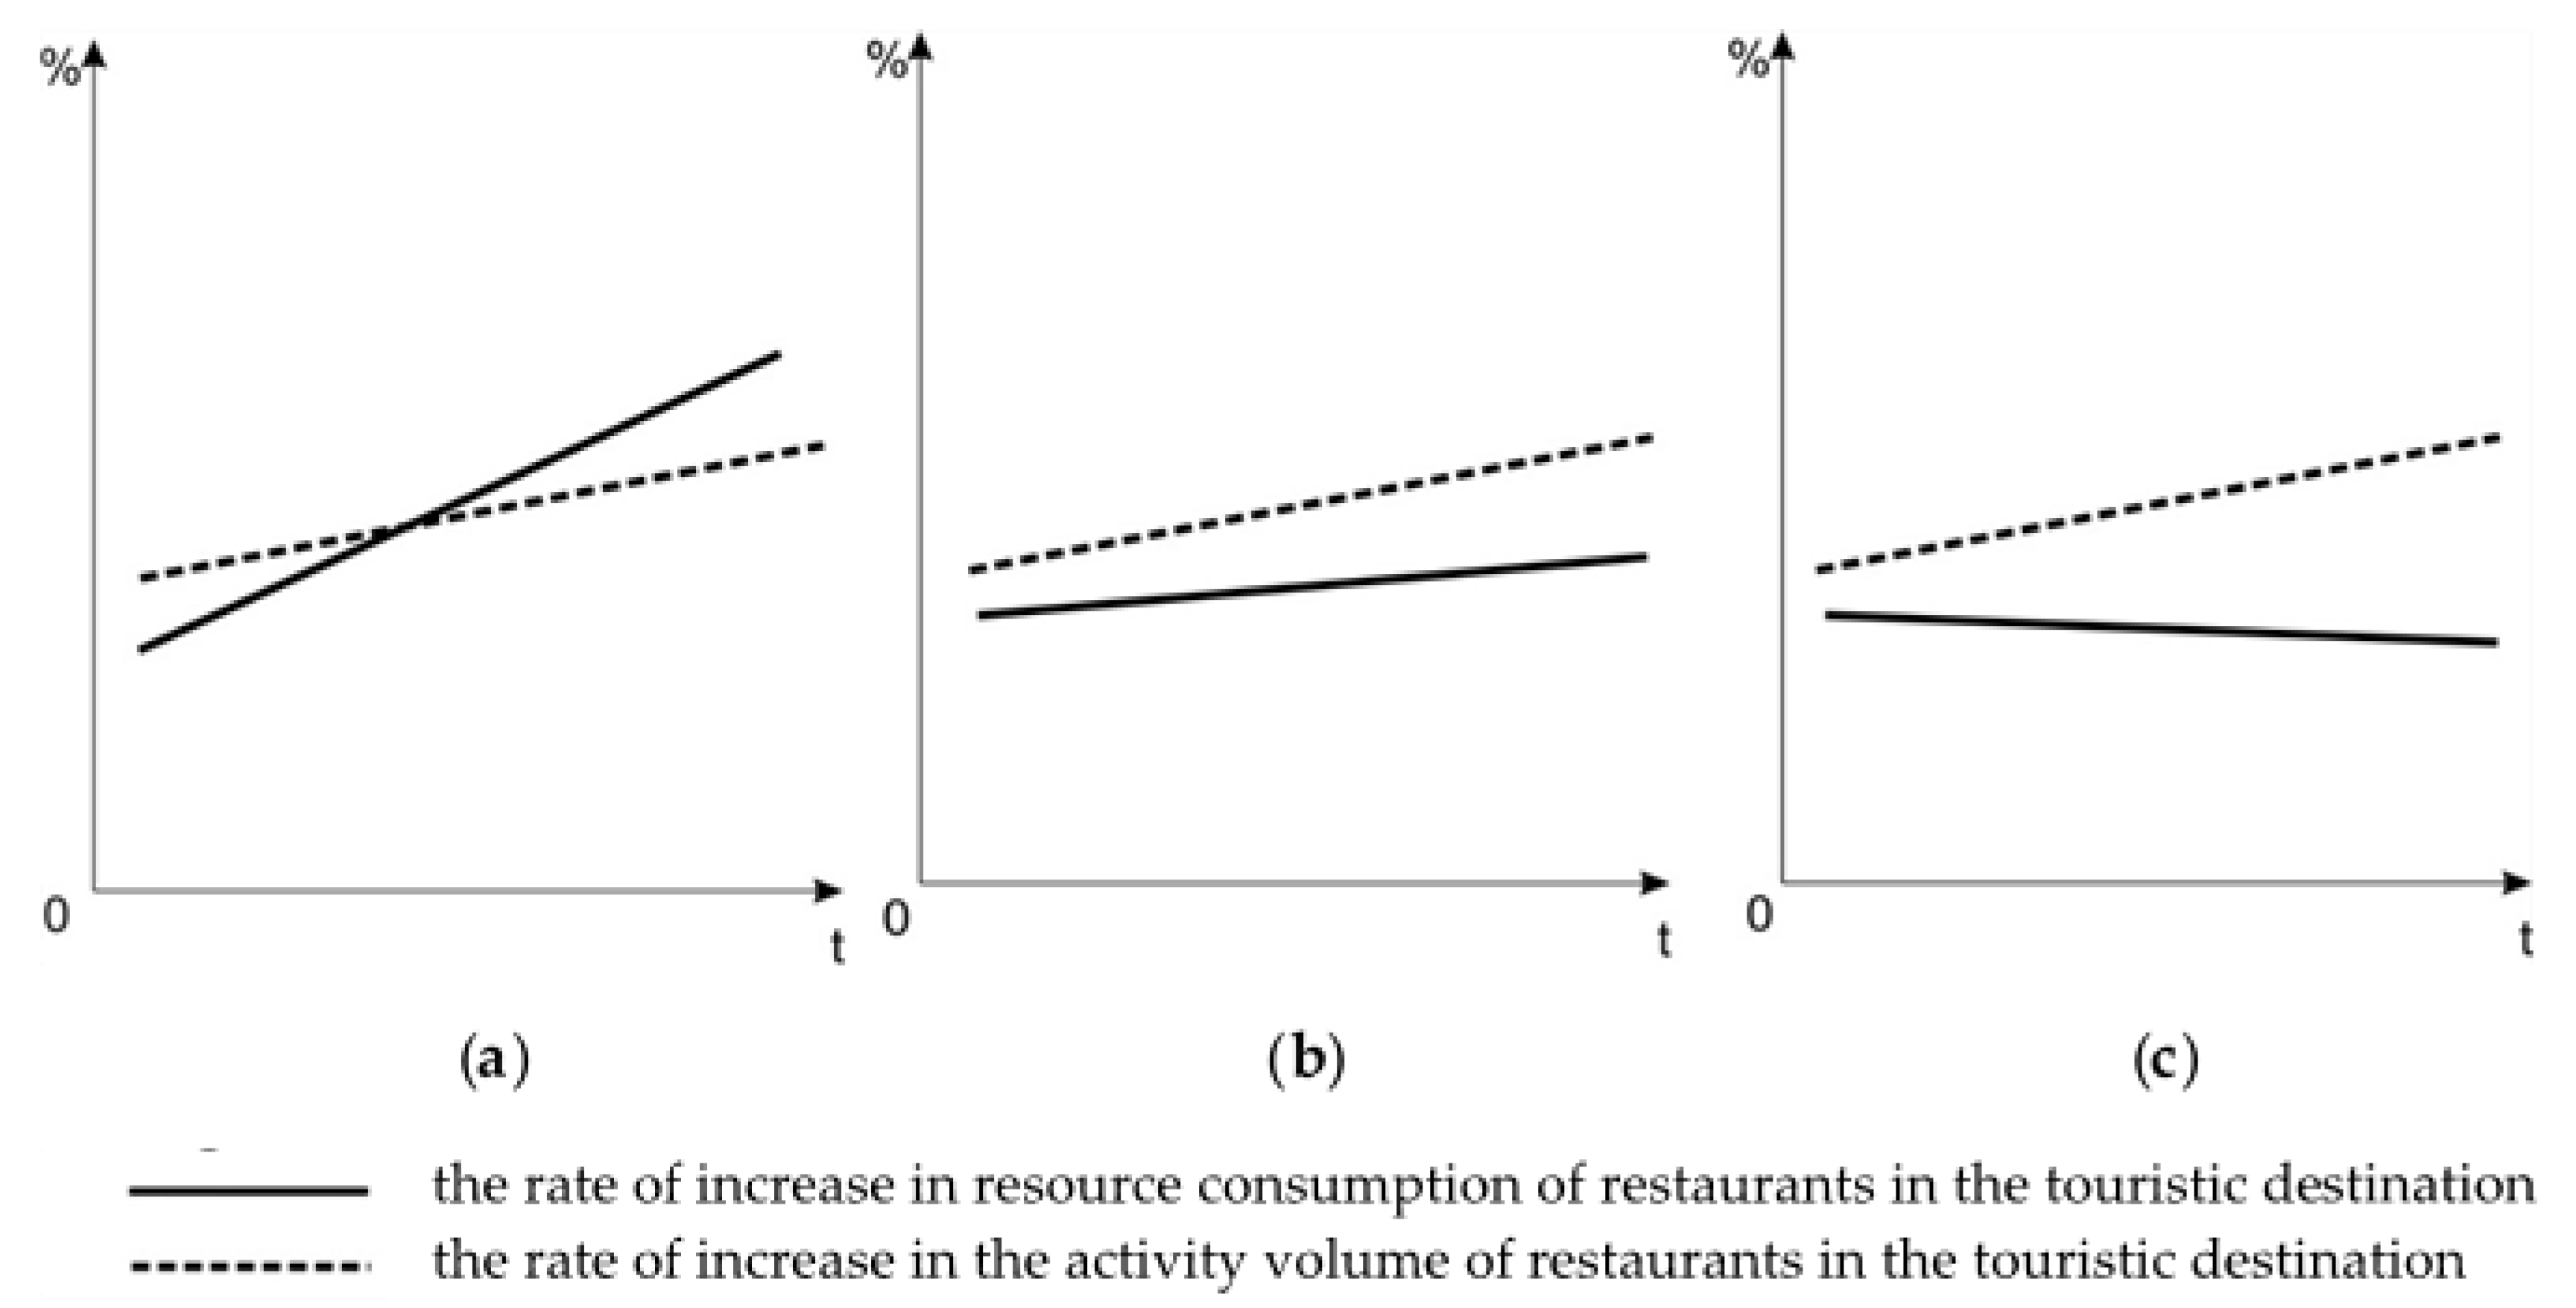
The EU environment programs aim to diminish resource use in relation to economic development. In the hospitality field, scientists have the responsibility to generate ideas and to create operational mechanisms useful to managers from restaurants in the direction of reducing the food wastes volume, which makes possible the efforts to diminish operational costs. They aim to increase the efficiency of restaurant activity, under the hypothesis that the volume of production and services from public food grows more than the cost of consumed resources and the cost of waste neutralization and generated emissions. This fact does not guarantee a pressure reduction upon the environment in absolute terms. Consequently, when estimating the sustainability of local restaurant systems, it is necessary to go beyond the simple measurement of the so-called “relative decoupling”, that is, if the volume of provided food services increases faster than resource use. It is rather necessary to act toward an “absolute decoupling”, meaning a growth of the activity volume and at the same time diminishing resource use, as it may be observed in
Figure 1 [
1].
The subject of waste management in the restaurant industry falls into the promotion of pro-environmental consumption activity, which is, in general, more efficient when it is planned and implemented in a systematic manner and evaluated in a continuous manner [
2,
3,
4].
To do so, it is a fundamental requisite to clearly understand what environmentally sustainable consumer behavior is, to know the theories that are effective for explaining the behavior, to recognize the factors that trigger it, and to know contemporary tourism and hospitality studies dealing with the behavior, which were not wholly uncovered in the existent literature.
Han, in his paper [
5], also signified the importance of pro-environmental consumption activity. He (1) provided the conceptualization of environmentally sustainable consumer behavior, (2) presented a thorough review on social psychology and environmental psychology theories, (3) provided the discussion on key drivers of environmentally sustainable consumer behavior, and (4) introduced new tourism and hospitality studies about sustainability and consumer behavior.
During the COVID-19 pandemic, as the hospitality industry attempts to move on the path of sustainable development, administrators need to expand their efforts for improving natural environmental orientation (NEO), market orientation, resource orientation, and brand orientation by new hospitality’s strategies.
Chun-Yi Ho, in his survey-based paper [
6], studied multiple elements for green marketing orientation formulas in the Taiwanese hospitality industry in the COVID-19 pandemic and validated important elements through multiple viewpoints via the means of an MCDM. A mixture of fuzzy theory, DEMATEL, and DANP methods was applied for the estimation of green marketing orientations based on dissimilar viewpoints of strategy. A flexible, practical, and useful model for determining the hierarchical determinants of a strategic orientation program for the hospitality industry was proposed. These elements were ordered through the fuzzy DEMATEL and fuzzy DANP approaches.
1.2. Waste Management in the Restaurant Industry
The aim of this paper is to study another important group of policies in the public food area that aims to distance itself from the model of linear production (“supply with raw food materials, preparation of food dishes, consumption of food dishes, wastes evacuations”) towards a circular model that extracts the maximum value from food resources and keeps them within the restaurant operational frame, or transfers them toward other economic agents for whom restaurant wastes are useful goods or raw materials (circular economy, i.e., zero wastes), as it can be observed in
Figure 2 [
1,
7,
8,
9].
The concept involves changes in the whole ensemble of logistic chains, including the creation of food items, the operation models from the restaurant industry, the influence on client consumption choice by the menu list, as well as waste prevention and management [
10,
11].
Bartłomiej emphasizes in his paper [
12] the need for organizational improvements leading to the decrease of food waste and costs in restaurants. While the literature does report applications of lean management in service businesses, the literature contains few works on specific applications in the domain of food services [
13,
14,
15]. Lean management was found to be useful in three study cases from Poland to decrease food waste and reduce operational costs. The case studies suggest a set of activities for organizations delivering food services to streamline their processes by applying lean management practices [
16,
17,
18,
19].
Carlos Martin shows, in his paper [
20], that wasting food means missing opportunities to feed 820 million people who are undernourished (according to UNO, in 2018) and consuming scarce resources, such as land, water, and energy used for the production, processing, and distribution of food [
21]. Firms in HORECA (hospitality, restaurant, and catering) represent a considerable share of total food waste and, more importantly, are characterized by an overall low sense of awareness about the sustainability-oriented innovation opportunities and challenges of minimizing food waste [
22,
23,
24,
25,
26]. The article presents a series of case studies to explore the use of technological advancements in the downstream value chain [
27,
28,
29,
30,
31,
32]. A case study draws on a tech startup providing services for HORECA companies to address a new way for companies to solve the food waste challenge. Adopting technological innovations to quantify and minimize wastage via collaborations with third-party companies can be a strategic and cost-effective way to supplement a company’s open innovation activities. Tehrani, in his paper [
33], studied many restaurant activity cases, including the ones from Taiwan, and found that the most important factors essential for environment impact saving were: equipment/technology the ease of implementation of green practices, the efficient use of resources, and the personal values of customers.
Other studies concluded that the cost of implementation of green operations in restaurants can be recovered by better economic performance of the restaurants.
Summarizing the research in this area, the most significant impediments to improving sustainability in the restaurant industry are: lack of adequate knowledge and information on the side of both restaurant owners/managers and customers, the nature of the restaurant industry, regular customers and tourists that can impact the increase of food wastes in restaurants, lack of appropriate knowledge and technology in dealing with eco-waste management, design of the menus, and complexity in operations of a restaurant [
3,
6,
11,
15,
33].
It must be mentioned that the exact definition of physical waste is important as it constitutes the basis of state legal regulations referring to waste manipulation, processing, transportation, and elimination. Waste is a complex, subjective, and often controversial concept. Common people, business communities, politicians, or environment militants have different approaches, which explains the difficulty of getting comparable data concerning wastes from an organization to another or from a country to another.
Among the most frequent acceptations of the “waste” concept there are [
34,
35]:
The EU Directives define waste as “any substance or object … which the holder gives up or intends or is required to discard”.
The Basel Convention of the Program for Environment of UNO offers the following definition: “wastes are substances or objects which are disposed of or are intended to be disposed of or are required to be disposed of by the provisions of national law”.
In the system of limited resource production, waste is made of resources consumed in any other aim than the one to create added value [
36].
Resolutions of the Justice European Court have considered that the result of economic activity may be at the same time waste or product or a good or raw material or a substance, no matter its economic value [
37].
In the context of the last presented acceptation, one may confirm that the waste concept is relative. A material becomes waste when it loses its primary function, but it may have a secondary function [
38,
39]. A material’s failure from a certain productive context may become raw material in another context, which represents the basic principle of the circular economy [
37]. Consider that, in this case, the waste concept should be related to the owner or the process and not to the object in itself.
It is also taken into consideration the hypothesis that effective waste management in restaurants may be restricted by barriers that depend on organizational and attitude factors rather than on the lack of capital availability, as well as on weak coordination between objectives concerning environment protection and operational functions of the management [
36,
40].
In this context, the contribution and the main research objective of this paper are related to the optimization of production in restaurants based on the principles of the circular economy, by recycling waste. As a novelty, we mention the description of a multipurpose functional model of the supply chain in a restaurant, represented as interconnected processes covered by the flows of food and waste, with associated optimized cost flows. Reference is made to the applications of the model in sustainable technology and proper waste management. The proposed model called TEWAMA-R (Multipurpose Model of Technology and Waste Management in Restaurants) can be used as a tool to optimize waste management in a restaurant, having as a basic element the analysis of the causes of waste release.
The paper provides specific aspects of operational management regarding the logistic chain in hospitality, more specifically, in restaurant waste management, thus covering particular gaps in specialized literature [
41,
42,
43].
After the literature study, the paper presents the functional modeling research methodology that was applied to the case study of a restaurant from a touristic destination in Brașov. The results chapter describes the technological process in the restaurant industry, the polyvalent functional model of waste management in the restaurant logistic chain, and the quantitative and value evaluation of waste from the technological processing of beef steak. The paper closes with the chapter of conclusions, which shows the benefits, limitations, and future directions.
3. Results and Discussions
In the restaurant industry, food production is carried out based on clients’ orders, the accepted term being “production-to-order” but orders may be honored within a period of time not affecting the clients’ favorable perception, only on the condition of prior semi preparation, that is, “production-to-stock”. The combination of these two production systems (to order, to stock) is necessary. It is essential to determine an estimated level of the demand for a day, for a certain event, or during well-defined periods of administration, for example, a week, a month, a quarter, a season, or a year.
Restaurant operators tend to substantiate the production level on overestimated request levels because clients’ dissatisfaction has in fact much more serious consequences than the value of the wastes that may result from a demand lesser than the forecast. Generally, restaurants face a volatile demand, especially in the case of touristic destinations. In order to assure a capacity for acceptable response in case of demand variations and in order to reduce the work volume from their own kitchens, restaurant operators are drawn to modern possibilities of preserving raw food materials for longer periods of time (supplies in frozen state, portioning and vacuum, comfort products that food industry may deliver in very short delay). However, this comes at the risk of amplifying waste quantities generated by their own processes of culinary production, as well as by production processes of economic agents upstream the logistic chain.
3.1. Definition of the Polyvalent Model by Describing the Technologic Process in the Restaurant Industry
The activity from this area consists of combining the preparation and presentation operations of the culinary variety, confectionary-pastry preparations, and drinks with specific services determined by their serving and consumption in a harmonious ensemble. In culinary technology, transforming raw food material into finite or semi-finite products is achieved through a series of operations whose succession materializes the technological schema.
In order to constitute the proposed model, restaurant operations were taken into consideration, that, by the nature of their function, may be: A1—Mechanic operations—operations that do not determine the change in the initial state of the raw material (storage, measurement, dosage, transportation); A2—Physical operations—operations that determine the change in the physical state of raw material (physical operations without heat change: selection, grinding, mincing, decantation, sifting; physical operations with heat change: vaporization, baking, heating; physical operations with substance change: extraction, diffusion, frying); A3—Chemical operations; and A4—Biochemical operations, in which substance transformations take place (maturing, coagulation, fermentation).
The ordered operations ensembles (for example A1 + A2 + A3 + A4), by which the fabrication of preparations is achieved, constitute the technologic processes, on principle, taking place in the restaurant sector, which impose the following characteristics on the polyvalent model:
Reduced degree of mechanization and automation;
Small serial production or unique preparations;
Varied sort structure, with relatively frequent modifications;
Daily production from necessary raw material supply step;
Production processes with minimal stocks of raw food materials, due to their perishable characteristics;
Short period of achievement of every operation in the culinary production process.
Handling technological processes involves knowing the quantities of the necessary raw materials, all the transformations that appear in the applied processes, and the quantities of the finite products that result from processing. A shelf life is associated with the stock of food products, that is, a period of time in which they comply with the food safety conditions, after which depreciation occurs, causing food waste. It will be considered that all technological processes produce profound transformations of the processed raw materials, accompanied by quantitative losses due to: (a) elimination of the uneatable parts by preliminary operations, (b) physical processes of desiccation or evaporation, and (c) chemical transformations. All resulted modifications through technological processes determine normal losses whose value must be well known so that such a process may be correctly handled.
From the order of operations and dynamics of transformations, there appear significant waste quantities. Thus the restaurant operators are confronted with supplementary costs due to the depreciation of food products for which the demand was less than what was estimated. In addition, there are supplementary costs associated with recycling or waste disposal.
3.2. Polyvalent Functional Model of Waste Management on Restaurant Logistic Chain
A large contribution to the financial sustainability of a restaurant depends on the manager’s ability to minimize wastes and use resources as efficiently as possible. This refers not only to food and drinks but also to work resources, consumed energy, and other operational expenses. When costs are kept under control, the restaurant has two alternatives: (1) to offer its preparations and services at a lesser price than those on the local market, that is, to assure a more favorable proportion of quality/prices to its client or (2) to get a higher volume of the commercial addition than its competitors, if the manager decides to sell at market price. Not all operators are aware of the waste volume from restaurant activity hence they do not see the necessity to watch the costs.
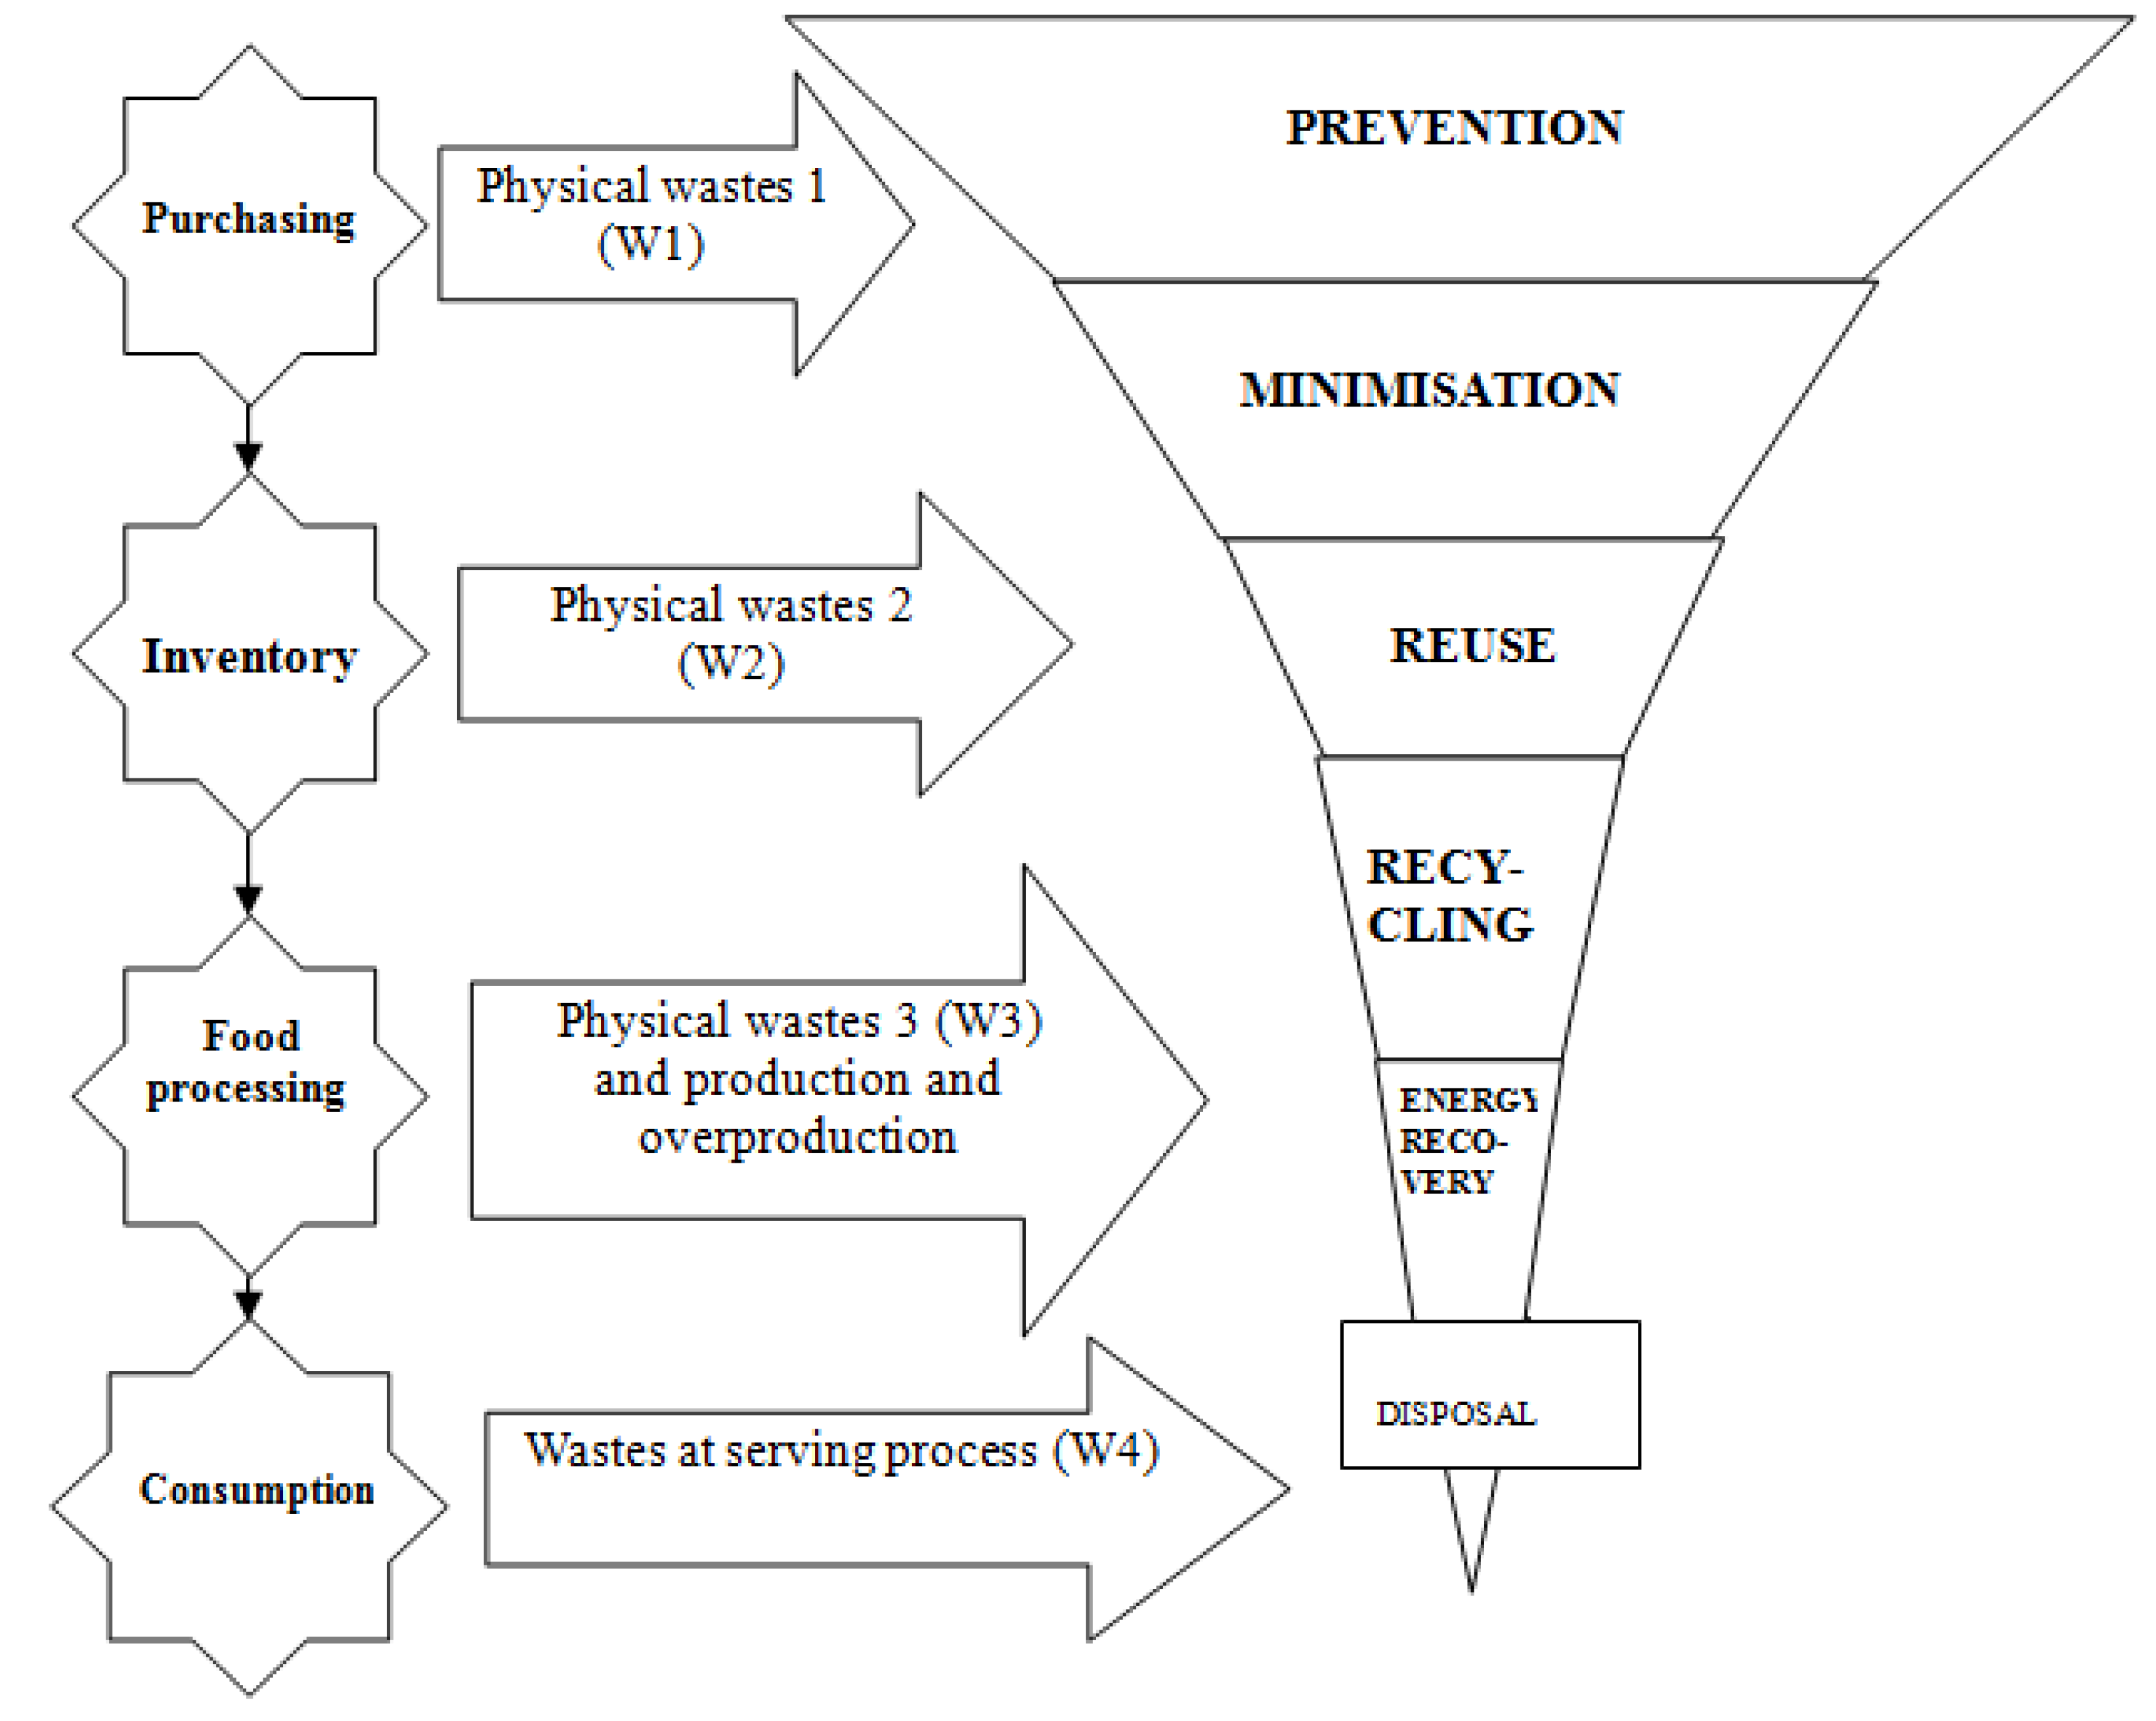
A restaurant activity may be described as a logistic chain in which raw food materials are transformed into a culinary preparation through a series of processes with sequential ongoings. Processes add value and create, at the same time, physical and non-physical wastes. Even operations between processes may lead to waste creation.
With every stage of food processing in a restaurant, there are associated identified wastes based on the “waste hierarchy” concept, described in
Figure 3.
A compulsory element in waste management in restaurants is the application of the principles and rules linked to the “design hygienic” concept that completes the Polyvalent model of sustainable technology and waste management in restaurants (TEWAMA-R).
Beyond the concepts and principles presented as the defining elements of the polyvalent model from this study, reality shows us that wastes are not always visible with the naked eye. Registration and analyses are necessary in order to observe the waste quantity in the flow. In the absence of controls to observe variations and with the insufficiency of the use of certain resources, managers are exposed to losses, which makes it opportune to elaborate on models and corresponding costs.
Figure 3 shows, schematically, the phases of waste appearance in the technological and managerial flow of restaurant activity.
W1—materials of organic nature/wrapping and others.; W2—prejudice due to defective manipulation/contamination at defective depositing/errors in demand estimation/overtaking the preservation delays; W3—production wastes due to technological losses/material wastes by contaminations or trash preparations/overproduction wastes due to errors of culinary production programming or errors of communication with organizational clients; W4—wastes in the serving process due to contaminations/client refusals/late cancellation of programmed events.
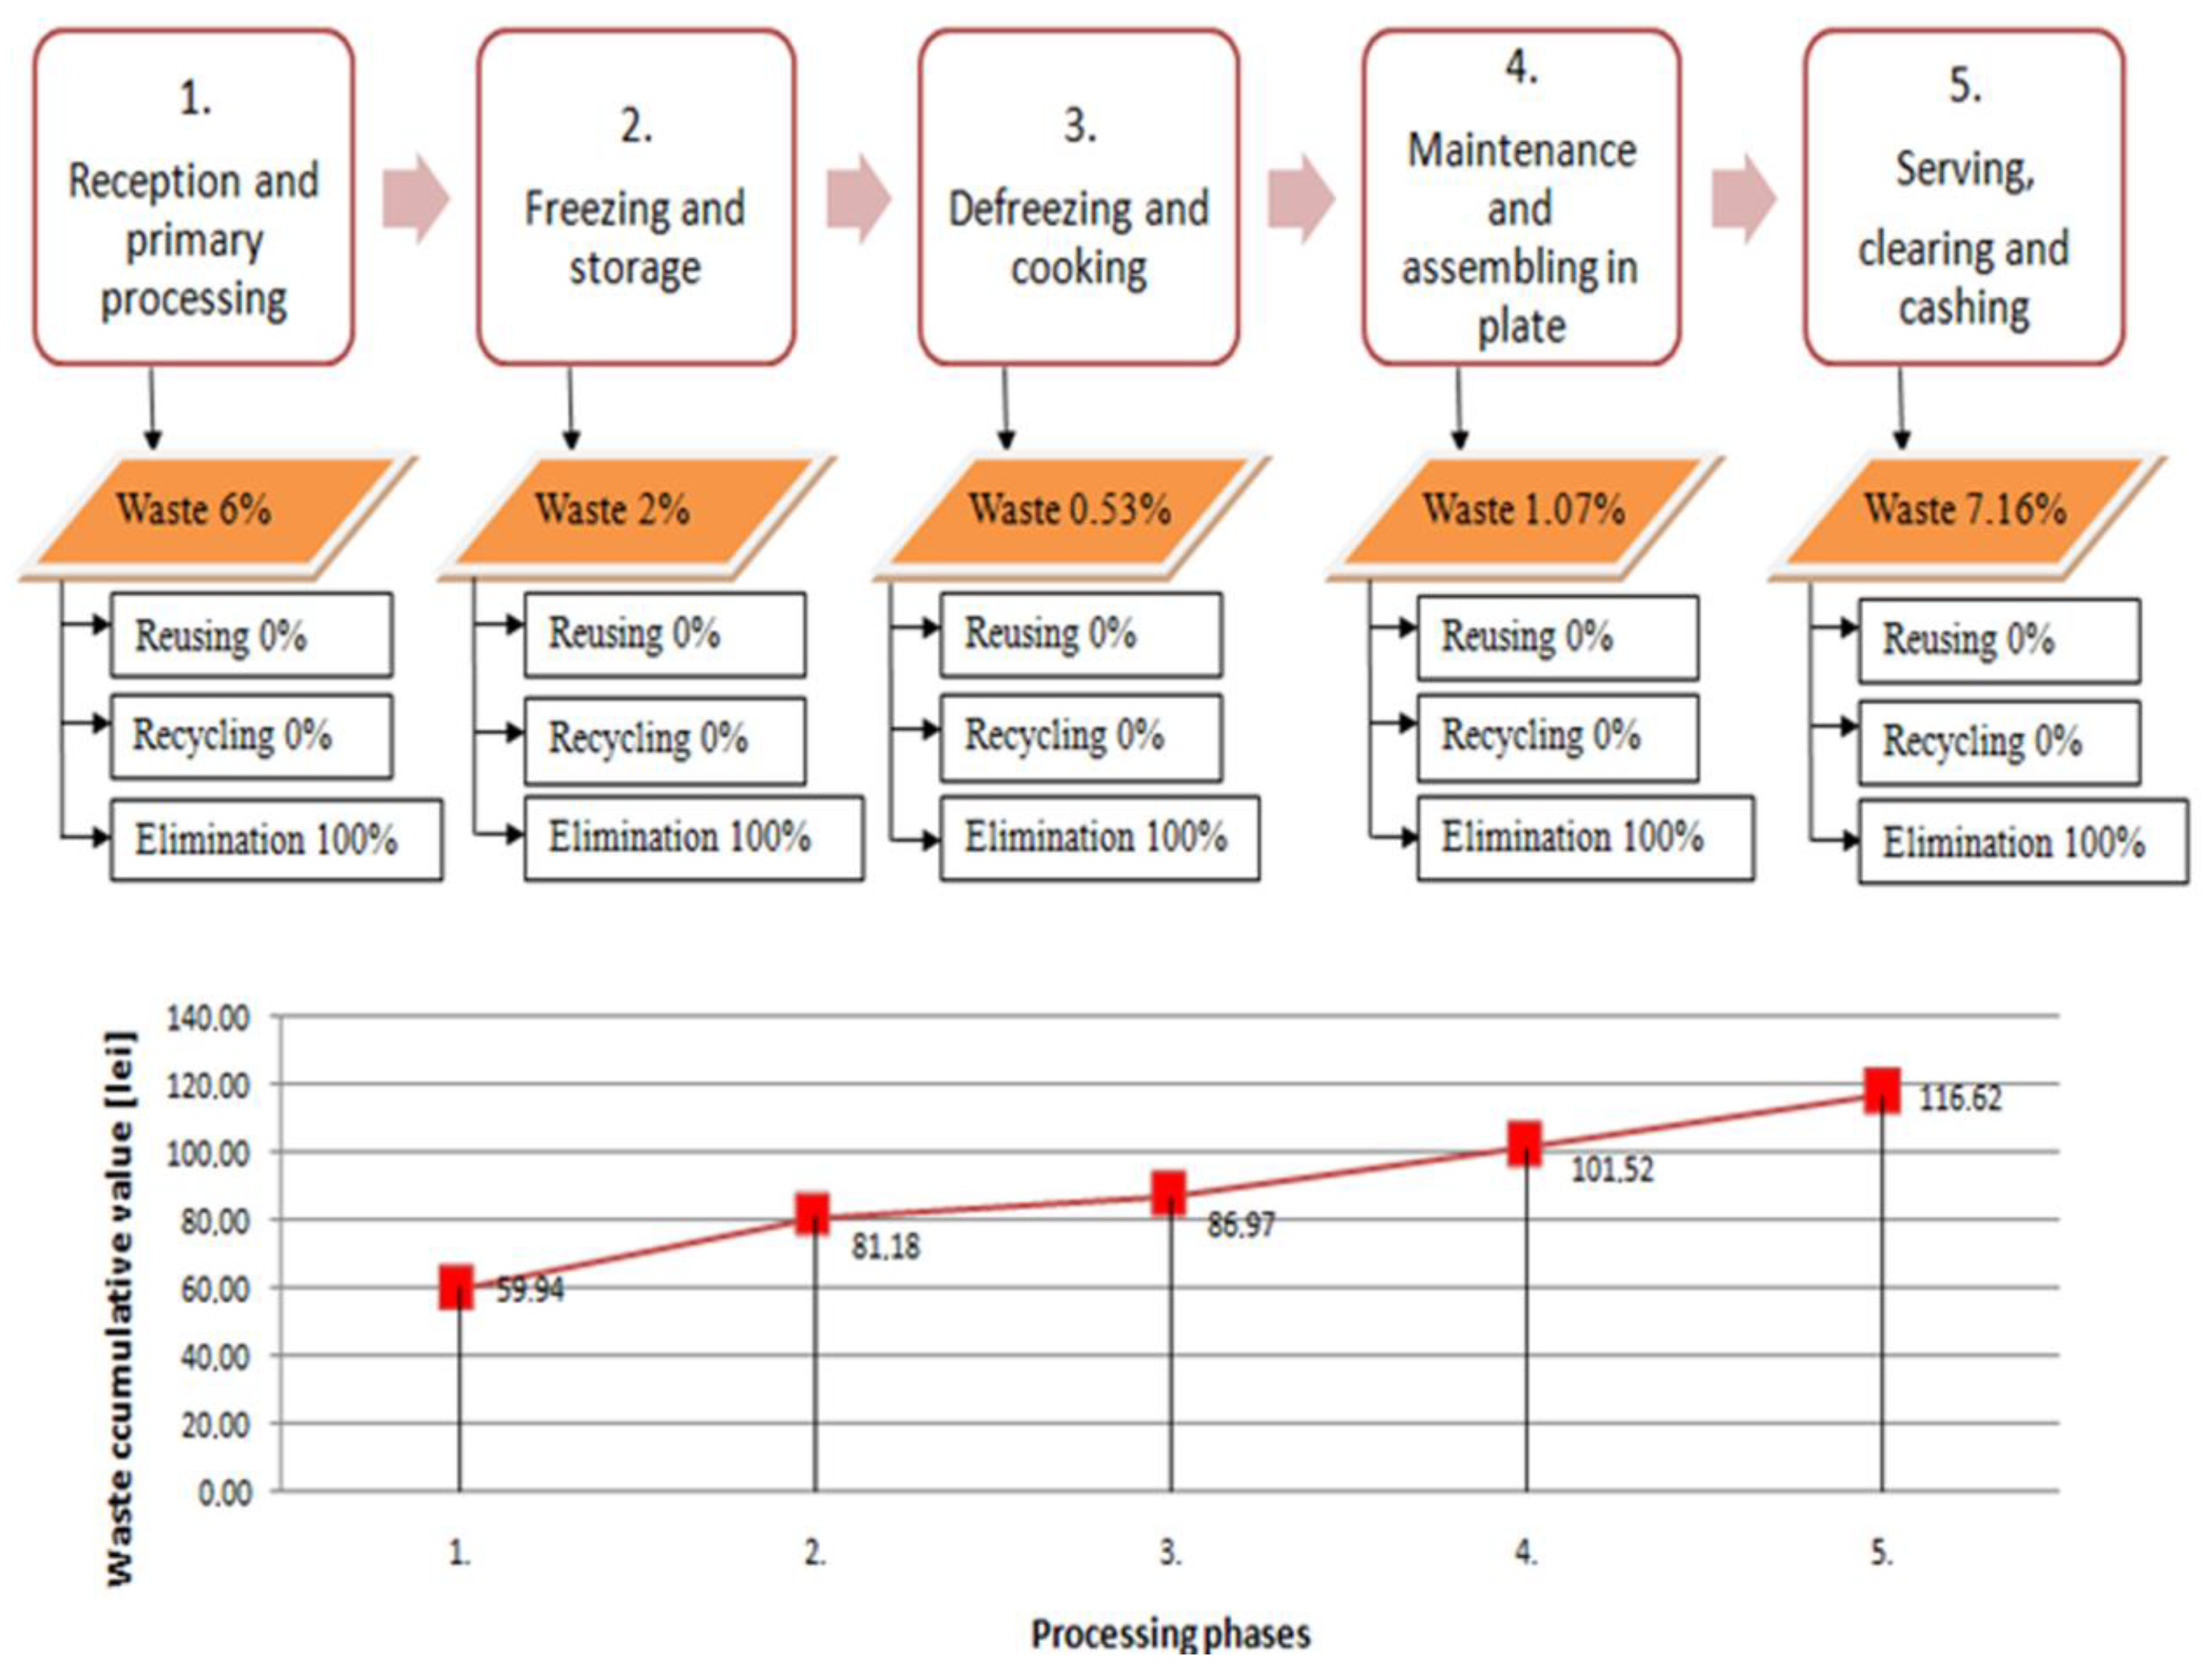
System variables relevant to this problem were taken into consideration; these are elements that become a simplified representation of the system. References were made to the technological process of complex aliment preparation (dishes), with quantitative and value evaluation of the wastes resulting from 5 technological stages (Stage = stage; Op = operations), respectively: (Stage1) Op.1—reception/Op.2—primary processing; (Stage 2) Op.3—freezing/Op.4—storage; (Stage 3) Op.5—de-freezing/Op.6—cooking; (Stage 4) Op.7—maintenance/Op.8—assembling onto the plate; (Stage 5) Op.9—serving/Op.10—clearing the table/Op.11—cashing.
Consequently, the functions of the technological stages (Stage), the generation of wastes, as well as the operations (Op) of aliment transformation during the technologic flow, may be described by the polyvalent model of sustainable technology and waste management (W) in restaurants (
Figure 4).
A1—mechanic operations; A2—physical operations; A3—chemical operations; A4—biochemical operations; Stage 1—reception and primary processing; Stage 2—freezing and storage; Stage 3—de-freezing and cooking; Stage 4—maintenance and assembling onto the plate (fr. montage); Stage 5—serving, clearing the table, pay; W.1, W.2, W.3, W.4—stage wastes in conformity with waste hierarchy; PPP—loss from food samples; WR—waste from rejected dishes; RC—consumption leftovers; TW—total wastes; TC—total costs. Complementarily with the technologic diagram, the cost control has the role of maximizing the profit and is linked to the technologists/operational managers’ competence and, implicitly, to the used model. When cash flow is positive and the business is successful, cost control may seem unjustified. However, the high sales volume may hide a multitude of useless costs, which become evident only during periods with reduced sales that require the optimization of costs within the model. Therefore, a restaurant’s operational success is not dependent on hazards but is the result of very accurate planning, which constitutes the application of a model, for example, a sustainable polyvalent one: technological/managerial/hygienic/design/economic.
3.3. Development and Application of a Polyvalent Model of Sustainable Technology and Waste Management, with Case Study on the Logistic Chain of a Restaurant in Brașov, Romania Touristic Destination
The case study refers to the classic example of a menu specific to a Brașov touristic destination, regarding the technologic process (emphasizing meat processing) of the preparation “beef steak with vegetables” (
Table 1).
The restaurant’s internal logistic chain, presented in
Figure 5, is divided into three departments: supply-storage (Stage 1 and 2), culinary preparation (Stage 3 and 4), and serving (Stage 5). The application of the functional model concentrated on physical waste, excluding non-physical waste because the restaurant managers refused the proposals to modify the production processes, arguing that they involve investment work, need a longer period of time, and disturb the existing flows whose performance level is accepted by the owners.
Figure 4 presents the waste cumulative cost diagram, elaborated in conformity with the data calculated in
Table 1, where a value of waste quantity results after every stage (it is adjusted by dividing the 990 lei cost of beef steak supply by the eatable quantity left).
An example calculation of the waste flow from every stage (identified on the basis of the waste hierarchy) within the model may be seen in the
Box 1 below:
Box 1. Example of waste flow calculation from every stage.
After Stage 1, the total cost of 990 lei is divided by 28.20 kg beef steak left after washing and cleaning operations, resulting in a unitary cost of 35.11 lei/kg, compared to the initial unitary cost of 33 lei/kg. Thus, the waste value resulting from Stage 2 may be evaluated as:
0.6 kg waste × 35.11 lei/kg = 21.06 lei
To which the cost with waste elimination is added:
0.6 kg waste × 0.30 lei/kg = 0.18 lei
Resulting in the total cost of waste generated in this stage:
21.06 lei + 0.18 lei = 21.24 lei.
NB—Appreciation in Jan. 2018 is 1 euro = 4.6 lei
After the analyses of the logistic chain from
Figure 5 it was observed that, by revising the specifications for the preparation of the “beef steak with vegetables”, the rate of waste occurrence may be reduced and a part of the generated wastes may be reused or recycled. The new model of waste flow concerning the waste quantity and value is described in
Table 2 and
Figure 6.
Comparing phase 1 (reception and primary processing) in
Figure 5 and
Figure 6 it can be seen that revising the specifications for the preparation of the “beef steak with vegetables”, leads to the generation of a larger amount of waste (6.67% < 6%), which is reused in the proportion of 72%, eliminating only 28% of waste. This not only involves reducing the costs of purchasing raw materials for phase 2 of processing (freezing and storage), but also reducing the costs of waste management (a smaller amount of waste will be eliminated).
Another consequence of revising the specifications for the preparation is that in the third phase of processing (de-freezing and cooking) the amount of waste obtained (0.43%) is reused in the proportion of 100%. This element has beneficial effects such as the decrease in the purchase price of the input raw materials for phase 4 (maintenance and assembling in plate) and the complete elimination of the costs of waste management from phase 3.
There is also a reduction in the amounts of waste resulting from phase 4 (0.83% < 1.07%) and phase 5 (5.59% < 7.16%).
The total quantity of beef meat waste after one month (30 days) of using the perfected technological process for the preparation of the “beef steak with vegetables” was 4.70 kg, that is, 6.4% less than in the initial technological diagram. If in the initial variant, the whole meat waste quantity were to be eliminated at the municipality ecologic junkyard (through the local sanitation service), after applying the TEWAMA-R Model, the resulted beef meat waste quantity would valorized on each of the 4 steps of the waste hierarchy taken into consideration:
First step of hierarchy/prevention: 400 g
Second step/reuse: 1440 g + 130 g = 1570 g (33.4%)
Third step/recycling: 250 g + 250 g + 1430 g = 1930 g (41.1%)
Fourth step/elimination: 560 g + 640 g = 1200 g (25.5%)
Total beef meat waste (step 2 + 3 + 4) = 4700 g (100.0%)
The percentage of waste reused increased from 0% to 33.4%, by identifying a secondary function for the waste resulted after cutting, de-freezing, and cooking operations. Recycling increased from 0% to 41.1% by introducing in the process certain simple technological operations. The remaining waste (25.5%) could not be reused or recycled and was eliminated (by the sewage system or by depositing in ecologic junkyards). The reduction of the weight of evacuated waste is remarkable, from 100% to 25.5%. Consequently, the waste elimination costs were significantly reduced and the restaurant social responsibility increased by developing new waste valorizing possibilities in secondary logistic chains.
We may appreciate that, by modifying the menu list and adjusting the preparation technological card, that, by reducing the raw quantity of the steak portion from 200 g to 160 g the rests after the consumption of the finite preparation could be reduced from 1.83 kg to 1.43 kg, and similarly with 400 g. With the diminishing of the raw quantity, the net portion of beef steak from 160 g to 125 g determines the increase in the portion number from 137 to 170, which leads to an increase in the restaurant income flow by approximately 15%. Confirming the hypothesis that, by diminishing the meat portion weight, the finite preparation selling price in the menu list is proportionally adjusted.
As it may be observed in
Table 1 and
Table 2, compared to the standard technological process, after applying the proposed model, the cumulated value of the meat waste resulting in the case of the “beef steak with vegetables” preparation was reduced by 31%, from 116.62 lei/month to 80.34 lei/month. A cost reduction of 36.28 lei/month by applying the TEWAMA-R Model may seem insignificant, but we only speak about a component of a single culinary preparation.
Activating secondary logistic chains, consisting of directing towards carnivorous feeding (fur animals, trout, zoological garden, shelters for stray dogs, etc.), leads to the diminishing of the eliminated waste through the sanitation firm with 1.67 kg/month. Even if the registered economy this way has a minor financial impact for each product, the perspective changes when all the recipe ingredients and all menus are taken into consideration, that is, in the lump monthly culinary production (all the culinary products made). If we generally take into account that the restaurant menu list includes approximately 50 culinary preparations, on average, one may appreciate that a cost reduction of 1800 lei/month, 21,600 lei/year, might be possible. This sum becomes important if it is directed towards wage funds, and there is great advantage in reducing the waste ecologic impact.
4. Conclusions
Restaurant food waste is substantial and largely avoidable, its identification demonstrating that it is present at every stage of the culinary technological process, even in intermediate operations. Functional modeling shows possibilities to minimize physical waste through the possibility of recycling it, either to be recovered as a raw material or to make a by-product, which can generate added value in the logistics chain of the restaurant.
By applying the analyzed multipurpose model, the waste stream that generates the highest costs is minimized and restaurants are more likely to improve their competitive position in terms of sustainability. Practically, waste losses are reduced, while complying with legal provisions on environmental protection.
The multipurpose model of technology and waste management in restaurants (TEWAMA-R) becomes sustainable in the context in which the function of the technological stage (“Stage”) of waste generators as well as the operation (Op) based on food processing along the technological flow, can be described by analyzing the quantities and costs of waste. The model can also be used to facilitate internal communication within the restaurant, with the external one, that is, with other organizations, in order to reduce the amount of waste.
In the application of the study, by revising the preparation specification of the preparation “roast beef with vegetables”, the rate of waste may be reduced and some of the waste generated may be reused or recycled. By applying the TEWAMA-R model to this food preparation, the total amount of reused beef waste per month increased to 33.4% and the recycling of waste increased to 41.1% (given that all the waste was disposed of in the application of standard technology). Disposal was reduced from 100% to 25.5%.
Statistically, these trends show by extrapolation the importance of applying such a model given that all the ingredients of the recipe and all menus are taken into account, that is, there is an integrated analysis of the restaurant’s monthly culinary output, which quantifies production optimization based on circular economy.
On average, a restaurant produces 25,000 to 75,000 pounds of waste per year, from which only 14.3% of the leftover food is recycled, 1.4% donated, and the rest, 84.3% of such food, is discarded. The reduction of waste from the restaurant industry produces, besides the increase of the profit of the respective unit, also the increase of the sustainability indices for the respective business, major positive effects on the environment. Knowing the huge amount of natural resources consumed for the production of food raw materials (especially in terms of meat, dairy products, etc.) it can be seen that the model presented in the paper contributes primarily to reducing the consumption of fresh water, energy. At the same time, the impact on the environment is reduced by eliminating an important matrix of waste and by-products generated in the restaurant industry.
A limitation of the TEWAMA-R model is the complexity of the technological flow, the restaurant’s monthly culinary output, recipes, and the ingredients used. Further case studies should be taken into consideration in order to establish the efficiency degree and to make fine adjustments in the model parameters.
Future research directions will use various techniques for Environmental Impact Assessment, and will consider assessing the impact of this method of reducing waste in the restaurant industry vis-à-vis the footprint of the public food business on the environment.


 ,
, 


