Article

A Method for the Automated Construction of 3D Models of Cities and Neighborhoods from Official Cadaster Data for Solar Analysis

by
Carlos Beltran-Velamazan
,
Marta Monzón-Chavarrías
and
Belinda López-Mesa
*
Department of Architecture, University of Zaragoza, 50 108 Zaragoza, Spain
*
Author to whom correspondence should be addressed.
Sustainability 2021, 13(11), 6028; https://0-doi-org.brum.beds.ac.uk/10.3390/su13116028
Submission received: 20 April 2021 / Revised: 21 May 2021 / Accepted: 23 May 2021 / Published: 27 May 2021
(This article belongs to the Section Sustainable Urban and Rural Development)

Abstract

:
3D city models are a useful tool to analyze the solar potential of neighborhoods and cities. These models are built from buildings footprints and elevation measurements. Footprints are widely available, but elevation datasets remain expensive and time-consuming to acquire. Our hypothesis is that the GIS cadastral data can be used to build a 3D model automatically, so that generating complete cities 3D models can be done in a short time with already available data. We propose a method for the automatic construction of 3D models of cities and neighborhoods from 2D cadastral data and study their usefulness for solar analysis by comparing the results with those from a hand-built model. The results show that the accuracy in evaluating solar access on pedestrian areas and solar potential on rooftops with the automatic method is close to that from the hand-built model with slight differences of 3.4% and 2.2%, respectively. On the other hand, time saving with the automatic models is significant. A neighborhood of 400,000 m2 can be built up in 30 min, 50 times faster than by hand, and an entire city of 967 km2 can be built in 8.5 h.

1. Introduction

Nowadays, cities occupy 3% of land but represent between 60% and 80% of energy consumption and 75% of carbon emissions [1]. Solar access in urban areas offers a great potential for renewable energy integration in buildings. Building integrated photovoltaics (BIPV) and solar thermal collectors (STC) are technically viable solutions with a high potential for the transition to low carbon energy systems. BIPV installations can reduce operational carbon emissions of buildings by up to 50% even in high-density cities [2], and STC have been found to be necessary to transform existing multi-family buildings into nearly zero energy buildings (nZEB) in Spain [3]. These systems are usually installed on the buildings’ roofs, since the solar potential for roofs is much less affected than that for facades by the compactness [4]. Understanding the rooftop photovoltaic (PV) potential is critical for regional renewable energy policies [5].
Solar access in urban areas is also very important for outdoor thermal comfort. The correlation between sun-related urban morphology parameters and outdoor thermal comfort have been studied for several decades, e.g., [6,7,8,9]. The proper relation with sun is a well valued feature in urban public spaces. Olsen et al. argue [10], for example, that outdoor recreational spaces for children are a highly valued aspect of society to support child wellbeing, and that there are many important health considerations related to sun exposure that should be included in initiatives of playground safety. In Spain, the indicators for monitoring the Spanish Strategy for Urban and Local Sustainability include the importance of identifying the potential for thermal comfort for a pedestrian in public space, in terms of useful hours throughout the day [11]. Sun access and street shading are among the main reasons of pedestrians to choose a given path in cities [12,13]. The actual solar access of a given urban area strongly depends on the geometric arrangement, including the orientation, of the buildings and the street canyons in relation to the sun [14]. Masoud et al. [15] study urban streets geometry defined by height/width (H/W) ratio, streets orientations and sky view factor to study the correlation between urban morphology parameters and incident solar radiation to enhance pedestrian comfort. Shishegar [16] discusses the current literature on the effects of street design on the urban microclimate and analyses the impacts of streets geometry (H/W ratio) and orientation on airflow and solar access in an urban canyon. All these studies show the importance given by the literature and society to solar access for pedestrian comfort in urban spaces.
Currently, two main approaches for solar analysis in cities and buildings are used in the literature:
  • Using geographic information system (GIS) models with plug-ins for solar potential analysis.
  • Through the use of 3D models and specific software tools for solar simulation.
There are many differences between both approaches, but the main one is that in the first case the initial data are digital surface models (DSM) using raster image, such as in [17], whereas in the second one, they are three-dimensional models, such as in [18]. Additionally, the method used to build the model usually determines the scale of the sample. The more precise 3D-based approaches take more time in modelling the buildings and, therefore, they normally study just a part of the city, such as a neighborhood or a building. On the other hand, GIS-based methods allow to study the solar radiation over large areas, such as cities, countries or even continents.
A variety of plug-ins is available in GIS software tools to calculate solar access. For example, Hofierka and Kaňuk use the plug-in GRASS GIS which includes an open-source solar radiation tool named r.sun to calculate the solar radiation in a small city in Slovakia [19]. The GIS software ArcGIS and the plug-ins Spatial Analyst and Solar_in_Glover are recommended to study the solar access in some manuals [17]. As an example, in Zhang et al. [20], the authors use this software tool to determine the solar access in China. In Wiginton et al. [5], the authors use the plug-in Feature Analyst for ArcGIS to determine the photovoltaic potential of Ontario in Canada. Other studies use web-GIS applications that provide information about solar radiation and PV system performance for cities, such as PVGIS [21].
GIS can also be combined with analytical models (e.g., probability/statistical, mathematical, machine learning, and data mining methods) to complement the inherent capabilities of GIS in evaluating the spatial patterns or characteristics of events and their attributes [22]. For example, in Walch et al. [23] the authors combine machine learning and GIS to determine the photovoltaic potential in Switzerland, and in Yousuf et al. [24] the authors combine a MATLAB algorithm and GIS to calculate the solar radiance of a building for every hour of the year.
GIS can also make use of light detection and ranging (LiDAR) technology. LiDAR is a remote sensing method used to examine the surface of the Earth. The advantage of using LiDAR in GIS software is that it provides models that include the land topography. For example, in Brito et al. [25], the authors use LiDAR data and aerial digital photography to characterize the roofs of Lisbon (Portugal) and the land topography, and afterwards they calculate the solar access with the plug-in Solar Analyst for ArcGIS. In Bayrakci et al. [26], the authors use LiDAR data to define the urban model, which is implemented in ArcGIS and, by means of an algorithm they create with Phyton programming, they identify rooftops suitable for solar energy systems over large geographic areas in the city of Philadelphia, US. When LiDAR data are not available, some authors [27] use statistical models to determine the characteristics of roofs in cities or areas not covered by LiDAR. The advantage of using LiDAR in GIS software is also that it provides models with more accurate buildings shape and height. For example, in Martín-Jiménez et al. [28], the authors distinguish between different types of roofs (single pitched roofs, flat roofs, gable or saddle roofs and pyramid roof) to study the viability of the rooftops of Ávila (Spain) and Vaihingen an der Enz (Germany) for PV installation by means of LiDAR together with aerial orthoimagery, and afterwards they study the solar potential of these two cities.
The main challenge of the 3D-based approach is how to build a 3D model from 2D data from open data sources. Each building footprint must be assigned a height as precise as possible. Some authors, e.g., [29], collect height data from house-to-house surveys. However, this method is not suitable for large urban areas because it is highly time consuming. Other authors show that it is possible to build 3D city models generated solely from 2D data without elevation measurements, e.g., [18,30,31,32]. These authors use OpenStreetMap (OSM) to obtain the 2D building footprints to construct the 3D models, extruding the buildings as polygons according to the number of floors in the same source. However, the data about height of buildings in OSM are not fully reliable because they are based on volunteered geoinformation [33]. In Park and Guldman [34], the authors use LiDAR point clouds and building footprint to create 3D building models because of its higher precision and subsequent analytical efficiency. However, this methodology is just suitable for specific buildings, and not for large urban areas, because they are also highly time-consuming due to the heavy models. In Bshouty et al. [35], the authors use single contributed photographs and OSM vector data to calculate the heights, and in Bremer et al. [36], the authors use coarse digital surface model (DSM), fine DSM, fine digital terrain model (DTM), point cloud, and CityModel made in CityGML, to construct 3D-GIS models of cities and calculate the solar irradiance. However, these sources are not easily available for all cities. In Biljecki et al. [33], the authors investigate to what extent can 3D city models be generated predicting with machine learning the height of buildings from 2D data by means of available data in OSM and cadaster.
To conclude, 3D city models are built from buildings footprints and elevation measurements. Footprints are now widely available as open data from governments and volunteered geoinformation. However, elevation datasets remain expensive and time-consuming to acquire, hindering the production and availability of 3D city models [37].
In this paper the 3D-based approach is used. The reasons for this choice are several, and most notably that this method generates a 3D model exportable to software tools that do not work with GIS directly. In our case, the 3D model is intended to be used with Autodesk’s Ecotect Analysis 2011 for solar analysis, as used in other studies of solar potential in cities [38,39,40].
Our hypothesis is that the GIS cadastral data regarding footprints and building heights can be used to build a 3D model automatically, so that generating complete cities 3D models can be done in a short time with already available data. This would allow to realize these more precise solar studies at city scale with specific software tools for solar simulation.
Connecting both working environments, GIS and 3D can also contribute to further purposes, such as analysis of quality of ventilation and sunlight access of buildings in urban areas, analysis of habitability of public spaces, city growth prediction models or post-processing of the models to convert them into renders or infographics. This will be possible because 3D models can be generated in different formats becoming interoperable with different 3D-modelling software, element-calculating software tools or rendering software, such as Rhinoceros, Sketchup, Autocad 3D, Revit, ArchiCAD, Computational fluid dynamics simulation software, 3ds Max or Twinmotion.
At the present time, the cadaster in Spain provides the graphic data of land parcels and buildings in 2D. The transformation of 2D-GIS cadasters into 3D-GIS cadasters has been studied for the past two decades, however, its implementation remains a challenge, requiring organizational, legal and technical changes, among others [41,42,43]. The objective of this paper is to propose a method to build 3D models of cities from 2D cadastral data and study their usefulness for solar analysis. The model will also be exportable to the main 3D modelling formats (such as 3ds, 3dm or fbx), what will make it possible to use it with different software tools for other multiple purposes, which are not explored in this paper. The proposed method does not need any DSM or plug-ins in GIS software and makes use of public databases, which are free and accessible.

2. Materials and Methods

The research methodology consists of generating automatically built models for specific case studies from 2D cadaster data, and analyzing the time required to build them and their accuracy in solar energy analysis as compared to a hand-built model.
The first case study used is a neighborhood of the city of Zaragoza (Spain) named Ruiseñores. The three models compared are:
  • A hand-built model from public 2D cadaster plans.
  • An automatically built model from public GIS-based cadaster data. We name this model “regular cadaster” through out the paper.
  • An automatically built model from GIS-based INSPIRE cadaster data. We name this model “INSPIRE cadaster” through out the paper.
This first case study is used to establish the methods to build the models automatically from these two cadastral sources, to check how quickly they can be built and to verify whether they can be as accurate as a hand-built model for solar analysis. Since it was observed that the two models built from cadaster data are so similar, only one of them was finally used for the verification of its accuracy for solar energy analysis as compared to the hand-built model.
Afterwards a second case study, consisting of the whole city of Zaragoza, was used to analyze the time it takes to build the two automatic models from cadastral data.

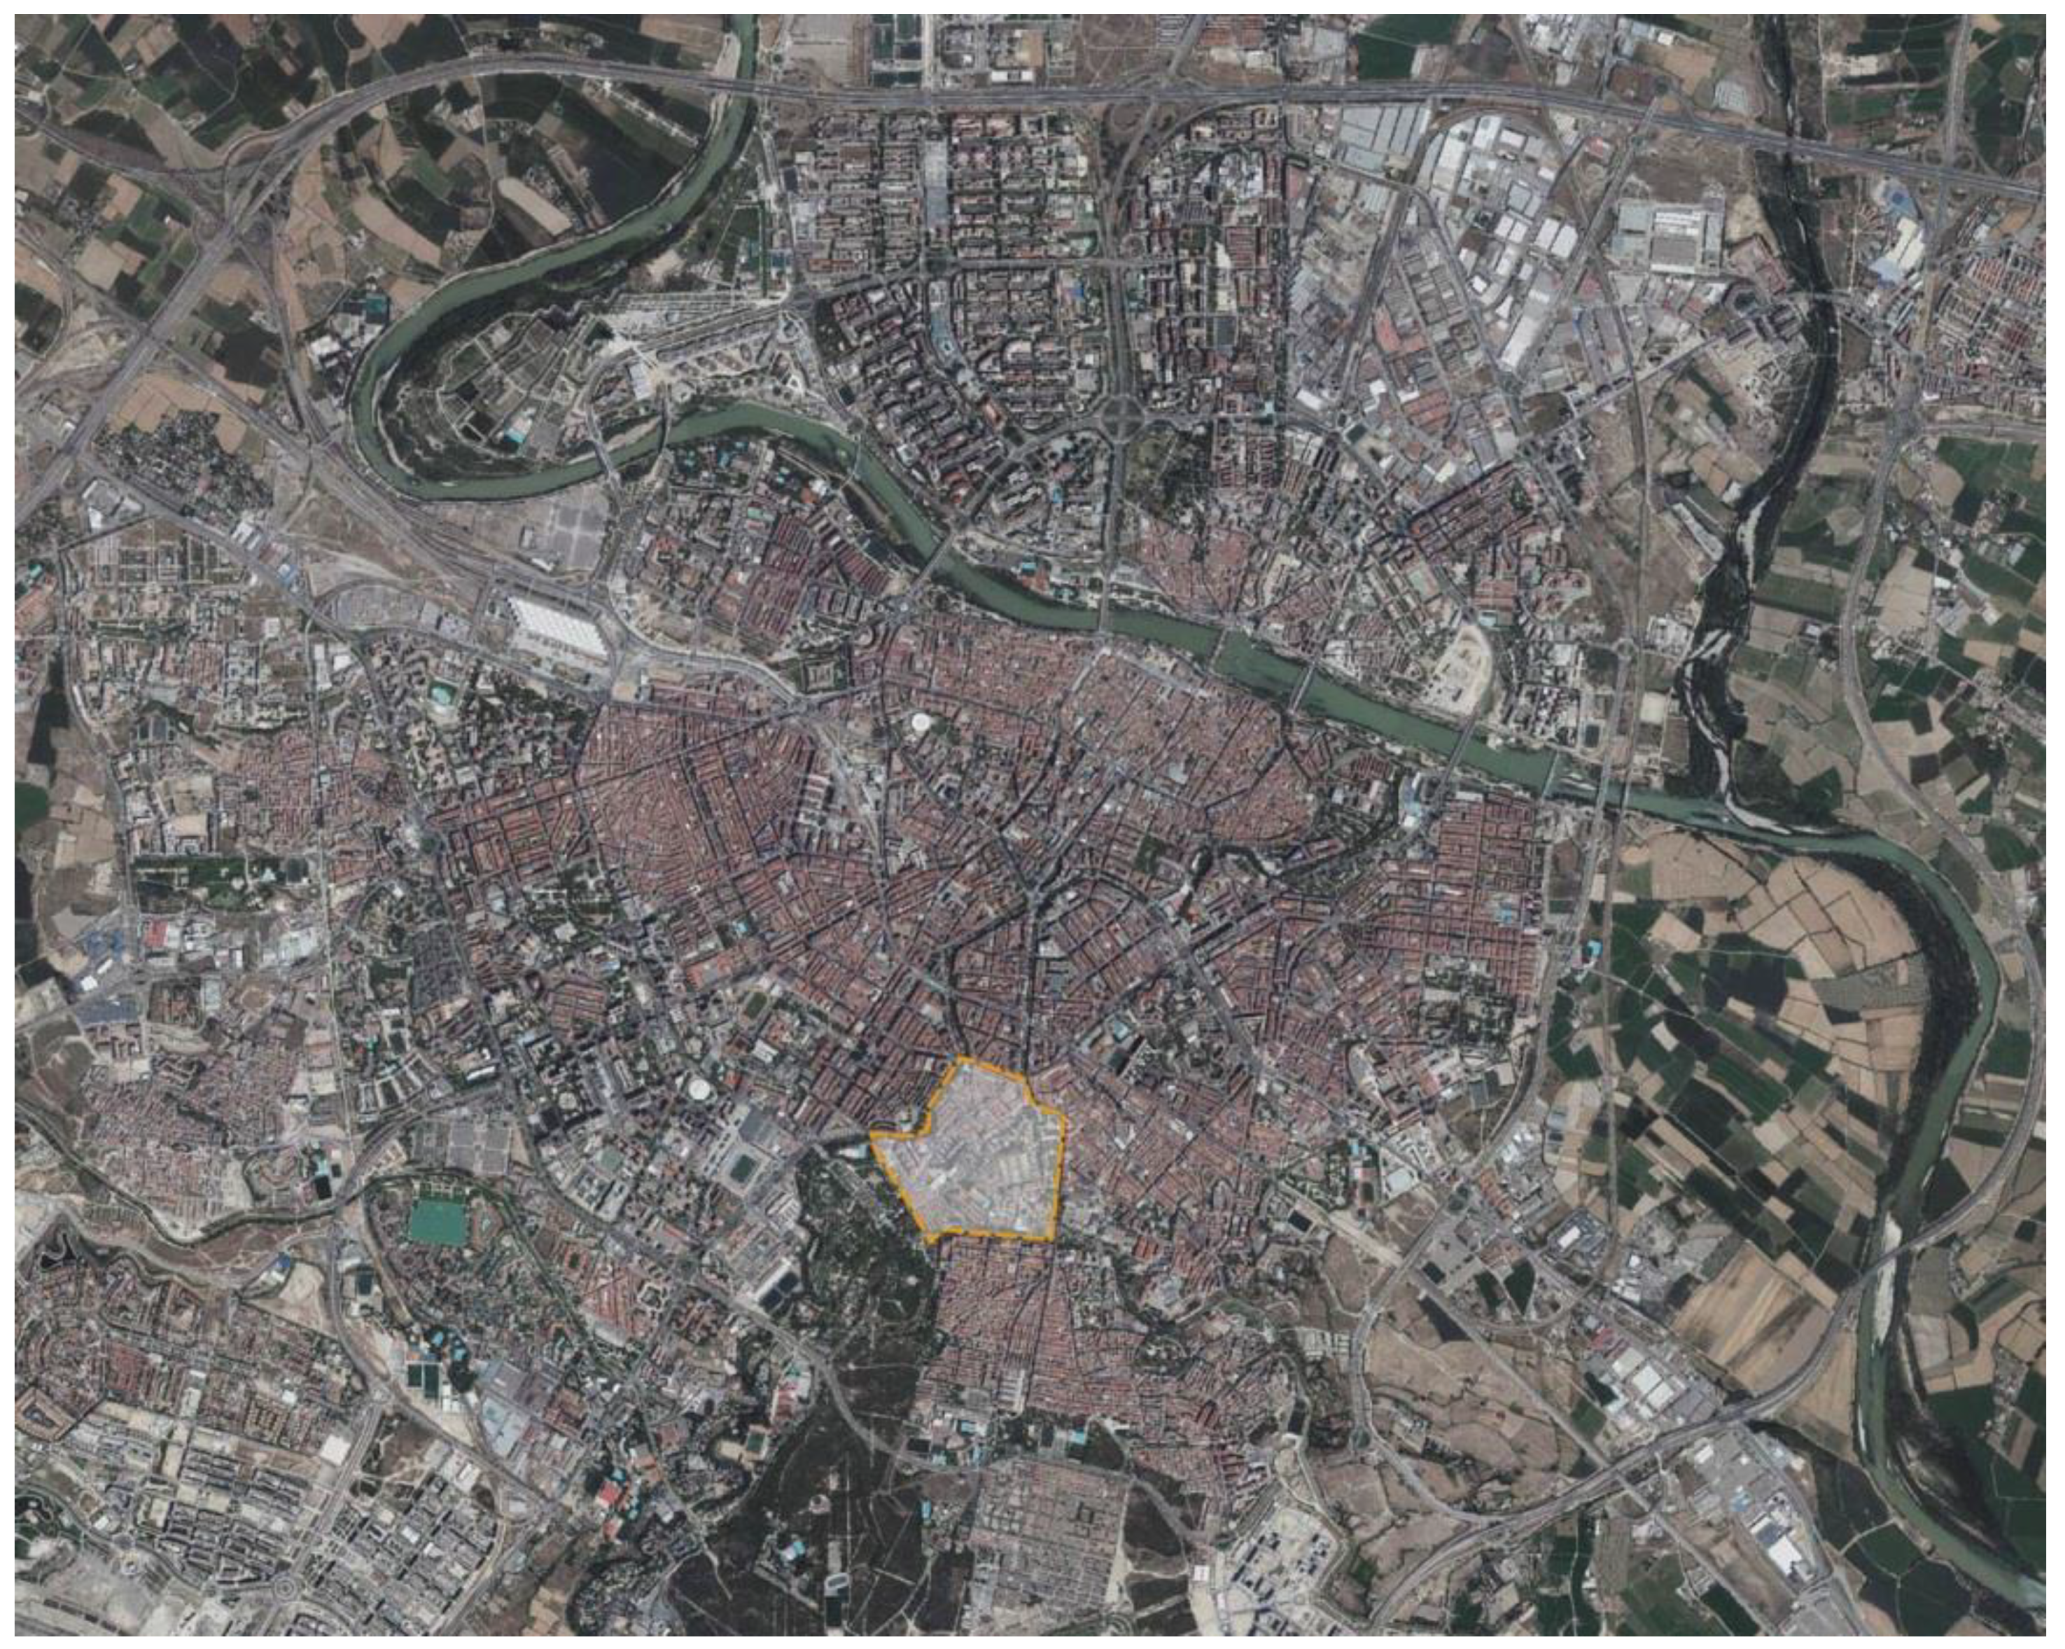
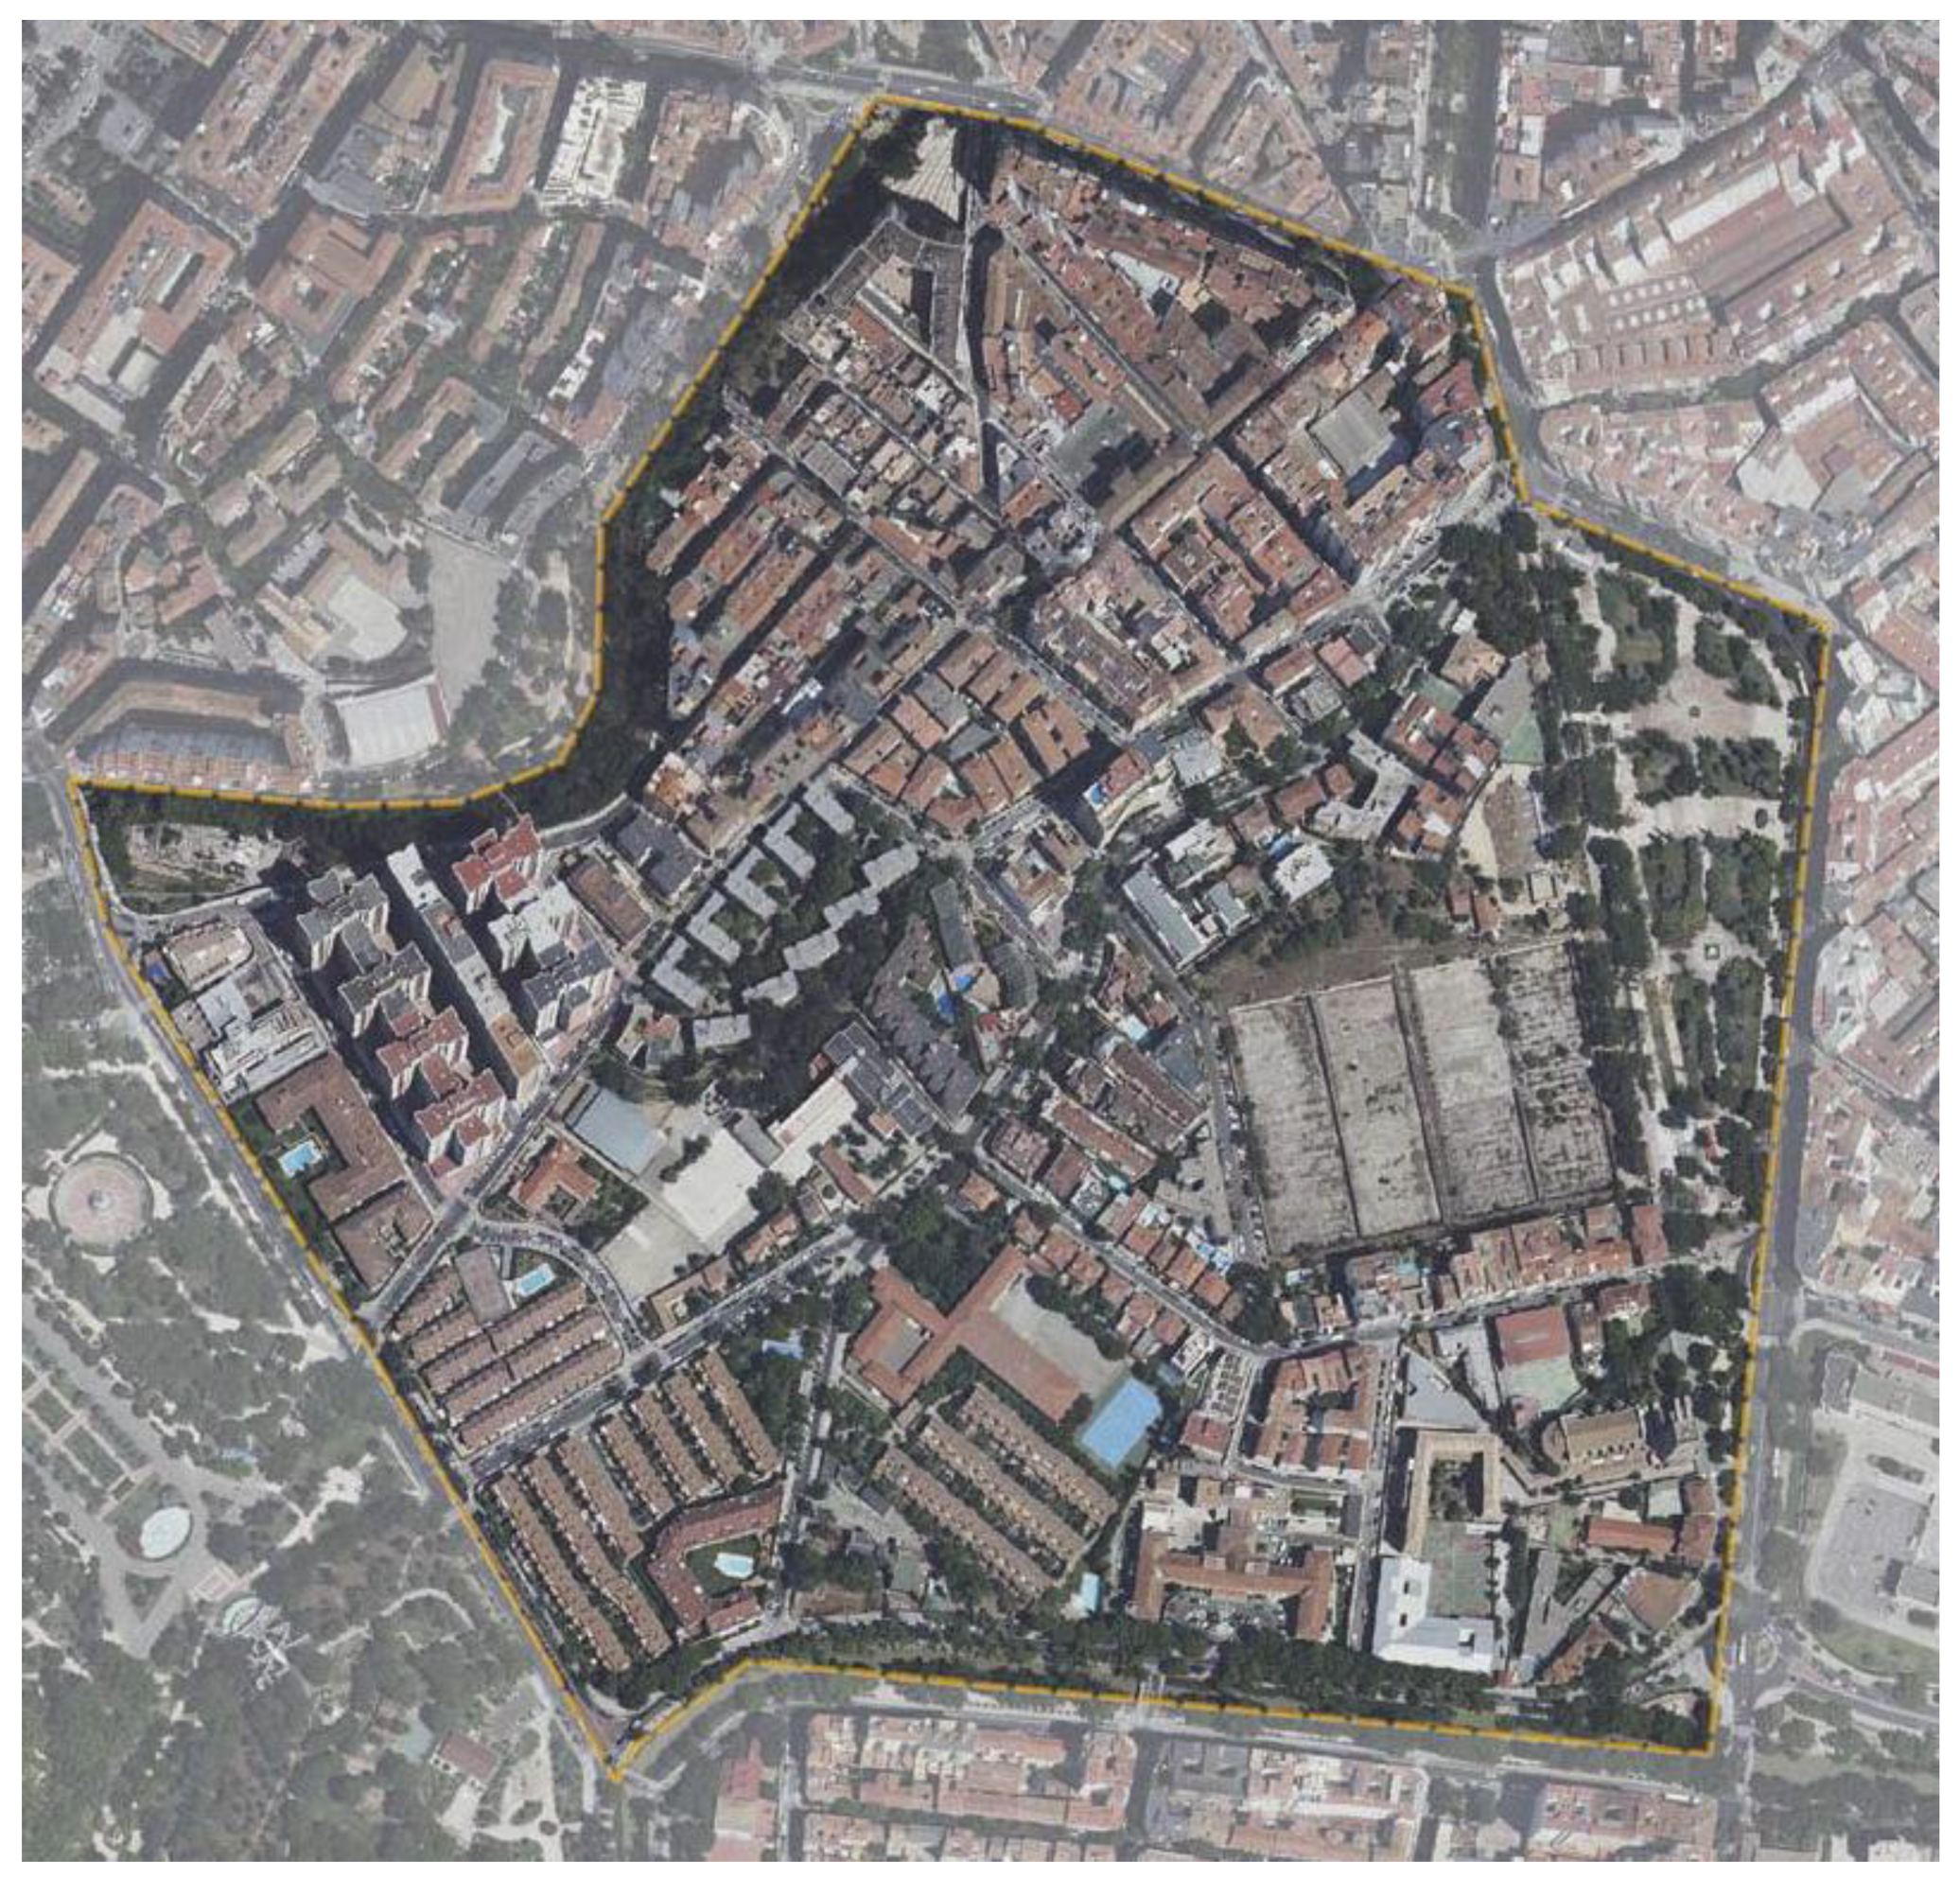
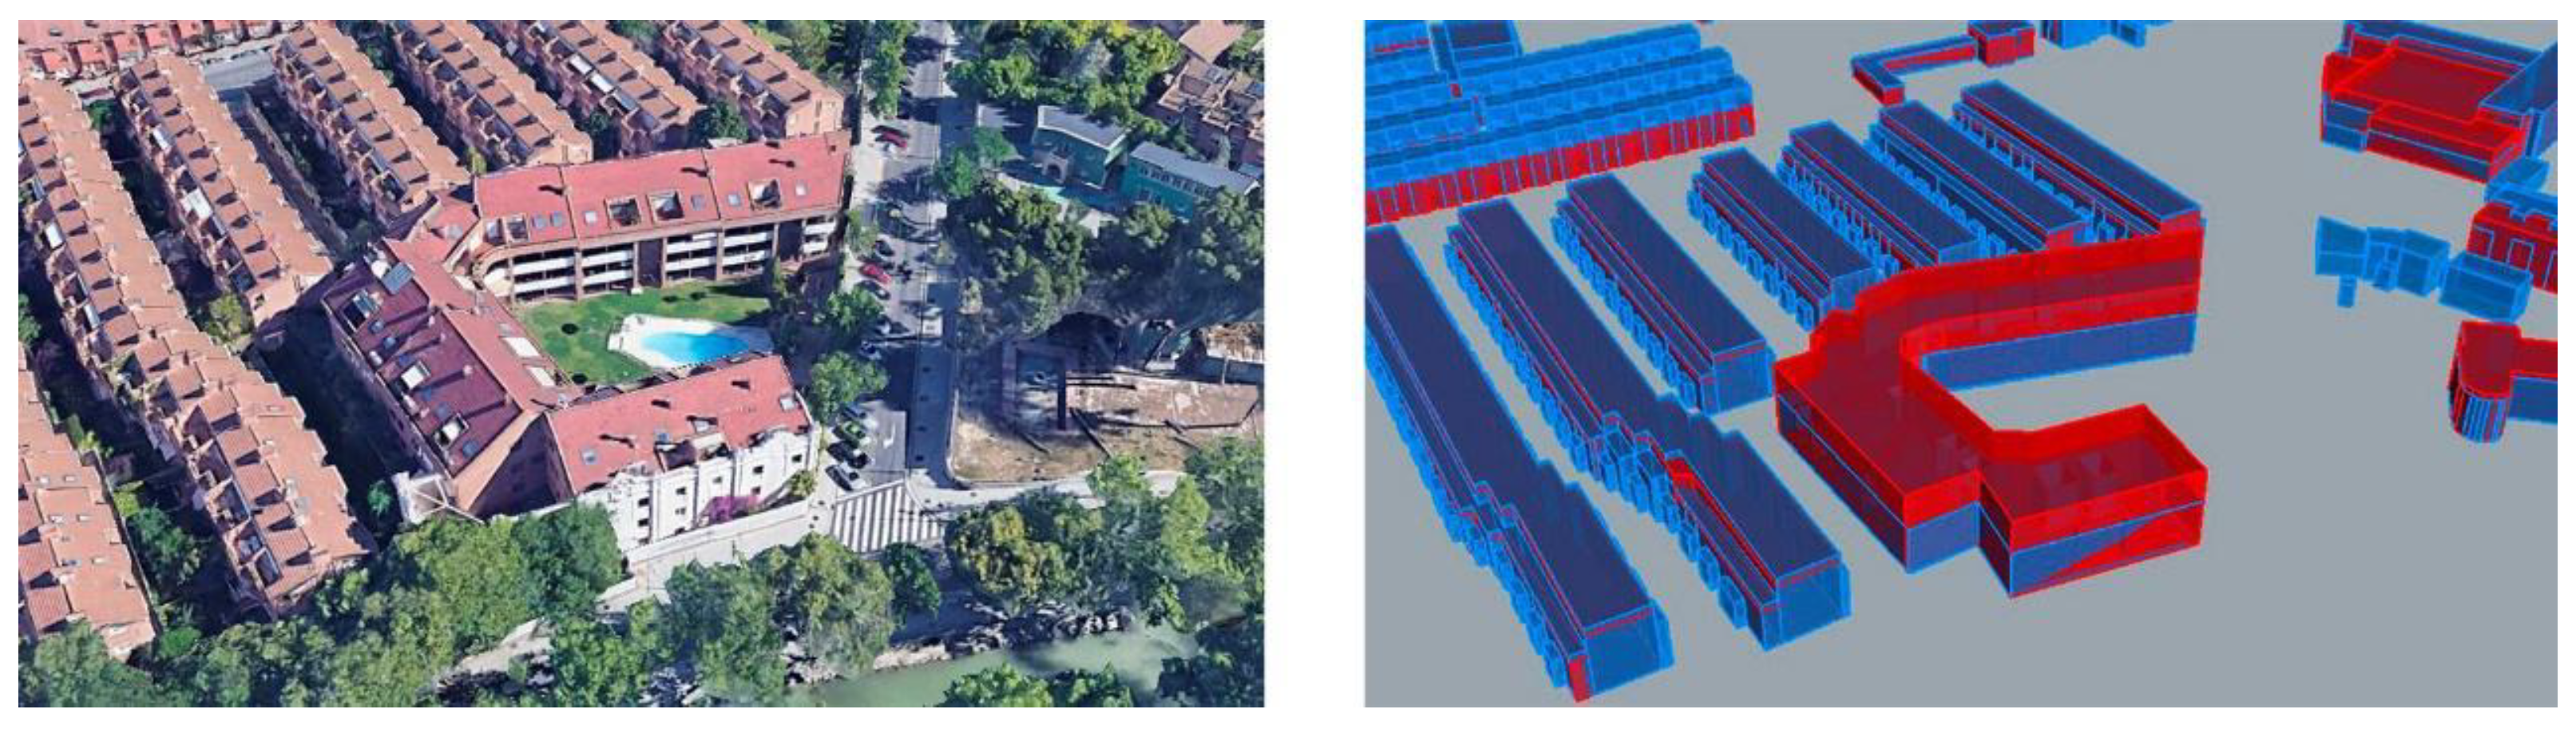
2.1. Neighbourhood Used as Case Study

The case study is the neighborhood of Ruiseñores in Zaragoza (Spain), which has been chosen for its variety of building typologies: residential towers, row houses, linear multi-family blocks and stand-alone houses; as well as for incorporating unique buildings: four educational buildings, four sanitary buildings (one of them a hospital), a sacred building, two retirement homes, and two office buildings. These different typologies allow a better evaluation of the precision of the GIS modelling used in them. This neighborhood is downtown and is situated in the district named Universidad. This neighborhood, built at the beginning of the 20th century, is located in the southern part of the city. The neighborhood is next to one of the main axes of expansion of the city at the time. Currently, the district it belongs to is one of the better connected and equipped areas of the city. The neighborhood occupies 400,000 m2 and it has approximately 450 buildings occupying an area of 158,500 m2 [44]. The buildings have a built area of 680,000 m2 [44]. Figure 1 shows the location of this neighborhood in the city of Zaragoza, and Figure 2 displays the neighborhood in more detail.

2.2. Sources to Define Heights for the Hand-Built, Cadastre and INSPIRE Cadastre Models

3D models generated by extruding a footprint to the height obtained by multiplying the number of stores with an assumed store height, have been proven useful for a variety of applications [46,47,48,49], including energy simulations [50,51]. The number of stores is often available from open data of governments and volunteered geoinformation; alternatively, they can be obtained by visual inspection of buildings or by using terrestrial or airborne imagery [33].
In our study, we use cadaster data for the 2D footprints of the three models, and the sources and software indicated in Table 1 to build heights.

2.2.1. 3D Hand-Built Model

The model is based on the 2D footprint information from the cadastral dataset, generating the heights with the information provided by Google Earth and by visually inspecting the neighborhood to ensure that the model is as close as possible to reality

2.2.2. 3D Automatically Built Model from Regular Cadaster Data

The Spanish regular cadastral dataset is the main public administration dataset of building stock information in Spain [52,53]. To generate the 3D model, the data used are the GIS vector data models in Shapefile format, published in the Electronic Office of the Cadaster by the Government of Spain, version 2.0, updated 27 June 2014 [54].

2.2.3. 3D Model Automatically Built from INSPIRE Cadaster Data

For this automatic model, the data are provided by the INSPIRE (Infrastructure for Spatial Information in Europe) Services of Cadastral Cartography, provided by the Spanish Government in GIS [55]. The INSPIRE Directive specifies the general rules for the establishment of a European Spatial Data Infrastructure (SDI) based on Member States’ SDIs [56]. It was approved by the European Parliament and the Council on 14 March 2007 in Directive 2007/2/CE [57]. These measures ensure that the spatial information infrastructures created by Member States are compatible and usable in a cross-border community context. With this initiative, GIS data from all the countries of the European Community can be handled with common standards, allowing for the comparable analysis of data from various countries and the application of the same methodologies of study throughout the European Community, making them more valuable and effective.
To obtain the data, QGIS, version Desktop 3.10.2 with GRASS 7.8.2, was used with the Spanish Inspire Cadastral Downloader plug-in, using the ATOM service according to the Inspire Directive.

2.3. Methodology to Build the 3D Hand-Built, Regular Cadaster and INSPIRE Cadaster Models

2.3.1. 3D Hand-Built Model

The 3D model was generated extruding one by one each building footprint the corresponding height in Google Earth. The extrusion is done directly in Ecotect Analysis 2011 software. For simplicity, buildings are generated as orthohedrons. This corresponds to a LOD (level of detail) 1: extrusions of polylines. The LOD defines how the 3D geometry of the building model can achieve different levels of refinement and is used as a measure of the service level required. LOD options normally range from 1 to 5. For this reason, the present model does not differentiate between flat roof and pitched/tilted roof, assuming that all rooftops are flat. This simplification is commonly applied in other studies [20,25,32,58] and is assumed for the three models in this paper since the chosen neighborhood has its roofs flat for the most part.

2.3.2. 3D Model Automatically Built from Regular Cadaster Data

The workflow starts downloading the corresponding .shp data from the regular public cadaster. The data associated with each plot, under the name “Constru”, includes the building heights, which are expressed in roman numbers following the building codes specified in the regular cadastral data [54]. For example, a given building height could be −II + IV + TZA. This means that there are two floors below ground, four floors above ground and a terrace on the top.
For the extrusion of the heights, it is necessary to convert the mentioned nomenclature into specific heights in metros. The conversion criteria used to automatically build the 3D model from the regular cadaster data are indicated in Table 2.
Other authors estimate that each level has a three m height [20,30]. In this paper we consider four meters for the first floor because its use in this neighborhood is commercial for the most part.
Once the heights are defined, we proceeded in QGIS assigning to each polyline in the initial cadaster data a different layer according to its defined height. Subsequently, they were exported to .dxf format.
The .dxf file is then imported in the the AutoCAD 2019 software. To be able to generate the 3D model we developed the algorithm “3D_Model”. This algorithm is presented in Section 3.1, as part of the results of this paper. Using this algorithm, the 3D model is generated automatically. After the application of the algorithm, the model is ready to be used in Autocad and to be exported to other software tools.

2.3.3. 3D Model Automatically Built from INSPIRE Cadaster Data

The workflow process is very similar to the 3D model automatically built from the regular cadaster data. The difference between the two automatic models lies in the information base.
The data used comes from the Spanish INSPIRE Services of Cadastral Cartography. Using the Spanish Inspire Cadastral Downloader plug-in in QGIS, the data are directly downloaded and integrated into QGIS.
The INSPIRE data contains the heights of the building in numbers in the column “Number of Floors Above Ground”, so it is simpler to define buildings heights assigning a height of four meters to the first floor and three meters to the upper floors. It is only necessary to assign different layers to polylines according to the number of floors and export it in .dxf format.
The .dxf is imported into AutoCAD and extruded using de algorithm “3D_Model” as in the previous case.

2.4. Methodology for Solar Access Analysis in the Hand-Built, Regular Cadaster and INSPIRE Cadaster Models

Two types of solar access simulations were conducted in Ecotect Analysis 2011 in order to establish a comparison between the models:
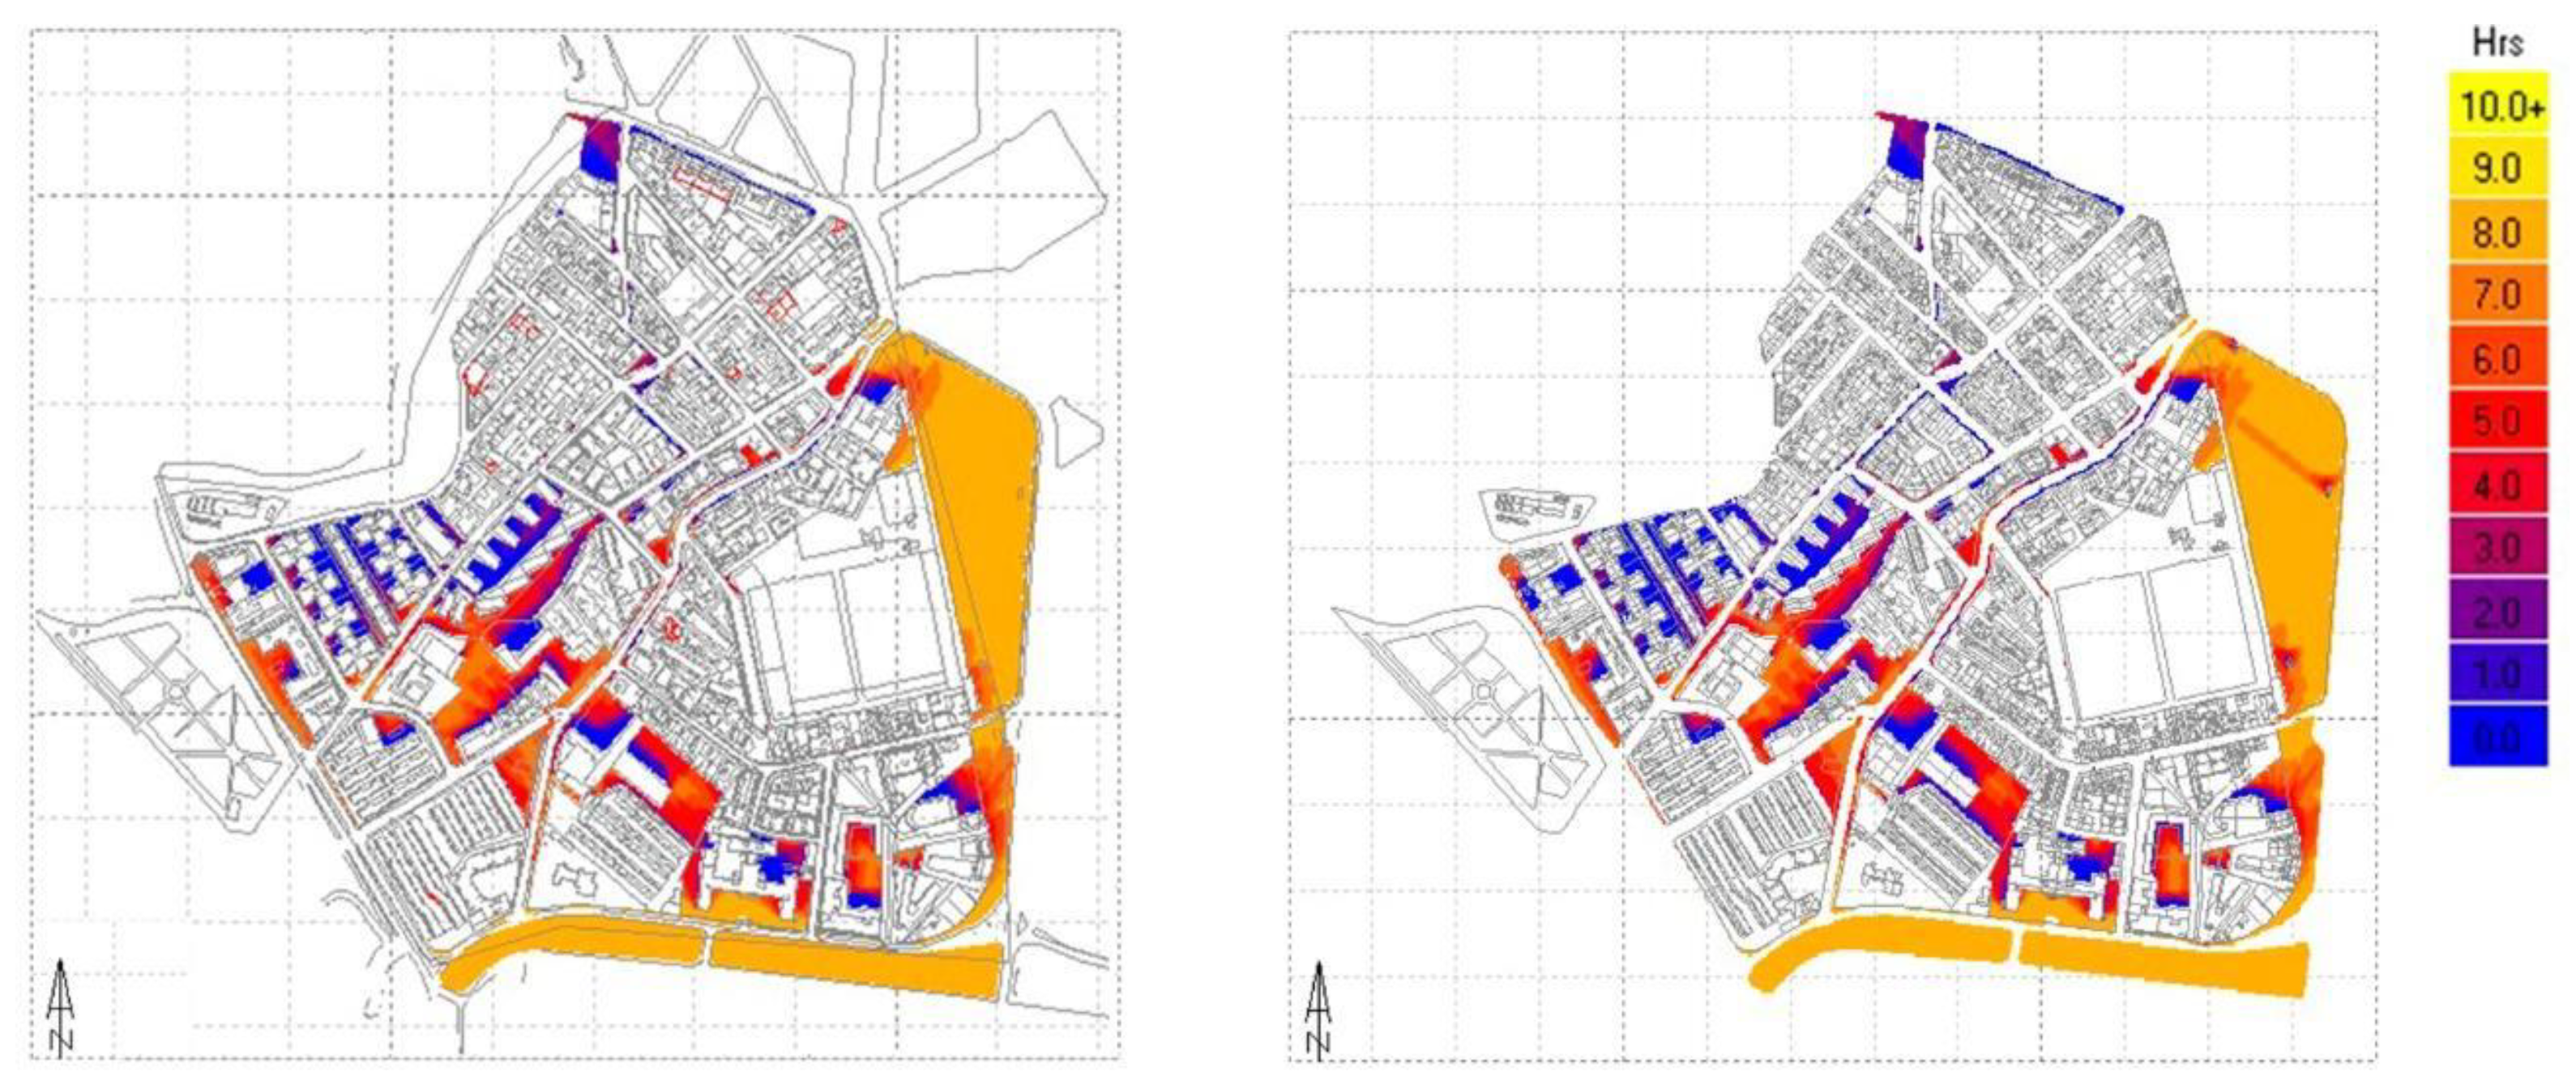
  • Solar access on sidewalks and open spaces in terms of sunlight hours on the 21 December on a grid analysis of 1.70 × 2.10 m2 across the case study area. This could be useful, for example, to study the potential for thermal comfort for a pedestrian in public spaces, in terms of useful hours throughout the day as suggested by the Spanish Urban Ecology Agency [11]. The options used in the software tool for the simulations are indicated in Table 3.
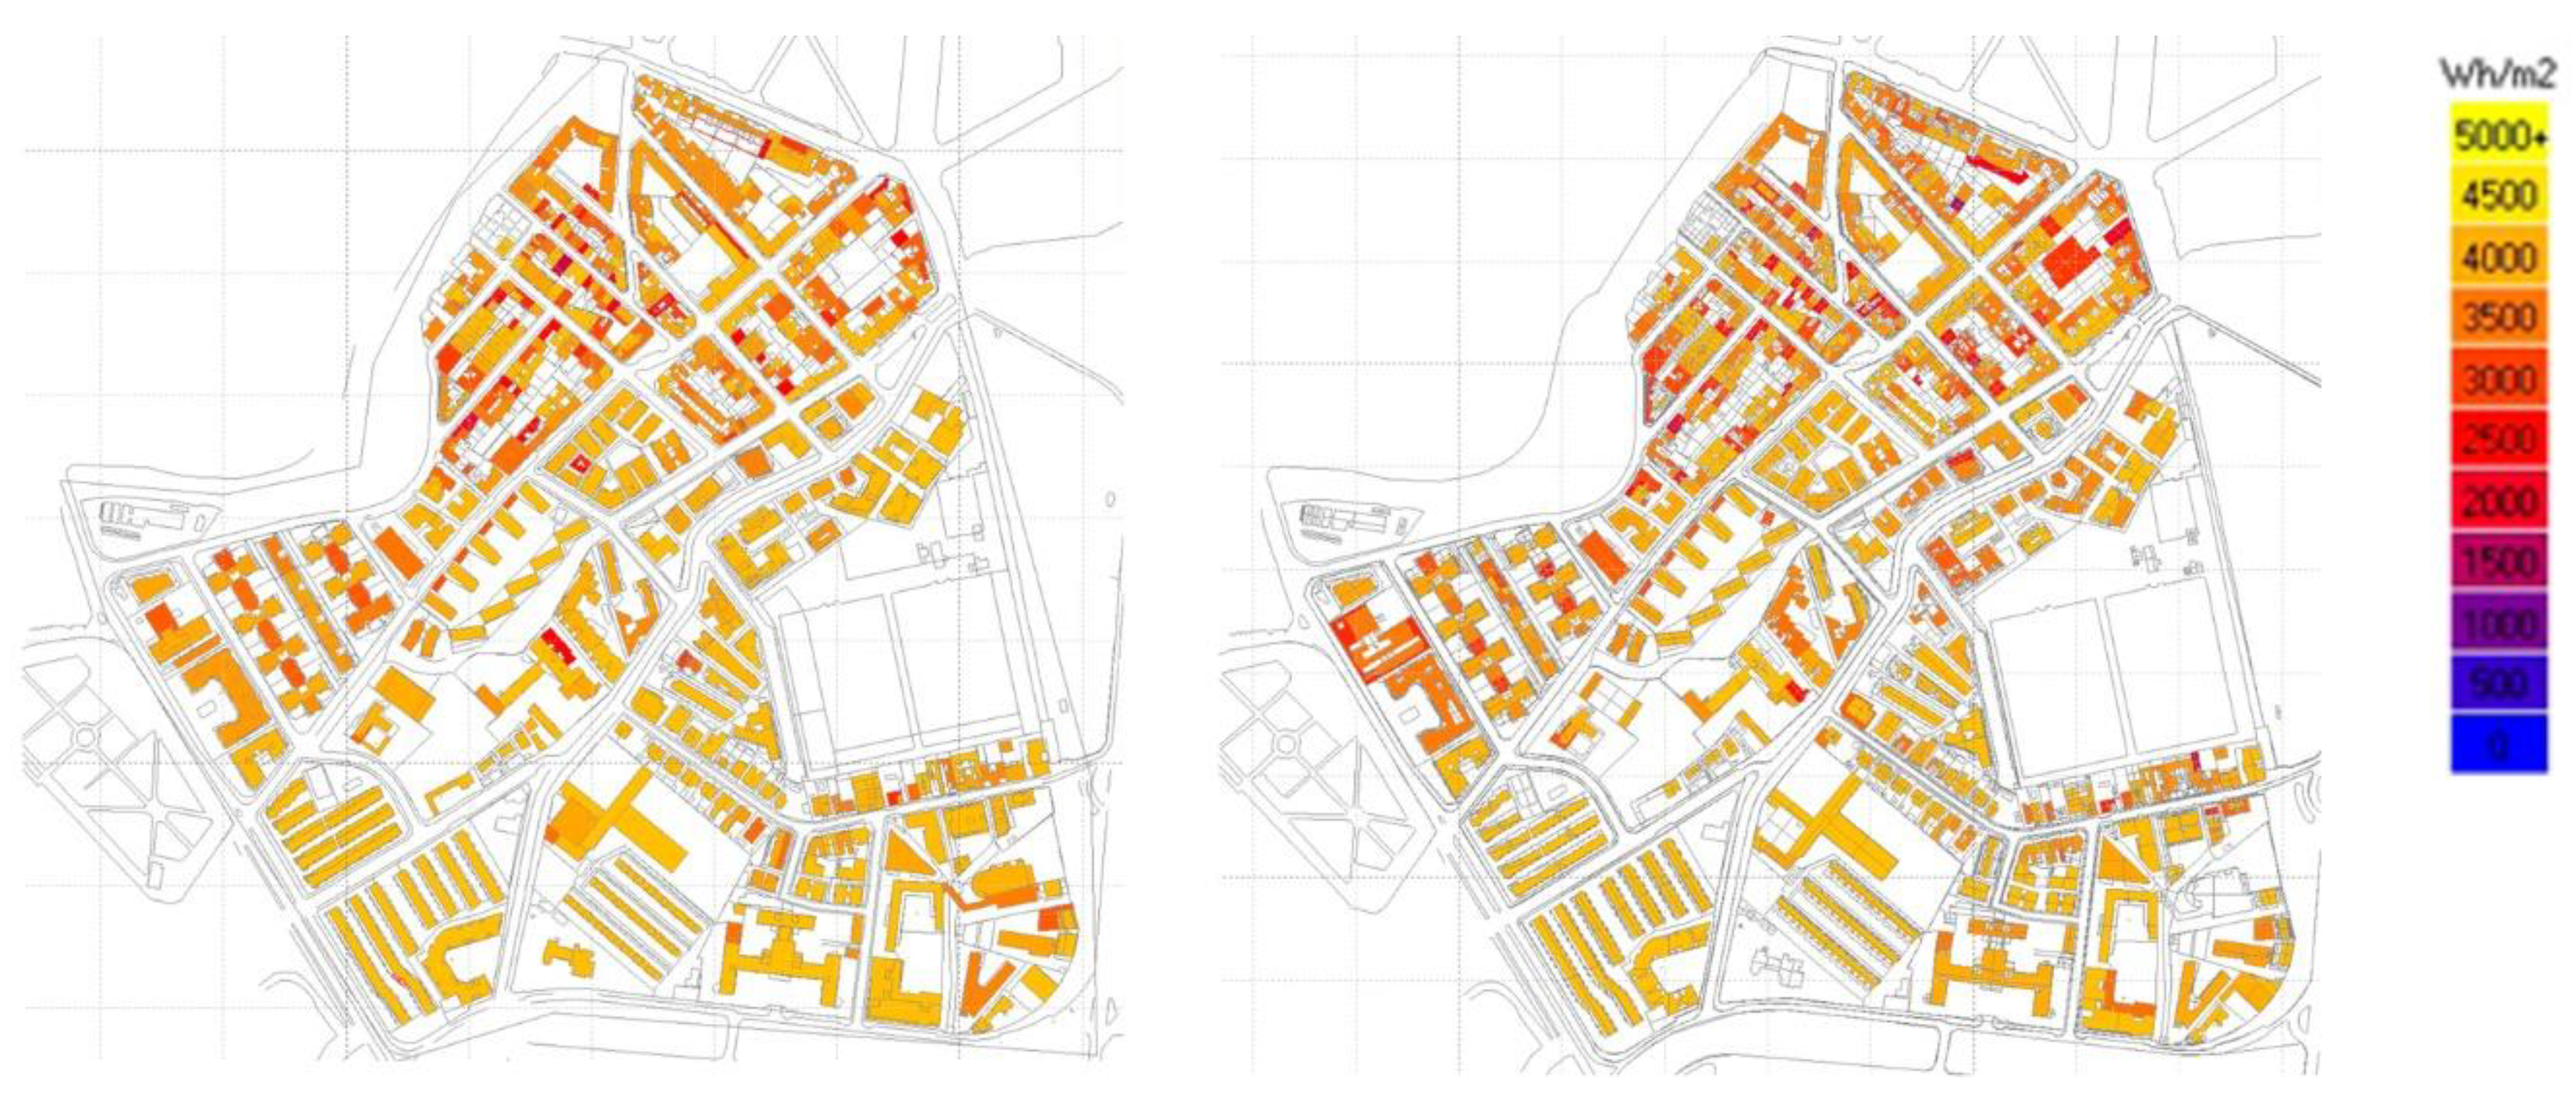
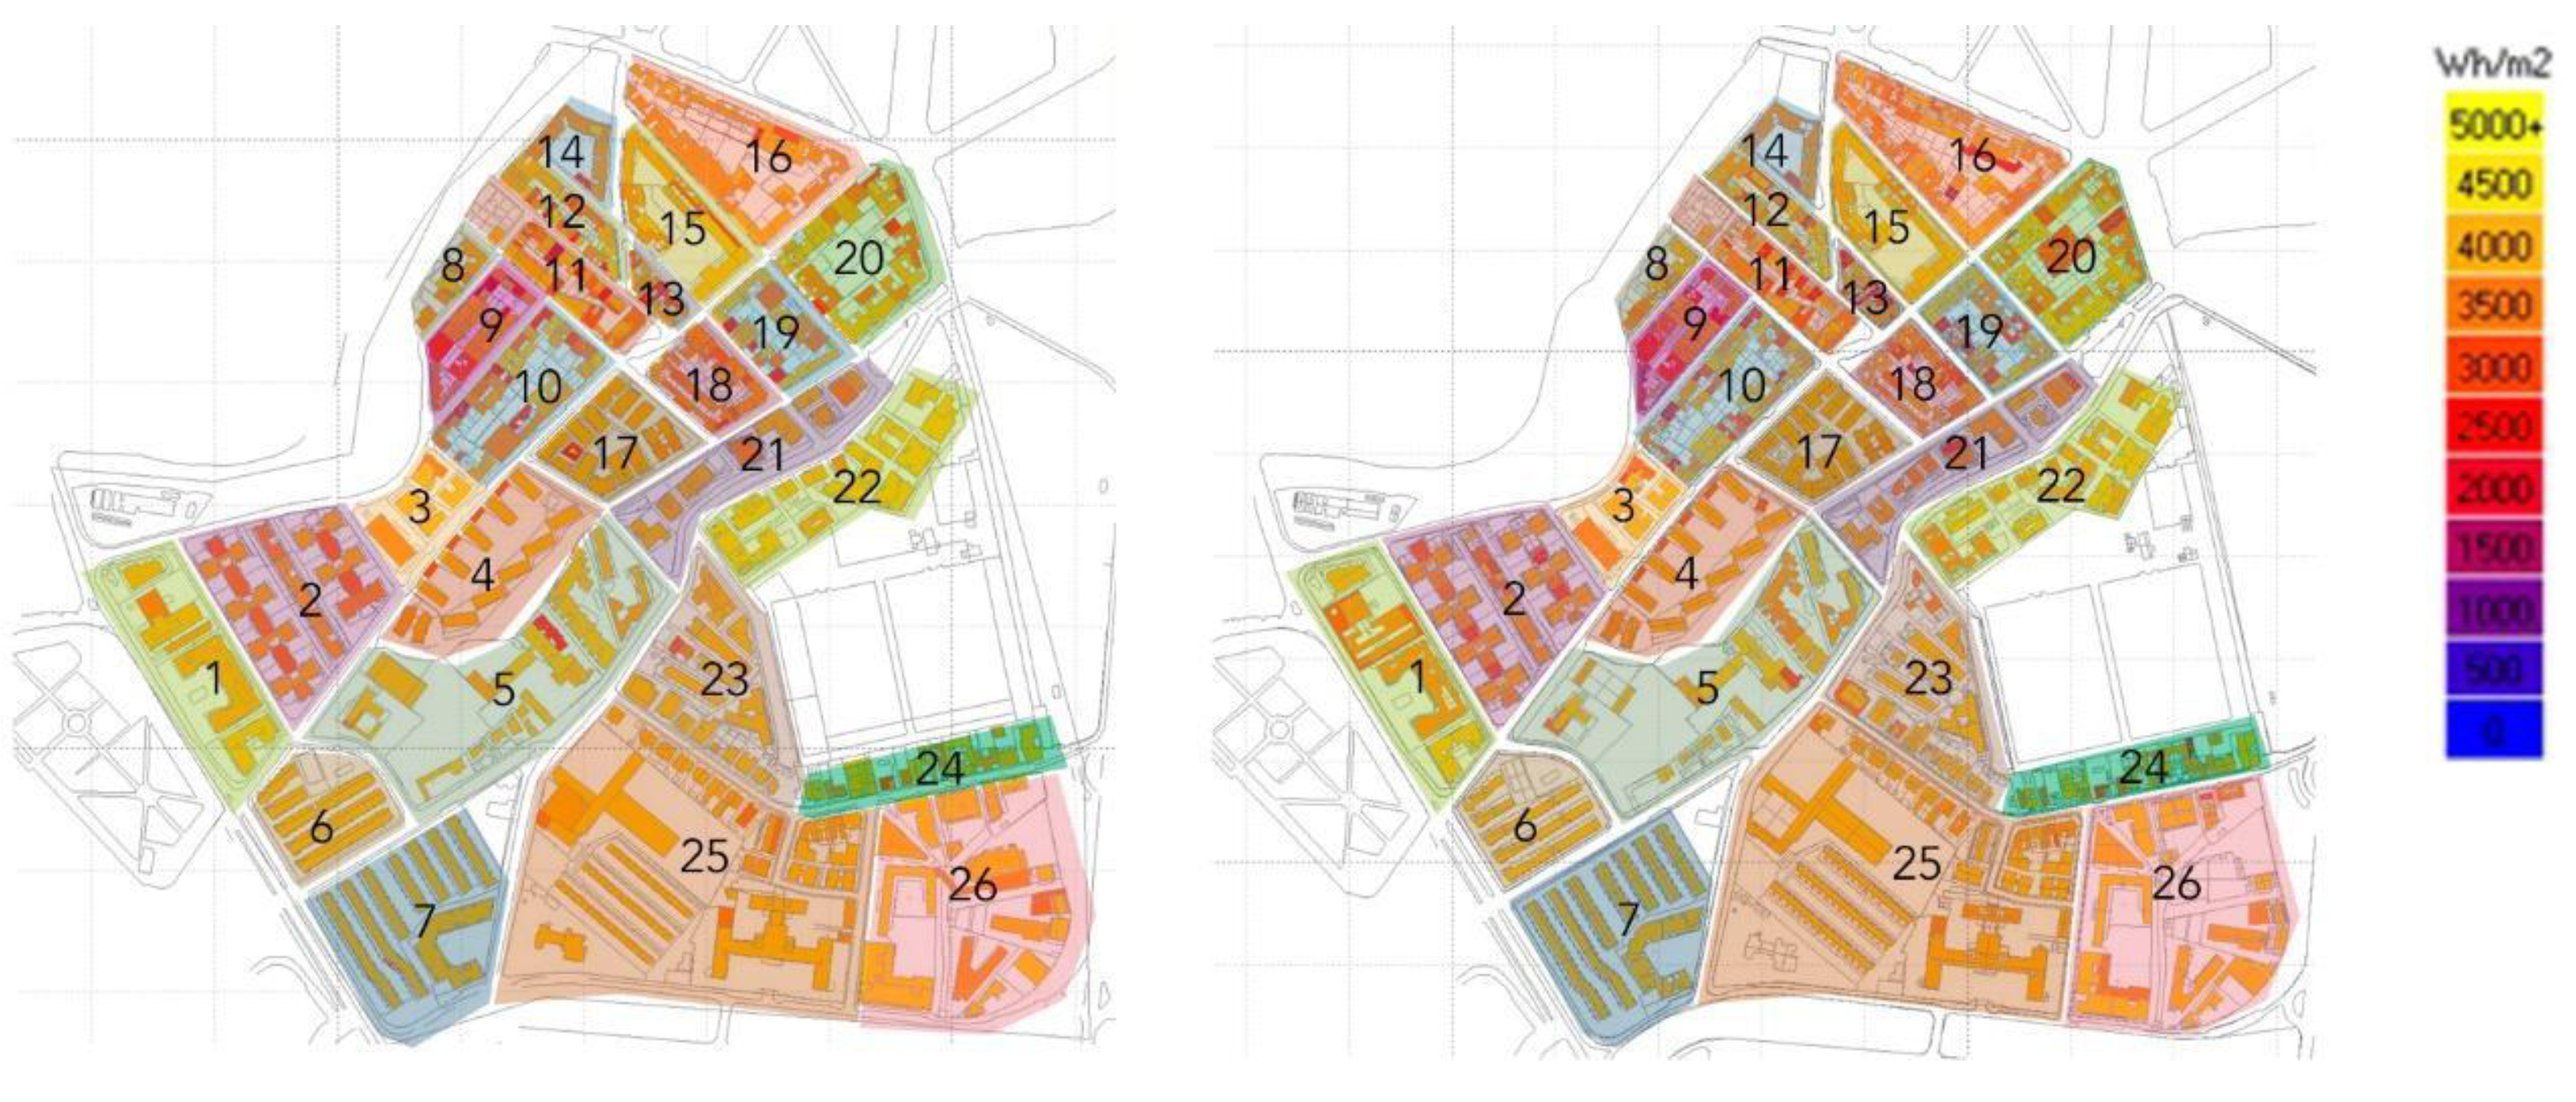
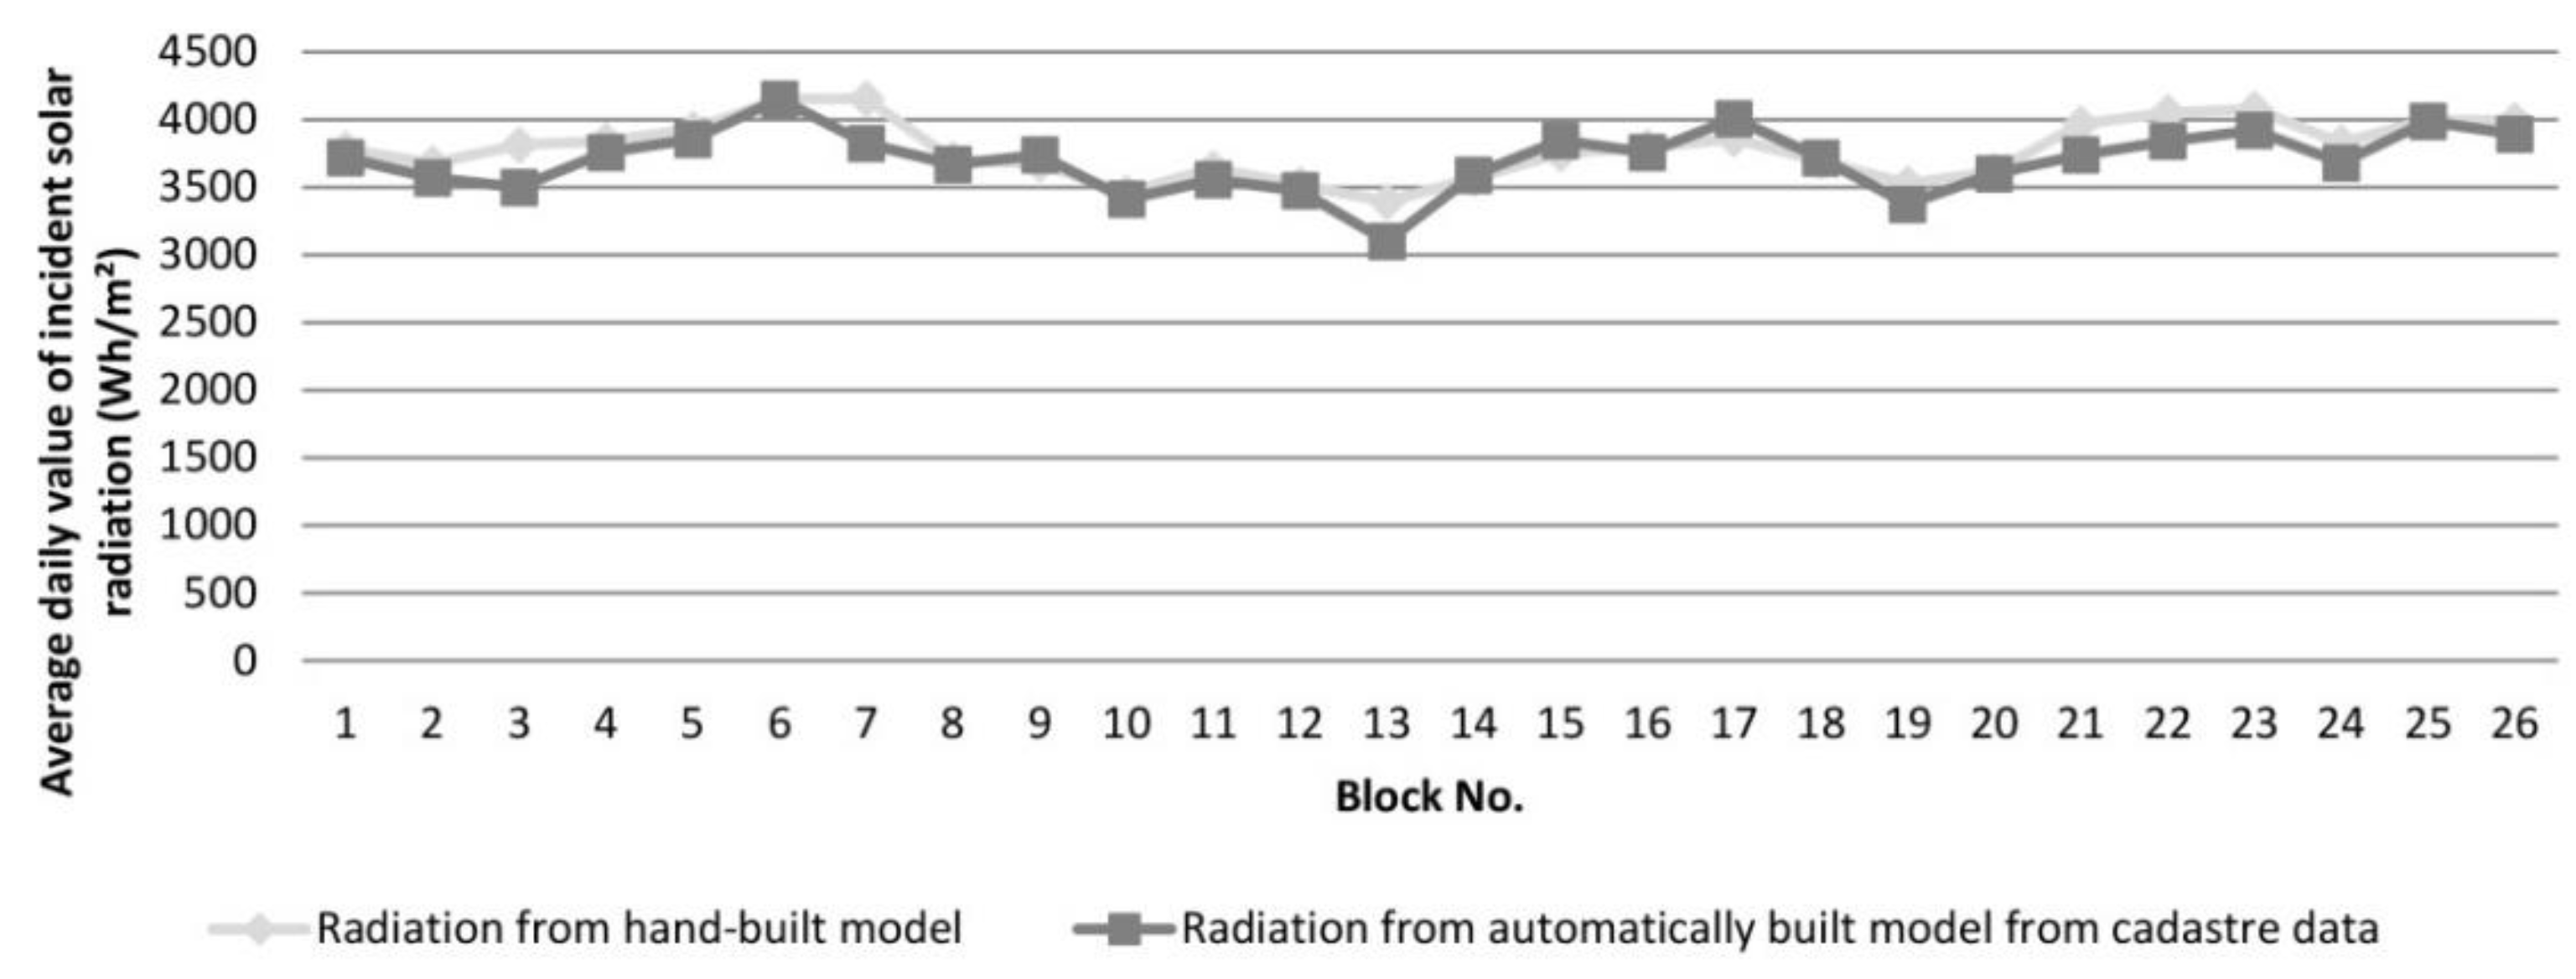
  • Solar access on the roofs of buildings in terms of average daily value of incident solar radiation during the whole year. This could be useful, for example, to study rooftop PV potential as part of regional renewable energy policies, as suggested in Wiginton et al. [5]. The options used in the software tool for the simulations are indicated in Table 3.
In both calculations, the shadows considered are the ones caused by buildings. Trees are not included in the model. The results from these calculations were compared as explained next.

2.5. Methodology for Comparison of the Automatically Built Models with the Hand-Built Model

A comparison is established between the models, based on the time it takes to generate them and the accuracy of their results

2.5.1. Accuracy of the Models

The accuracy of the automatically built models is analyzed in two steps comparing the results with the hand-built model used as reference. First, a comparison of the 3D models obtained is performed using the software Rhinoceros, version 5, to overlap the models and visually identify the volumetric differences. Secondly, a comparison of the results obtained for sunlight hours on pedestrian spaces and for the average daily value of incident solar radiation on roofs is undertaken.

2.5.2. Time-Consumption Analysis

The time required to build each of the 3D automatically built models is compared with the hand-built model. In order to do the comparison, a standard office desktop computer with the following characteristics was used for all the calculations: Processor Intel® Core™ i7-8700 CPU @ 3.20 GHz; 32 GB RAM; Windows 10, 64-bit operating system.

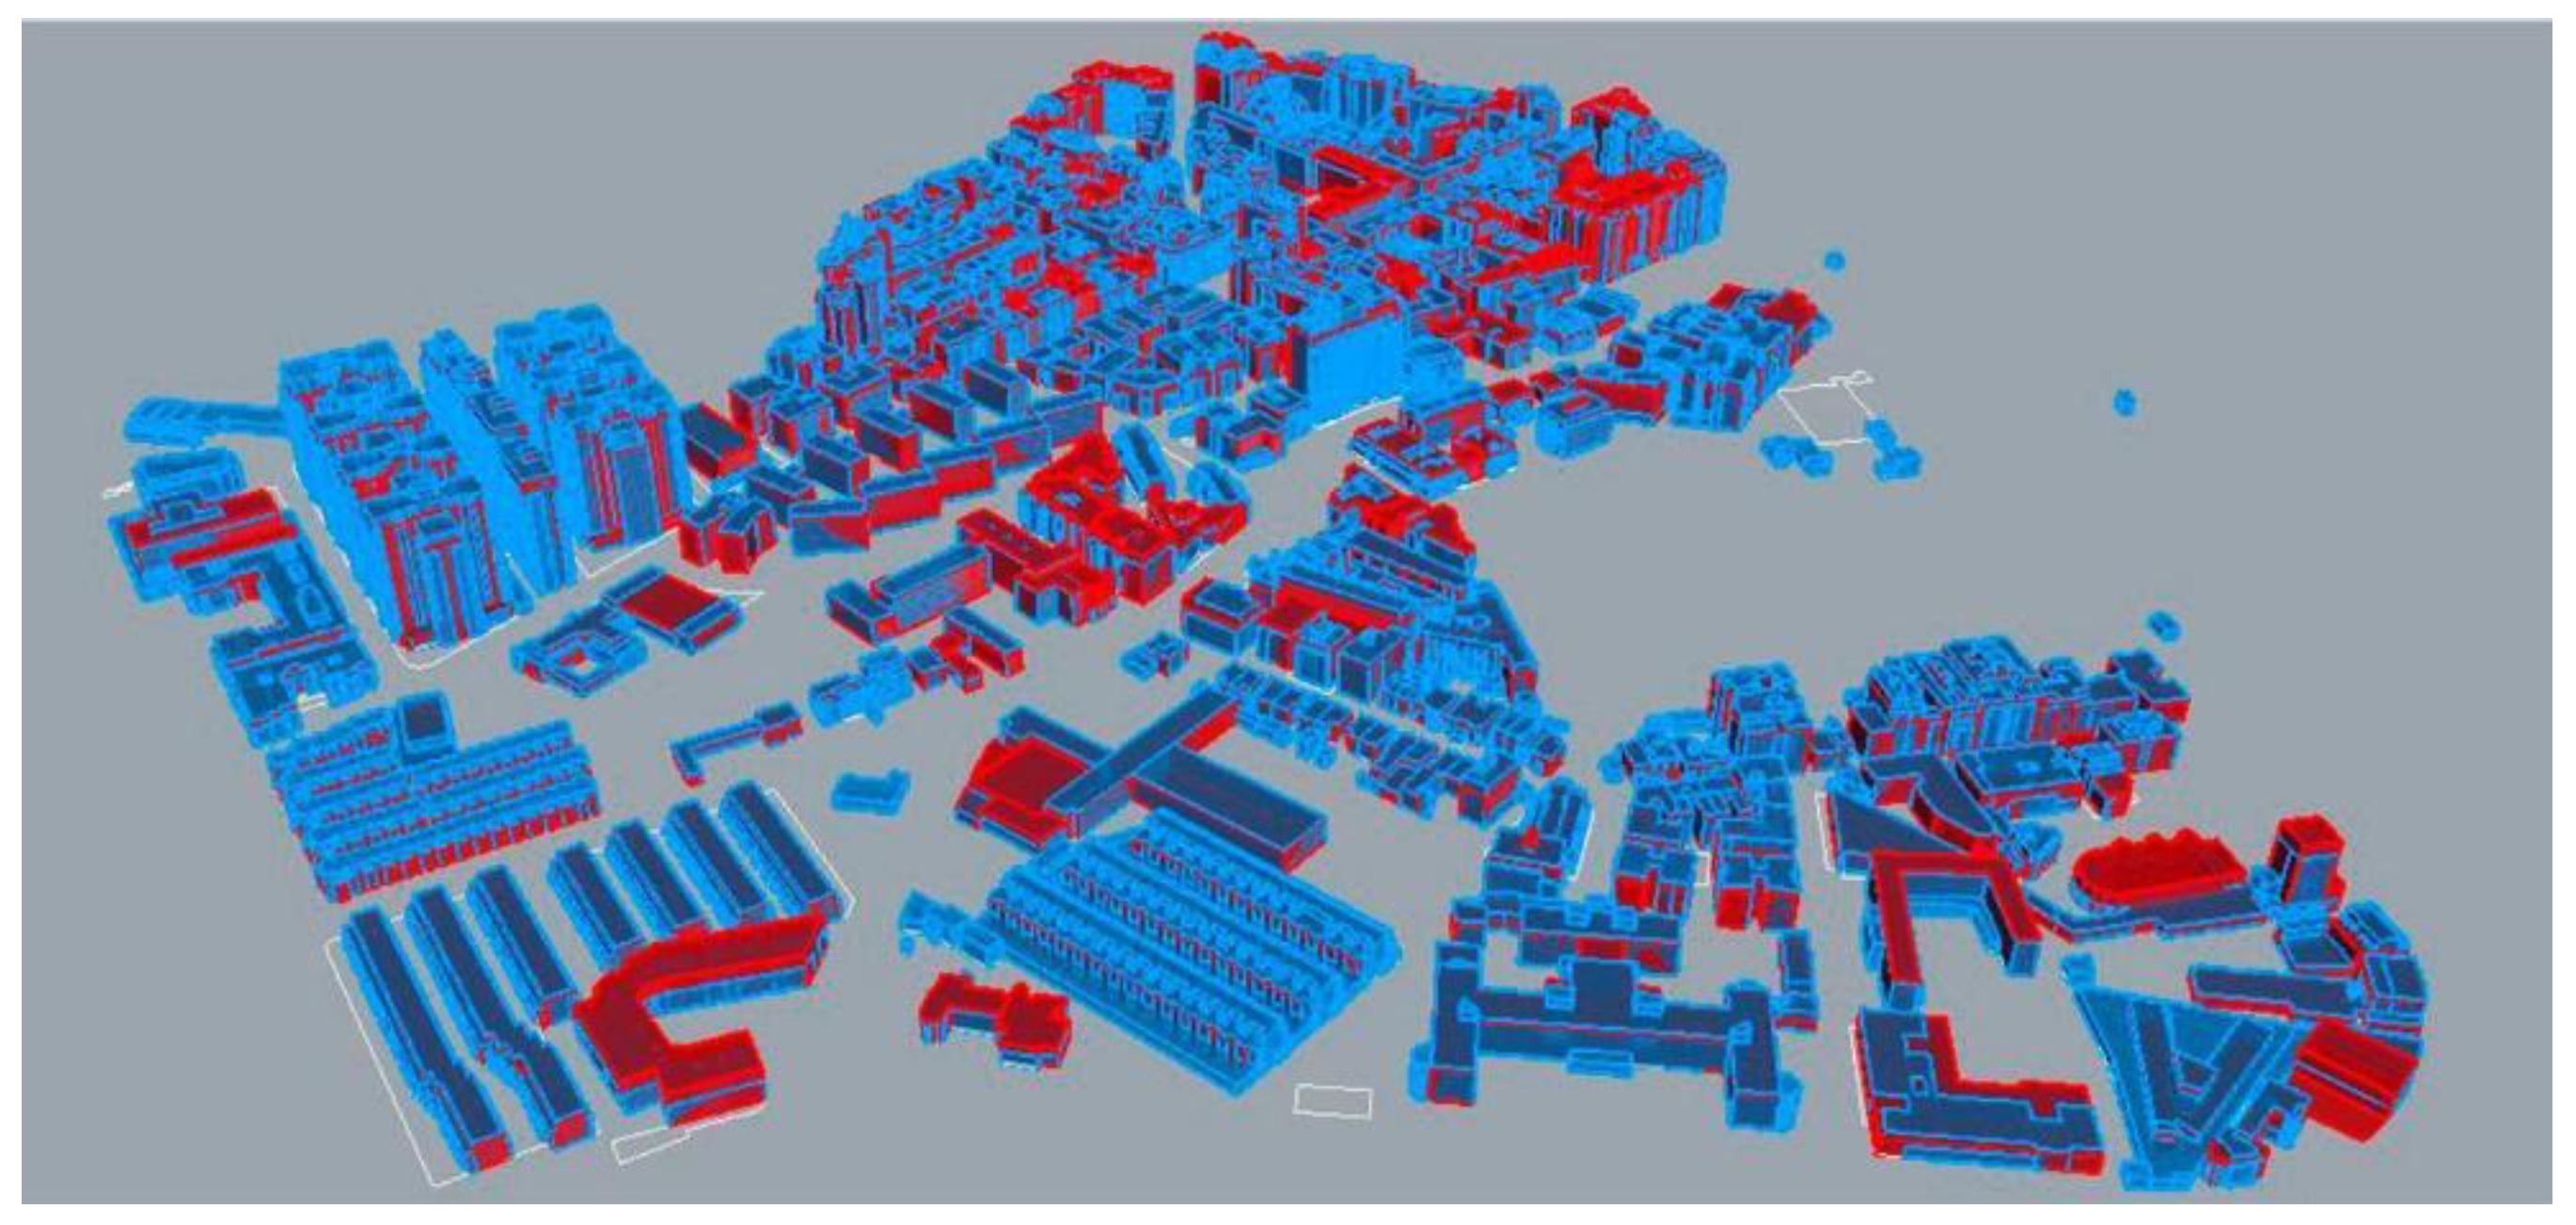
2.6. Methodology to Build and Analyze the 3D Model for Complete Cities

The automatically built models have the potential to generate large urban environments, such as cities, in a relatively short time. To test this capacity, the whole city of Zaragoza was generated to study how long it actually takes to build a 3D model automatically. The city used as case study, Zaragoza, has an extension of 967 km2 [59], and accommodates a population of 681,877 people [60] in 2020.

3. Results and Discussion

3.1. The “3D_Model” Algorithm

An algorithm was created to extrude the 2D buildings footprints to the desired height in order to generate the 3D models. We developed this algorithm in AutoCAD, the most common software in architecture, version 2019.
This algorithm allows to automate the process of model creation: line selection and extrusion of volumes to the desired height. To use this algorithm, it is enough with having a drawing with all the 2D elements in different layers depending on their desired height and knowing the height in number of meters at which each layer is to be extruded.
The algorithm file in .lsp format, the code in open source, tutorials and examples of its use can be found in its GitHub repository (release upon acceptance). This algorithm was programmed in AutoLISP, a programming language designed for extending and customizing the functionality of AutoCAD, based on the LISP programming language. It was created using the AutoCAD 2019 tool Visual LISP Editor Editor since it is integrated in AutoCAD. Once created, it can be downloaded and used as a regular command in AutoCAD.
When you start the algorithm, it selects all the elements in a layer and extrudes them to the height written in the layer name. Then it goes to the next layer and repeats the process until there is no layer unextruded left. All the elements not desired to be extruded must been located in the layer named “0”. Every layer must have a name number, otherwise it may cause an error. When the 3D model is generated, it can be saved for operation in AutoCAD or to export it to other 3D software tools.

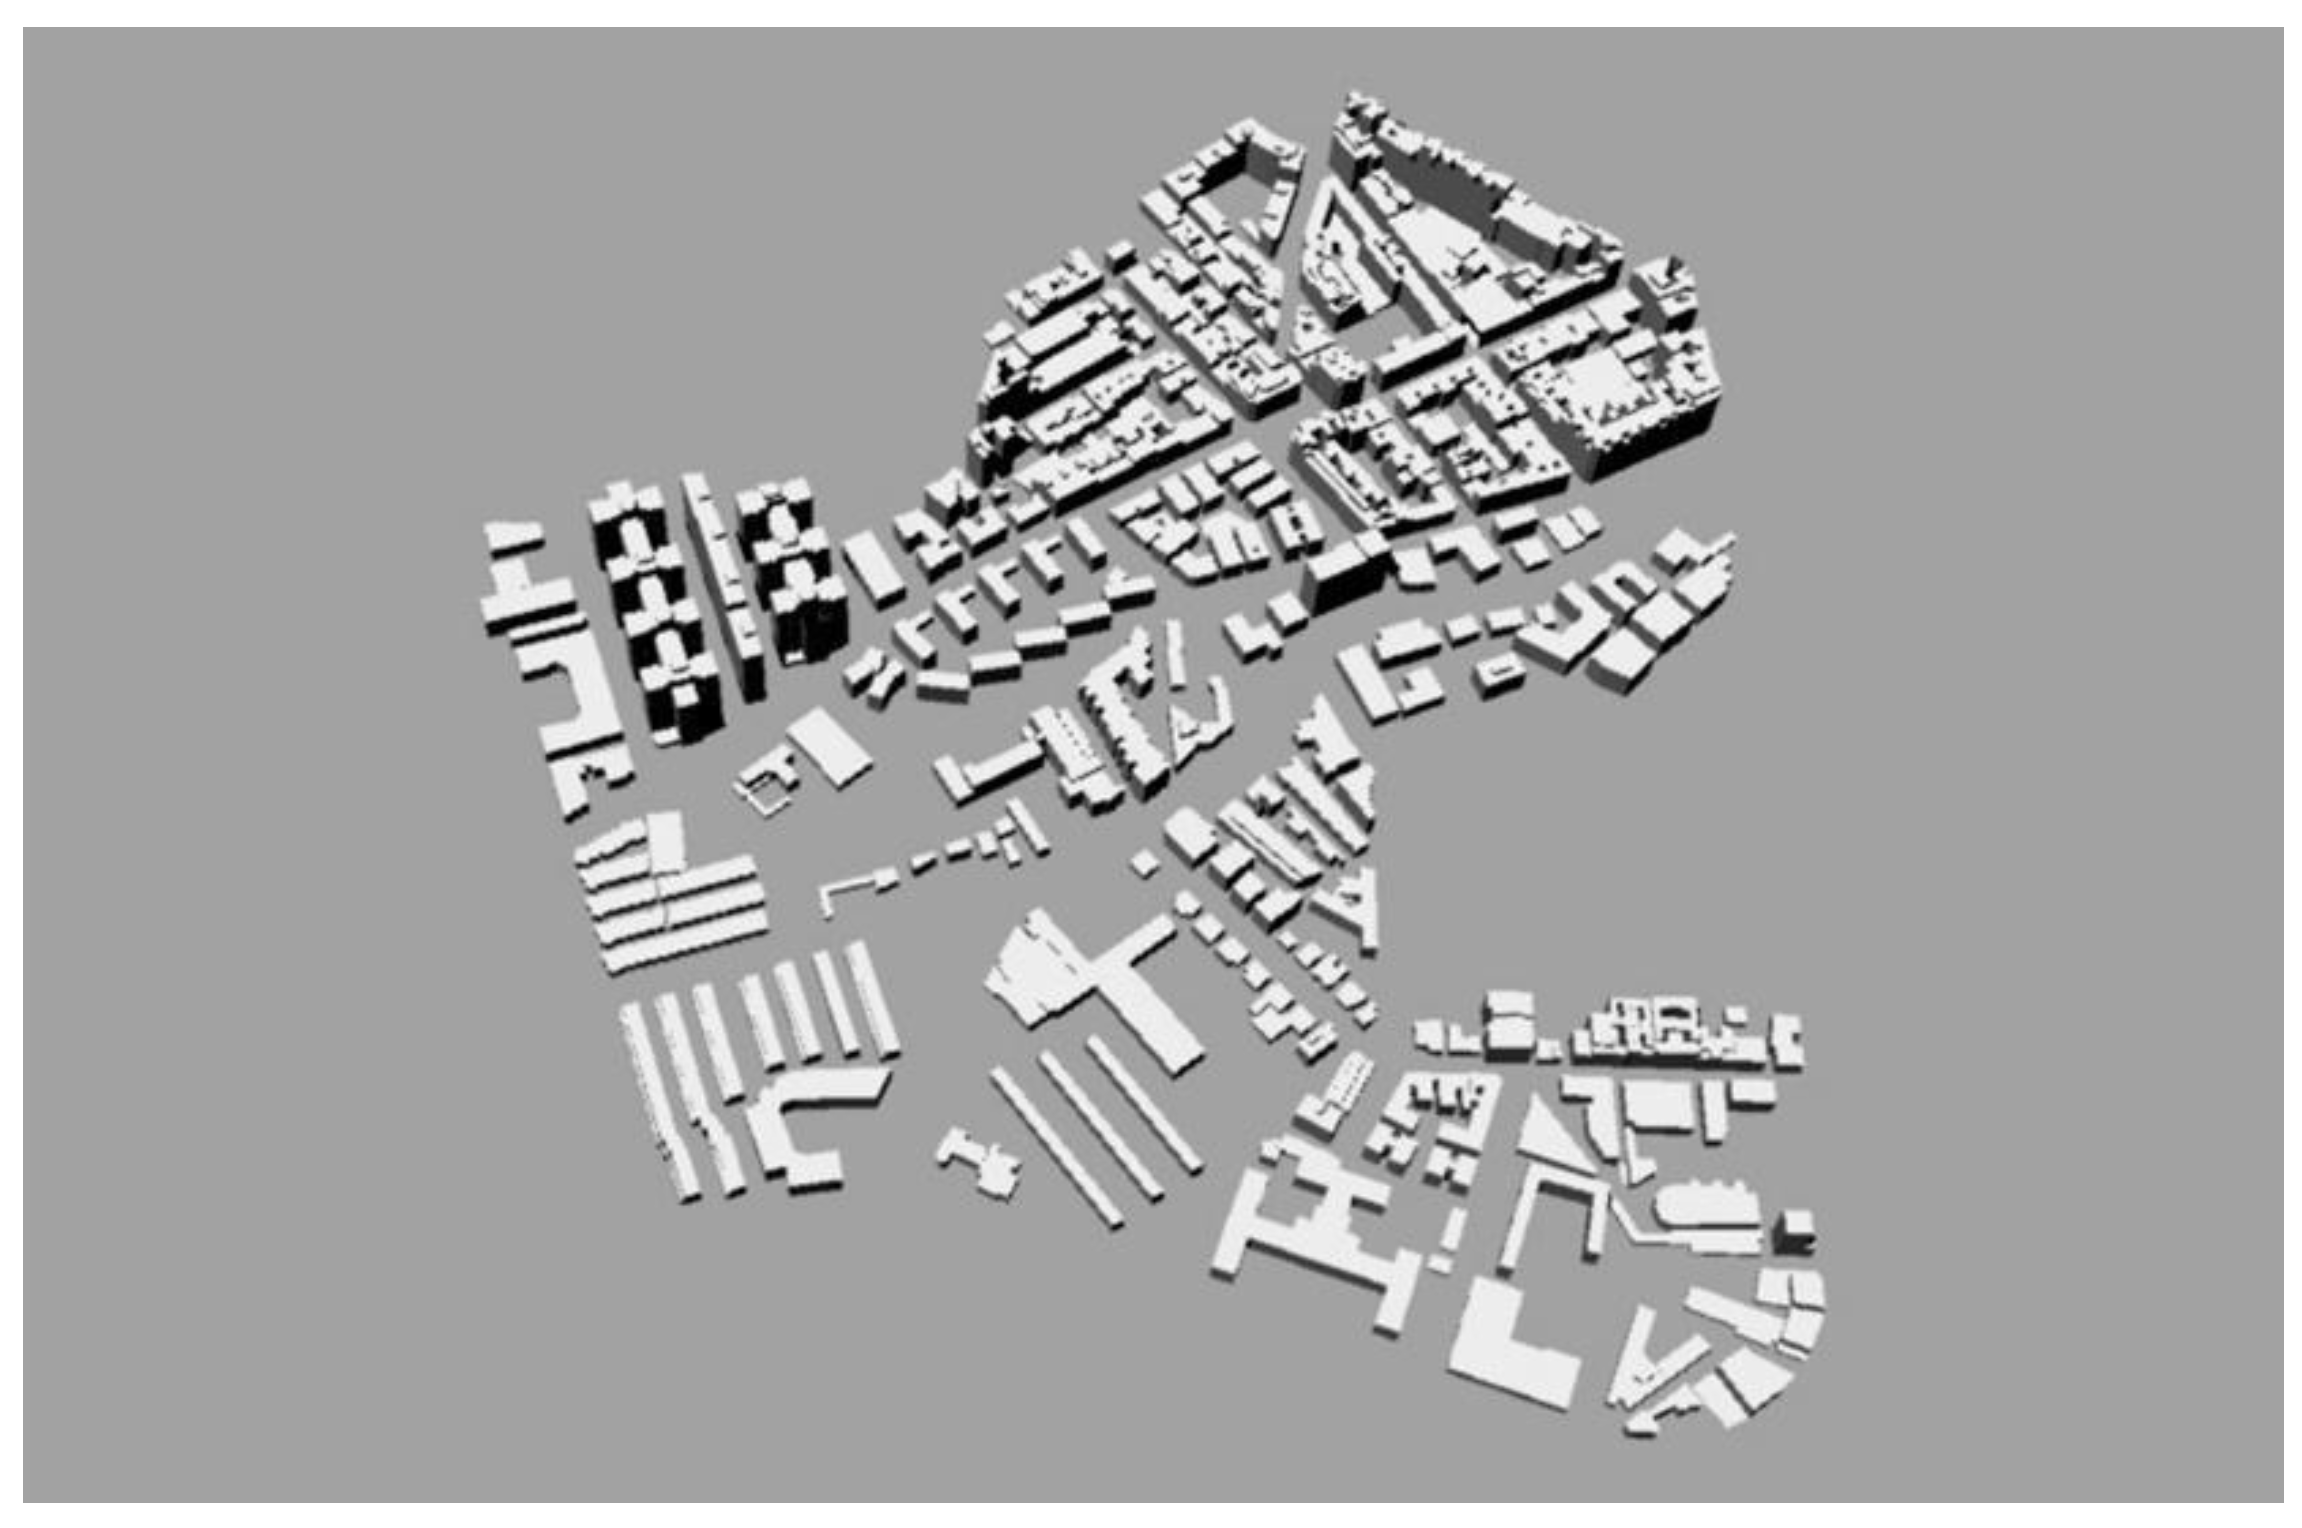
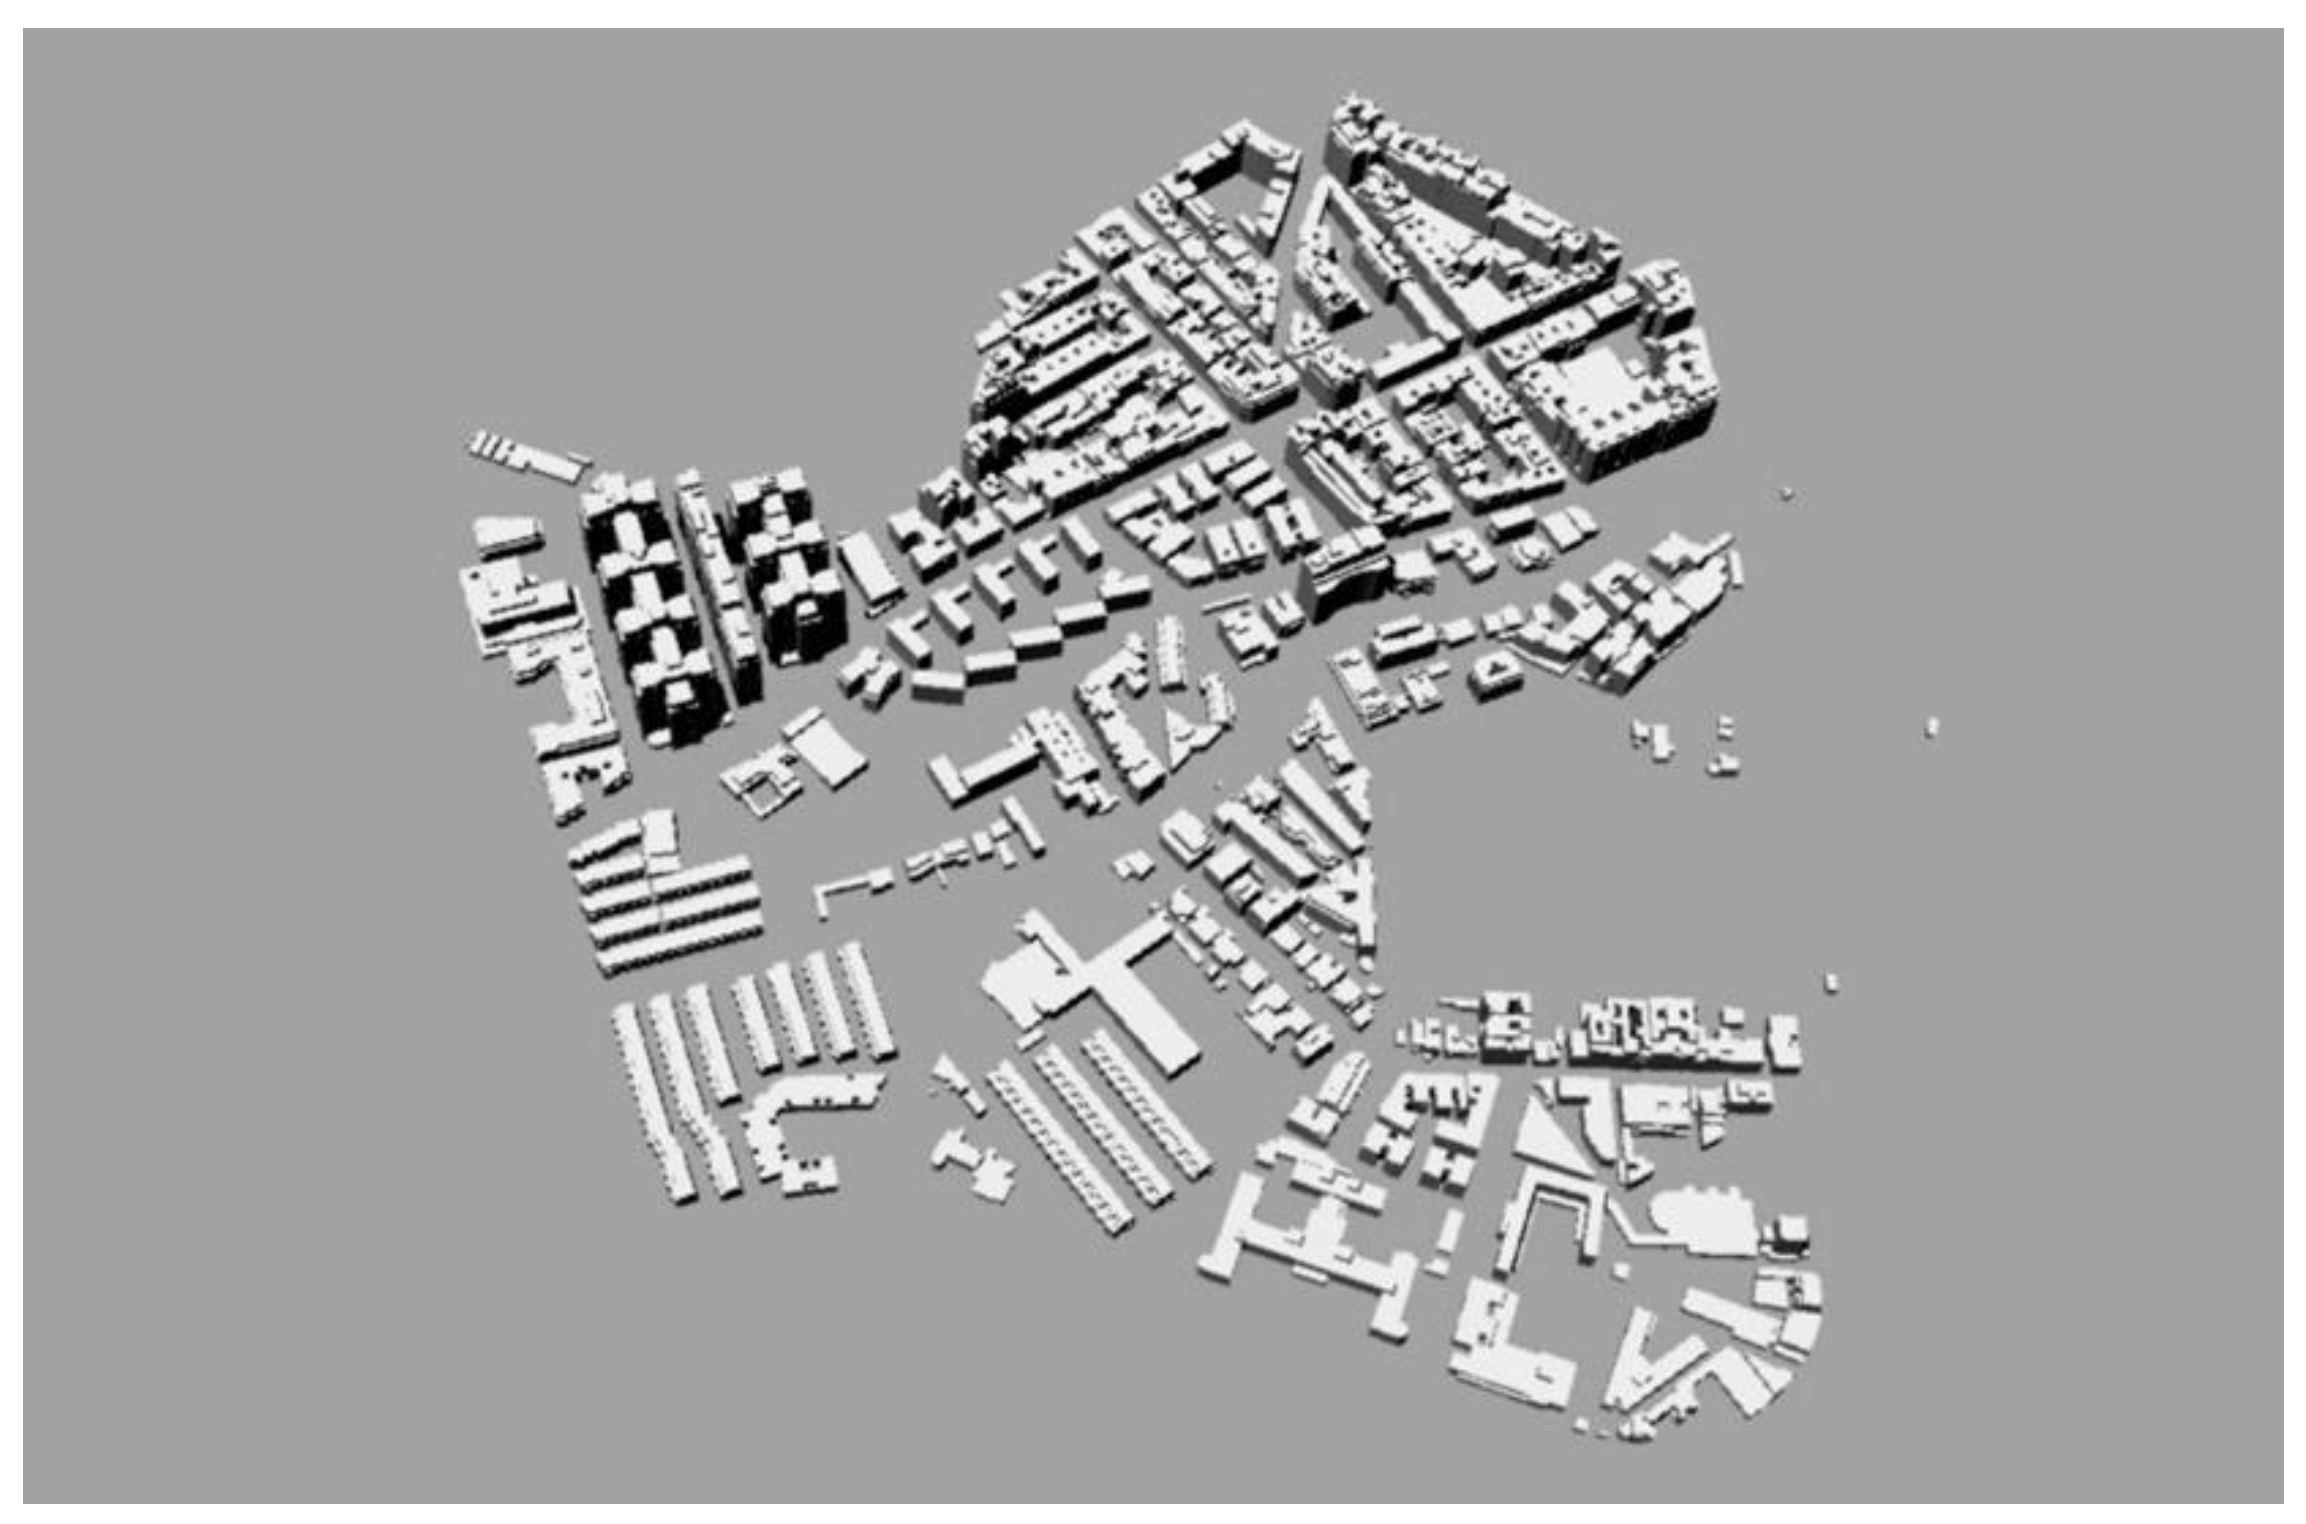
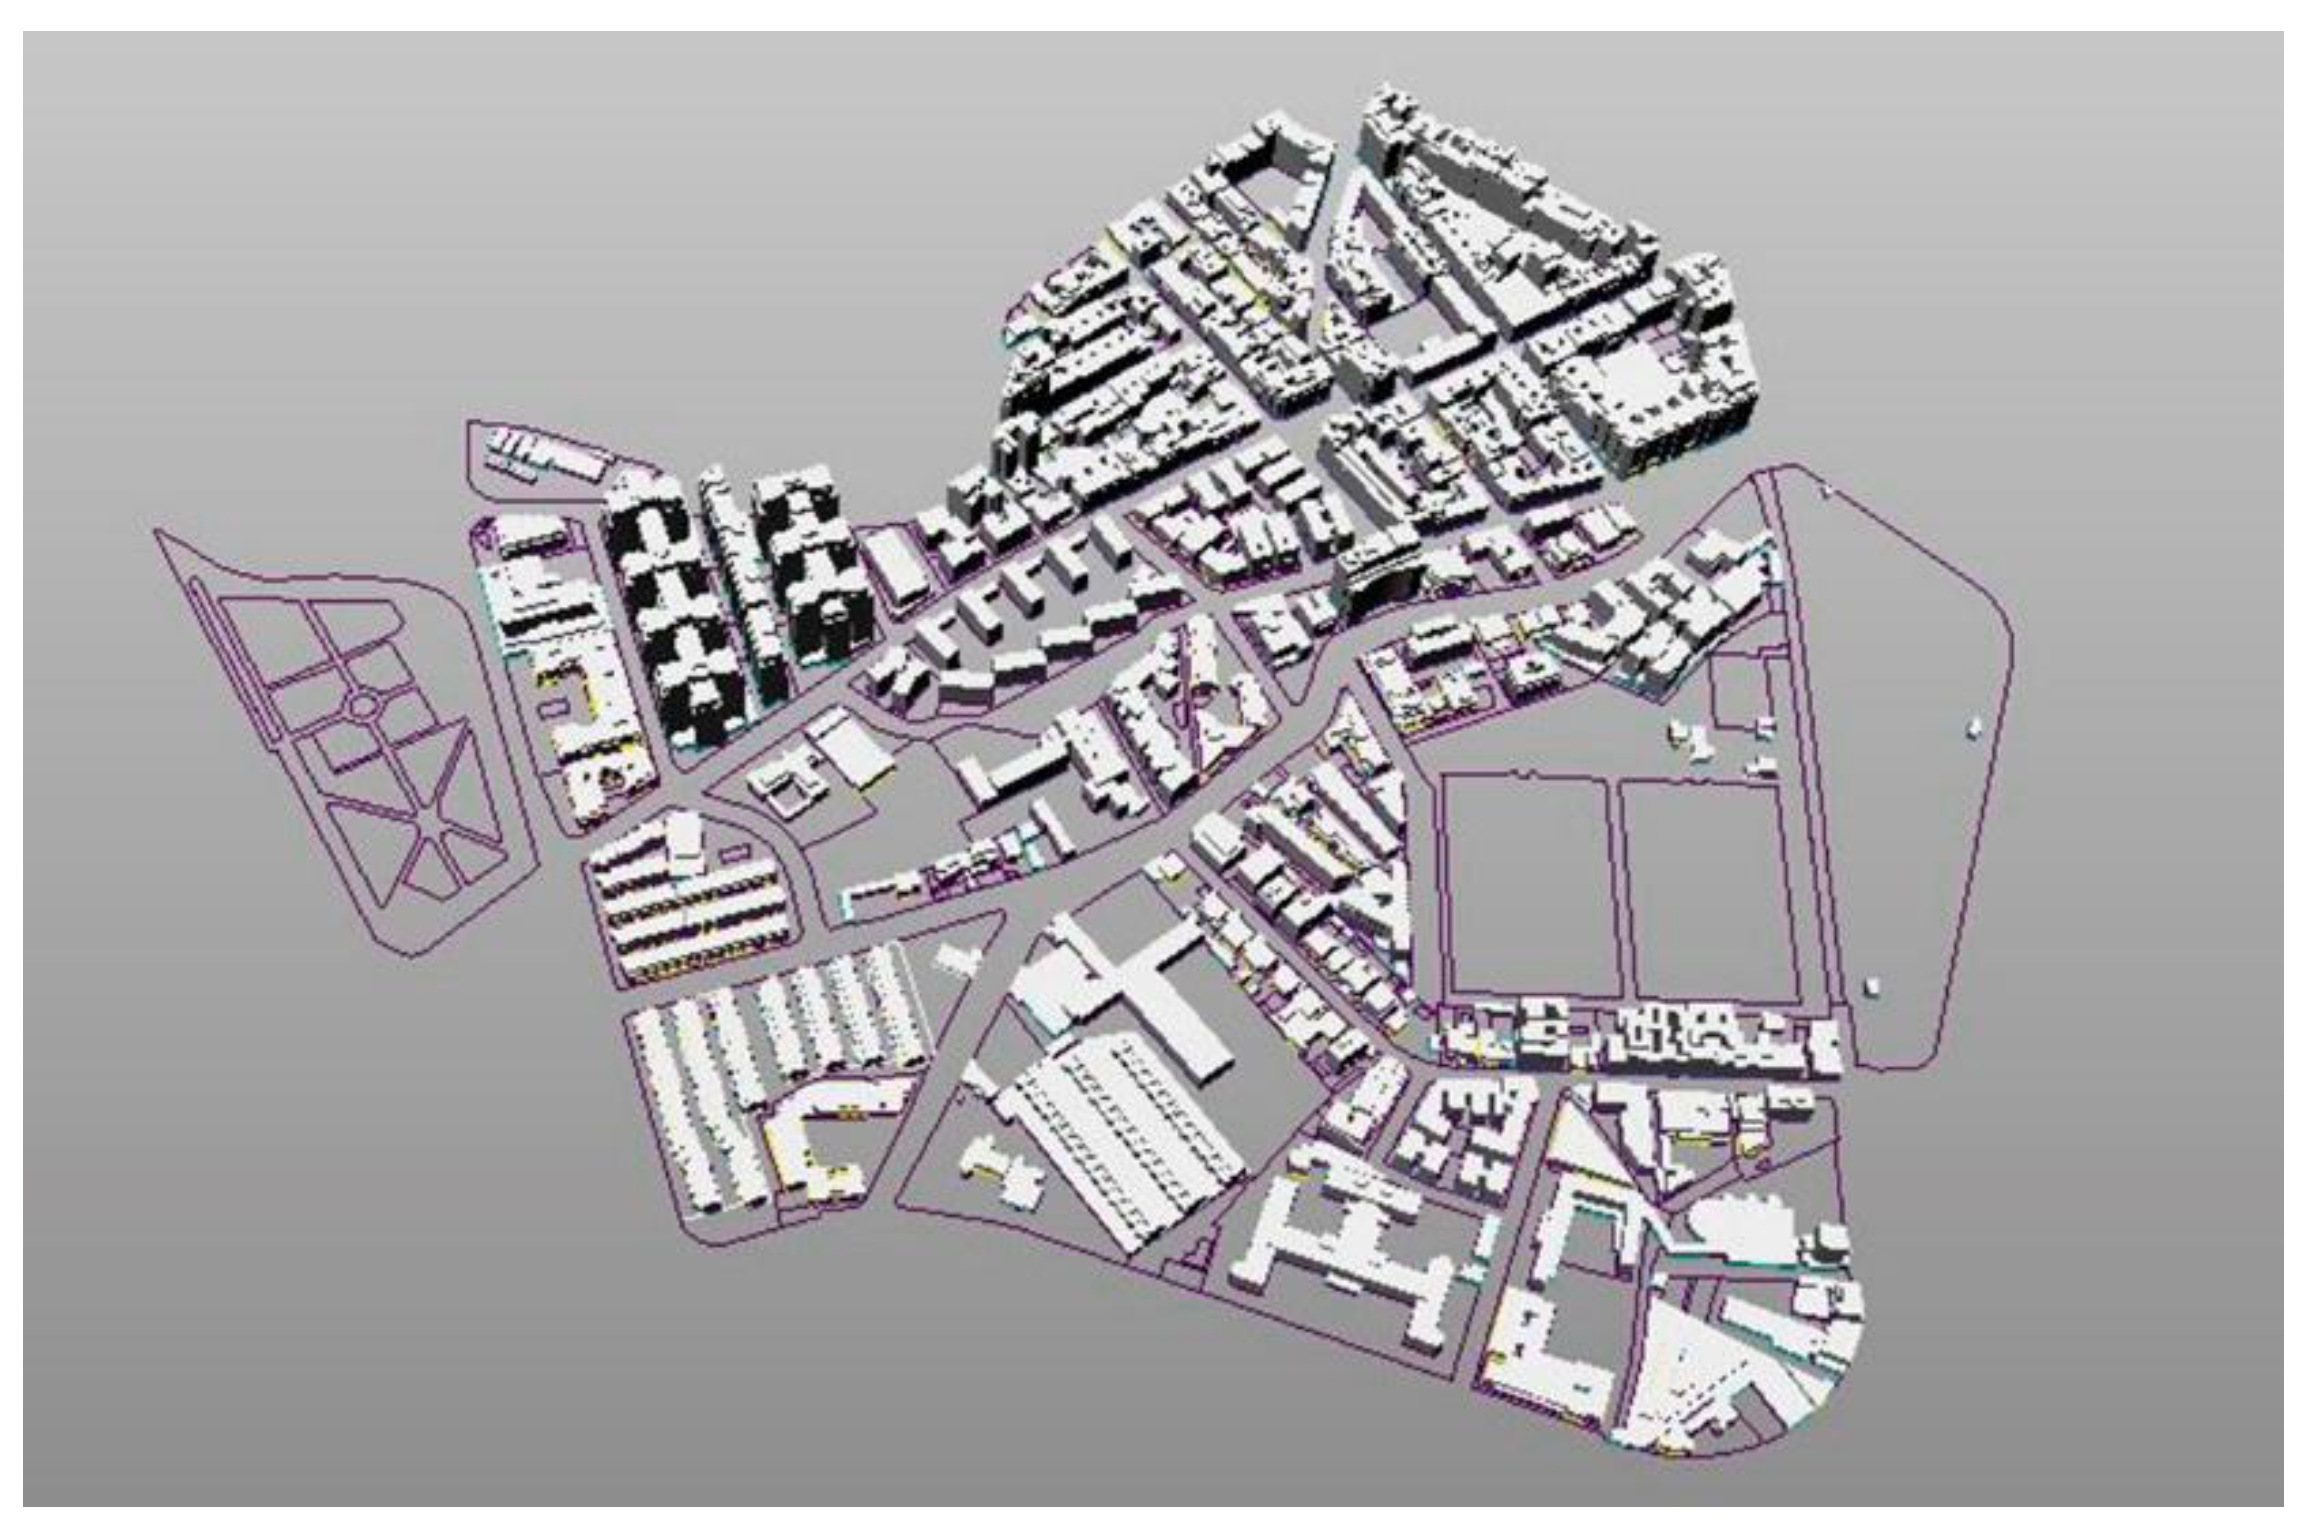
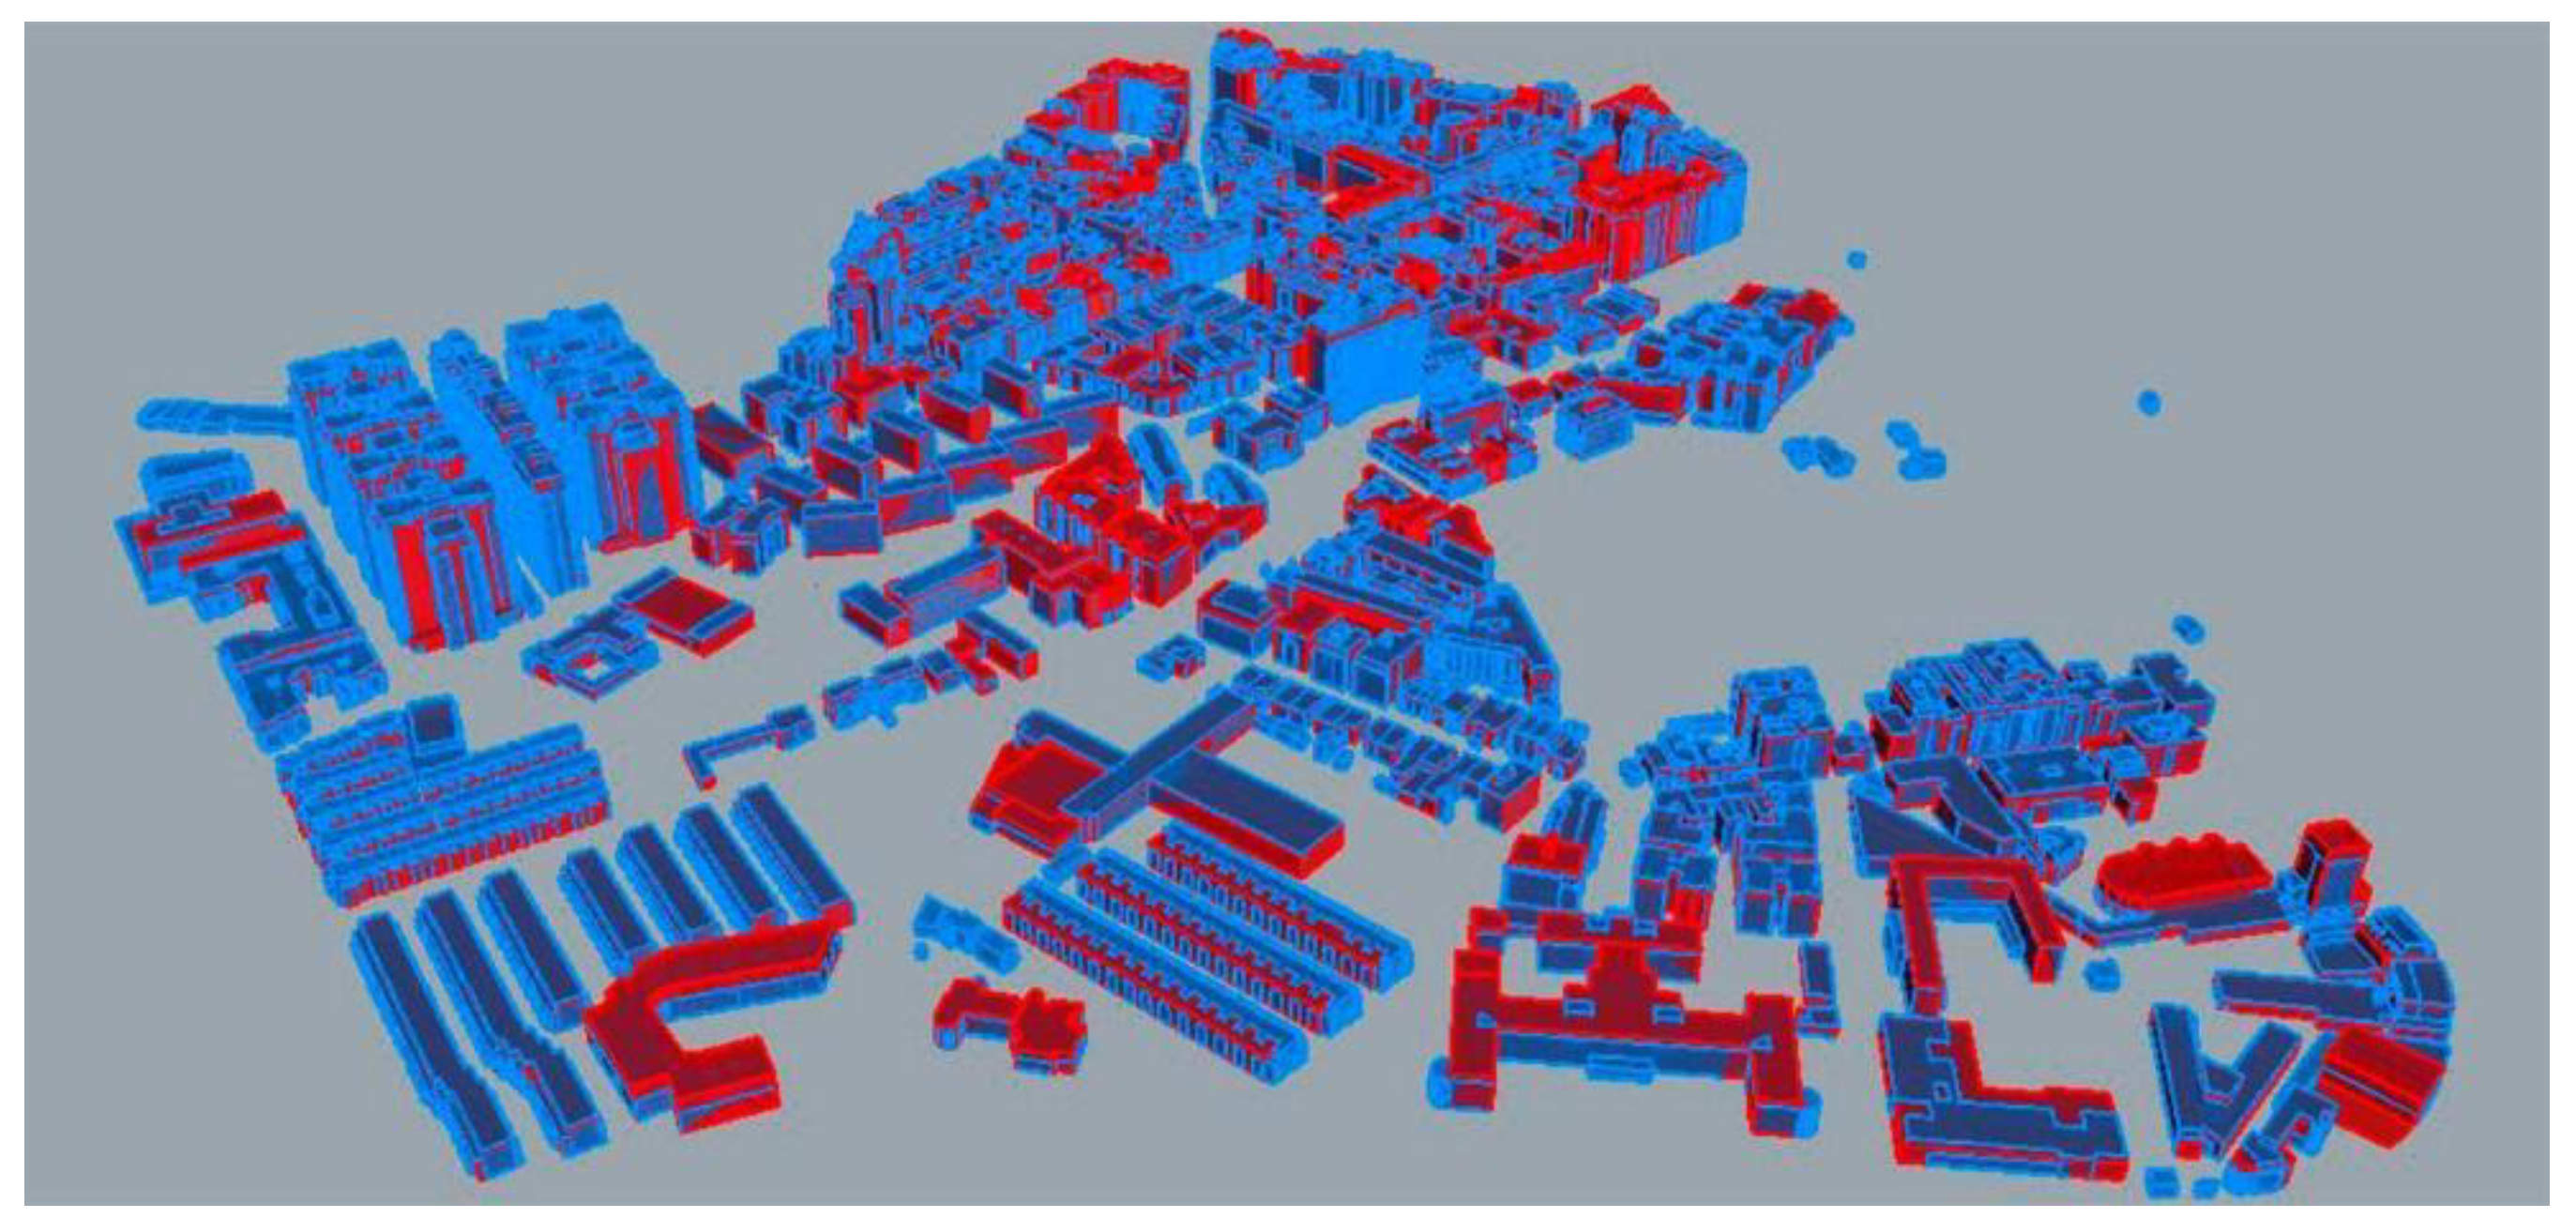
3.2. Comparison of the 3D Models

Figure 3, Figure 4 and Figure 5 show pictures of the 3D models of the Ruiseñores neighbourhood, which were hand-built (Figure 3), automatically built from regular cadaster data (Figure 4) and automatically built from INSPIRE cadaster data (Figure 5) following the methodology previously described. As can be seen, the automatically built models present a higher level of detail. This is because when representing the different volumes of the buildings manually the 3D volumes are simplified because it is a highly time demanding activity.
In the generation of the three models, one aspect is missing, the morphology of the terrain. This is due to the flatness of the neighborhood chosen as case study. In less flat neighborhoods this aspect should be further explored. Anyhow, it must be noted that, in general, Zaragoza is a quite flat city, without great differences in the terrain heights.
In order to compare the 3D models in more detail they were overlapped in Rhinoceros, version 5. Figure 6 displays the overlapping of the automatic model from regular cadaster data (in blue) and the hand-built model (in red).
On some few occasions, the information in the regular and INSPIRE cadaster does not fit with reality. This is the case, for example, of the San Juan de Dios hospital. According to the regular and INSPIRE cadaster the main body of this building has three stores, but according to the Google earth image (Figure 7) it has four. These inconsistencies can also occur when cadaster data are not fully updated. Figure 8, for example, displays a case where regular and INSPIRE cadaster data does not show the demolition of some buildings. In this part of the neighborhood, the hand-built model and the cadaster automatic models are different.
On other occasions, the differences are due to the presence of pitched and singular roofs. In the automatic models, the height of the building depends on the number of floors according to the cadastral data, independently of the roof shape. In the hand-built model, the height of the building is the highest point of the roof. As an example, Figure 9 shows a building with a pitched roof that was modelled in different ways: the hand-built model considers a height of 12 m and the automatic model considers a height of 7 m. This big difference is due simultaneously to the pitched roof and to an incorrect number of floors in the cadaster data.
Figure 10 displays the overlapping of the automatic model from INSPIRE cadaster data (in blue) and the hand-built model (in red). The INSPIRE model is very similar to the regular cadaster one. Just a few differences in heights were found (of one floor higher in INSPIRE), being the regular cadaster data closer to reality. Additionally, in the INSPIRE model two small empty plots got extruded as if there were buildings, what did not happen in the model from regular cadaster data.
Noteworthy is the fact that the 3D model from INSPIRE cadaster data is generated in a more comfortable and easy way, having the information already included in QGIS plug-ins, so that the creation of the automatic model is further accelerated.
The differences between the regular cadaster data and the INSPIRE cadaster data are due to the fact that the cadaster is permanently updated and the INSPIRE cadaster updates its data from the General Directorate of Cadaster every six months. However, the two automatically built 3D models were found to be so similar to each other with regard to volumes (just 1% of the buildings present differences) that the comparison regarding solar analysis results was decided just to be made between the hand-built model and one of the automatically built models, the one built from cadaster data because it is more up to date.

3.3. Comparison of Solar Analysis Results

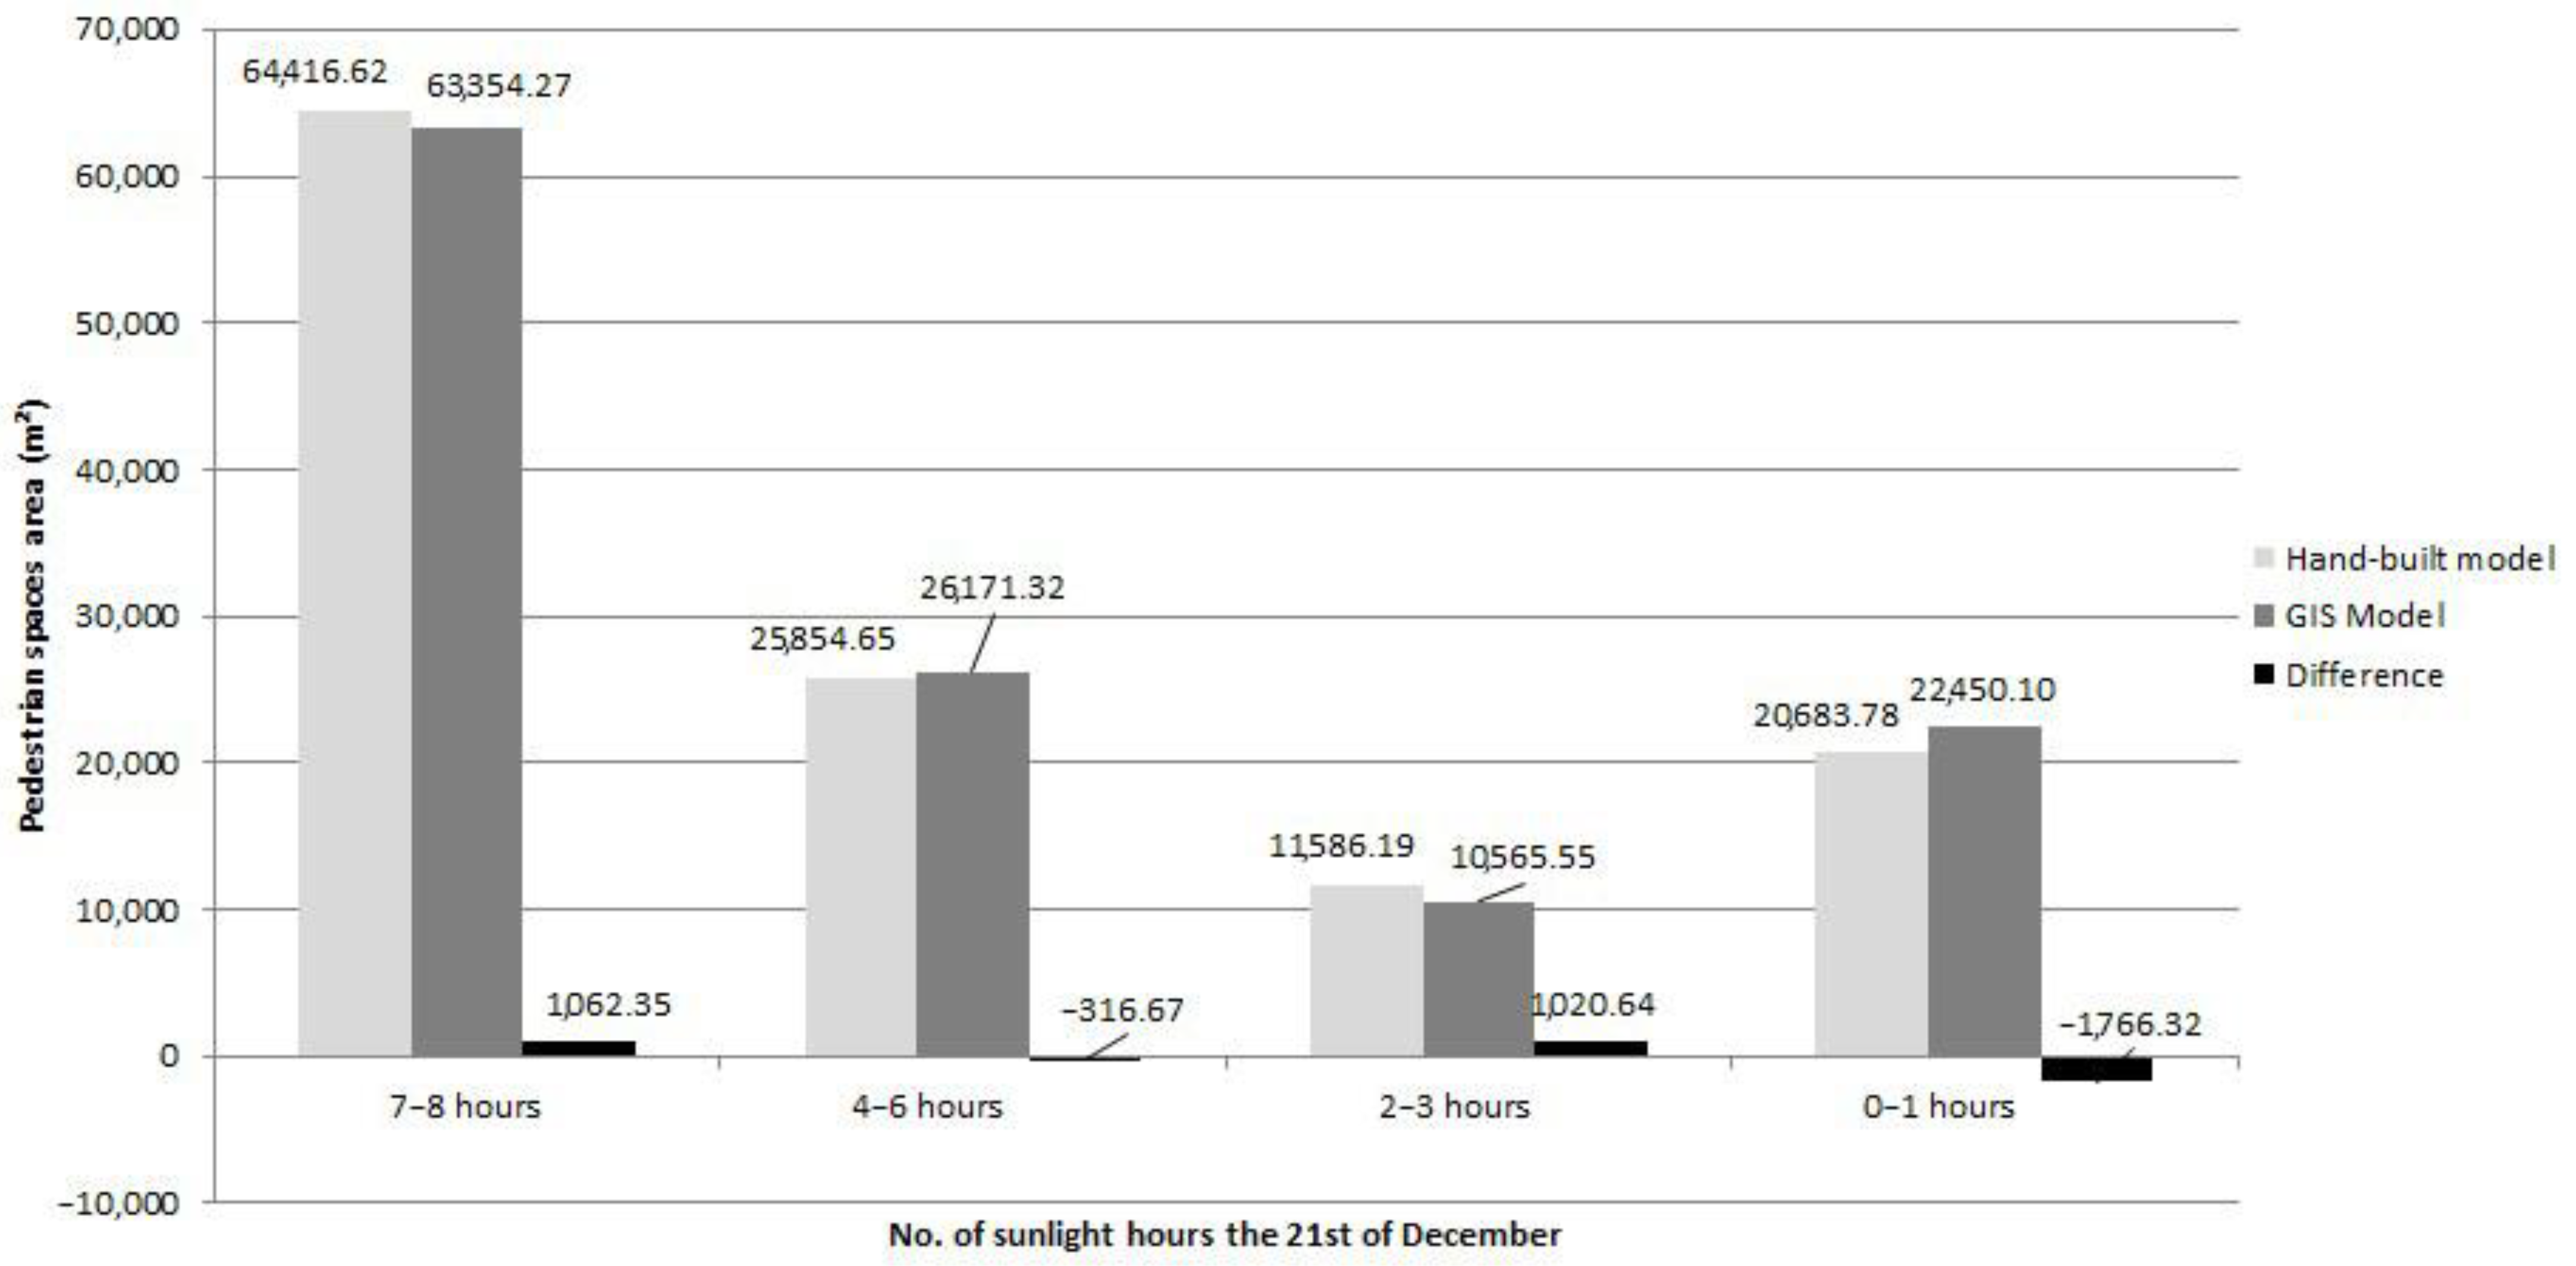
3.3.1. Solar Access on Pedestrian Spaces

Figure 11 shows the number of sunlight hours the 21 December on pedestrian areas of the Ruiseñores neighborhood in Zaragoza, calculated with Ecotect Analysis 2011. As can be seen, the differences in the models are slight and they are mainly manifested in an open area on the right, where small existing buildings had not been represented in the manual model for simplification.
In the rest of pedestrian spaces, we observed a quite similar distinction between zones. Figure 12 displays a numerical comparison between the two models, with an overall difference smaller than 3.4%. This difference is considered sufficiently small to validate the automatically built model from cadaster data for solar access on pedestrian spaces.

3.3.2. Solar Potential on Rooftops

Figure 13 shows the average daily value of incident solar radiation during the whole year on the roofs of the Ruiseñores neighborhood of Zaragoza using the hand-built 3D model and the automatically model from regular cadaster data, calculated with Ecotect Analysis 2011.
As can be seen, there are some differences between the estimated incident solar radiation on rooftops. When analyzing them numerically and block by block according to the distribution of Figure 14, we observe that the highest differences are found in blocks 13, 3, 7, 21, and 22, with a value of 8.7%, 8.3%, 7.96%, 5.7%, and 5.2%, respectively, and the remaining 21 blocks present a difference, positive or negative, below 5%, ranging from 0.0% to 4.3% (Figure 15). The mean value for the average solar radiation on the rooftops of Ruiseñores according to the hand-built model is 3788 Wh/m² and according to the cadaster model it is 3704 Wh/m², i.e., there is an overall difference of 2.2%. This difference is considered sufficiently small to validate the automatically built model for solar potential analysis on rooftops.

3.4. Time-Consumption Comparison

The time saving with the automatically built models is very remarkable, reducing for this neighborhood the time required by 25 times with the model built from regular cadaster data and by 50 times with the model built from INSPIRE cadaster data (Table 4). Presumably, the larger the model the greater the time savings will be.
It is important to highlight that the automatically built model from regular cadaster data is slower than the INSPIRE model because roman numerals expressing number of floors have to be converted into height of buildings in meters. For this neighborhood, the INSPIRE cadaster model takes half the time than the regular cadaster one. Presumably, the larger the model, the greater the time difference between the construction of these two automatic models. Although by means of using databases this problem can be sorted out, it is a clear disadvantage compared to the information in INSPIRE. The automatically built model from INSPIRE cadaster data represents the fastest method, giving a model in half the time for our neighborhood and with very similar precision, without having height conversions and without presenting any problem for large scales beyond increasing the time needed for the algorithm.

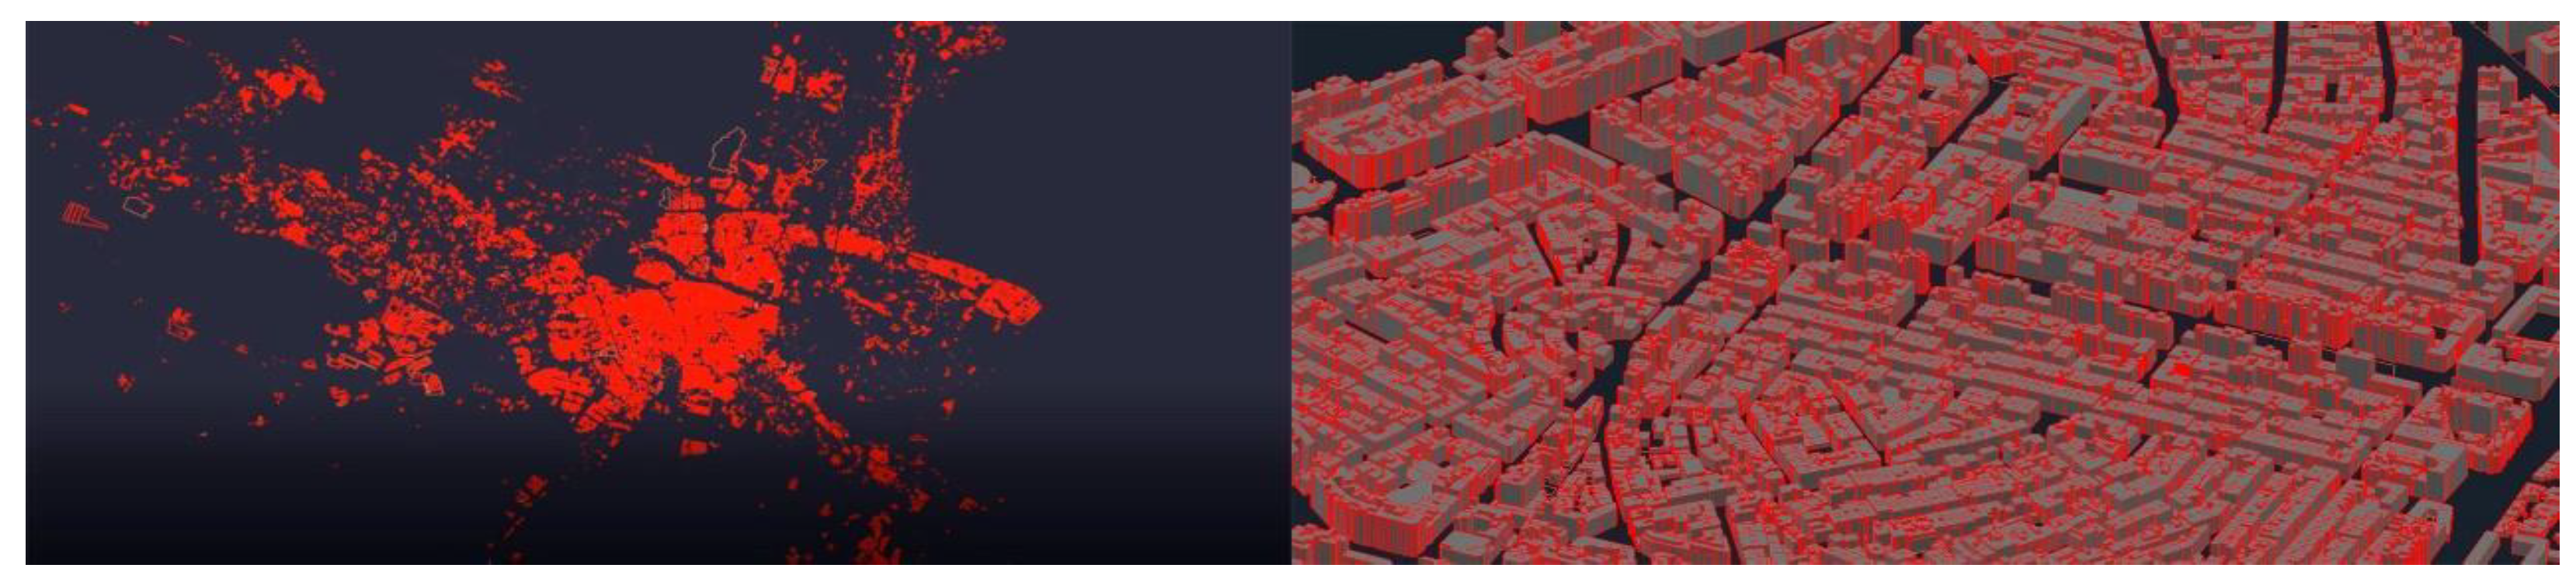
3.5. Automated Construction of a 3D Model of a Whole City

In order to test the algorithm, a whole city was generated to see the results and the time consumption. Table 5 displays the time required to build the models for the city of Zaragoza.
As can be seen by comparing Table 4 and Table 5, the larger the model, the greater the time to convert the roman numerals into building heights and resolve the combinations.
The images in Figure 16 were built from INSPIRE cadaster data, with the plug-in “Spanish Inspire Cadastral Downloader” and generated using the same workflow as already described for the 3D model of the Ruiseñores neighborhood automatically built from INSPIRE cadaster data.
The INSPIRE approach generates in a very fast way models of a wide extension. With this methodology we can create city models of complete cities in Spain, except for the cities of the Navarra and País Vasco regions, which has their own INSPIRE cadaster. The methodology should vary in these cases as well as in other European countries to adapt it to the information provided by each INSPIRE cadaster.

4. Conclusions

This work presents a new method to obtain 3D city models automatically built from public GIS-based cadaster data (from the regular cadaster in Spain) and GIS-based INSPIRE cadaster data (from the Spanish INSPIRE cadaster). These types of data are readily available from governments of the European Community. The method makes use of an algorithm, the “3D_Model” algorithm, programmed by the authors in AutoLISP, for use in AutoCAD. The usefulness for solar analysis of these two automatically built models was proven with just one of them, the regular cadaster one, because they were found to be very similar to each other, with just 1% of the buildings presenting volumetric differences. The usefulness for solar analysis was proven by comparing the regular cadaster model with a hand-built model. The comparison was done in terms of solar access on roofs and pedestrian spaces, and in terms of time consumption for the case study of a neighborhood named Ruiseñores in the city of Zaragoza, Spain. Then, the proposed method to build 3D models from regular cadaster data and INSPIRE cadaster data was used to build the entire city of Zaragoza to study the time-consumption.
After these analyses, we conclude that the proposed method is useful for solar analysis of cities, presenting the following advantages:
  • The proposed method allows to build 3D models of entire cities or large land extensions at a reduced time that depends on the extension of land to build:
    The time to automatically build a 3D model of a neighborhood that occupies around 400,000 m2, with respect to a hand-built model, was found to be 25 times faster with the model built from regular cadaster data and 50 times faster with INSPIRE cadaster data. Specifically, the model from regular cadaster data was built in approximately 1 h, and the model from INSPIRE cadaster data in half an hour.
    A 3D model of an entire city of 967 km2, accommodating a population of 681,877 people, was built in 11 h from regular cadaster data and in 8.5 h from INSPIRE cadaster data.
  • The resulting 3D models allow solar analysis with specific software tools, such as Ecotect Analysis 2011, in order to study solar potential of rooftops or solar access analysis on pedestrian areas, considering the shading effects of buildings. The results applied to a neighborhood of the city of Zaragoza (Spain) show an accuracy close to a hand-built model directly generated in Ecotect Analysis 2011:
    The overall difference between the automatic model from regular cadaster data and the hand-built model regarding the sunlight hours on pedestrian spaces obtained for the 21 December is lower than 3.4%.
    The overall difference between the automatic model from regular cadaster data and the hand-built model regarding the average solar radiation on the rooftops of the whole neighborhood is lower than 2.2%.
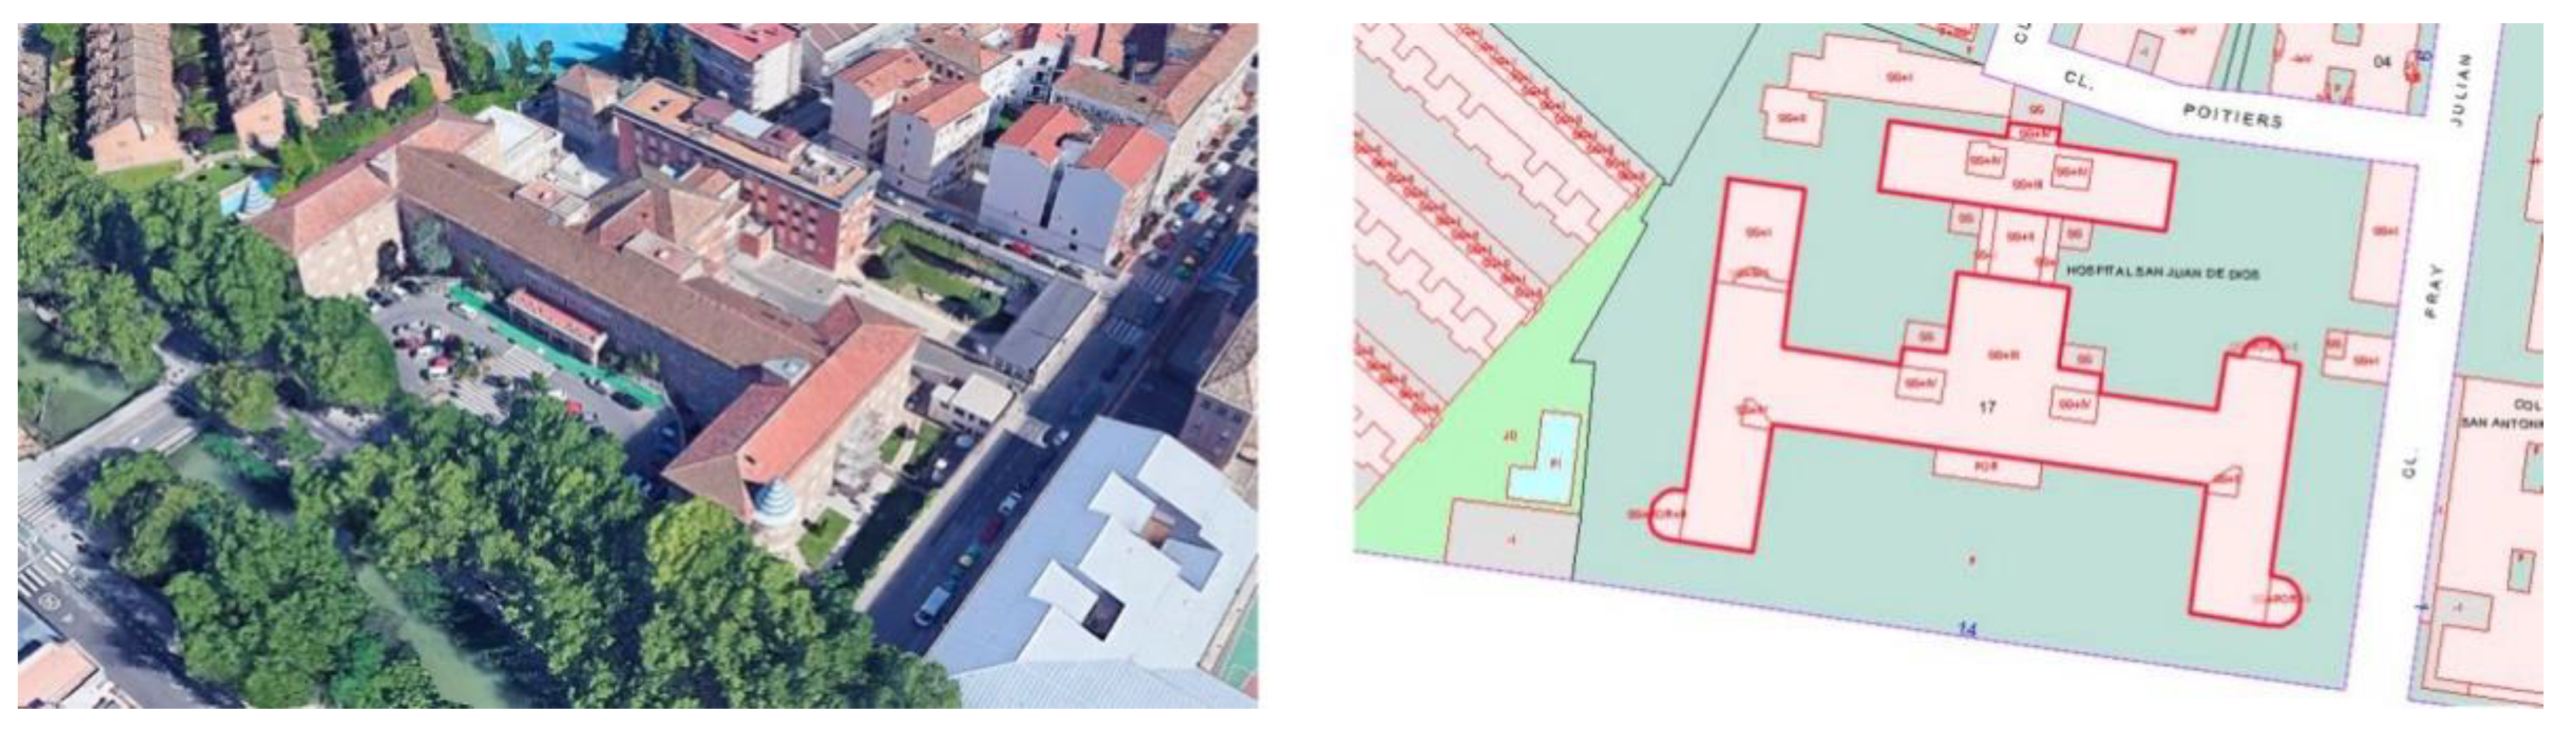
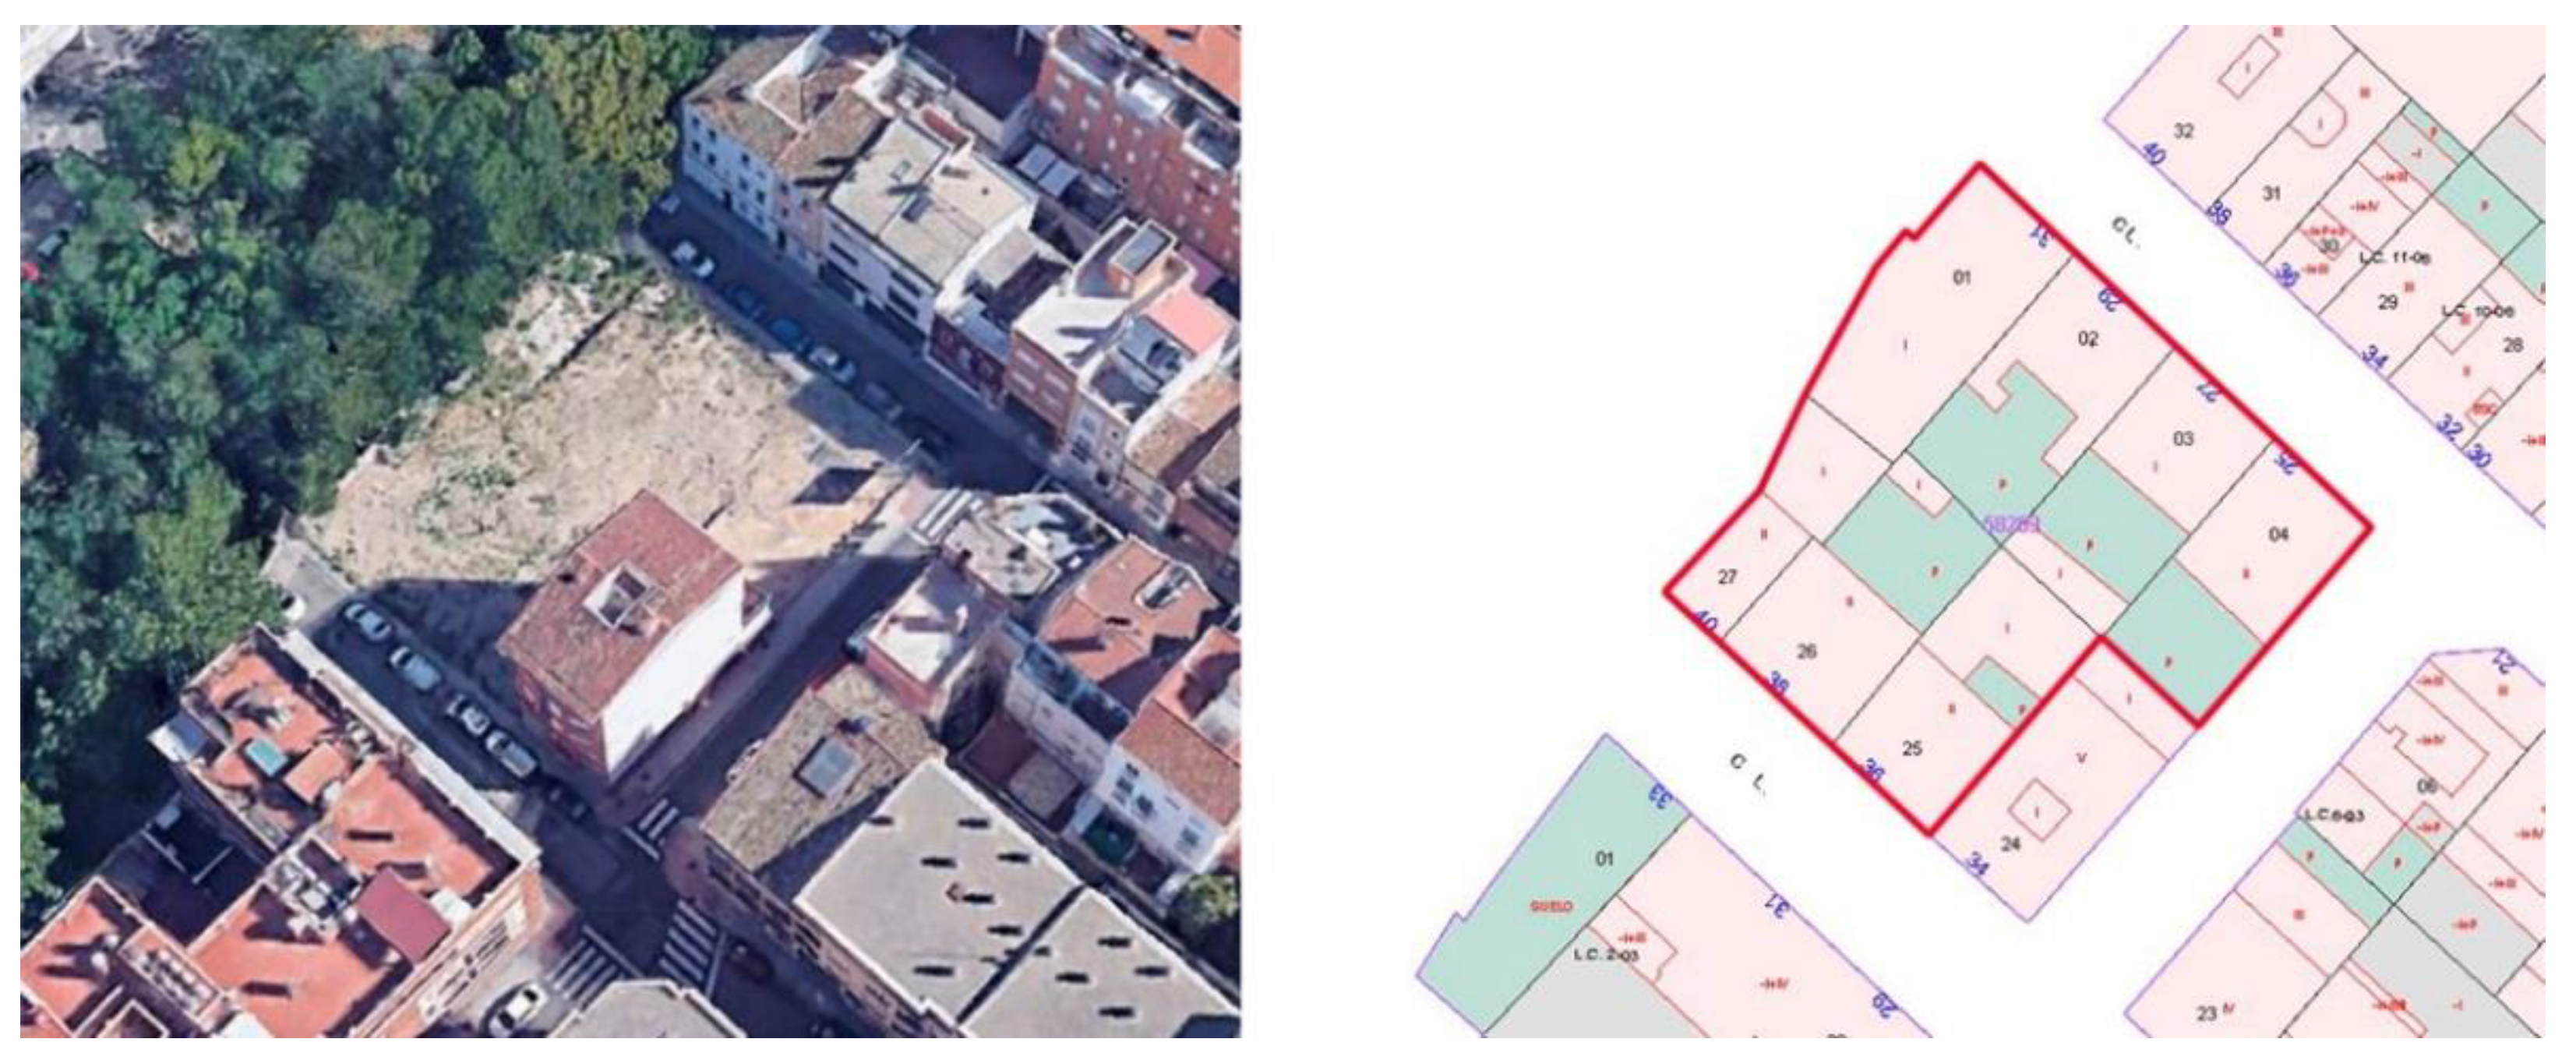
  • These small differences show that even if the cadastral data are not always fully updated, and no differences are considered between different types of buildings (such as between residential and hospital) and their different heights, the results are sufficiently accurate.
  • The proposed method makes use of open source and official data, which is periodically updated. It does not require any DSM.
  • The cadastral source of data will make possible to link the results to other building characteristics.
  • The 3D model will be exportable to the main 3D modelling formats (such as 3ds, 3dm or fbx), what will make it possible to use it with different software tools for other multiple purposes, which are not explored in this paper.
  • The method proposed requires software tools that are easily available: QGIS, which is a free open source, and AutoCAD, the most common software in architecture. It does not require plug-ins in GIS software.
  • The proposed algorithm is accessible to the research community for free.
  • The method proposed presents several limitations that should also be mentioned:
  • The city rooftops are simplified, considering all roofs as flat.
  • The unevenness of the terrain is not considered, which does other approaches as those that use LiDAR.
  • This method does not consider the shading effect of trees.
According to these advantages and limitations, we recommend the use of this method for the evaluation of solar access in pedestrian areas and solar potential of rooftops in neighborhoods and cities where the effects of trees and unevenness of the terrain is not significative, and where most of the roofs are flat, as is the case in some Mediterranean countries [61]. Future research should include how to improve the model in order to consider the effect of the unevenness of the terrain and a greater presence of sloping roofs.

Author Contributions

Conceptualization, B.L.-M.; methodology, C.B.-V., M.M.-C. and B.L.-M.; software, C.B.-V.; validation, C.B.-V., M.M.-C. and B.L.-M.; formal analysis, C.B.-V., M.M.-C. and B.L.-M.; investigation, C.B.-V. and M.M.-C.; resources, C.B.-V., M.M.-C. and B.L.-M.; data curation, C.B.-V. and M.M.-C.; writing—original draft preparation, C.B.-V., M.M.-C. and B.L.-M.; writing—review and editing, M.M.-C. and B.L.-M.; visualization, C.B.-V. and B.L.-M.; supervision, B.L.-M.; project administration, M.M.-C. and B.L.-M.; funding acquisition, B.L.-M. All authors have read and agreed to the published version of the manuscript.

Funding

This work was supported by the Ministry of Science and Innovation of Spain [grant numbers PID2019-104871RB-C21].

Institutional Review Board Statement

Not applicable.

Informed Consent Statement

Not applicable.

Data Availability Statement

The algorithm file in .lsp format, the code in open source, tutorials and examples of its use will be available in its GitHub repository (https://github.com/CarlosBeltranVelamazan/3D_model_from_2D-GIS-cadastre, accessed on 26 May 2021).

Acknowledgments

We would like to thank Alberto Sabater for his advice on Python programming.

Conflicts of Interest

The authors declare no conflict of interest.

Glossary

2Dtwo-dimensional
3Dthree-dimensional
BIPVbuilding integrated photovoltaics
DSMdigital surface model
GISgeographical information system
INSPIREInfrastructure for Spatial Information in Europe
LiDARlight detection and ranging
OPSOpenStreetMap
PVphotovoltaic
SDIspatial data infrastructure
STCsolar thermal collectors
nZEBnearly zero energy buildings

References

  1. United Nations. The Sustainable Development Goals. Available online: https://www.un.org/development/desa/disabilities/envision2030.html (accessed on 15 October 2020).
  2. Happle, G.; Shi, Z.; Hsieh, S.; Ong, B.; Fonseca, J.A.; Schlueter, A. Identifying carbon emission reduction potentials of BIPV in high-density cities in Southeast Asia. J. Phys. Conf. Ser. 2019, 1343. [Google Scholar] [CrossRef]
  3. López-Mesa, B.; Monzón-Chavarrías, M.; Espinosa-Fernández, A. Energy retrofit of social housing with cultural value in Spain: Analysis of strategies conserving the original image vs. coordinating its modification. Sustainability 2020, 12, 5579. [Google Scholar] [CrossRef]
  4. Mohajeri, N.; Upadhyay, G.; Gudmundsson, A.; Assouline, D.; Kämpf, J.; Scartezzini, J.L. Effects of urban compactness on solar energy potential. Renew. Energy 2016, 93, 469–482. [Google Scholar] [CrossRef] [Green Version]
  5. Wiginton, L.K.; Nguyen, H.T.; Pearce, J.M. Quantifying rooftop solar photovoltaic potential for regional renewable energy policy. Comput. Environ. Urban Syst. 2010, 34, 345–357. [Google Scholar] [CrossRef] [Green Version]
  6. Ali-Toudert, F.; Mayer, H. Numerical study on the effects of aspect ratio and orientation of an urban street canyon on outdoor thermal comfort in hot and dry climate. Build. Environ. 2006, 41, 94–108. [Google Scholar] [CrossRef]
  7. Arnfield, A.J. Street design and urban canyon solar access. Energy Build. 1990, 14, 117–131. [Google Scholar] [CrossRef]
  8. Chatzipoulka, C.; Compagnon, R.; Nikolopoulou, M. Urban geometry and solar availability on façades and ground of real urban forms: Using London as a case study. Sol. Energy 2016, 138, 53–66. [Google Scholar] [CrossRef] [Green Version]
  9. Zhu, R.; You, L.; Santi, P.; Wong, M.S.; Ratti, C. Solar accessibility in developing cities: A case study in Kowloon East, Hong Kong. Sustain. Cities Soc. 2019, 51, 101738. [Google Scholar] [CrossRef]
  10. Olsen, H.; Kennedy, E.; Vanos, J. Shade provision in public playgrounds for thermal safety and sun protection: A case study across 100 play spaces in the United States. Landsc. Urban Plan. 2019, 189, 200–211. [Google Scholar] [CrossRef]
  11. Agencia de Ecología Urbana de Barcelona. Sistema de Indicadores y Condicionantes para Ciudades Grandes y Medianas. 2011. Available online: https://www.mitma.gob.es/recursos_mfom/pdf/3093A86A-128B-4F4D-8800-BE9A76D1D264/111504/INDI_CIU_G_Y_M_tcm7177731.pdf (accessed on 15 October 2020).
  12. Martins, T.A.L.; Adolphe, L.; Bonhomme, M.; Bonneaud, F.; Faraut, S.; Ginestet, S.; Michel, C.; Guyard, W. Impact of Urban Cool Island measures on outdoor climate and pedestrian comfort: Simulations for a new district of Toulouse, France. Sustain. Cities Soc. 2016, 26, 9–26. [Google Scholar] [CrossRef]
  13. Taleai, M.; Taheri Amiri, E. Spatial multi-criteria and multi-scale evaluation of walkability potential at street segment level: A case study of tehran. Sustain. Cities Soc. 2017, 31, 37–50. [Google Scholar] [CrossRef]
  14. Mohajeri, N.; Gudmundsson, A.; Kunckler, T.; Upadhyay, G.; Assouline, D.; Kämpf, J.H.; Scartezzini, J.L. A solar-based sustainable urban design: The effects of city-scale street-canyon geometry on solar access in Geneva, Switzerland. Appl. Energy 2019, 240, 173–190. [Google Scholar] [CrossRef]
  15. Masoud, B.; Coch, H.; Beckers, B. The Correlation Between Urban Morphology Parameters and Incident Solar Radiation Performance to Enhance Pedestrian Comfort, Case Study Jeddah, Saudi Arabia. In Proceedings of the Sustainability in Energy and Buildings, Budapest, Hungary, 4–5 July 2019; Smart Innovation, Systems and Technologies Book Series; Littlewood, J., Howlett, R., Capozzoli, A.J.L., Eds.; Springer: Singapore, 2020; Volume 163, pp. 543–554. [Google Scholar]
  16. Shishegar, N. Street Design and Urban Microclimate: Analyzing the Effects of Street Geometry and Orientation on Airflowand Solar Access in Urban Canyons. J. Clean Energy Technol. 2013, 52–56. [Google Scholar] [CrossRef]
  17. Khanna, D. Estimate Solar Power Potential. Available online: https://learn.arcgis.com/es/projects/estimate-solar-power-potential/ (accessed on 15 October 2020).
  18. Romero Rodríguez, L.; Duminil, E.; Sánchez Ramos, J.; Eicker, U. Assessment of the photovoltaic potential at urban level based on 3D city models: A case study and new methodological approach. Sol. Energy 2017, 146, 264–275. [Google Scholar] [CrossRef]
  19. Hofierka, J.; Kaňuk, J. Assessment of photovoltaic potential in urban areas using open-source solar radiation tools. Renew. Energy 2009, 34, 2206–2214. [Google Scholar] [CrossRef]
  20. Zhang, Y.; Ren, J.; Pu, Y.; Wang, P. Solar energy potential assessment: A framework to integrate geographic, technological, and economic indices for a potential analysis. Renew. Energy 2020, 149, 577–586. [Google Scholar] [CrossRef]
  21. Borfecchia, F.; Caiaffa, E.; Pollino, M.; De Cecco, L.; Martini, S.; La Porta, L.; Marucci, A. Remote Sensing and GIS in planning photovoltaic potential of urban areas. Eur. J. Remote Sens. 2014, 47, 195–216. [Google Scholar] [CrossRef]
  22. Choi, Y.; Suh, J.; Kim, S.-M. GIS-Based Solar Radiation Mapping, Site Evaluation, and Potential Assessment: A Review. Appl. Sci. 2019, 9, 1960. [Google Scholar] [CrossRef] [Green Version]
  23. Walch, A.; Castello, R.; Mohajeri, N.; Scartezzini, J.-L. Big data mining for the estimation of hourly rooftop photovoltaic potential and its uncertainty. Appl. Energy 2020, 262, 114404. [Google Scholar] [CrossRef]
  24. Yousuf, M.U.; Siddiqui, M.; Rehman, N.U. Solar energy potential estimation by calculating sun illumination hours and sky view factor on building rooftops using digital elevation model. J. Renew. Sustain. Energy 2018, 10, 013703. [Google Scholar] [CrossRef]
  25. Brito, M.C.; Gomes, N.; Santos, T.; Tenedório, J.A. Photovoltaic potential in a Lisbon suburb using LiDAR data. Sol. Energy 2012, 86, 283–288. [Google Scholar] [CrossRef]
  26. Boz, M.B.; Calvert, K.; Brownson, J. An automated model for rooftop PV systems assessment in ArcGIS using LIDAR. AIMS Energy 2015, 3, 401–420. [Google Scholar] [CrossRef]
  27. Gagnon, P.; Margolis, R.; Melius, J.; Phillips, C.; Elmore, R. Estimating rooftop solar technical potential across the US using a combination of GIS-based methods, lidar data, and statistical modeling. Environ. Res. Lett. 2018, 13, 024027. [Google Scholar] [CrossRef]
  28. Martín-Jiménez, J.; Del Pozo, S.; Sánchez-Aparicio, M.; Lagüela, S. Multi-scale roof characterization from LiDAR data and aerial orthoimagery: Automatic computation of building photovoltaic capacity. Autom. Constr. 2020, 109, 102965. [Google Scholar] [CrossRef]
  29. Ninsawat, S.; Hossain, M. Identifying Potential Area and Financial Prospects of Rooftop Solar Photovoltaics (PV). Sustainability 2016, 8, 1068. [Google Scholar] [CrossRef] [Green Version]
  30. Cheng, L.; Zhang, F.; Li, S.; Mao, J.; Xu, H.; Ju, W.; Liu, X.; Wu, J.; Min, K.; Zhang, X.; et al. Solar energy potential of urban buildings in 10 cities of China. Energy 2020, 196, 117038. [Google Scholar] [CrossRef]
  31. Vartholomaios, A. A machine learning approach to modelling solar irradiation of urban and terrain 3D models. Comput. Environ. Urban Syst. 2019, 78, 101387. [Google Scholar] [CrossRef]
  32. Zhu, R.; Wong, M.S.; You, L.; Santi, P.; Nichol, J.; Ho, H.C.; Lu, L.; Ratti, C. The effect of urban morphology on the solar capacity of three-dimensional cities. Renew. Energy 2020, 153, 1111–1126. [Google Scholar] [CrossRef]
  33. Biljecki, F.; Ledoux, H.; Stoter, J. Generating 3D city models without elevation data. Comput. Environ. Urban Syst. 2017, 64, 1–18. [Google Scholar] [CrossRef] [Green Version]
  34. Park, Y.; Guldmann, J.-M. Creating 3D city models with building footprints and LIDAR point cloud classification: A machine learning approach. Comput. Environ. Urban Syst. 2019, 75, 76–89. [Google Scholar] [CrossRef]
  35. Bshouty, E.; Shafir, A.; Dalyot, S. Towards the generation of 3D OpenStreetMap building models from single contributed photographs. Comput. Environ. Urban Syst. 2020, 79, 101421. [Google Scholar] [CrossRef]
  36. Bremer, M.; Mayr, A.; Wichmann, V.; Schmidtner, K.; Rutzinger, M. A new multi-scale 3D-GIS-approach for the assessment and dissemination of solar income of digital city models. Comput. Environ. Urban Syst. 2016, 57, 144–154. [Google Scholar] [CrossRef]
  37. Wendel, J.; Murshed, S.M.; Sriramulu, A.; Nichersu, A. Development of a Web-Browser Based Interface for 3D Data—A Case Study of a Plug-In Free Approach for Visualizing Energy Modelling Results. In Progress in Cartography; Springer: Cham, Switzerland, 2016; ISBN 978-3-319-19601-5. [Google Scholar]
  38. Ayoub, M.; Elseragy, A. Parameterization of traditional domed-roofs insolation in hot-arid climates in Aswan, Egypt. Energy Environ. 2018, 29, 109–130. [Google Scholar] [CrossRef]
  39. Machete, R.; Falcão, A.P.; Gomes, M.G.; Moret Rodrigues, A. The use of 3D GIS to analyse the influence of urban context on buildings’ solar energy potential. Energy Build. 2018, 177, 290–302. [Google Scholar] [CrossRef]
  40. Monzón-Chavarrías, M.; Agustín-Hernández, L.; López-Mesa, B. La problemática del asoleo de los Conjuntos Urbanos de Interés. In Nuevos Enfoques en la Rehabilitación Energética de la Vivienda Hacia la Convergencia Europea. La Vivienda Social en Zaragoza, 1939–1979; López-Mesa, B., Ed.; Prensas de la Universidad de Zaragoza: Zaragoza, Spain, 2018; pp. 189–233. ISBN 978-84-17358-41-9. [Google Scholar]
  41. Ho, S.; Rajabifard, A.; Stoter, J.; Kalantari, M. Legal barriers to 3D cadastre implementation: What is the issue? Land Use Policy 2013, 35, 379–387. [Google Scholar] [CrossRef] [Green Version]
  42. van Oosterom, P. Research and development in 3D cadastres. Comput. Environ. Urban Syst. 2013, 40, 1–6. [Google Scholar] [CrossRef]
  43. Vučić, N.; Mađer, M.; Vranić, S.; Roić, M. Initial 3D cadastre registration by cadastral resurvey in the Republic of Croatia. Land Use Policy 2020, 104335. [Google Scholar] [CrossRef]
  44. Ministerio de Hacienda. Sede Electrónica del Catastro. Available online: https://www.sedecatastro.gob.es/ (accessed on 15 October 2020).
  45. PNOA. Plan Nacional de Ortofotografía Aérea. Available online: https://pnoa.ign.es/ (accessed on 19 May 2021).
  46. Coors, V. 3D-GIS in networking environments. Comput. Environ. Urban Syst. 2003, 27, 345–357. [Google Scholar] [CrossRef]
  47. Nichol, J.; Wong, M.S. Modeling urban environmental quality in a tropical city. Landsc. Urban Plan. 2005, 73, 49–58. [Google Scholar] [CrossRef]
  48. Guney, C.; Akdag Girginkaya, S.; Cagdas, G.; Yavuz, S. Tailoring a geomodel for analyzing an urban skyline. Landsc. Urban Plan. 2012, 105, 160–173. [Google Scholar] [CrossRef]
  49. Teo, T.A.; Cho, K.H. BIM-oriented indoor network model for indoor and outdoor combined route planning. Adv. Eng. Inform. 2016, 30, 268–282. [Google Scholar] [CrossRef]
  50. Perez, D.; Henri, K. Urban Area Energy Flow Microsimulation for Planning Support: A Calibration and Verification Study. Int. J. Adv. Syst. Meas. 2013, 6, 260–271. [Google Scholar]
  51. Wróżyński, R.; Sojka, M.; Pyszny, K. The application of GIS and 3D graphic software to visual impact assessment of wind turbines. Renew. Energy 2016, 96, 625–635. [Google Scholar] [CrossRef]
  52. García-Pérez, S.; Sierra-Pérez, J.; Boschmonart-Rives, J. Environmental assessment at the urban level combining LCA-GIS methodologies: A case study of energy retrofits in the Barcelona metropolitan area. Build. Environ. 2018, 134, 191–204. [Google Scholar] [CrossRef] [Green Version]
  53. Izquierdo, S.; Rodrigues, M.; Fueyo, N. A method for estimating the geographical distribution of the available roof surface area for large-scale photovoltaic energy-potential evaluations. Sol. Energy 2008, 82, 929–939. [Google Scholar] [CrossRef]
  54. Government of Spain. Data Model Mapping in Vector Format (Shapefile). Available online: http://www.catastro.minhap.es/ayuda/manual_descriptivo_shapefile.pdf (accessed on 15 October 2020).
  55. General Directorate of Cadastre. INSPIRE Services of Cadastral Cartography. Available online: http://www.catastro.minhap.es/webinspire/index.html (accessed on 15 October 2020).
  56. Ministerio de Transporte, Movilidad y Agenda Urbana. Infraestructura de Datos Espaciales de España. Available online: https://www.idee.es/datos (accessed on 15 October 2020).
  57. Official Journal of the European Union. Directive 2007/2/EC of the European Parliament and of the council of 14 March 2007 establishing an Infrastructure for Spatial Information in the European Community (INSPIRE) 2007. Available online: https://eur-lex.europa.eu/legal-content/EN/ALL/?uri=CELEX%3A32007L0002 (accessed on 24 May 2021).
  58. Ayuntamiento de Zaragoza. Cifras de Zaragoza: Datos Demográficos del Padrón Municipal de Habitantes. Available online: https://www.zaragoza.es/cont/paginas/estadistica/pdf/Cifras-Zaragoza-2020.pdf (accessed on 19 May 2021).
  59. Instituto Nacional de Estadística. Cifras Oficiales de Población Resultantes de la Revisión del Padrón Municipal a 1 de Enero. Available online: https://www.ine.es/dynt3/inebase/es/index.htm?padre=517&capsel=527 (accessed on 15 October 2020).
  60. Bianchi, C.; Overby, M.; Willemsen, P.; Smith, A.D.; Stoll, R.; Pardyjak, E.R. Quantifying effects of the built environment on solar irradiance availability at building rooftops. J. Build. Perform. Simul. 2020, 13, 195–208. [Google Scholar] [CrossRef]
  61. Institut Wohnen und Umwelt. TABULA EPISCOPE Project. Available online: https://episcope.eu/welcome/ (accessed on 15 October 2020).
Figure 1. Aerial view of the city of Zaragoza and location of Ruiseñores neighborhood. Derivative work of PNOA 2021 CC-BY 4.0 scne.es [45].
Sustainability 13 06028 g001
Figure 2. Aerial view of Ruiseñores neighborhood. Derivative work of PNOA 2021 CC-BY 4.0 scne.es [45].
Sustainability 13 06028 g002
Figure 3. Hand-built model from public cadastral data and Google Earth.
Sustainability 13 06028 g003
Figure 4. Automatically built model of Ruiseñores neighborhood based on GIS regular cadaster data.
Sustainability 13 06028 g004
Figure 5. Automatically built model of Ruiseñores neighborhood based on GIS INSPIRE cadaster data.
Sustainability 13 06028 g005
Figure 6. Overlapping of the hand-built model and the automatically built model from regular cadaster data. Blue: automatic model from regular cadaster data. Red: hand-built model.
Sustainability 13 06028 g006
Figure 7. Left: Google Earth image of the San Juan de Dios hospital (Map data: © 2021 Google, Image Landsat/Copernicus). Right: cadastral plan of the San Juan de Dios hospital [44] transformed highlighting the discrepancies for comparison with the left image.
Sustainability 13 06028 g007
Figure 8. Left: Google Earth image of a block with just one building standing up (Map data: © 2021 Google, Image Landsat/Copernicus). Right: regular cadaster data of the same part of the neighborhood [44] transformed highlighting the discrepancies for comparison with the left image.
Sustainability 13 06028 g008
Figure 9. Left: Google Earth image of a building with pitched roof (Map data: © 2021 Google, Image Landsat/Copernicus). Right: overlapping of its representation in the automatic model (blue) and the hand-built model (red).
Sustainability 13 06028 g009
Figure 10. Overlapping of hand-built model and automatically built model from INSPIRE cadaster data. Blue: automatic model from INSPIRE cadaster data. Red: hand-built model.
Sustainability 13 06028 g010
Figure 11. Sunlight hours the 21 December on pedestrian areas of the Ruiseñores neighborhood in Zaragoza. Left, hand-built 3D model. Right, automatically built 3D model from regular cadaster data.
Sustainability 13 06028 g011
Figure 12. Comparison between the sunlight hours in pedestrian spaces obtained for the 21 December with the hand-built model and the GIS regular cadaster model.
Sustainability 13 06028 g012
Figure 13. Average daily value of incident solar radiation on the roofs of the Ruiseñores neighborhood in Zaragoza. Left, hand-built 3D model. Right, automatically built 3D model from GIS regular cadaster data.
Sustainability 13 06028 g013
Figure 14. Distribution of blocks for the comparison between the hand-built (left) and the automatically built models (right).
Sustainability 13 06028 g014
Figure 15. Comparison between the average daily value of incident solar radiation with the hand-built model and the regular cadaster model.
Sustainability 13 06028 g015
Figure 16. Left: image of the 3D model of the city of Zaragoza. Right: zoom-in to the city model showing Delicias neighborhood with Paseo Calanda in the middle.
Sustainability 13 06028 g016
Table 1. Sources and software to build heights.
ModelSourcesSoftware
Hand-builtGoogle Earth and visual inspectionExtrusion of the buildings’ footprints in Ecotect Analysis 2011
Regular cadasterGIS cadaster dataQGIS for information processing
+
AutoCAD 2019 with the algorithm “3D_Model”
INSPIRE cadasterGIS cadaster-INSPIRE data
Table 2. Conversion criteria for the automatic construction of 3D model from regular cadaster data.
Nomenclature of PlotsConversion into Specific Heights
Negative levels (basements) −I, −II...0 m
First floor I4 m
Upper floors3 m each
Porch and arcade (POR and SOP)3 m
Mezzanine (EPT)3 m
Rest of the elements0 m
Elements or combinations not defined0 m
Combinations of the elements (e.g., V+II)Sum of all the elements (22 m)
Table 3. Calculation options used in simulations with Ecotect Analysis 2011.
Sunlight Hours on Pedestrian SpacesIncident Solar Radiation on Rooftops
Period21 DecemberWhole year
Period-based valuesCumulative valuesAverage daily values
Object overshadowingDetailed shading calculationsDetailed shading calculations
Surface samplingMedium: 5 × 5 gridMedium: 5 × 5 grid
Sky subdivisionMedium: 5° × 5° gridMedium: 5° × 5° grid
Table 4. Time-consumption to build the different 3D models of the Ruiseñores neighborhood in Zaragoza.
ModelPreparation TimeTime Computing (Algorithm)
Hand-built model25 h-
Automatically built model from public GIS-based regular cadaster data1 h20 s
Automatically built model from GIS-based INSPIRE cadaster data30 min20 s
Table 5. Time-consumption to automatically build 3D models of the city of Zaragoza using the the “3D_Model” algorithm and cadastral GIS data.
ModelPreparation TimeTime Computing (Algorithm)
Automatically built model from GIS-based regular cadaster data3 h8 h
Automatically built model from GIS-based INSPIRE cadaster data30 min8 h
Publisher’s Note: MDPI stays neutral with regard to jurisdictional claims in published maps and institutional affiliations.

