
The Integrated Cropping Calendar Information System: A Coping Mechanism to Climate Variability for Sustainable Agriculture in Indonesia


 ,
,  , ,
, ,
Abstract
:1. Introduction
2. Data and Method
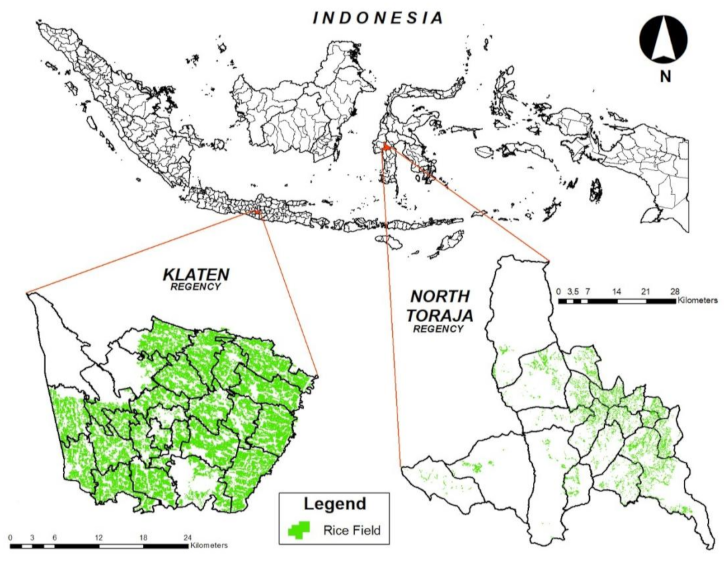
2.1. Study Area
2.2. Data
2.3. Determination of Planting Time and Planting Area
2.4. System of Formulating Recommendation
- (a)
- Fertilizer Recommendations
- (b)
- Agricultural Machinery Sufficiency
- (c)
- Potential Livestock Feed
- (d)
- Crop Damage due to Flood, Drought, Pests, and Diseases Attacks
- (e)
- Varieties Recommendation
2.5. Case Study
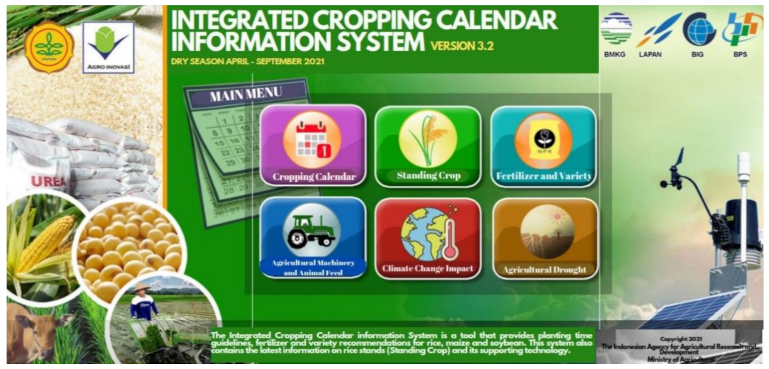
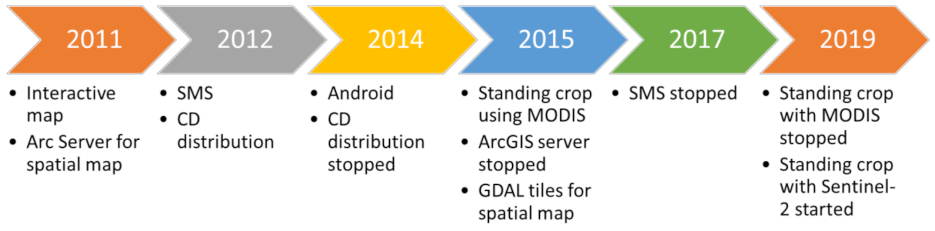
2.6. The Integrated Cropping Calendar Information System
2.7. Dissemination and Feedback
3. Results and Discussion
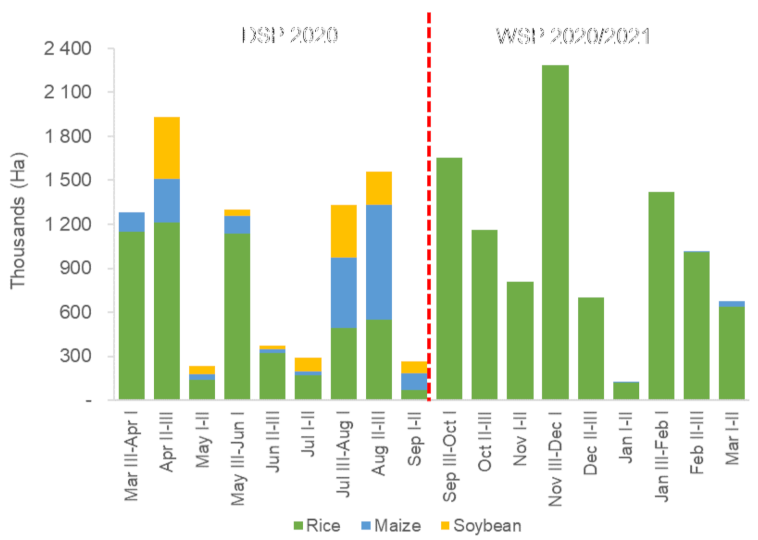
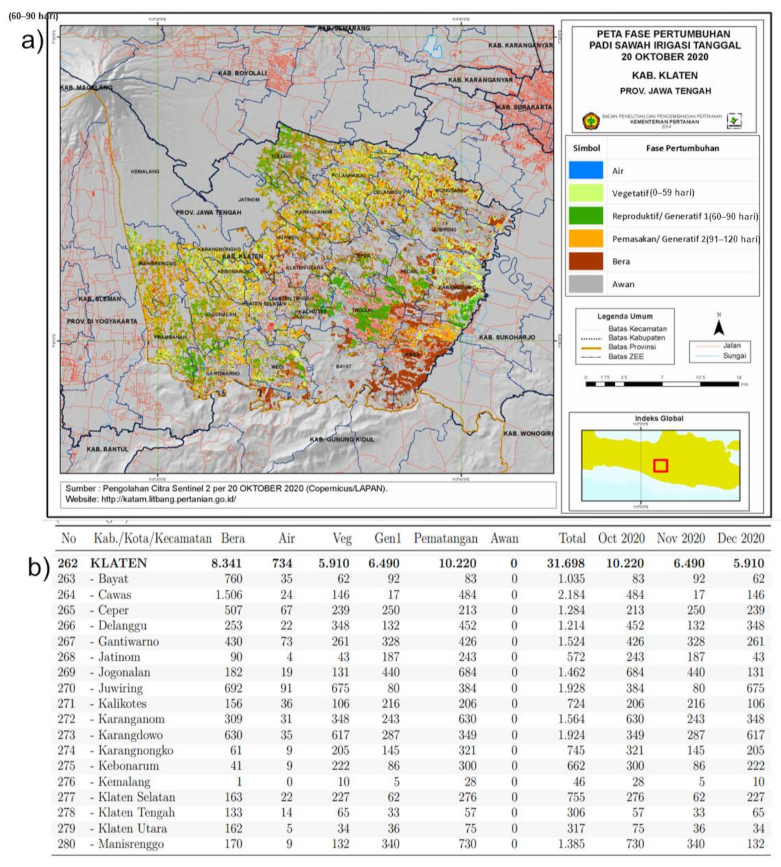
3.1. Cropping Calendar Information for Dry Season and Wet Season Planting
3.2. Case Study
- (a)
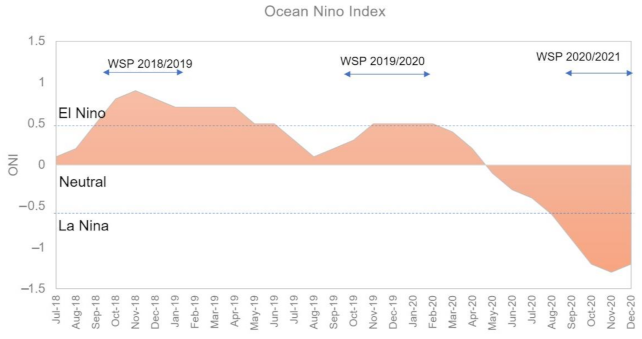
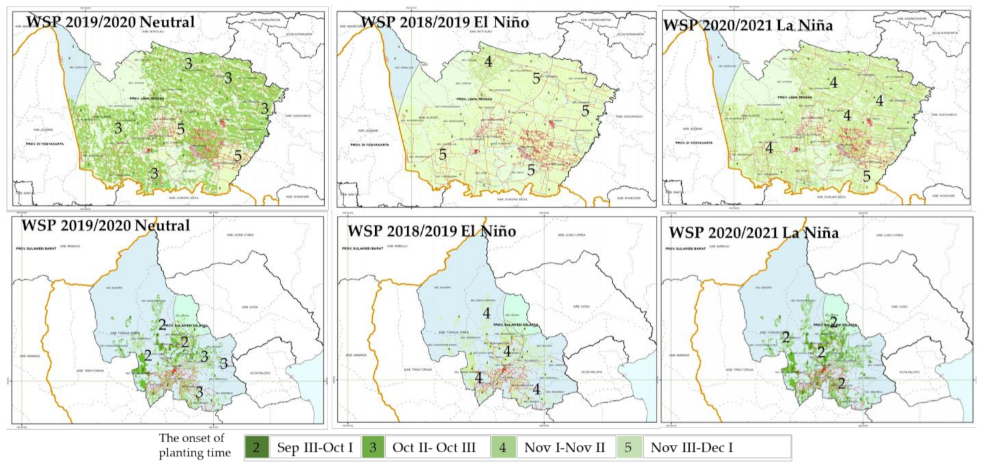
- Comparison of Cropping Calendar Information in WSP under ENSO Scenarios in the Recent Years
- (b)
- Fertilizer Recommendations
- (c)
- Agricultural Machinery
- (d)
- Livestock Feed Potential
- (e)
- Agricultural Hazard and Related Varieties Recommendation
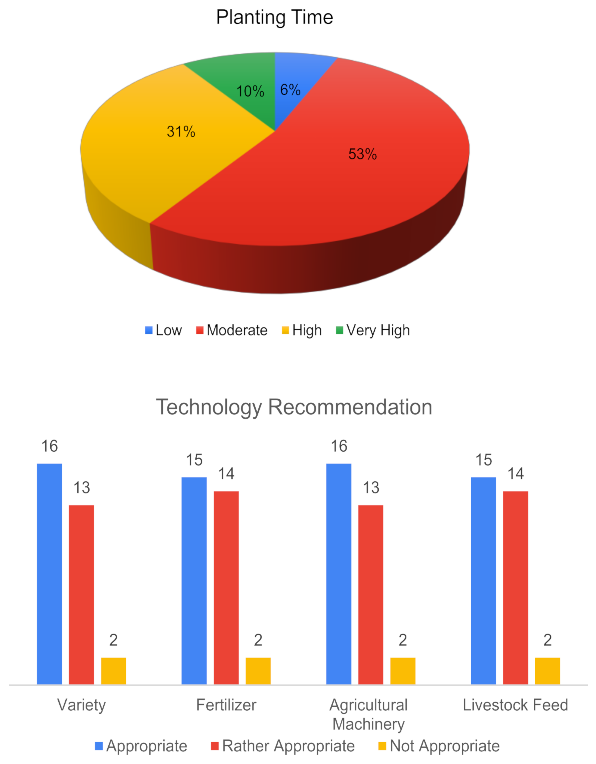
3.3. Dissemination and Feedback of the ICCIS
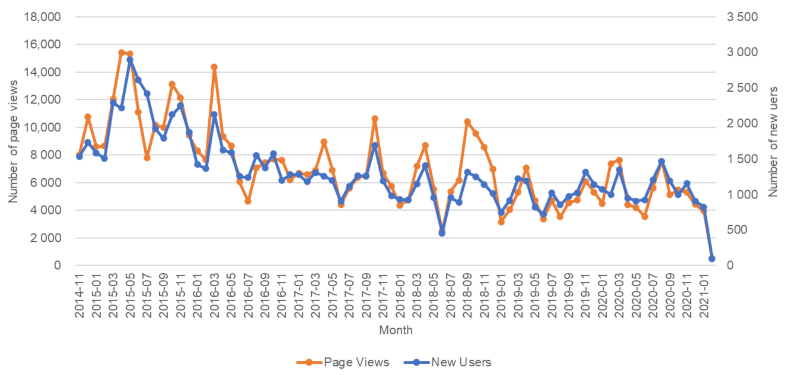
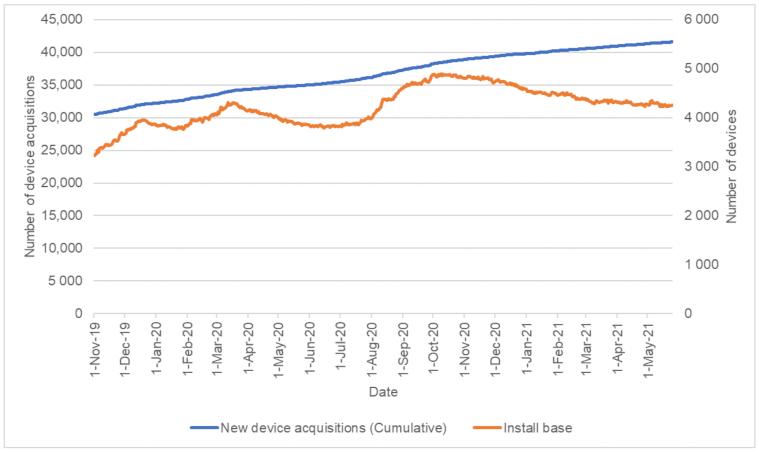
3.4. Users Access to the ICCIS Website
4. Conclusions
Author Contributions
Funding
Data Availability Statement
Conflicts of Interest
References
- Amien, I.; Rejekiningrum, P.; Pramudia, A.; Susanti, E. Effects of interannual climate variability and climate change on rice yield in Java, Indonesia. Water Air Soil Pollut. 1996, 92, 29–39. [Google Scholar]
- Naylor, R.L.; Battisti, D.S.; Vimont, D.J.; Falcon, W.P.; Burke, M.B. Assessing risks of climate variability and climate change for Indonesian rice agriculture. Proc. Natl. Acad. Sci. USA 2007, 104, 7752–7757. [Google Scholar] [CrossRef] [PubMed] [Green Version]
- Estiningtyas, W.; Surmaini, E.; Susanti, E. Vulnerability of the food crop to climate change (in Indonesian). J. Sumberd. Lahan 2016, Special Edition, 85–96, ISSN 1907-0799. [Google Scholar]
- Boer, R.; Surmaini, E. Economic benefits of ENSO information in crop management decisions: Case study of rice farming in West Java, Indonesia. Theor. Appl. Climatol. 2020, 139, 1435–1446. [Google Scholar] [CrossRef]
- Surmaini, E.; Hadi, T.W.; Subagyono, K.; Puspito, N.T. Early detection of drought impact on rice paddies in Indonesia by means of Niño 3.4 index. Theor. Appl. Climatol. 2015, 121, 669–684. [Google Scholar] [CrossRef]
- Odekunle, T.O.; Balogun, E.E.; Ogunkoya, O.O. On the prediction of rainfall onset and retreat dates in Nigeria. Theor. Appl. Climatol. 2005, 81, 101–112. [Google Scholar] [CrossRef]
- Haylock, M.; McBride, J. Spatial Coherence and Predictability of Indonesian Wet Season Rainfall. J. Clim. 2001, 14, 3882–3887. [Google Scholar] [CrossRef]
- Murakami, T.; Matsumoto, J. Summer Monsoon over the Asian Continent and Western North Pacific. J. Meteorol. Soc. Jpn. Ser. II 1994, 72, 719–745. [Google Scholar] [CrossRef] [Green Version]
- Aldrian, E.; Dümenil Gates, L.; Widodo, F.H. Seasonal variability of Indonesian rainfall in ECHAM4 simulations and in the reanalyses: The role of ENSO. Theor. Appl. Climatol. 2007, 87, 41–59. [Google Scholar] [CrossRef] [Green Version]
- Hamada, J.-I.; Yamanaka, M.D.; Matsumoto, J.; Fukao, S.; Winarso, P.A.; Sribimawati, T. Spatial and Temporal Variations of the Rainy Season over Indonesia and their Link to ENSO. J. Meteorol. Soc. Jpn. Ser. II 2002, 80, 285–310. [Google Scholar] [CrossRef] [Green Version]
- Susilo, G.E.; Yamamoto, K.; Imai, T.; Ishii, Y.; Fukami, H.; Sekine, M. The effect of ENSO on rainfall characteristics in the tropical peatland areas of Central Kalimantan, Indonesia. Hydrol. Sci. J. 2013, 58, 539–548. [Google Scholar] [CrossRef] [Green Version]
- Saji, N.H.; Yamagata, T. Structure of SST and Surface Wind Variability during Indian Ocean Dipole Mode Events: COADS Observations. J. Clim. 2003, 16, 2735–2751. [Google Scholar] [CrossRef]
- As-syakur, A.R.; Adnyana, I.W.S.; Mahendra, M.S.; Arthana, I.W.; Merit, I.N.; Kasa, I.W.; Ekayanti, N.W.; Nuarsa, I.W.; Sunarta, I.N. Observation of spatial patterns on the rainfall response to ENSO and IOD over Indonesia using TRMM Multisatellite Precipitation Analysis (TMPA). Int. J. Climatol. 2014, 34, 3825–3839. [Google Scholar] [CrossRef]
- Hidayat, R.; Ando, K.; Masumoto, Y.; Luo, J.J. Interannual Variability of Rainfall over Indonesia: Impacts of ENSO and IOD and Their Predictability. IOP Conf. Ser. Earth Environ. Sci. 2016, 31, 012043. [Google Scholar] [CrossRef]
- Satyawardhana, H.; Trismidianto; Yulihastin, E. Influence of ENSO on Deviation of The Season Onset in Java Based on CCAM Downscaling Data. IOP Conf. Ser. Earth Environ. Sci. 2018, 166, 012030. [Google Scholar] [CrossRef]
- Salack, S.; Muller, B.; Gaye, A.T. Rain-based factors of high agricultural impacts over Senegal. Part I: Integration of local to sub-regional trends and variability. Theor. Appl. Climatol. 2011, 106, 1–22. [Google Scholar] [CrossRef]
- Mugalavai, E.M.; Kipkorir, E.C.; Raes, D.; Rao, M.S. Analysis of rainfall onset, cessation and length of growing season for western Kenya. Agric. For. Meteorol. 2008, 148, 1123–1135. [Google Scholar] [CrossRef]
- Ndomba, P.M. Development of rainfall curves for crops planting dates: A case study of Pangani River Basin in Tanzania. Nile Basin Water Sci. Eng. J. 2010, 3, 13–27. [Google Scholar]
- Apriyana, Y.; Aldrian, E.; Koesmaryono, Y. The Dynamics of Rice Cropping Calendar and Its Relation with the ENSO (El Niño-Southern Oscillation) and IOD (Indian Ocean Dipole) in Monsoon and Equatorial Regions of Indonesia. In Proceedings of the IOP Conference Series: Earth and Environmental Science, Jakarta, Indonesia, 21–22 November 2018. [Google Scholar]
- Runtunuwu, E.; Ramadhani, F.; Setyorini, D.; Sari, K.; Apriyana, Y.; Susanti, E.; Haryono, H. Institutional Innovation of Integrated Cropping Calendar Information System to Support Climate Change Adaptation for National Food Security. Pengemb. Inov. Pertan. 2013, 6, 44–52. [Google Scholar]
- Runtunuwu, E.; Syahbuddin, H.; Ramadhani, F.; Pramudia, A.; Setyorini, D.; Sari, K.; Apriyana, Y.; Susanti, E.; Haryono, H.; Setyanto, P. Integrated cropping calendar information system: Current status and future challenges (in Indonesian). J. Sumberd. Lahan 2012, 6, 67–78. [Google Scholar]
- Aldrian, E.; Dümenil-Gates, L.; Jacob, D.; Podzun, R.; Gunawan, D. Long-term simulation of Indonesian rainfall with the MPI regional model. Clim. Dyn. 2004, 22, 795–814. [Google Scholar] [CrossRef]
- Chang, C.P.; Wang, Z.; Ju, J.H.; Li, T. On the Relationship between Western Maritime Continent Monsoon Rainfall and ENSO during Northern Winter. J. Clim. 2004, 17, 665–672. [Google Scholar] [CrossRef] [Green Version]
- Susanti, E.; Surmaini, E.; Pramudia, A.; Heryani, N.; Estiningtyas, W.; Suciantini, S.; Apriyana, Y. Updating of The Agro-climate Resources Map of Indonesia to Support Agricultural Planning (in Indonesian). Indonesian Soil Climate J. 2021, 45, 12. [Google Scholar] [CrossRef]
- Ministry of Agrarian Affair and Spatial Planning/National Land Agency. National Rice Field Map (in Indonesian); Ministry of Agrarian Affair and Spatial Planning/National Land Agency: Jakarta, Indonesia, 2019. [Google Scholar]
- Thornthwaite, C.W.; Mather, J.R. Instructions and Tables for Computing Potential Evapotranspiration and the Water Balance; FAO: Centerton, AR, USA, 1957. [Google Scholar]
- Ministry of Agriculture. Fertilization Recommendations for N, P, and K in Location Specific Rice (in Indonesian); Ministry of Agriculture: Jakarta, Indonesia, 2007. [Google Scholar]
- Setyorini, D.; Kasno, A.; Nurjaya; Adamy, I.S.; Suryono, J. Determination of Recommendations and Needs for Fertilizer Based on an Integrated Planting Calendar (in Indonesian); Indonesian Center for Agricultural Land Resources Research and Development—Indonesian Agency for Agricultural Research and Development—Ministry of Agriculture: Bogor, Indonesia, 2011. [Google Scholar]
- Budiharti, U.; Suparlan; Nurhasanah, A.; Nasution, D.A.; Ramadhani, F.; Mulyani; Gultom, R.J.; Nursani, D.; Sulistiyosari, N.; Harningsih, S. Mapping Development of Rice, Corn and Soybean Production Mechanization (in Indonesian); ndonesian Center for Agricultural Engineering Research and Development - Indonesian Agency for Agricultural Research and Development—Ministry of Agriculture: Tangerang, Indonesia, 2015. [Google Scholar]
- Brewer, C.A.; Pickle, L. Evaluation of methods for classifying epidemiological data on choropleth maps in series. Ann. Assoc. Am. Geogr. 2002, 92, 662–681. [Google Scholar] [CrossRef]
- Xue, Y.; Smith, T.M.; Reynolds, R.W. Interdecadal Changes of 30-Yr SST Normals during 1871–2000. J. Clim. 2003, 16, 1601–1612. [Google Scholar] [CrossRef] [Green Version]
- Kousky, V.E.; Higgins, R.W. An Alert Classification System for Monitoring and Assessing the ENSO Cycle. Weather Forecast 2007, 22, 353–371. [Google Scholar] [CrossRef]
- Runtunuwu, E.; Las, I.; Amien, I.; Syahbuddin, H. Utilizing Cropping Calendar in Coping with Climate Change. Ecolab 2011, 5, 1–14. [Google Scholar] [CrossRef]
- Runtunuwu, E.; Syahbuddin, H. Atlas of national food crop planting calendar to address climate variability and change (in Indonesia). J. Sumberd. Lahan 2011, 5, 1–10. [Google Scholar]
- Ramadhani, F.; Pullanagari, R.; Kereszturi, G.; Procter, J. Automatic Mapping of Rice Growth Stages Using the Integration of SENTINEL-2, MOD13Q1, and SENTINEL-1. Remote Sens. 2020, 12, 3613. [Google Scholar] [CrossRef]
- Darna, N.; Herlina, E. Choosing the Right Research Method: For Management Science Research (in Indonesian). J. Ekonologi Ilmu Manaj. 2018, 5, 287–292. [Google Scholar]
- Kotera, A.; Nguyen, K.D.; Sakamoto, T.; Iizumi, T.; Yokozawa, M. A modeling approach for assessing rice cropping cycle affected by flooding, salinity intrusion, and monsoon rains in the Mekong Delta, Vietnam. Paddy Water Environ. 2014, 12, 343–354. [Google Scholar] [CrossRef]
- Yegbemey, R.N.; Kabir, H.; Awoye, O.H.R.; Yabi, J.A.; Paraïso, A.A. Managing the agricultural calendar as coping mechanism to climate variability: A case study of maize farming in northern Benin, West Africa. Clim. Risk Manag. 2014, 3, 13–23. [Google Scholar] [CrossRef] [Green Version]
- Naylor, R.; Falcon, W.; Wada, N.; Rochberg, D. Using El Nino-Southern oscillation climate data to improve food policy planning in Indonesia. Bull. Indones. Econ. Stud. 2002, 38, 75–91. [Google Scholar] [CrossRef]
- Naylor, R.L.; Falcon, W.P.; Rochberg, D.; Wada, N. Using El Nino/Southern oscillation climate data to predict rice production in Indonesia. Clim. Chang. 2001, 50, 255–265. [Google Scholar] [CrossRef]
- Subardja, V.O.; Anas, I.; Widyastuti, R. Utilization of organic fertilizer to increase paddy growth and productivity using System of Rice Intensification (SRI) method in saline soil. J. Degrad. Min. Lands Manag. 2016, 3, 543–549. [Google Scholar] [CrossRef]
- Kai, T.; Kumano, M.; Tamaki, M. A Study on Rice Growth and Soil Environments in Paddy Fields Using Different Organic and Chemical Fertilizers. J. Agric. Chem. Environ. 2020, 9, 331–342. [Google Scholar]
- Hatta, M. A Site-Specific Fertilizer Recommendation Based on the Phosphorus and Potassium Status in Mempawah District, West Kalimantan. J. Trop. Soils 2020, 25, 93–106. [Google Scholar] [CrossRef]
- Kalpalatha, C.; Reddy, N. Impact of Agricultural Machinery and Equipment on Paddy Production (A study on Nellore district of Andhra Pradesh). IOSR J. Humanit. Soc. Sci. 2018, 23, 17–24. [Google Scholar]
- Qiu, Z.; Zhao, N.; Zhou, L.; Wang, M.; Yang, L.; Fang, H.; He, Y.; Liu, Y. Vision-Based Moving Obstacle Detection and Tracking in Paddy Field Using Improved Yolov3 and Deep SORT. Sensors 2020, 20, 4082. [Google Scholar] [CrossRef]
- Kiratiratanapruk, K.; Temniranrat, P.; Sinthupinyo, W.; Prempree, P.; Chaitavon, K.; Porntheeraphat, S.; Prasertsak, A. Development of Paddy Rice Seed Classification Process using Machine Learning Techniques for Automatic Grading Machine. J. Sens. 2020, 2020, 7041310. [Google Scholar] [CrossRef]
- Leinonen, I. Achieving Environmentally Sustainable Livestock Production. Sustainability 2019, 11, 246. [Google Scholar] [CrossRef] [Green Version]
- Saxe, H.; Hamelin, L.; Hinrichsen, T.; Wenzel, H. Production of Pig Feed under Future Atmospheric CO2 Concentrations: Changes in Crop Content and Chemical Composition, Land Use, Environmental Impact, and Socio-Economic Consequences. Sustainability 2018, 10, 3184. [Google Scholar] [CrossRef] [Green Version]
- Azis, A.; Muljono, P.; Las, I.; Mulyandari, R.S.H. Implementation of integrated cropping calendar information system (ICCIS) to improve farmer’s knowledge and to adapt the climate change. Innov. Sci. Inf. Serv. Netw. 2019, 16, 3226–3233. [Google Scholar]
- Syahbuddin, H.; Purnamayani, R.; Siska, W.; Humaedah, U.; Suryaningrat, B.; Ethika, A.P.W.; Medionovianto, R.D.; Priyadi, I. Application of Technological Innovations for Improving the Planting Index (in Indonesian); Indonesian Center for Agricultural Technology Assessment and Development—Indonesian Agency for Agricultural Research and Development—Ministry of Agriculture: Bogor, Indonesia, 2018. [Google Scholar]
- Yulianti, A.; Sirnawati, E.; Ulpah, A. Introduction technology of cropping calendar-information system (CC-IS) for rice farming as a climate change adaptation in Indonesia. Int. J. Adv. Sci. Eng. Inf. Technol. 2016, 6, 92. [Google Scholar] [CrossRef]
- Yuliarso, M.Z.; Windirah, N.; Widono, S. The Implementation of Integrated Cropping Calendar on Lowland Rice Farming in Bengkulu City. J. AGRISEP Kaji. Masal. Sos. Ekon. Pertan. Dan Agribisnis 2020, 19, 407–416. [Google Scholar] [CrossRef]
- Azis, A.; Muljono, P.; Las, I.; Mulyandari, R.S.H. Utilization of integrated planting calendar technology to increase local rice productivity in South Kalimantan (in Indonesian). Proc. Natl. Semin. Use Local Var. Support Community Econ. Growth 2020, 1, 25–38. [Google Scholar]
- Dewi, E.R.; Susanti, E.; Apriyana, Y. Planting time options to improve rice productivity based on the Integrated KATAM recommendations. IOP Conf. Ser. Earth Environ. Sci. 2021, 648, 012105. [Google Scholar] [CrossRef]
- Bouroncle, C.; Müller, A.; Giraldo, D.; Rios, D.; Imbach, P.; Girón, E.; Portillo, F.; Boni, A.; van Etten, J.; Ramirez-Villegas, J. A systematic approach to assess climate information products applied to agriculture and food security in Guatemala and Colombia. Clim. Serv. 2019, 16, 100137. [Google Scholar] [CrossRef]
- Rose, D.C.; Sutherland, W.J.; Parker, C.; Lobley, M.; Winter, M.; Morris, C.; Twining, S.; Ffoulkes, C.; Amano, T.; Dicks, L.V. Decision support tools for agriculture: Towards effective design and delivery. Agric. Syst. 2016, 149, 165–174. [Google Scholar] [CrossRef] [Green Version]
- Sun, Z.; Di, L.; Fang, H.; Guo, L.; Yu, E.; Tang, J.; Zhao, H.; Gaigalas, J.; Zhang, C.; Lin, L.; et al. Advanced Cyberinfrastructure for Agricultural Drought Monitoring. In Proceedings of the 2019 8th International Conference on Agro-Geoinformatics (Agro-Geoinformatics), Istanbul, Turkey, 16–19 July 2019; pp. 1–5. [Google Scholar]
- Mase, A.S.; Prokopy, L.S. Unrealized Potential: A Review of Perceptions and Use of Weather and Climate Information in Agricultural Decision Making. Weather Clim. Soc. 2014, 6, 47–61. [Google Scholar] [CrossRef]


| ENSO | The Onset of Planting Time | Potential Planting Areas (Ha) |
|---|---|---|
| Klaten Regency | ||
| El Niño year 2018/2019 | Nov III–Dec I | 30,052 |
| Neutral year 2019/2020 | Oct II–III | 55,046 |
| La Niña year 2020/2021 | Nov I–II | 46,179 |
| North Toraja Regency | ||
| El Niño year 2018/2019 | Nov I–II | 8553 |
| Neutral year 2019/2020 | Oct II–III | 14,135 |
| La Niña year 2020/2021 | Sep III–Oct I | 19,039 |
| Crop | Category | Damaged Area (ha) | |||||||
|---|---|---|---|---|---|---|---|---|---|
| Flood | Drought | BPH | RFR | RSB | RTD | BLB | RBD | ||
| Rice | Very low | 0–10 | 0–10 | 0–1 | 0–5 | 0–3 | 0–1 | 0–1 | 0–2 |
| low | 10–30 | 10–30 | 1–5 | 5–10 | 3–10 | 1–2 | 1–3 | 2–5 | |
| moderate | 30–80 | 30–80 | 5–10 | 10–20 | 10–20 | 2–10 | 3–5 | 5–15 | |
| high | 80–280 | 80–260 | 10–30 | 20–65 | 20–55 | 10–20 | 5–15 | 15–40 | |
| Very high | >280 | >260 | >30 | >65 | >55 | >20 | >15 | >40 | |
| Agricultural Hazard | Klaten District | North Toraja District | ||
|---|---|---|---|---|
| Category | Varieties Recommendation | Category | Varieties Recommendation | |
| Flood | Moderate | Inpari 17, 21–24, 29, 30, Inpara 1–7 | Safe | Inpari 11–13, 17, 21–24, 29, 30, Inpara 1–7 |
| Drought | Moderate | Inpari 10, 13, 18–20, 38–41, Situ Patenggang, Limboto, Situ Bagendit, Batutegi, Inpago 7, 8, 10 | Safe | Inpari 1, 10, 13–16, 18–20, 38–41, Situ Patenggang, Limboto, Situ Bagendit, Batutegi, Silugonggo, Inpago 6–8, 10 |
| Brown Planthopper | Very high | Inpari 13,31,33, Mekongga | Safe | Inpari 1–3,5,6,10,13,18,19,31–33, Widas, Cisantana, Konawe, Mekongga |
| Rice field Rat | Very high | - | High | - |
| Rice Stem Borer | Very high | - | Low | - |
| Rice Tungro Disease | Moderate | Inpari 5, 7, 21, Tukad Unda, Tukad Petanu, Tukad Balian | Safe | Inpari 4, 5, 7–9, 21, 31, 33, Tukad Unda, Tukad Petanu, Kalimas, Bondoyudo |
| Rice Blast Disease | Very high | Batang Piaman, Situ Patenggang, Limboto, Inpari 28, Inpari 32HDB | High | Inpari 11, 17, 28, Batang Piaman, Situ Patenggang, Limboto, Danau Gaung, Batutegi, Inpari 32HDB |
| Bacterial Leaf Blight | Very high | Inpari 1, 6, 17, Conde, Angke, Inpari 32 HDB, Hipa 18 | Safe | Inpari 1, 3, 4, 6, 7 Lanrang, 8, 11, 15–20, Mekongga, Conde, Angke, Inpari 32 HDB |
| AIAT | BMKG | BPP | Agricultural Office | Number of Forum Dissemination |
|---|---|---|---|---|
| √ | 8 | |||
| √ | √ | 3 | ||
| √ | √ | 1 | ||
| √ | 2 | |||
| √ | √ | √ | 1 | |
| √ | 1 | |||
| √ | √ | 1 | ||
| √ | √ | 1 | ||
| √ | √ | 3 | ||
| √ | √ | √ | 8 | |
| √ | √ | √ | 3 | |
| √ | √ | √ | √ | 1 |
| Level of Dissemination | No of AIAT | |||
|---|---|---|---|---|
| Village | Sub District | Regency | Province | |
| √ | 1 | |||
| √ | 2 | |||
| √ | 3 | |||
| √ | √ | 1 | ||
| √ | √ | 6 | ||
| √ | √ | 6 | ||
| √ | √ | √ | 10 | |
| √ | √ | √ | √ | 4 |
Publisher’s Note: MDPI stays neutral with regard to jurisdictional claims in published maps and institutional affiliations. |
© 2021 by the authors. Licensee MDPI, Basel, Switzerland. This article is an open access article distributed under the terms and conditions of the Creative Commons Attribution (CC BY) license (https://creativecommons.org/licenses/by/4.0/).
Share and Cite
Apriyana, Y.; Surmaini, E.; Estiningtyas, W.; Pramudia, A.; Ramadhani, F.; Suciantini, S.; Susanti, E.; Purnamayani, R.; Syahbuddin, H. The Integrated Cropping Calendar Information System: A Coping Mechanism to Climate Variability for Sustainable Agriculture in Indonesia. Sustainability 2021, 13, 6495. https://0-doi-org.brum.beds.ac.uk/10.3390/su13116495
Apriyana Y, Surmaini E, Estiningtyas W, Pramudia A, Ramadhani F, Suciantini S, Susanti E, Purnamayani R, Syahbuddin H. The Integrated Cropping Calendar Information System: A Coping Mechanism to Climate Variability for Sustainable Agriculture in Indonesia. Sustainability. 2021; 13(11):6495. https://0-doi-org.brum.beds.ac.uk/10.3390/su13116495
Chicago/Turabian StyleApriyana, Yayan, Elza Surmaini, Woro Estiningtyas, Aris Pramudia, Fadhlullah Ramadhani, Suciantini Suciantini, Erni Susanti, Rima Purnamayani, and Haris Syahbuddin. 2021. "The Integrated Cropping Calendar Information System: A Coping Mechanism to Climate Variability for Sustainable Agriculture in Indonesia" Sustainability 13, no. 11: 6495. https://0-doi-org.brum.beds.ac.uk/10.3390/su13116495