
University Students’ Emotions When Using E-Portfolios in Virtual Education Environments


Department of Didactics and School Organization, University of Granada, 18071 Granada, Spain
*
Author to whom correspondence should be addressed.
Sustainability 2021, 13(12), 6973; https://0-doi-org.brum.beds.ac.uk/10.3390/su13126973
Submission received: 10 May 2021
/
Revised: 17 June 2021
/
Accepted: 18 June 2021
/
Published: 21 June 2021
(This article belongs to the Collection Sustainable Teaching and Learning Strategies in the Digital Age)
Abstract
:This paper is based on a study that aims to understand the emotions students feel when they use the e-portfolio to manage their learning and assessment. The sample was composed of 358 students, and the instrument used was an ad hoc questionnaire. The students were asked to indicate the degree to which they experienced a set of emotions when using the e-portfolio. From the results obtained, it can be concluded that positive emotions are foremost and above average, ranked as follows from strongest to weakest: freedom, motivation, curiosity, and inquiry. The students evaluated negative emotions (disorientation and waste of time) as experienced less strongly. The results point out that younger students feel more comfortable with the use of technologies and specifically with the e-portfolio. In addition, men experienced the emotion “freedom” more than women. On the other hand, students in the third year of their respective degree programs experienced “freedom”, “curiosity”, and “inquiry” when using the e-portfolio to manage their learning. A clear relationship thus exists between emotions, motivation, and e-portfolio use, which appears to confirm that work in virtual contexts with this strategy stimulates student motivation.
1. Introduction
We live in a world where constant change and adaptation have altered our way of seeing society, the world, and our interactions. The COVID-19 pandemic is having an especially powerful impact on education, particularly in methodological strategies and their practical implications for university classrooms.
Higher education institutions worldwide are having to shift from classroom to online teaching environments in a very short time. This change is a challenge for teachers, who must find new teaching methodologies to make teaching and learning processes flexible while fostering autonomous work and strengthening students’ commitment to their own learning process [1]. Information and communication technologies (ICTs) are a key element in facing this challenge to construct environments that facilitate communication and the exchange of learning experiences between teachers and students [2].
Now is a good time for faculties to begin the process of reflecting on the methodological change involved in developing university teaching that fosters the use of virtual environments in combination with classroom spaces to maximize the benefit of both [3,4]. Such methods must also seek flexible, dynamic, autonomous learning experiences in which students participate actively.
To achieve this goal, this article focuses on one experience, in which the digital portfolio or e-portfolio is used as a learning and assessment tool.
2. Theoretical Framework
Among various definitions, the portfolio has been defined as “an organized compilation of documents or artifacts that can be used to demonstrate knowledge, skills, values and/or achievements which contains a commentary or exegesis to explain the relevance, credibility and meaning of each artifact or document” [5] (p. 270). This definition captures the two main contributions of portfolios: they enable the student to design, organize, make decisions, and assess, and they have the potential to gather experiences, reflecting on them and facilitating students’ management of their learning [6,7]. The two main purposes of portfolios are thus to reflect the final product of the student’s learning [8,9] and to serve as aids in the learning process [10,11]. When the portfolio is created in a digital format, it is called a digital portfolio or e-portfolio. This format has the advantage of integrating multiple formats (video, sound, text, animation, etc.) and enabling sharing of the content with a greater number of people [12].
An e-portfolio is a collection of student/teacher work gathered for the purpose of documenting the experience [13]. It is also used to help learners reflect on their work and their academic progress [14,15,16]. In this context, the portfolio can play an important role in improving the process of teaching, learning, and assessment of students and supporting teachers’ practices.
In the context of the university, students must concern themselves with the important role their autonomy and responsibility play in the acquisition of new knowledge. The portfolio intervenes to mediate between understanding and the management and self-regulation of learning. This study is particularly interested in this contribution of the portfolio to students’ self-regulation of their learning and how its use manifests in their emotions. Following Panadero and Alonso-Tapia [17], we argue that “self-regulation is the control that students have over their cognition, behaviour, emotions and motivation through the use of personal strategies to achieve the goals they have established” (pp. 250–251). This process can be described as a three-phase cycle (forethought, performance, and self-reflection) in which students plan their learning, carry it out, and finally assess the results of the process [18]. The tasks performed in these phases can be supported and facilitated by the portfolios, thus strengthening students’ autonomous learning [11,19].
This study focuses on analyzing emotions, particularly the emotions the students feel when working with the e-portfolio because knowing students’ emotional states during the teaching-learning process can help the teacher to improve this process [20]. In this paper, we use the definition of emotion proposed by Bisquerra [21]: “Emotion is a complex state of an organism characterized by an excitation or perturbation that predisposes to an organized response. Emotions are generated in response to an external or internal event” (p. 12).
Many classifications and taxonomies of emotions can be found in the literature. Dar-win started the biological study of emotions [22], describing and comparing diverse uni-versal facial expressions. Many authors, for example, Ekman [23], Damasio [24], and Goleman [25], have tried to establish classifications of basic emotions. However, there is still no accepted categorization.
Researchers and educators currently accept the idea of teaching as practice influenced by cognitive and affective processes [26,27,28]. Recent studies show that emotion and cognition are interrelated in intricate ways, and emotion is a complex phenomenon that includes cognitive and contextual processes that interact in a two-way relationship. In analyzing students’ affective states relative to different educational activities, Guedes and Mutti [29] find that students experience states indicating anxiety (fear, worry, stress, anxiety, etc.) and motivation (enthusiasm, pride, well-being, etc.), suggesting the importance of the emotional dimension of educational processes.
Emotions are widely recognized as important factors in determining the results of student success [30,31]. Emotional reaction optimizes rather than inhibits the results of learning [30,31,32]. Positive emotions, such as feelings of success, have the potential to aid learning by increasing self-efficacy and motivation [33].
Negative emotions, however, such as failure, anger, and anxiety, can have the opposite effect on motivation and effort, negatively affecting students’ learning [33,34,35].
The emotions analyzed in this study are both positive (freedom, motivation, curiosity, and inquiry) and negative (disorientation and waste of time). These six emotions are used in similar studies performed in contexts of higher education similar to ours (Table 1).
According to this classification, positive emotions are those that ensure well-being, but the act of classifying emotions into positive and negative does not imply that they are “good” and “bad”: both positive and negative emotions are important in people’s behavior [42]. Taking an evolutionary perspective, Robert Plutchik asserts that states of feeling tend to be followed by impulses to action: emotion is a chain of events and part of a social regulation process [43]. Some emotions incite us to act, while others paralyze us [42].
These studies (Table 1) show that the main emotions experienced during the use of different methodological strategies tend more toward a level of emotional well-being rather than of ill-being [36,37]. In these studies, affective states such as happiness, excitement, pleasure, and pride (considered affective states of motivation) predominate [29]. There is also a deep positive feeling of anticipation and enthusiasm when students participate in teaching-learning activities [39]. The studies also show that indirect learning activities (less similar to real situations) and interactive activities (in teams) are associated with lower levels of anxiety [29,39].
As a whole, the existing research suggests that positive emotional experiences play an important role in shaping academic performance and can have a considerable impact on students’ cognition, behavior, and, ultimately, success in the academic realm [9,13].
The emotional dimension has been shown to be a very important factor in teaching-learning processes. In fact, with regard to e-learning and distance learning, and especially interesting line of study has been opened on the emotional relation to new learning tools and content [44,45,46]. This new line of research focuses on resistance, attitudes, and emotions related to the use of technologies as a learning resource. More research is needed, however, on the wide variety of emotions that arise and the relations between them.
To advance knowledge in this field, this study analyzes the different emotions students experience in preparing an e-portfolio in a virtual teaching and learning environment.
The objectives of this study are: (a) to describe the emotions the students experience; (b) to determine the differences according to the participants’ sociodemographic, academic, and relational variables: age, sex, academic year, degree program, course in which they were enrolled, and subject; and (c) to analyze the possible relationships between the variables studied.
This article enables us to find out what emotions are experienced by students during the use of the e-portfolio and to discover their interrelations. The aim is thus to better understand the learning processes that are developed with the aid of e-portfolios, thereby contributing to the improvement of their implementation as a didactic strategy.
3. Materials and Methods
The study presented here adopted a descriptive-exploratory design with a cross-sectional, quantitative focus. This design and method were chosen due to the study’s use of a survey as the data collection instrument to approximate reality in an objective and generalizable way [47].
3.1. Participants
The sample was selected using nonprobability convenience sampling [48]. Participants were accessed through the classroom in which the experience with e-portfolios occurred.
The sample was composed of 358 students enrolled in different subjects during the academic years 2018/2019 and 2019/2020, in undergraduate degree programs at the University of Granada (Spain) in Primary Education, Early Childhood Education, Social Education, Pedagogy, and Speech Therapy. The sample was significant, with a sampling error of less than 3% [49]. Table 1 presents all of the sociodemographic and academic data in the sample.
Of the participants, 70.4% (n = 252) were between 18 and 22 years of age, with an average age of 21.76 (SD = 3.98). Sex was biased toward women, with 86.9% (n = 311) compared to 13.1% (n = 47) men. Regarding the academic year surveyed, over half of the participants (62% (n = 222)) were students in 2019–2020, and 38% (n = 136) were students in 2018–2019. Most (40.5% (n = 145)) were students in the Early Childhood Education degree program. The rest were distributed as follows: 23.5% (n = 84) in Pedagogy, 18.2% (n = 65) in Social Education, 16.5% (n = 59) in Primary Education (Bilingual), and 1.4% (n = 5) in Speech Therapy. Finally, e-portfolios were used in 10 subjects. Table 2 presents the distribution of the students in these subjects.
3.2. Study Design and Instruments
The instrument used was an ad hoc questionnaire [50,51]. The emotions analyzed were both positive (freedom, motivation, curiosity, and inquiry) and negative (disorientation and waste of time), as explained in the introduction.
The students were asked to indicate the degree to which they experienced the emotions proposed when using the e-portfolio. They recorded their responses on the following Likert scale: 1 “Not at all”, 2 “A little”, 3 “Somewhat”, 4 “Quite a lot”, and 5 “A lot”. Version of questionnaire can be found in Appendix A. The instrument used was subjected to validity testing through exploratory factor analysis (EFA) to determine the scale’s goodness of fit and validity [52]. Confirmatory factor analysis (CFA) established the validity and reliability of the model fit [53].
The model obtained through the EFA produced two factors that explained 71% of the variance. Psychometric properties with values of NNFI (non-normed fit index) (0.986), CFI (comparative fit index) (0.996), GFI (goodness of fit index) (0.998), AGFI (adjusted goodness of fit index) (0.993), and RMSEA (root mean square error of approximation) (0.043) indicated an excellent fit and an acceptable model. CFA confirmed the factor structure obtained, producing the values for the RMSEA (0.039), SRMR (standardized root mean squared residual) (0.032), CFI (0.972), and TLI (Tucker–Lewis index) (0.948). The consistency of the two factors may be considered as highly reliable for values of 0.950 for Factor 1 (positive emotions) and 0.892 for Factor 2 (negative emotions). The results obtained indicate that the instrument used was highly valid and reliable for determining the emotions the students experienced when using ICT methodologies such as the e-portfolio [54,55,56].
3.3. Procedure
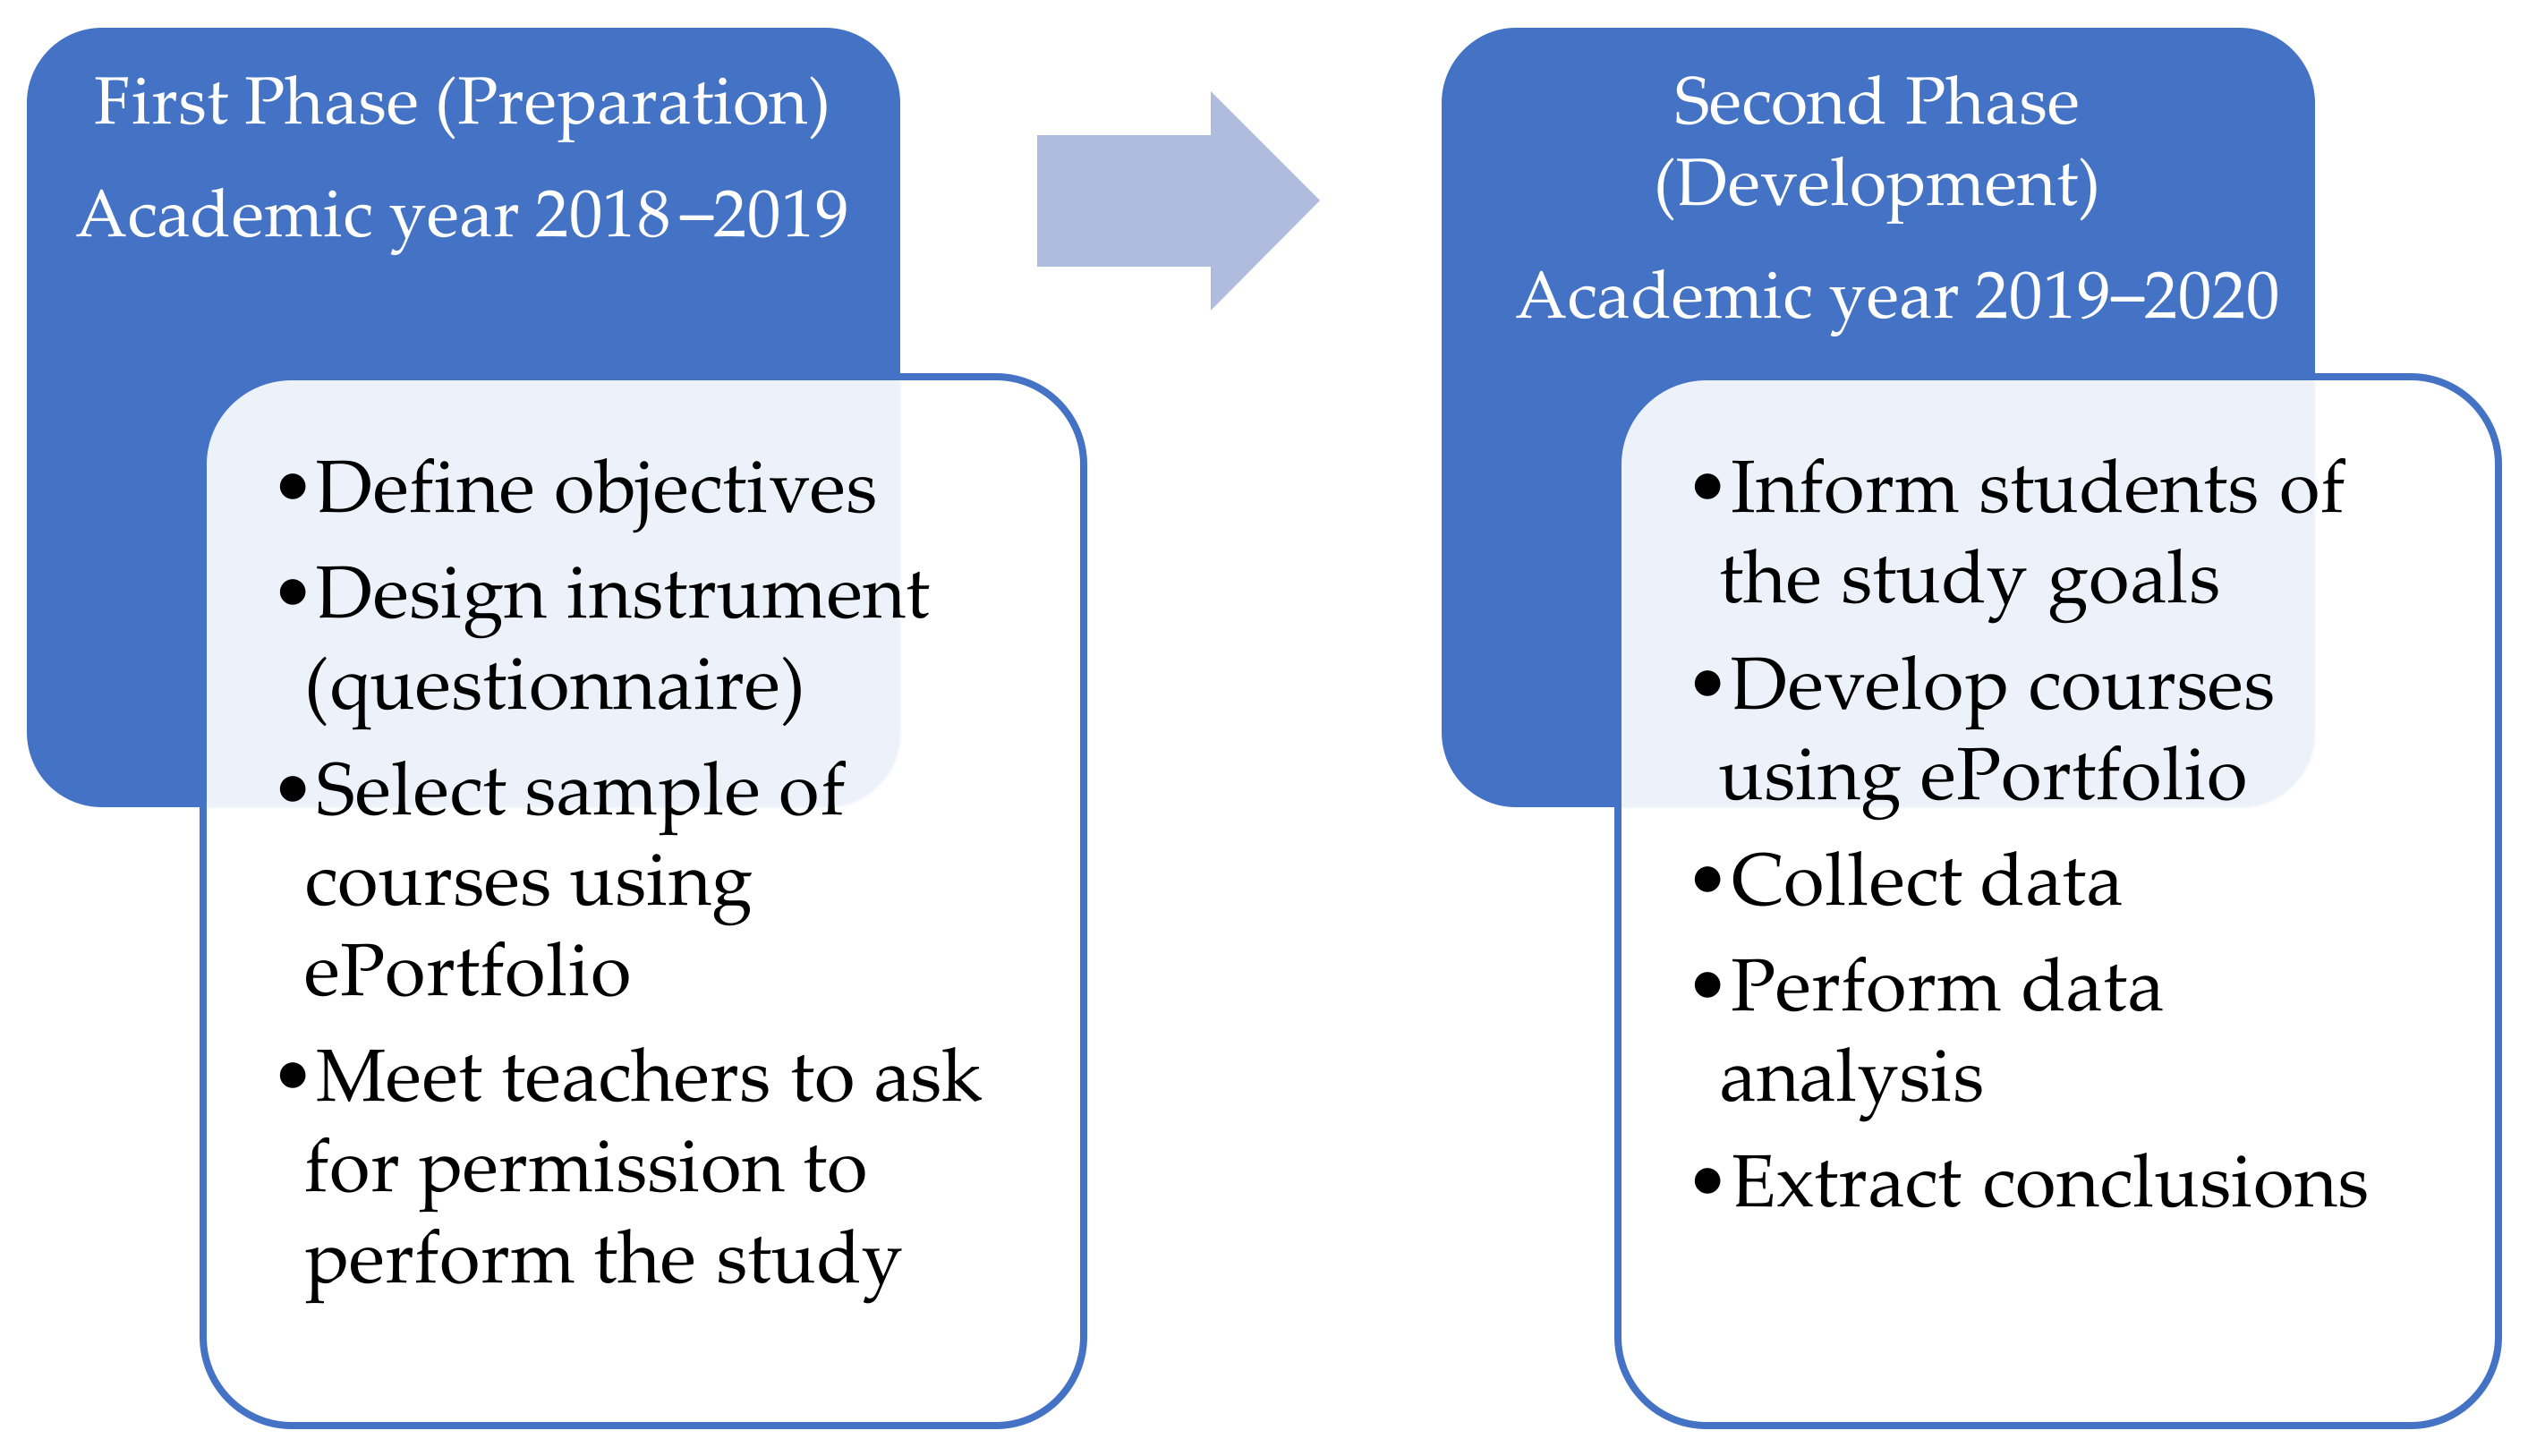
To ensure that the research was reliable and responsible, the study followed the ethical guidelines established by the research team’s university (no. 192/CEIH/2020). The study was performed in the following phases. First, the researchers determined the sample needed to perform the study. A meeting was then held with the professors teaching the undergraduate courses to obtain access to the sample. The professors provided the team permission to perform the study, enabling the researchers to select the sample and create and complete the instrument with the participants’ informed consent.
In the second phase, the researchers informed the students of the study goals and assured them that their participation would be voluntary and anonymous. The researchers also explained the procedure for accessing the online questionnaire, located on the University of Granada’s PRADO platform. Students who wished to complete the questionnaire had one week to do so. Figure 1 shows the procedure followed in this study.
3.4. Data Analysis
The statistical package IBM SPSS version 24 was used for the data analysis, as it was appropriate for the study objectives. The packages Factor Analysis version 10.10.01 and CFA [57] (M-PLUS) were used to validate the instrument employed [38]. First, to achieve the objectives, descriptive (mean and standard deviation) and frequency analyses were performed to characterize the sample. Second, the sample was tested for normality and homogeneity. The results indicated that we should proceed to the nonparametric statistic because Kolmogorov–Smirnov’s test obtained results below 0.05. Third, to examine the comparisons between groups, we performed the Mann–Whitney u test for the variables age, sex, and academic year, and the Kruskal–Wallis test for the variables degree program, year in degree program, course, and subject. The goal was to define which groups showed significant differences between each other according to the variables studied. Finally, we calculated the Spearman nonparametric rank correlation to determine the relationship between the different emotions the students experienced.
4. Results
Table 3 presents the descriptive results for the different emotions the students experienced while using the e-portfolio. As the data show, the emotions the students experienced were mostly positive. The students responded that they experienced “some” emotions, such as freedom (3.91), motivation (3.63), curiosity (3.80), and inquiry (3.73) while using the e-portfolio for their learning. They also experienced disorientation (2.78) and waste of time (2.07) but to a lesser extent.
We found statistically significant differences based on age in the students’ experience of both positive and negative emotions (Table 4). Students aged 23 or older experienced a greater sensation of “waste of time” (Z = −2.73, p < 0.05). Although both groups experienced “some” feeling of “curiosity”, students aged 18–22 were the primary group indicating this feeling (Z = −2.02, p < 0.05).
Regarding sex (Table 5), statistically significant differences were only obtained for the feeling of “freedom” (Z = −2.71, p < 0.05). The men stated that they experienced considerably more freedom than the women when using the e-portfolio to manage their learning.
If we examine the academic year during which the students were enrolled at the time of the survey, we find statistically significant differences in all emotions except “motivation” (Table 6). Students enrolled in the academic year 2018–2019 experienced more “freedom” (Z = −2.24, p < 0.05), “curiosity” (Z = −2.71, p < 0.05), and “inquiry” (Z = −2.17, p < 0.05) from use of the e-portfolio to manage their learning than the students registered in 2019–2020. The students registered in 2019–2020, in contrast, indicated that they were more disoriented (Z = −2.78, p < 0.05) and considered the use of the e-portfolio as a “waste of time” (Z = −2.14, p < 0.05).
When applying an independence hypothesis test between belonging to one of the degree programs (Primary Education, Early Childhood Education, Social Education, Pedagogy, and Speech Therapy) and experiencing emotions when using the e-portfolio (Table 7), we observed statistically significant differences in the feelings of “curiosity” (χ2 = 12.404, p < 0.05) and “inquiry” (χ2 = 10.586, p < 0.05). Students in the degree program of Pedagogy indicated that they felt more “curiosity” (4.05) and “inquiry” (3.98) when using the e-portfolio to manage their learning than did students in the other degree programs.
The results by academic year (see Table 8) show the following differences in positive emotions: “freedom” (χ2 = 7.852 p < 0.05), “curiosity” (χ2 = 11.236, p < 0.05), and “inquiry” (χ2 = 14.269, p < 0.05). Students in the third year of their respective degree programs experienced primarily emotions such as “freedom” (4.20), “curiosity” (4.13), and “research” (4.16) when using the e-portfolio to manage their learning.
The results for the subjects in which the e-portfolio was applied as a teaching-learning strategy (Table 9) show differences in negative emotions, such as “disorientation” (χ2 = 25.956, p < 0.05) and “waste of time” (χ2 = 27.147, p < 0.05), and in positive emotions, such as “freedom” (χ2 = 17.788, p < 0.05) and “motivation” (χ2 = 16.510, p < 0.05). Students in “School and Classroom Organization in Early Childhood Education” experienced greater disorientation (3.29), followed by students in “General Didactics” (3.04). We observe lower levels of positive feeling among students in “Optimization of Development and Workplace Risk Prevention”. The e-portfolio was most strongly felt to be a “waste of time” by students in “School and Classroom Organization in Early Childhood Education” (2.82), followed by students in “Didactics of Early Childhood Education” (2.36) and, to a lesser extent, students in “Employability, Training, and Work Placement” (1.67).
The positive feeling of “freedom” was experienced primarily by students in “Employability, Training, and Work Placement” (4.27), followed by those in “Didactic-Technological Resources Applied to Ed.” (4.09) and “Optimization of Development and Workplace Risk Prevention” (4.09). The least emotion was felt by students in “School and Classroom Organization in Early Childhood Education” (3.49). Motivation was experienced primarily by students in “Employability, Training, and Work Placement” (3.94). The least motivation was felt by the students in “School Context and Speech Therapy”.
The correlation analysis (Table 10) showed statistically significant associations, both positive (direct) and negative (inverse), in students’ emotions when using the e-portfolio. For the positive emotions, there were low correlations between both “motivation” and “freedom” (rS = 0.391, p < 0.05), and “curiosity” (rS = 0.392, p < 0.05) and “inquiry” (rS = 0.350, p < 0.05) with “waste of time”. Similarly, a moderate correlation was found between “waste of time” and “disorientation” (rS = 0.497, p < 0.05). Suitable correlations were obtained between inquiry” and “motivation” (rS = 0.609, p < 0.05), and “inquiry” and “curiosity” (rS = 0.680, p < 0.05).
Low negative associations were obtained between “freedom” and “waste of time” (rS = −0.289, p < 0.05) and between “curiosity” (rS = −0.291, p < 0.05) and “inquiry” (rS = −0.272, p < 0.05), respectively, with “disorientation”. Moderate associations were found between the pairs “motivation” and “disorientation” (rS = −0.407, p < 0.05), “motivation” and “waste of time” (rS = −0.471, p < 0.05), “curiosity” and “freedom” (rS = −0.4048, p < 0.05), and “inquiry” and “freedom” (rS = −0.429, p < 0.05).
The findings thus show that as students’ experience of emotions such as “motivation” and “curiosity” increase, their feeling of “inquiry” in using the e-portfolio to manage their learning also increases.
5. Discussion
According to the theoretical background, the e-portfolio increases students’ participation in their learning in a systematic and organized way [58]. Moreover, this involvement encourages continuous and systematized reflection, making students aware of their starting point, their planning, the establishment and modification of goals, the learning process, and the evaluation of the final product. Although this whole process is guided and planned by the teacher [59], sharing the responsibility for learning with the students can generate different emotions in them. However, the use of e-portfolios does not entail the direct construction of knowledge.
This article seeks to show the emotions that students feel in their learning processes because, according to the literature, this could have some implications for their performance. In fact, recent studies suggest that one of the main differences between successful and unsuccessful students lies in their ability to regulate emotions [60].
Our study describes the emotions experienced by students during the use of e-portfolios in learning. The results show that positive emotions are foremost and above average, ranked as follows from strongest to weakest: freedom, motivation, curiosity, and inquiry. According to our study, the students responded that they experienced negative emotions (disorientation and waste of time) less strongly. These results agree with those obtained by Rebollo et al. [39], who also find a greater presence and variety of positive than negative emotions associated with online learning.
The emotion of “freedom” that students experience to a major degree can show that students are comfortable in their role as knowledge builders through the e-portfolio. This feeling implies that students are in a position to control their learning and are free to handle their own reflection processes. The e-portfolio also provides a significant environment for continuing to perform the cyclical process of self-regulation: forethought, performance, and self-reflection [61,62].
Furthermore, the digital media used in the e-portfolio can vary greatly. Choice of one medium or another depends on the learning context. Teachers can even encourage students to look for new tools that allow them to document their own evidence of their learning. That is, the teacher may include only a digital medium in which students can record their evidence (e.g., a blog) or save their documents or other evidence on the cloud through different tools, increasing this feeling of freedom. In the latter case, students can explore and discover for themselves the best way to represent their work and illustrate their learning outcomes [63].
Most students stated that building the e-portfolio was not a “waste of time”. The e-portfolio is a useful tool both for the teacher and their teaching and for the student and their learning. It is therefore a medium that brings together reflection and collaboration from both teacher and student [63].
By age, students 23 or older in our study experienced the e-portfolio as a “waste of time”, in contrast to the 18–22 age group, which experienced primarily “curiosity”. According to these results, we could conclude that the influence of age is similar to that predicted by the factors generating the digital gap incompetence in ICT use [64,65,66]. Based on this gap, younger students would feel more comfortable with the use of technologies and specifically with the e-portfolio.
The variable identifying sex also showed significant differences in the emotion “freedom” in the results of our study. Men experienced this emotion to a greater extent than women, perhaps due to men’s greater consumption of technologies and the different use each sex makes of them (sex gap) [67].
By academic year, the data obtained indicate that the students enrolled in 2018/2019 experienced freedom, curiosity, and inquiry, whereas the students enrolled in 2019/2020 expressed greater disorientation and waste of time. These results may be related to the results on degree programs and year in each program.
Our results show that the students in the degree program of Pedagogy expressed having experienced more curiosity and inquiry than students in the other degree programs. Regarding the year in the degree program, students in the third year of their respective degree programs experienced “freedom”, “curiosity”, and “inquiry” when using the portfolio to manage their learning. These results agree with the research on the self-regulation of learning as a prerequisite for distance learning, which requires more use of self-regulated learning strategies as mediators for academic achievement (to tackle tasks). In light of our results, we can affirm that the students in the last years of their program, as well as students in the degree program of Pedagogy, show greater use of these strategies, encouraging more autonomous work (and strategies in which they must self-regulate their learning). We also found differences in the experience of both negative and positive emotions according to subject. We can therefore confirm that the subject studied and the approach to using e-portfolios can also be decisive factors in the results and emotions of this methodology (appropriate teaching strategies) as a learning tool (acquisition of knowledge).
Emotions play a fundamental role in knowledge acquisition, which involves cognitive, emotional, and social processes [26,28,68]. A clear relationship thus exists between emotions, motivation, and e-portfolio use, thus confirming that work in virtual contexts stimulates motivation in students. Our results reveal that motivation is the second-most-mentioned emotion [69].
The correlation analysis showed statistically significant associations, both positive (direct) and negative (inverse), in the students’ experience of emotions when using the e-portfolio.
Among other objectives, the e-portfolio pursues the goal of making students protagonists and participants in their own learning. As we mentioned in the introduction, there is clear evidence in the literature of the link between the use of the e-portfolio and students’ capacity for self-regulation. [63]. The positive emotions show a suitable correlation of “inquiry” to “motivation” and “curiosity”. Analysis of the negative associations showed a moderate correlation between the pairs “motivation” and “disorientation”, “motivation” and “waste of time”, “curiosity” and “freedom”, and “inquiry” and “freedom”.
Emotions are present in each of the learning experiences, exerting either a positive (motivating) or negative (hindering) influence [70]. The study demonstrates that as students’ experience of emotions such as “motivation” and “curiosity” increases, so does their experience of “inquiry” when using the e-portfolio to manage their learning. Motivation causes willingness to acquire new knowledge and skills based on interest and passion for technology [12,71].
Students will be more motivated to learn when they experience positive emotions [72]. Furthermore, research has shown that negative emotional states arising from the feelings of disorientation and waste of time have a direct negative influence on learning results [33]. However, we were unable to establish this relationship using our results.
Nevertheless, we can confirm the positive correlation of inquiry with motivation and curiosity, which can increase academic performance and optimization of the learning process. Other studies highlight this relationship, such as that by Elizondo, Rodríguez, and Rodríguez [73].
Emotions influence the intrinsic motivation to learn, which is based on interest and curiosity in learning, as well as extrinsic motivation to achieve positive results or avoid negative ones. Pekrun [74] describes these emotions as “achievement emotions” because they involve academic goals. Both positive and negative emotions can activate or deactivate motivation, whether during the activity or in the results. This finding leads us to advocate for the incorporation of new methodological approaches that bid primarily for strengthening the student’s intrinsic motivation [75].
It is therefore necessary to pay more attention to the emotions that develop in class in order to improve students’ motivation and engagement in learning, and thus, ultimately, their academic results [76].
6. Conclusions
This research was carried out as a part of a study of the emotions that students feel when they work with the e-portfolio. We started from the assumption that knowing students’ emotional states during the teaching-learning process can help the teacher to improve this process. From the results obtained, it can be concluded that (first objective) positive emotions are foremost and above average, ranked as follows from strongest to weakest: freedom, motivation, curiosity, and inquiry. The students evaluated negative emotions (disorientation and waste of time) as experienced less strongly. The use of the e-portfolio as a didactic strategy therefore helps to provide focus to tasks, and it is perceived as a useful strategy for learning by the students.
According to the second objective, by age, students who were 23 or older experienced the e-portfolio as a “waste of time”. This finding contrasts with the results for the 18–22 age group, which experienced primarily “curiosity”. The variable identifying sex also showed significant differences in “freedom”. Men experienced this emotion to a greater extent than women. By academic year, the students enrolled in 2018/2019 experienced freedom, curiosity, and inquiry, whereas the students enrolled in 2019/2020 expressed greater disorientation and waste of time. The students in the degree program in Pedagogy expressed that they had experienced more curiosity and inquiry than students in the other degree programs. As to year in degree program, students in the third year of their respective degree programs experienced “freedom”, “curiosity”, and “inquiry” when using the e-portfolio to manage their learning.
Finally, in accordance with the third objective, correlation analysis showed statistically significant associations, both positive (direct) and negative (inverse), in the students’ experience of emotions when using the e-portfolio. The study demonstrates that, as students’ experience of emotions such as “motivation” and “curiosity” increases, their experiences of “inquiry” also increases when they use the e-portfolio to manage their own learning.
The research presented here has some limitations. For example, there has been no comparison of the results obtained with groups in which a regular portfolio was used. Such a contrast would enable an analysis of the real impact of technology in the motivation students to perceive in the process of portfolio building. In addition, these students could be contrasted with a group in which a traditional methodology other than the portfolio was used. Furthermore, the field of Social Sciences has limitations in the development of research studies, which is related to sample size. In this regard, the present study used a specific sample of students, which initially enabled the validation of the instrument created. Although its results cannot be generalized, they can serve as the basis for future research using random samples of the population as the starting point. However, since the data are unbalanced and have no element of randomization, the results of the inferential study are tenuous.
The emotional dimension has been shown to be a very important factor in teaching-learning processes. Based on this study, future lines of research could include: comparing the emotions experienced by students with their academic performance to determine whether emotions influence learning; studying emotions in virtual learning processes by combining quantitative and qualitative techniques; contrasting the emotions experienced by students and teachers, or even deepening the study according to the different academic years.
Author Contributions
E.C.M., V.G.S. and M.A.R.L. conceived the hypothesis of this study. E.C.M., V.G.S. and M.A.R.L. participated in data collection. E.C.M. analyzed the data. All authors contributed to data interpretation in the statistical analysis. All authors wrote the paper with significant input from E.C.M. All authors have read and agreed to the published version of the manuscript.
Funding
This research received no external funding.
Institutional Review Board Statement
The study was conducted according to the guidelines of the Declaration of Helsinki, and approved by the Ethic Committee of University of Granada (protocol code no. 192/CEIH/2020 date 09 October 2020).
Informed Consent Statement
Informed consent was obtained from all subjects involved in the study.
Data Availability Statement
The data presented in this study are available on request from the corresponding author.
Conflicts of Interest
The authors declare no conflict of interest.
Appendix A

Table A1.
Emotions questionnaire.
| Indicate the degree to which you have experienced the emotions stated below when using the e-portfolio. For each statement, mark the box corresponding to your degree of agreement or disagreement, according to your personal preference and based on the following scale:
| |||||
| Emotions | 1 | 2 | 3 | 4 | 5 |
| Disorientation | |||||
| Waste of time | |||||
| Freedom | |||||
| Motivation | |||||
| Curiosity | |||||
References
- Espino-Díaz, L.; Fernandez-Caminero, G.; Hernandez-Lloret, C.M.; Gonzalez-Gonzalez, H.; Alvarez-Castillo, J.L. Analyzing the impact of COVID-19 on education professionals: Toward a paradigm shift: ICT and neuroeducation as a binomial of action. Sustainability 2020, 12, 5646. [Google Scholar] [CrossRef]
- Cabero Almenara, J.; Ruiz-Palmero, J. Las tecnologías de la información y comunicación para la inclusión: Reformulando la brecha digital. IJERI Int. J. Educ. Res. Innov. 2017, 9, 16–30. Available online: https://www.upo.es/revistas/index.php/IJERI/article/view/2665 (accessed on 21 March 2021).
- Renfrew, M.J.; Bradshaw, G.; Burnett, A.; Byrom, A.; Entwistle, F.; King, K.; Thomas, G. Sustaining quality education and practice learning in a pandemic and beyond: ‘I have never learnt as much in my life, as quickly, ever’. Midwifery 2021, 94, 102915. [Google Scholar] [CrossRef] [PubMed]
- Secundo, G.; Mele, G.; Del Vecchio, P.; Elia, G.; Margherita, A.; Ndou, V. Threat or opportunity? A case study of digital-enabled redesign of entrepreneurship education in the COVID-19 emergency. Technol. Forecast. Soc. Chang. 2021, 166, 120565. [Google Scholar] [CrossRef]
- Cooper, T.; Love, T. e-Portfolios in e-learning. In Advanced Principles of Effective E-Learning; Informing Science Press: Santa Rosa, CA, USA, 2007; pp. 267–292. [Google Scholar]
- Bahous, R. The self-assessed portfolio: A case study. Assess. Eval. High. Educ. 2008, 33, 381–393. [Google Scholar] [CrossRef]
- Hartnell-Young, E.; Harrison, C.; Crook, C.; Pemberton, R.; Joyes, G.; Fisher, T.; Davies, L. Impact Study of E-Portfolios on Learning. 2007. Available online: https://dera.ioe.ac.uk/1469/7/becta_2007_eportfolios_report_Redacted.pdf (accessed on 20 March 2021).
- Arís, N.; Fuentes, M. La elaboración del portafolio a través del trabajo cooperativo y la autoevaluación. Rev. Iberoam. Educ. 2016, 71, 9–28. [Google Scholar] [CrossRef]
- Salazar, S.; Arévalo, M. Implementación del portafolio como herramienta didáctica en educación superior: Revisión de literatura. Rev. Complut. Educ. 2019, 30, 965–981. [Google Scholar] [CrossRef]
- Santa Cruz, S.; Ipiña, N.; Astigarraga, E. Teachers’ perceptions about the use of the Learning ePortfolio as learning and assessment tool in Mondragon Unibertsitatea. In Proceedings of the HEAD’19, 5th International Conference on Higher Education Advances, València, Spain, 26–28 June 2019; pp. 751–758. [Google Scholar]
- Abrami, P.C.; Venkatesh, V.; Meyer, E.J.; Wade, C.A. Using electronic portfolios to foster literacy and self-regulated learning skills in elementary students. J. Educ. Psychol. 2013, 105, 1188–1209. [Google Scholar] [CrossRef]
- Komló, C. Indicators related to the educational application of eportfolios. In Digital Turn in Schools—Research, Policy, Practice; Springer: Singapore, 2019; pp. 269–296. [Google Scholar]
- Barak, L.; Maskit, D. Portfolio as ‘Documenting experience’. In Methodologies of Mediation in Professional Learning; Springer International: Haifa, Israel, 2017; pp. 75–90. [Google Scholar]
- Cebrián, M.; Bartolomé, A.; Cebrián, D.; Ruiz, M. Estudio de los portafolios en el practicum: Análisis de un PLE-Portafolio. Relieve 2015, 21, 1–18. [Google Scholar] [CrossRef] [Green Version]
- Sobrados, M. El trabajo docente en grupos numerosos: Experiencias en el uso del portafolio. Opción 2016, 32, 773–788. Available online: https://dialnet.unirioja.es/servlet/articulo?codigo=5875195 (accessed on 21 March 2021).
- Arbesú, M.; Gutiérrez, E. El portafolio formativo un recurso para la reflexión y autoevaluación en la docencia. Perf. Educ. 2014, 36, 105–123. [Google Scholar]
- Panadero, E.; Alonso-Tapia, J. How do students self-regulate? Review of Zimmerman’s cyclical model of self-regulated learning. Ann. Psicol. 2014, 30, 450–462. [Google Scholar] [CrossRef] [Green Version]
- Tur, G.; Urbina, S.; Forteza, D. Rubric-based formative assessment in process Eportfolio: Towards self-regulated learning. Dig. Educ. Rev. 2019, 35, 18–35. Available online: https://revistes.ub.edu/index.php/der/article/view/22614 (accessed on 21 March 2021).
- Alexiou, A.; Paraskeva, F. Examining self-regulated learning through a social networking ePortfolio in higher education. Int. J. Learn. Technol. 2019, 14, 162–192. [Google Scholar] [CrossRef]
- Lujan, H.L.; Raizada, A.; DiCarlo, S.E. Critical skill of teaching: Learning the cognitive and emotional states of our students during class. Adv. Physol. Educ. 2021, 45, 59–60. [Google Scholar] [CrossRef] [PubMed]
- Bisquerra, R. Psicopedagogía de las Emociones; Editorial Síntesis: Madrid, Spain, 2009. [Google Scholar]
- Darwin, C. La expresión de las Emociones; Alianza Editorial: Madrid, Spain, 1872. [Google Scholar]
- Ekman, P. An argument for basic emotions. Cogn. Emot. 1992, 6, 169–200. [Google Scholar] [CrossRef]
- Damásio, A. El error de Descartes. La razón de las Emociones; Editorial Andrés Bello: Santiago, Chile, 1994. [Google Scholar]
- Goleman, D. Inteligencia Emocional; Kairós: Barcelona, Spain, 1995. [Google Scholar]
- Hargreaves, A. Mixed emotions: Teachers’ perceptions of their interactions with students. Teach. Teach. Educ. 2000, 16, 811–826. [Google Scholar] [CrossRef]
- Koballa, T.R.; Glynn, S.M. Attitudinal and motivational constructs in science learning. In Handbook of Research on Science Education; Erlbaum: Mahwah, NJ, USA, 2007; pp. 75–102. [Google Scholar]
- Shapiro, S. Revisiting the teachers’ lounge: Reflections on emotional experience and teacher identity. Teach. Teach. Educ. 2010, 26, 616–621. [Google Scholar] [CrossRef]
- Guedes, S.; Mutti, C. Affections in learning situations: A study of an entrepreneurship skills development course. J. Workplace Learn. 2010, 23, 195–208. [Google Scholar] [CrossRef]
- Rowe, A.D.; Fitness, J.; Wood, L.N. University student and lecturer perceptions of positive emotions in learning. Int. J. Qual. Stud. Educ. 2015, 28, 1–20. [Google Scholar] [CrossRef]
- Su, Y.; Chung, Y. Understanding the emotional reactions and exploring the professional development of college students based on reflections. Teach. High. Educ. 2015, 20, 285–299. [Google Scholar] [CrossRef]
- Bevitt, S. Assessment innovation and student experience: A new assessment challenge and call for a multi-perspective approach to assessment research. Assess. Eval. High. Educ. 2014, 40, 103–119. [Google Scholar] [CrossRef] [Green Version]
- Kahu, E.; Stephens, C.; Leach, L.; Zepke, N. Linking academic emotions and student engagement: Mature-aged distance students’ transition to university. J. Furth. High. Educ. 2015, 39, 481–497. [Google Scholar] [CrossRef]
- Falchikov, N.; Boud, D. Assessment and emotion: The impact of being assessed. In Rethinking Assessment in Higher Education: Learning for the Longer Term; Routledge: London, UK; New York, NY, USA, 2007; pp. 144–155. [Google Scholar]
- Goralnik, L.; Millenbah, K.F.; Nelson, M.P.; Thorp, L. An environmental pedagogy of care: Emotion, relationships, and experience in higher education ethics learning. J. Exp. Educ. 2012, 35, 412–428. [Google Scholar]
- Rebollo Catalaán, M.A.; García Pérez, R.; Barragán Sánchez, R.; Buzón García, O.; Vega Caro, L. Las emociones en el aprendizaje online. RELIEVE 2008, 14, 1–23. Available online: http://www.uv.es/RELIEVE/v14n1/RELIEVEv14n1_2.htm (accessed on 21 March 2021). [CrossRef] [Green Version]
- Rebollo-Catalán, A.; Vico-Bosch, A.; García-Pérez, R. El aprendizaje de las mujeres en las redes sociales y su incidencia en la competencia digital. Rev. Prism. Soc. 2015, 15, 122–146. Available online: http://www.isdfundacion.org/publicaciones/revista/numeros/15/secciones/tematica/t_04_mujeres-rrss.html (accessed on 21 March 2021).
- Schutz, P.; Pekrun, R. Emotion in Education; Academic Press: San Diego, CA, USA; Mexico City, Mexico, 2007. [Google Scholar]
- Askham, P. The Feeling’s Mutual: Excitement, Dread and Trust in Adult Learning and Teaching. Sheffield Hallam University, Sheffield. Education Department. 2001. Available online: http://shura.shu.ac.uk/13304/ (accessed on 20 February 2021).
- Jarvis, P. Towards a Comprehensive Theory of Human Learning: Lifelong Learning and the Learning Society; Routledge: London, UK, 2006. [Google Scholar]
- Phelps, E. Emotion and cognition: Insights from studies of the human amygdala. Annu. Rev. Psychol. 2006, 27–53. [Google Scholar] [CrossRef] [Green Version]
- Mellado, V.; Borrachero, B.; Melo, L.V.; Dávila-Acedo, M.A.; Cañada, F.; Conde, M.C.; Costillo, E.; Cubero, J.; Esteban, R.; Martínez, G.; et al. Las emociones en la enseñanza de las ciencias. Enseñ. Cienc. 2014, 32, 11–36. [Google Scholar]
- Plutchik, R. The nature of emotions: Human emotions have deep evolutionary roots, a fact that may explain their complexity and provide tools for clinical practice. Am. Sci. 2001, 89, 344–350. [Google Scholar] [CrossRef]
- Immordino-Yang, M.H.; McColl, A.; Damasio, H.; Damasio, A.R. Neural correlates of admiration and compassion. Proc. Natl. Acad. Sci. USA 2009, 106, 8021–8026. [Google Scholar] [CrossRef] [PubMed] [Green Version]
- Grindal, T.; Hinton, C.; Shonkoff, J. The science of early childhood development: Lessons for teachers and caregivers. In Defense of Childhood; Falk, B., Ed.; Teachers College Press: New York, NY, USA, 2011. [Google Scholar]
- Rolla, A.; Hinton, C.; Shonkoff, J. The Science of Early Childhood Development: Hacia un Modelo Interdisciplinario: Biología, Interacción Social y Desarrollo Infantil Temprano; Jorge Baudino Ediciones: Buenos Aires, Argentina, 2011. [Google Scholar]
- Hernández, R.; Fernández, C.; Baptista, P. Metodología de la Investigación, 5th ed.; McGrawHill: Mexico City, Mexico, 2010. [Google Scholar]
- Otzen, T.; Manterola, C. Técnicas de muestreo sobre una población a estudio. Int. J. Morphol. 2017, 35, 227–232. [Google Scholar] [CrossRef] [Green Version]
- Morales, P. Tamaño Necesario de la Muestra: ¿Cuántos Sujetos Necesitamos? 2012. Available online: http://www.upcomillas.es/personal/peter/investigacion/Tama%F1omuestra.pdf (accessed on 9 March 2021).
- Crisol, E. Cuestionario Sobre el Uso del Portafolio. 2011. Available online: https://digibug.ugr.es/handle/10481/59285 (accessed on 2 March 2021).
- Romero López, M.A.; Crisol Moya, E. El portafolio, herramienta de autoevaluación del aprendizaje de los estudiantes: Una experiencia práctica en la Universidad de Granada. Docencia Investig. 2011, 36, 25–50. [Google Scholar]
- Bentler, P.M.; Yuan, K.H. Structural equation modeling with small samples: Test statistics. Multivar. Behav. Res. 1999, 34, 181–197. [Google Scholar] [CrossRef] [PubMed]
- Blunch, N.J. Introduction to Structural Equation Modeling Using IBM SPSS Statistics and Amos, 2nd ed.; SAGE: Thousand Oaks, CA, USA, 2013. [Google Scholar]
- Lorenzo-Seva, U. A factor simplicity index. Psychometrika 2003, 68, 49–60. [Google Scholar] [CrossRef]
- Lorenzo-Seva, U.; Van Ginkel, J.R. Multiple imputation of missing values in exploratory factor analysis of multidimensional scales: Estimating latent trait scores. Annu. Psicol. 2016, 32, 596–608. [Google Scholar] [CrossRef] [Green Version]
- Hair, J.F.; Black, W.C.; Babin, B.J.; Anderson, R.E. Multivariate Data Analysis, 8th ed.; Prentice Hall: Upper Saddle River, NJ, USA, 2018. [Google Scholar]
- Lorenzo-Seva, U.; Ferrando, P.J. FACTOR: A computer program to fit the exploratory factor analysis model. Behav. Res. Methods Instrum. Comput. 2006, 38, 88–91. [Google Scholar] [CrossRef] [Green Version]
- Serdà, B.C.; Alsina, A. El portafolio: Efectos de un proceso de implementación autorregulado. Cult. Educ. 2013, 25, 323–336. [Google Scholar] [CrossRef]
- Saltman, D.C.; Tavabie, A.; Kidd, M.R. The use of reflective and reasoned portfolios by doctors. J. Eval. Clin. Pract. 2012, 18, 182–185. [Google Scholar] [CrossRef] [PubMed]
- OECD (Organization for Economic Co-Operation and Development). Against the Odds: Disadvantaged Students Who Succeed in School; OECD iLibrary: Paris, France, 2011. [Google Scholar]
- Hadwin, A.F.; Oshige, M.; Gress, C.L.Z.; Winne, P.H. Innovative ways for using study to orchestrate and research social aspects of selfregulated learning. Comput. Hum. Behav. 2010, 26, 794–805. [Google Scholar] [CrossRef]
- Perry, N.E.; Winne, P. Key stopromoting self-regulated learning. Teach. News Mag. 2013, 25, 157–171. [Google Scholar]
- Ruiz, J.F.; Pardo, R. El ePortafolio como instrumento para fomentar la autorregulación del aprendizaje. Rev. DIM Didáct. Innov. Multimed. 2016, 34, 2–11. Available online: https://ddd.uab.cat/record/166497 (accessed on 21 March 2021).
- Bartikowski, B.; Laroche, M.; Jamal, A.; Yang, Z. The type-of-internet-access digital divide and the well-being of ethnic minority and majority consumers: A multi-country investigation. J. Bus. Res. 2018, 82, 373–380. [Google Scholar] [CrossRef]
- Freiman, V.; Martinovic, D.; Robichaud, X. New faces of digit. In Encyclopedia of Information Science and Technology, 4th ed.; Khosrowpour, M., Ed.; IGI Global: Washington, DC, USA, 2018; pp. 7248–7258. [Google Scholar]
- Schroeder, R. Towards a theory of digital media. Inf. Commun. Soc. 2018, 21, 1–17. [Google Scholar] [CrossRef]
- García-Valcárcel, A.; Tejedor, F.J. Percepción de los estudiantes sobre el valor de las tic en sus estrategias de aprendizaje y su relación con el rendimiento. Educ. XX1 2017, 20, 137–159. [Google Scholar] [CrossRef] [Green Version]
- Smith, M. Las Emociones de los Estudiantes y su Impacto en el Aprendizaje; Editorial Narcea: Madrid, Spain, 2019. [Google Scholar]
- González, A.; Carabantes, D. MOOC: Medición de satisfacción, fidelización, éxito y certificación de la educación digital. Rev. Iberoam. Educ. Distancia 2017, 20, 105–123. [Google Scholar] [CrossRef] [Green Version]
- Rotger, M. Neurociencias Neuroaprendizaje, las Emociones y el Aprendizaje; Editorial Brujas: Córdoba, Argentina, 2017. [Google Scholar]
- Karaseva, A.; Pruulmann-Vengerfeldt, P.; Siibak, A. Relationships between in-service teacher achievement motivation and use of educational technology: Case study with Latvian and Estonian teachers. Tech. Pedag. Educ. 2018, 27, 33–47. [Google Scholar] [CrossRef]
- Huertas Montes, A.; Pantoja Vallejo, A. Efectos de un programa educativo basado en el uso de las TIC sobre el rendimiento académico y la motivación del alumnado en la asignatura de Tecnología de Educación Secundaria. Educ. XX1 2016, 19, 229–250. [Google Scholar] [CrossRef]
- Elizondo Moreno, A.; Rodríguez, J.V.; Rodríguez, I. La importancia de la emoción en el aprendizaje. Didáct. Específicas 2018, 19, 37–42. Available online: https://repositorio.uam.es/handle/10486/686559 (accessed on 21 March 2021). [CrossRef]
- Pekrun, R. Las facultades de las emociones de la pretensión: Implicaciones para la enseñanza y el éxito de la investigación. La Rev. Educ. Sup. 2019, 42, 1489–1526. [Google Scholar]
- González-Zamar, M.D.; Ortiz Jiménez, L.; Sánchez Ayala, A.; Abad-Segura, E. The impact of the university classroom on managing the socio-educational well-being: A global study. Int. J. Environ. Res. Public Health 2020, 17, 931. [Google Scholar] [CrossRef] [Green Version]
- Elmi, C. Integrating social emotional learning strategies in higher education. Eur. J. Investig. Health Psychol. Educ. 2020, 10, 848–858. [Google Scholar] [CrossRef]
Figure 1.
Study procedure.

Table 1.
Emotions analyzed in the study.
| Emotions in Our Study | Most Prominent Emotions | Research | |
|---|---|---|---|
| Negative | Disorientation | Confusion-Disorientation | Rebollo-Catalán et al. (2008) [36] |
| Waste of time | Insecurity-Frustration Desperation-Lack of Interest | Rebollo-Catalán et al. (2015) [37]; Schutz and Pekrun (2007) [38] | |
| Positive | Freedom | Power Relief-Happiness Well-being | Rebollo-Catalán et al. (2008) [36]; Guedes and Mutti (2010) [29] |
| Motivation | Motivation (Enthusiasm, Pride, Well-being) | Guedes and Mutti (2010) [29] | |
| Curiosity | Generation of Curiosity | Askham (2001) [39]; Jarvis (2006) [40]; Phelps (2006) [41] | |
| Inquiry into what one has learned | Desire to Learn | Askham (2001) [39]; Jarvis (2006) [40]; Phelps (2006) [41] |
Note: Emotions in our study: Emotions considered in our study; Most prominent emotions: Emotions present in the selected research; Research: Background research.
Table 2.
Sociodemographic, academic, and relational data of the 358 students evaluated.
| Variables | n = 358 | |
|---|---|---|
| Age | 18–22 years | 252 (70.4%) |
| Over 23 years | 106 (29.6%) | |
| Sex | Female | 311 (86.9%) |
| Male | 47 (13.1%) | |
| Sex | Other | 0 (0%) |
| Women | 311 (86.9%) | |
| Men | 47 (13.1%) | |
| Academic year | 2018–2019 | 136 (38%) |
| 2019–2020 | 222 (62%) | |
| Degree pursued | Primary Education (Bilingual) | 59 (16.5%) |
| Early Childhood Education | 145 (40.5%) | |
| Social Education | 65 (18.2%) | |
| Pedagogy | 84 (23.5%) | |
| Speech Therapy | 5 (1.4%) | |
| Year in degree program | First | 64 (17.9%) |
| Second | 233 (65.1%) | |
| Third | 56 (15.6%) | |
| Fourth | 5 (1.4%) | |
| Course title | Didactics of Early Childhood Education | 14 (3.9%) |
| General Didactics | 50 (14.0%) | |
| ICT, Education, and Social Change | 34 (9.5%) | |
| Optimization of Development and Risk Prevention | 58 (16.2%) | |
| Employability, Training, and Work Placement | 34 (9.5%) | |
| School Context and Speech Therapy | 5 (1.4%) | |
| Lifelong Learning | 31 (8.7%) | |
| Didactic-Technological Resources Applied to Primary Education | 59 (16.5%) | |
| School and Classroom Organization in Early Childhood Ed. | 51 (14.2%) | |
| Didactic-Technological Resources Applied to Ed. | 22 (6.1%) | |
Table 3.
Behavior of the emotions.
| Min. | Max. | M. | SD | Asymmetry | Kurtosis | |
|---|---|---|---|---|---|---|
| Disorientation | 1 | 5 | 2.78 | 1.17 | 0.148 | −0.753 |
| Waste of time | 1 | 5 | 2.07 | 1.09 | 0.987 | 0.450 |
| Freedom | 1 | 5 | 3.91 | 0.936 | −0.773 | 0.475 |
| Motivation | 1 | 5 | 3.63 | 0.923 | −0.357 | −0.025 |
| Curiosity | 1 | 5 | 3.80 | 0.887 | −0.566 | 0.266 |
| Inquiry | 1 | 5 | 3.73 | 0.956 | −0.656 | 0.415 |
Note: Min. = minimum; Max. = maximum; M = mean; SD = standard deviation.
Table 4.
Mann–Whitney u test according to age.
| G1 (n = 251) | G2 (n = 105) | U | Z | p | |||
|---|---|---|---|---|---|---|---|
| M | SD | M | SD | ||||
| Disorientation | 2.76 | 1.14 | 2.82 | 1.23 | 12,626.5 | −0.642 | 0.521 |
| Waste of time | 1.96 | 1.00 | 2.35 | 1.24 | 10,875.5 | −2.73 | 0.006 * |
| Freedom | 3.94 | 0.914 | 3.85 | 0.988 | 12,562.5 | −0.737 | 0.461 |
| Motivation | 3.69 | 0.895 | 3.51 | 0.982 | 11,607.5 | −1.87 | 0.061 |
| Curiosity | 3.86 | 0.863 | 3.65 | 0.930 | 11,496.0 | −2.02 | 0.043 * |
| Inquiry | 3.74 | 0.968 | 3.70 | 0.932 | 12,697.0 | −0.574 | 0.566 |
Note: M = mean; SD = standard deviation; U = statistical U; * = significant at 0.05.
Table 5.
Mann–Whitney u test according to sex.
| Women (n = 310) | Men (n = 46) | U | Z | p | |||
|---|---|---|---|---|---|---|---|
| M | SD | M | SD | ||||
| Disorientation | 2.81 | 1.18 | 2.57 | 1.068 | 6353.0 | −1.23 | 0.218 |
| Waste of time | 2.11 | 1.11 | 1.80 | 0.859 | 6162.0 | −1.56 | 0.118 |
| Freedom | 3.86 | 0.955 | 4.26 | 0.713 | 5464.0 | −2.71 | 0.007 * |
| Motivation | 3.62 | 0.930 | 3.74 | 0.880 | 6724.0 | −0.659 | 0.510 |
| Curiosity | 3.78 | 0.913 | 3.93 | 0.680 | 6623.0 | −0.831 | 0.406 |
| Inquiry | 3.69 | 0.959 | 3.96 | 0.918 | 5955.0 | −1.90 | 0.056 * |
Note: M = mean; SD = standard deviation; U = statistical U; * = significant at 0.05.
Table 6.
Mann–Whitney u test according to academic year.
| 2018–2019 (n = 136) | 2019–2020 (n = 220) | U | Z | p | |||
|---|---|---|---|---|---|---|---|
| M | SD | M | SD | ||||
| Disorientation | 2.55 | 1.17 | 2.91 | 1.14 | 12,414.000 | −2.78 | 0.005 * |
| Waste of time | 1.94 | 1.09 | 2.15 | 1.08 | 13,035.000 | −2.14 | 0.032 * |
| Freedom | 4.03 | 0.966 | 3.84 | 0.912 | 12,968.000 | −2.24 | 0.025 * |
| Motivation | 3.71 | 0.895 | 3.59 | 0.939 | 13,951.000 | −1.13 | 0.258 |
| Curiosity | 3.96 | 0.815 | 3.70 | 0.917 | 12,564.500 | −2.71 | 0.007 * |
| Inquiry | 3.87 | 0.925 | 3.64 | 0.967 | 13,023.500 | −2.17 | 0.030 * |
Note: M = mean; SD = standard deviation; U = statistical U; * = significant at 0.05.
Table 7.
Kruskal–Wallis test according to degree studied.
| Primary Education (Bilingual) | Early Childhood Education | Social Education | Pedagogy | Speech Therapy | χ2 | df | p | ||||||
|---|---|---|---|---|---|---|---|---|---|---|---|---|---|
| M | SD | M | SD | M | SD | M | SD | M | SD | ||||
| Disorientation | 2.81 | 1.16 | 2.74 | 1.26 | 2.69 | 1.153 | 2.89 | 1.012 | 2.60 | 1.14 | 1.834 | 4 | 0.766 |
| Waste of time | 2.10 | 0.959 | 2.26 | 1.29 | 2.02 | 0.934 | 1.78 | 0.842 | 2.00 | 1.22 | 5.717 | 4 | 0.158 |
| Freedom | 3.86 | 0.937 | 3.85 | 1.01 | 3.83 | 0.883 | 4.13 | 0.761 | 3.60 | 1.51 | 6.616 | 4 | 0.221 |
| Motivation | 3.54 | 0.988 | 3.59 | 0.983 | 3.56 | 0.941 | 3.87 | 0.658 | 3.20 | 1.48 | 7.971 | 4 | 0.093 |
| Curiosity | 3.63 | 0.927 | 3.69 | 0.909 | 3.89 | 0.838 | 4.05 | 0.764 | 3.60 | 1.51 | 12.404 | 4 | 0.015 * |
| Inquiry | 3.46 | 1.10 | 3.69 | 0.961 | 3.78 | 0.806 | 3.98 | 0.855 | 3.20 | 1.48 | 10.586 | 4 | 0.032 * |
Note: M = mean; SD = standard deviation; * = significant at 0.05.
Table 8.
Kruskal–Wallis test according to year in degree program.
| First | Second | Third | Fourth | χ2 | df | p | |||||
|---|---|---|---|---|---|---|---|---|---|---|---|
| M | SD | M | SD | M | SD | M | SD | ||||
| Disorientation | 2.92 | 1.088 | 2.74 | 1.250 | 2.78 | 0.896 | 2.60 | 1.140 | 1.659 | 3 | 0.646 |
| Waste of time | 1.97 | 1.069 | 2.15 | 1.139 | 1.87 | 0.883 | 2.00 | 1.225 | 2.864 | 3 | 0.413 |
| Freedom | 3.98 | 0.845 | 3.83 | 0.960 | 4.20 | 0.826 | 3.60 | 1.517 | 7.852 | 3 | 0.049 * |
| Motivation | 3.69 | 0.794 | 3.56 | 0.978 | 3.93 | 0.690 | 3.20 | 1.483 | 7.807 | 3 | 0.050 |
| Curiosity | 3.86 | 0.889 | 3.71 | 3.65 | 4.13 | 0.695 | 3.60 | 1.517 | 11.236 | 3 | 0.011 * |
| Inquiry | 3.69 | 0.974 | 0.897 | 0.974 | 4.16 | 0.660 | 3.20 | 1.483 | 14.269 | 3 | 0.003 * |
Note: M = mean; SD = standard deviation; * = significant at 0.05.
Table 9.
Student’s Kruskal–Wallis test according to course title.
| 1 | 2 | 3 | 4 | 5 | 6 | 7 | 8 | 9 | 10 | χ2 | df | p | |||||||||||
|---|---|---|---|---|---|---|---|---|---|---|---|---|---|---|---|---|---|---|---|---|---|---|---|
| M | SD | M | SD | M | SD | M | SD | M | SD | M | SD | M | SD | M | SD | M | SD | M | SD | ||||
| Disorientation | 2.50 | 1.16 | 3.04 | 1.04 | 2.94 | 1.09 | 2.22 | 1.20 | 2.67 | 0.924 | 2.60 | 1.14 | 2.40 | 1.16 | 2.81 | 1.16 | 3.29 | 1.30 | 2.95 | 0.844 | 25.956 | 9 | 0.002 * |
| Waste of time | 2.36 | 1.44 | 1.86 | 0.926 | 2.26 | 0.931 | 1.76 | 1.16 | 1.67 | 0.692 | 2.00 | 1.22 | 1.73 | 0.868 | 2.10 | 0.959 | 2.82 | 1.27 | 2.18 | 1.05 | 27.146 | 9 | 0.001 * |
| Freedom | 3.79 | 1.18 | 4.04 | 0.727 | 3.82 | 0.869 | 4.09 | 1.03 | 4.27 | 0.801 | 3.60 | 1.51 | 3.83 | 0.913 | 3.86 | 0.937 | 3.49 | 0.925 | 4.09 | 0.868 | 17.788 | 9 | 0.038 * |
| Motivation | 3.21 | 0.975 | 3.82 | 0.691 | 3.35 | 0.884 | 3.88 | 0.957 | 3.94 | 0.609 | 3.20 | 1.48 | 3.80 | 0.961 | 3.54 | 0.988 | 3.22 | 0.945 | 3.91 | 0.811 | 16.510 | 9 | 0.057 * |
| Curiosity | 3.64 | 1.08 | 3.92 | 0.829 | 3.79 | 0.729 | 3.98 | 0.805 | 4.24 | 0.614 | 3.60 | 1.51 | 4.00 | 0.947 | 3.63 | 0.927 | 3.25 | 0.868 | 3.95 | 0.785 | 14.018 | 9 | 0.122 |
| Inquiry | 3.43 | 1.15 | 3.76 | 0.916 | 3.68 | 0.806 | 3.90 | 0.968 | 4.30 | 0.637 | 3.20 | 1.48 | 3.90 | 0.803 | 3.46 | 1.10 | 3.41 | 0.942 | 3.95 | 0.653 | 12.472 | 9 | 0.188 |
Note: M = mean; SD = standard deviation; * = significant at 0.05; 1 = Didactics of Early Childhood Education; 2 = General Didactics; 3 = ICT, Education, and Social Change; 4 = Optimization of Development and Workplace Risk Prevention; 5 = Employability, Training, and Work Placement; 6 = School Context and Speech Therapy; 7 = Lifelong Learning; 8 = Didactic and Technological Resources Applied to Primary Education; 9 = School and Classroom Organization in Early Childhood Education; 10 = Didactic-Technological Resources Applied to Ed.
Table 10.
Spearman’s nonparametric correlation between the emotions.
| 1 | 2 | 3 | 4 | 5 | 6 | |
|---|---|---|---|---|---|---|
| 1 | 1.000 | |||||
| 2 | 0.497 ** | 1.000 | ||||
| 3 | −0.068 | −0.289 ** | 1.000 | |||
| 4 | −0.407 ** | −0.471 ** | 0.391 ** | 1.000 | ||
| 5 | −0.291 ** | 0.392 ** | −0.448 ** | 0.717 ** | 1.000 | |
| 6 | −0.272 ** | 0.350 ** | −0.429 ** | 0.609 ** | 0.680 ** | 1.000 |
Note: 1 = Disorientation; 2 = Waste of time; 3 = Freedom; 4 = Motivation; 5 = Curiosity; 6 = Inquiry; ** correlation is significant at 0.01.
Publisher’s Note: MDPI stays neutral with regard to jurisdictional claims in published maps and institutional affiliations. |
© 2021 by the authors. Licensee MDPI, Basel, Switzerland. This article is an open access article distributed under the terms and conditions of the Creative Commons Attribution (CC BY) license (https://creativecommons.org/licenses/by/4.0/).
Share and Cite
MDPI and ACS Style
Crisol Moya, E.; Gámiz Sánchez, V.; Romero López, M.A. University Students’ Emotions When Using E-Portfolios in Virtual Education Environments. Sustainability 2021, 13, 6973. https://0-doi-org.brum.beds.ac.uk/10.3390/su13126973
AMA Style
Crisol Moya E, Gámiz Sánchez V, Romero López MA. University Students’ Emotions When Using E-Portfolios in Virtual Education Environments. Sustainability. 2021; 13(12):6973. https://0-doi-org.brum.beds.ac.uk/10.3390/su13126973
Chicago/Turabian StyleCrisol Moya, Emilio, Vanesa Gámiz Sánchez, and María Asunción Romero López. 2021. "University Students’ Emotions When Using E-Portfolios in Virtual Education Environments" Sustainability 13, no. 12: 6973. https://0-doi-org.brum.beds.ac.uk/10.3390/su13126973
Note that from the first issue of 2016, this journal uses article numbers instead of page numbers. See further details here.