
Crowded Cities: New Methodology in COVID-19 Risk Assessment

World Bank, Washington, DC 20433, USA
*
Author to whom correspondence should be addressed.
Sustainability 2021, 13(13), 7167; https://0-doi-org.brum.beds.ac.uk/10.3390/su13137167
Submission received: 6 April 2021
/
Revised: 31 May 2021
/
Accepted: 11 June 2021
/
Published: 25 June 2021
(This article belongs to the Special Issue Rethinking Urban Population Density and Sustainable Cities)
Abstract
:In this paper, we provide a novel approach to distinguish livable urban densities from crowded cities and describe how this distinction has proved to be critical in predicting COVID-19 contagion hotspots in cities in low- and middle-income country. Urban population density—considered as the ratio of population to land area, without reference to floor space consumption or other measures of livability—can have large drawbacks. To address this drawback and distinguish between density and crowding, it is important to adjust for measures of floor space as well as open space and neighborhood amenities. We use a dataset on building heights, representative of cities worldwide, to measure densities based on floor area consumption per person as well as apply this measure to develop a COVID-19 hotspot predictive tool to help city leaders prioritize civic and medical resources during the pandemic. We conclude by outlining priority interventions that could enable city leaders and local governments to transform crowded cities into livable places.
1. Introduction
Today, over 4 billion people around the world—more than half the global population—live in cities. By 2050, the urban population is expected to be more than double its current size; nearly 7 out of 10 people in the world will live in cities. Evidence from developed countries shows that urbanization and the growth of dense cities is a source of dynamism that can lead to enhanced productivity and economic growth.
A recent survey of empirical work, largely focusing on developed countries, highlights the benefits of urban density: Ahlfeldt and Pietrostefani [1] report that increasing urban density is associated with premiums in wages (4 percent), patent activity (19 percent), consumption variety value (12 percent), the preservation of green spaces (23 percent), and the use of non-car transport modes (7 percent), as well as with reductions in average vehicle mileage (−8.5 percent), energy consumption (−7 percent), pollution concentration (−8 percent), crime (−8.5 percent), and unit costs of providing local public services (−14.4 percent). At the same time, the cost of living in a city increases as its population grows, reflecting the demand for urban housing, transport, and services.
Duranton and Puga [2] show that a typical elasticity of the price of housing at the center of a city with respect to city population is about 0.1. Measuring the elasticity of house prices with respect to density—accomplished by conditioning out the city’s total land area—results in a figure of 0.3. With housing constituting a third of household expenditure in large cities, the cost of living in a city that is 10 percent denser in its land area is about 1 percent higher.
By comparison, the economic dividends from density are not being fully reaped in developing countries—particularly in Sub-Saharan Africa and South Asia—while urban costs grow more rapidly due to inadequate housing and strained transport and infrastructure systems [3]. Lall, Henderson, and Venables [4] characterize cities in low- and lower-middle-income countries as crowded and not economically dense, compared to cities in more developed parts of the world. The crowdedness of these cities is most apparent in their slums. Over 35 percent of urban residents in developing country cities live in slums; in Sub-Saharan Africa, the share is much larger at 60 percent [5]. Consider Dar es Salaam where 28 percent of residents are living at least three to a room [6]; in Abidjan, the figure is 50 percent [7].
Residents in these neighborhoods live in substandard housing, lack open space, and suffer from inadequate infrastructure. In South Africa, for example, only 44 percent of people have access to water inside their house and only 61 percent have access to a flush toilet [4]. Even with these crowded conditions, densities—measured as people living on 1 sqm or another unit of land—are low; African cities do not stand out on the list of the world’s 50 densest cities (only 6 African cities make the list, most of them in the Democratic Republic of Congo). The reason being that livable densities need supporting infrastructure and investments that raise building heights; crowded conditions lacking services and single-story structures limit growth.
Differentiating between crowding and livable densities has been important for developing country cities in managing the COVID-19 pandemic with very limited resources [8]. With the vaccine only recently becoming available, prevention through containment and social distancing, as well as frequent handwashing, appeared to be the only viable strategy in the first year of the fight against the virus. The goal of this strategy is to slow down the transmission rate to avoid overwhelming health systems that have finite resources—especially intensive care unit beds and ventilators—leading to collapse if large numbers of people are infected at the same time. As a result, closure of non-essential businesses and activities and social distancing measures, including lockdowns, were applied in many countries.
However, adhering to such measures may not be feasible for residents of low-income and crowded neighborhoods. The lack of adequate infrastructure means that they share communal taps and latrines, with neighborhoods having as many as 200 people per communal facility. Further, many are daily wage earners in the informal sector, with irregular income and insecure jobs. People living in these conditions can neither practically do social distancing, nor can they afford it. City officials need decision support tools to better prioritize interventions by anticipating emerging hotspots to target medical and civil resources to limit diffusion into surrounding areas and identify vulnerable groups so that they can be supported.
To help city leaders prioritize resources for potential hotspots or places with the highest exposure and contagion risk, a team at the World Bank has developed a methodology to predict exposure and vulnerability hotspots using globally sourced data.
This methodology has been applied to over 50 cities in low- and lower-middle-income countries. We describe the data used to distinguish crowding and density in Section 2. Section 3 describes the methodology to measure hotspots and its application in three cities. Section 4 identifies priority interventions city leaders can implement to help their cities transition from crowding to livable densities.
2. Untangling Crowding and Density
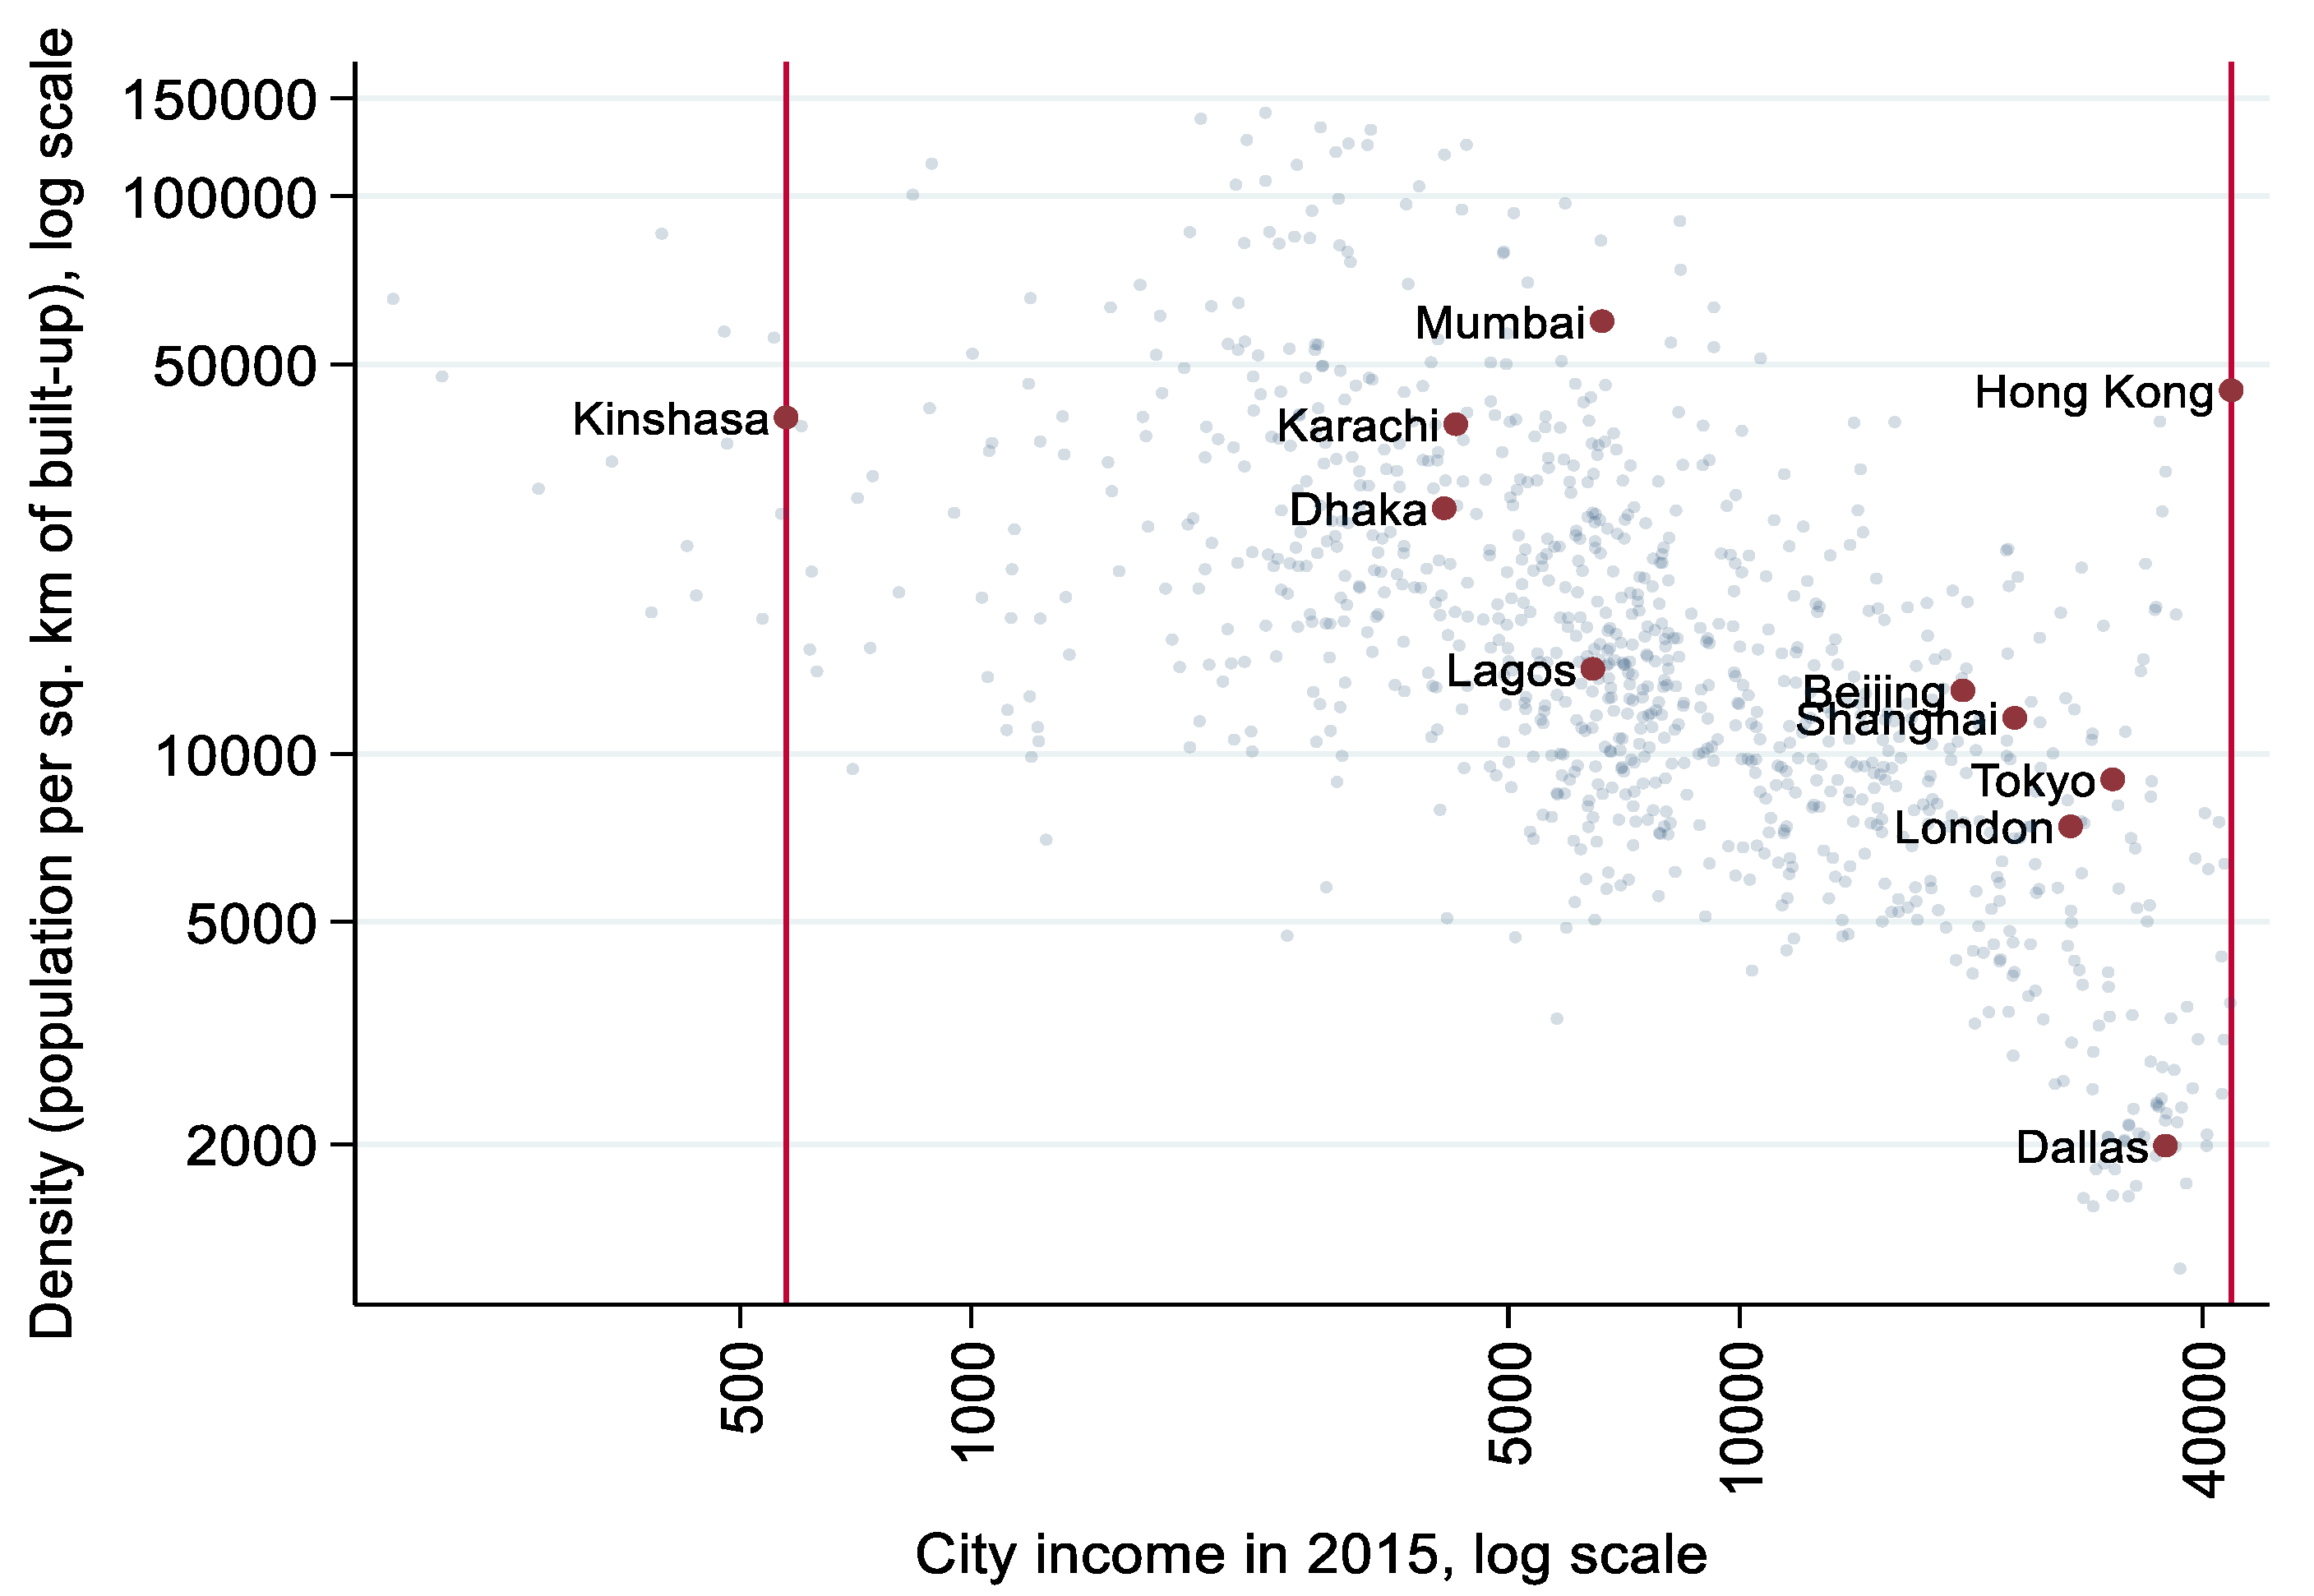
As discussed in the previous section, population density is the most common measure of urban concentration. Most measures of population density take the form of people/urban built-up area (net density) or people/total urban area (gross density). However, population density is an imperfect measure of urban proximity as it does not account for the quality of built structures (including the amount of floor space and the quality of construction) or open space/amenities. Figure 1 shows a scatter plot of population density and city incomes. Population density is measured as people per built-up area of the city, for 400 cities worldwide. Two striking features emerge:
- First, population densities decline with incomes, as countries move across stages of economic development. Kinshasa, Mumbai, and Karachi are four to five times more densely populated than Shanghai, Tokyo, or London.
- Second, naïve measures of population density can conflate crowding with livable densities. Kinshasa, Mumbai, and Hong Kong are three cities with similar population densities but very different levels of income.
While Hong Kong’s residents can live in tall buildings with adequate floor space, over 50 percent of Mumbai’s population live in slums. Most of Kinshasa’s population lives in squalid conditions. In low- and lower-middle-income countries, population densities in the range of 50,000 people per km2 are reflections of squalor and crowding, not livable densities. To untangle crowding from livable densities, we adjust population density by floor area, which we measure using data for building heights. Data on building heights are from the World Settlement Footprint 3D (WSF 3D), developed by the German Aerospace Center (DLR), which is a three-dimensional model of the built environment worldwide. The WSF 3D estimates building area, height, and density at an aggregated 90 m spatial resolution. It uses extensive machine learning to jointly analyze data of four kinds:
- 12 m digital elevation and radar intensity data from the German TanDEM-X satellite mission.
- 10 m multispectral Sentinel-2 imagery.
- The human settlement mask of the World Settlement Footprint 2015 (WSF 2015).
- Where available, vector data for building location—for example, data from the Open Street Map initiative.
The WSF 2015 and WSF 3D methodologies are described in detail in [9] and [10]. Using these data, total floor area is computed from the height data as follows:
where TFA is the total floor area. The average floor height is assumed to be 3 m. This measure can be compared across pixels in a city, or aggregates compared across cities. It is useful to highlight that the TFA measures both informal and formal settlements because the satellite data covers the entire city boundary. However, as with any dataset, there are likely to be measurement errors in estimating heights, and these may be pronounced for informal settlements. Using the TFA measure, floor area adjusted densities (FAD) are computed as follows:
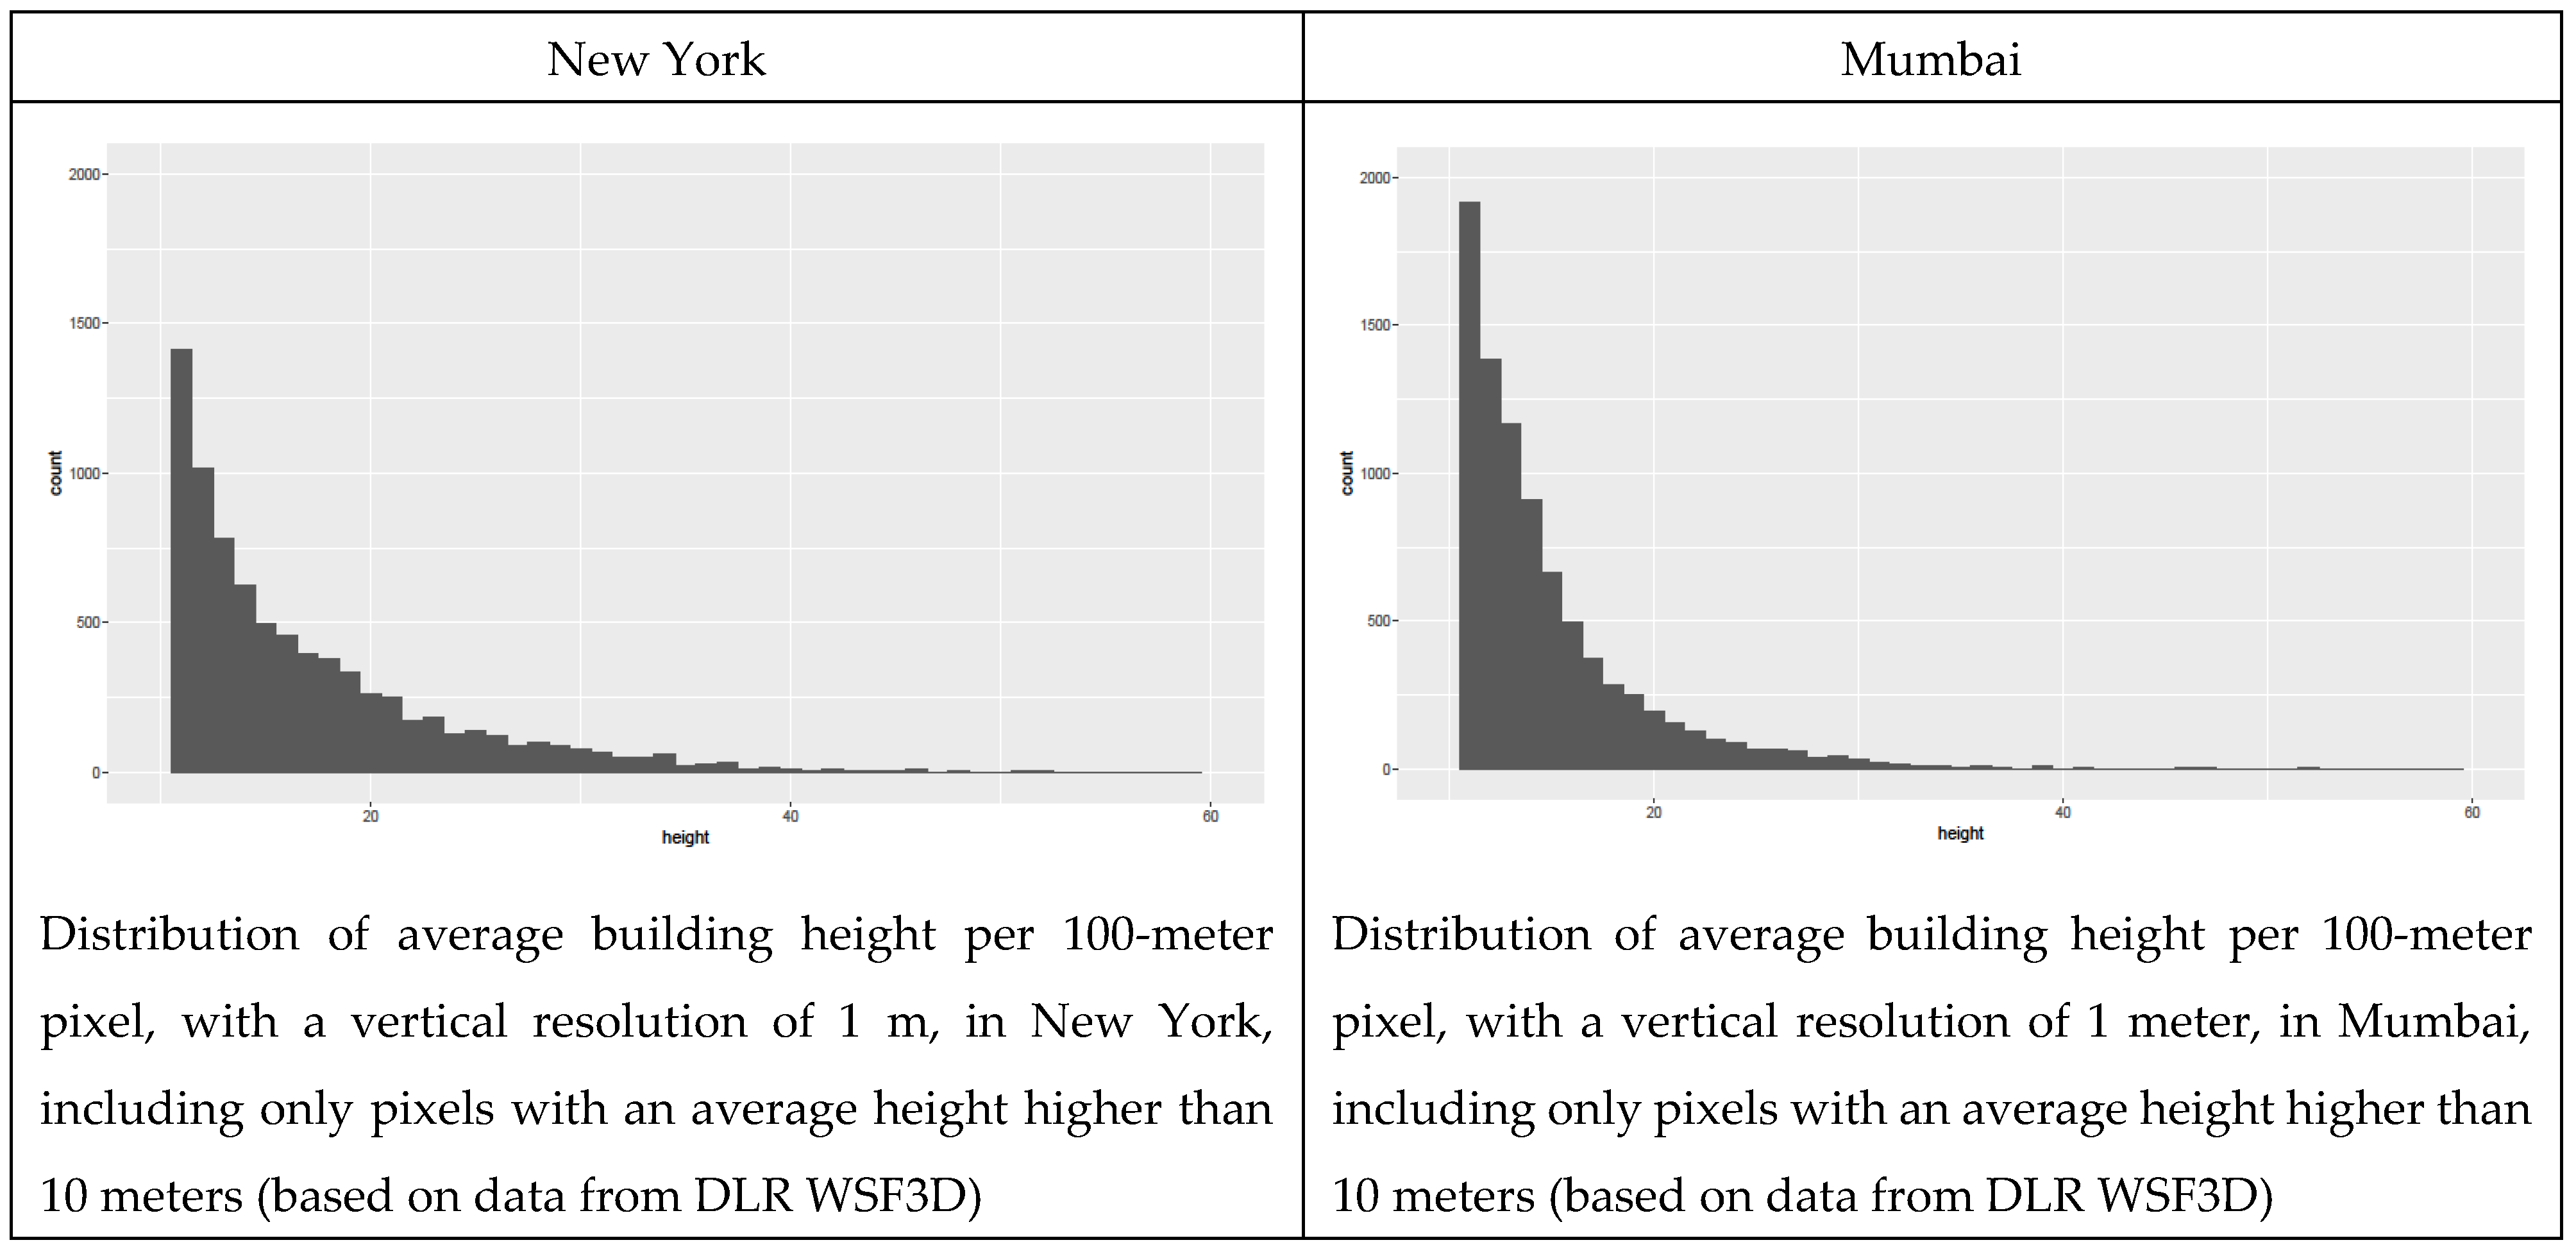
The floor area adjusted density in Figure 2 is a reasonable indicator of livability. Hong Kong’s floor area adjusted density is in line with that of a high-income city like London or Tokyo. Floor area adjusted density for low-income cities, such as Kinshasa and Mumbai, is also lower than their naïve population densities, with the correction making more of a difference for specific neighborhoods that have taller structures. To illustrate this difference, consider the two cities of New York City (Manhattan) and Bombay (Mumbai). They both have similar population densities at around 25,000 people per square km. However, the way these densities translate into living space is completely different. Having 25,000 persons on a square km living in 10-story apartment buildings will be very different compared to the same number of people living in single-story shacks. Figure 3 shows the distribution of building heights for these cities. When we consider building heights, New York’s total floor area is almost 4 times that of Mumbai.
Our approach in untangling crowding and density has similarities with the approach of [11], who unpack density through various measures including floor area per person, and apply this approach to 10 cities. They also make the point that the density in Hong Kong is due to building height while in Kinshasa it is due to crowding.
3. Crowding and COVID-19 Contagion Risk
This section builds on a prior working paper [12].
3.1. Methodology
As mentioned in the introduction, a team at the World Bank has developed a methodology to predict COVID-19 exposure and vulnerability hotspots using globally sourced data. Hotspots are predicted based on the following:
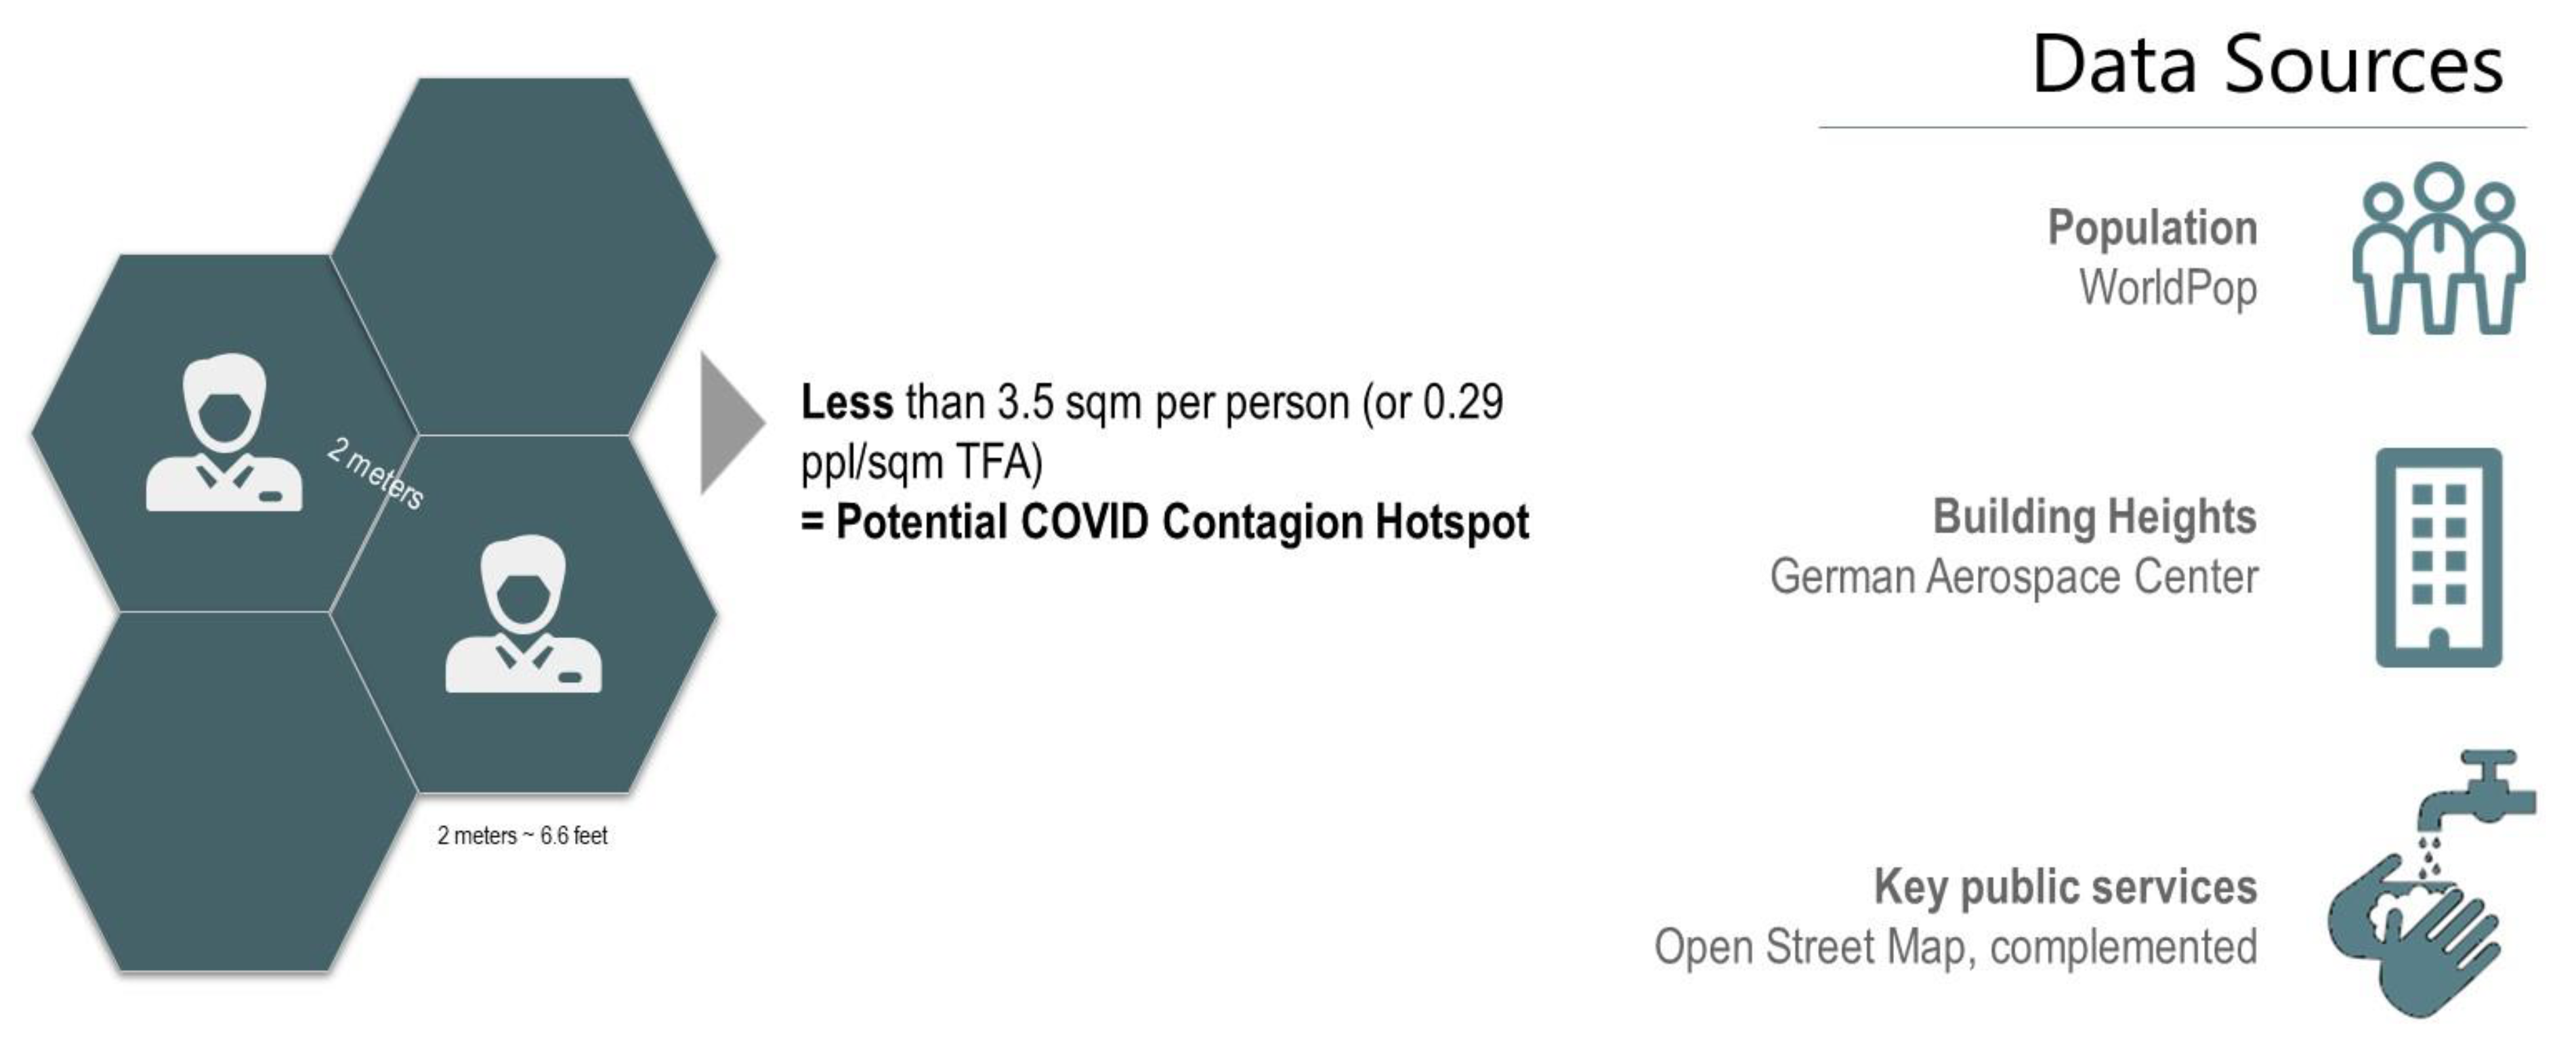
- The practical inability for keeping people apart, based on a combination of population density and livable floor space that does not allow for 2 m of physical distancing.
- Conditions where, even under lockdown, people might have little option but to cluster (e.g., to access public toilets and water pumps/standpipes).
We use adjusted densities based on floor area (Equation (2)) as the first step in developing our measure of coronavirus contagion risk. The basic premise is that contagion will increase with social interaction—a person in a crowded slum is likely to have close contact with more people than someone living in a suburban community. Moreover, people in small homes or shacks are usually forced to move outside their residence more frequently, often for accessing basic services such as water taps and toilets. The pixel-level density gives us an initial idea of where the most crowded areas are located in a city. Social distancing norms require that any person needs to maintain a distance of at least 2 m from the nearest person; a person needs a minimum of 3.464 square meters of space around them. This translates to a density of approximately 0.29 persons per square meter of floor space. In places where density surpasses this threshold people cannot comply with the minimum social distance requirements due to a lack of available living space.
However, a static measure of density is not enough. A person may move not only around their “not so big” house but may also need to travel a “relatively small” distance to access certain amenities or shop for basic products (e.g., groceries). They will necessarily interact with the people in their neighborhood, making crowded neighborhoods even more prone to a viral spread. The concentration of people in the neighborhood is then also important to understand how much exposure a person may face.
To calculate potential exposure for a person, we need to account for the density of their neighborhood. Assuming people will travel short distances during lockdown, we considered the eight neighboring pixels as the limit of mobility (queen contiguity). When using a grid with a 100 × 100 m resolution, this represents a neighborhood with a radius of approximately 100–150 m. We take nine pixels at a time and assign the sum of population per unit of TFA for the nine pixels to the reference (central) pixel. This gives us a better approximation of the exposure that a person living in the central pixel may face.
This measure of density and minimal mobility allows us to identify the first set of potential hotspots. However, people living in informal settlements face an extra challenge: they need to move to access water, toilet facilities, and other basic services, even under a lockdown scenario. We account for mobility and concentration in these service spots and find a set of additional hotspots.
To generate these additional hotspots, we first identify two types of pixels: service pixels, where a specific service is located, and transit pixels. Before looking into pixel density, we need to consider two facts. First, more people will concentrate on service pixels. It is expected that these pixels will be potential hotspots, since people from the neighborhood will often concentrate around the service (water kiosk, toilet). Second, more people will pass through other pixels on their way to the service pixel. Even though pixels that are not service pixels will not concentrate people per se, they will still experience more people traffic. The volume of traffic in these transit pixels will depend on how close they are to the service pixel.
We define as the distance from the centroid of pixel to the nearest service pixel . For any given pixel (service or transit), the number of people they receive (concentration of people or through traffic) depends on the density of the neighboring pixels, , where denotes all neighboring pixels that will go to the service pixel or pass through a transit pixel. The density of each pixel is weighted by the distance from pixel to the neighboring pixel , denoted as . The assumption is that people in the contiguous pixel will probably pass through pixel on their way to the service pixel, while people on a pixel that is 500 m away may take a different route, so the densities of further away pixels have a smaller impact on pixel . This assumption is motivated by the market access literature that uses distance to discount for the lower effect that some variables (such as demand, wages) have, the further away they are [13,14,15]. Then, the density of pixel is a function of population, TFA, and two distances: distance from the neighboring pixels to pixel and distance to the service pixel, i.e., .
The new pixel density can be defined as follows:
where is a dummy variable that equals 1 if the pixel is a service pixel, and 0 otherwise. Introducing this dummy variable allows us to separate the fact that service pixels are different from transit pixels. On the one hand, more people will agglomerate in a service pixel. When we add the people from the defined neighborhood that will come to the service pixel to our original density. is the number of pixels in the neighborhood. For example, for a neighborhood that includes pixels in a 200–250 m radius, . On the other hand, people will pass through transit pixels. When we add a proportion of people that will go through transit pixels on their way to the service pixel.
Equation (3) accounts for both density considering where people live (first two terms) and density considering concentration at a service facility or some mobility towards it (third and last term, respectively). The last term of the equation is multiplied by a constant, in this case, to consider the fact that not all the people in the defined neighborhood will cross through the pixel to access the service pixel. Since each pixel is surrounded by eight neighboring pixels, one can think of eight possible directions from where people can cross. Using simplifies the calculation and considers only one direction. We use the straight line distance (as the crow flies) to measure interactions between where people live and where service points are located; network distances can also be computed.
The methodology is applied to data using globally sourced datasets on population, average building heights, and locations of key services. Due to the importance of deploying this analysis rapidly and since local data coverage may be scarce and difficult to access during the pandemic, this methodology primarily relies on global datasets. Data on heights are described in the previous section. We use two additional datasets for the analysis.
- First, we use the WorldPop population 2019 raster (see https://www.worldpop.org/ for details on WorldPop data and methodology.) These rasters contain the estimated number of people that live in each pixel, with a resolution of 100 × 100 m. While we used global population datasets, the analysis can be easily adjusted if local sources are available. Population data from local sources may be more accurate than a global population raster. Some cities have developed spatial datasets at considerably high levels of disaggregation, although generally not at the pixel level. The challenge lies in creating a population grid based on these datasets, which usually implies modeling that assigns population to pixels, based on land use and built-up areas. The German Aerospace Center (DLR) has developed a model to generate population grid datasets based on spatially disaggregated population data.
- The second dataset is a layer with the location of key services, such as water kiosks and public toilets, obtained from the Open Street Maps Platform (OSM) (© OpenStreetMap contributors). A schematic outlining the approach is shown in Figure 4.
It should be noted that gridded datasets such as WorldPop do not account for heights in their population ‘allocation’ algorithms. This is likely to introduce bias into the spatial allocation of where people live, underestimating people living in places with tall structures and overestimating people living in shacks. This is likely to lead to a type 1 error in predicting hotspots in slums and shanties (false positive), and a type 2 error in predicting hotspots in places with tall structures (a false negative). For the purpose of our current application in resource-constrained cities needing to prioritize civic resources towards crowded neighborhoods, this error structure is acceptable. We would have been more concerned about resource misallocation if the measurement errors went the other way.
3.2. Application of the Methodology
3.2.1. Kinshasa, DRC
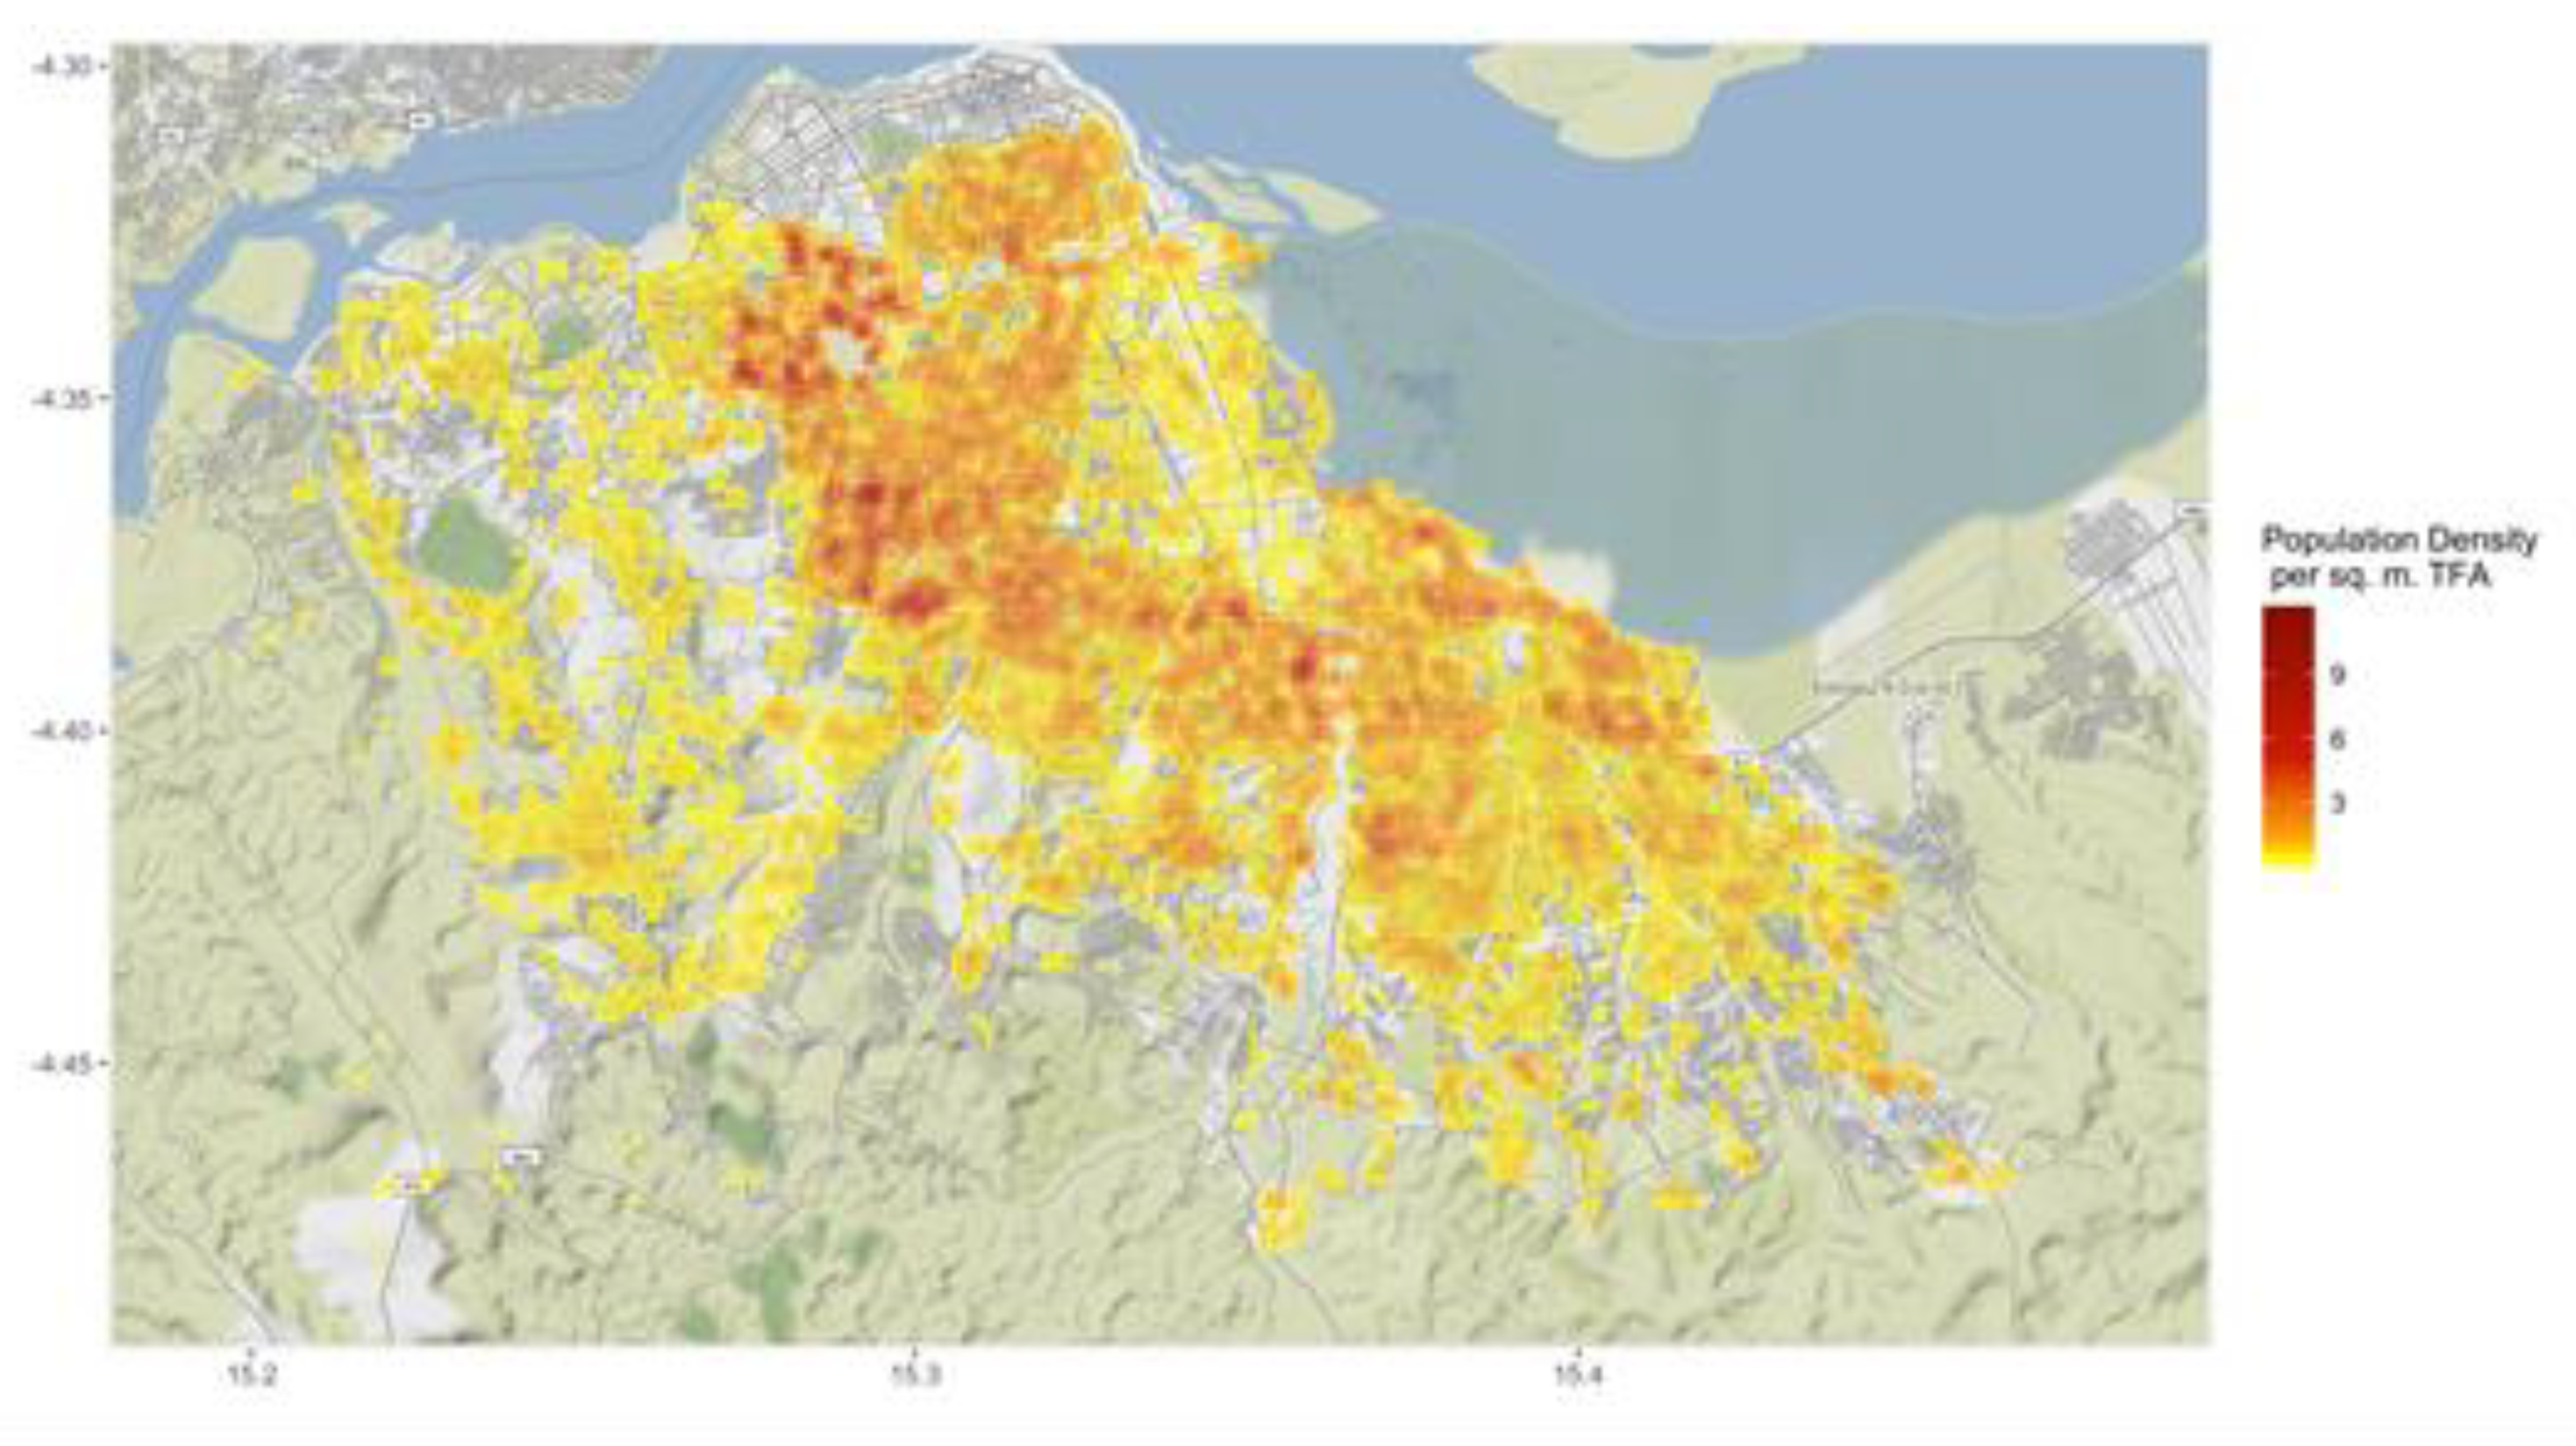
Kinshasa is a densely populated and fast-growing city of over 14 million inhabitants that has the highest number of people living in poverty of all DRC provinces. The population of Kinshasa is growing faster than other urban areas, at 5.1 percent annually, and could surpass 24 million in 2030. The effects of the COVID-19 pandemic are acute in Kinshasa. The city center, where most jobs are concentrated, was under partial lock-down between April and June 2020. An increase in poverty and inequality is expected due to a decline in labor and non-labor income, disruptions in goods and services markets, and disruptions in public services.
Figure 5 shows the location of the hotspots in the city as well as the population density adjusted to account for total floor area (TFA) in the hotspots. Hotspots are those locations where the TFA adjusted density is above 0.29—which means that people cannot keep the required social distance of 2 m needed to reduce infections. At the same time, the density adjusted for TFA is also a measure of crowded living conditions. The locations with a darker red color have higher densities than those in light yellow. Higher densities indicate a higher risk of contagion, but it is important to remember that all hotspots are already high-risk locations. Kinshasa’s hotspots are located throughout the city, as shown by the large shaded areas in the hotspot figures. The high number of hotspots with densities significantly larger than the 0.29 threshold is also worth noting. Orange areas have a density of at least 1 (3 times larger than the threshold) and red ones have densities over 5 (17 times larger). The worst hotspots in Kinshasa have densities over 9 (31 times larger). Kinshasa’s high COVID-19 risk comes from both the expanse and intensity of its hotspots.
In Kinshasa, the hotspots are being used to inform the government’s cash transfer geographic targeting and will also be used to identify where to invest and upgrade water, sanitation, and hygiene (WASH) infrastructure. A World Bank-supported social protection intervention comprises a cash transfer program that uses digital payments to phones to transfer cash to the recipients. City leaders are in the process of identifying around 250,000 in-need households without the aid of a granular poverty map or social registry, which do not exist. Along with telecom and existing survey data, the potential hotspots are used as a reliable first step to inform crisis decision making in two ways. First, hotspots are being used to identify the long list of places where emergency cash transfers should be prioritized. Second, they are therefore helping to build a registry of the households that need to be supported.
3.2.2. Dhaka, Bangladesh
Close to 40 percent of Bangladesh’s population lives in cities. Dhaka hosts 21 million residents and an additional 7 million people are expected to live in the city center by 2030. The metropolitan area has been the engine of the rapid industrialization of Bangladesh. Dhaka’s population increased tenfold in 40 years, from about 1.7 million in 1974 to about 18 million in 2015, accounting for over a third of the total urban population of Bangladesh. Its growth has far outpaced the rate of the country’s overall urbanization, and even accelerated in the most recent decade [6]. Dhaka is also one of the least livable cities in the world. In a recent comparative study by the Economist Intelligence Unit, it ranked 137 out of 140 cities, the lowest for any South Asian city surveyed (https://www.eiu.com/topic/liveability, accessed on 10 April 2021).
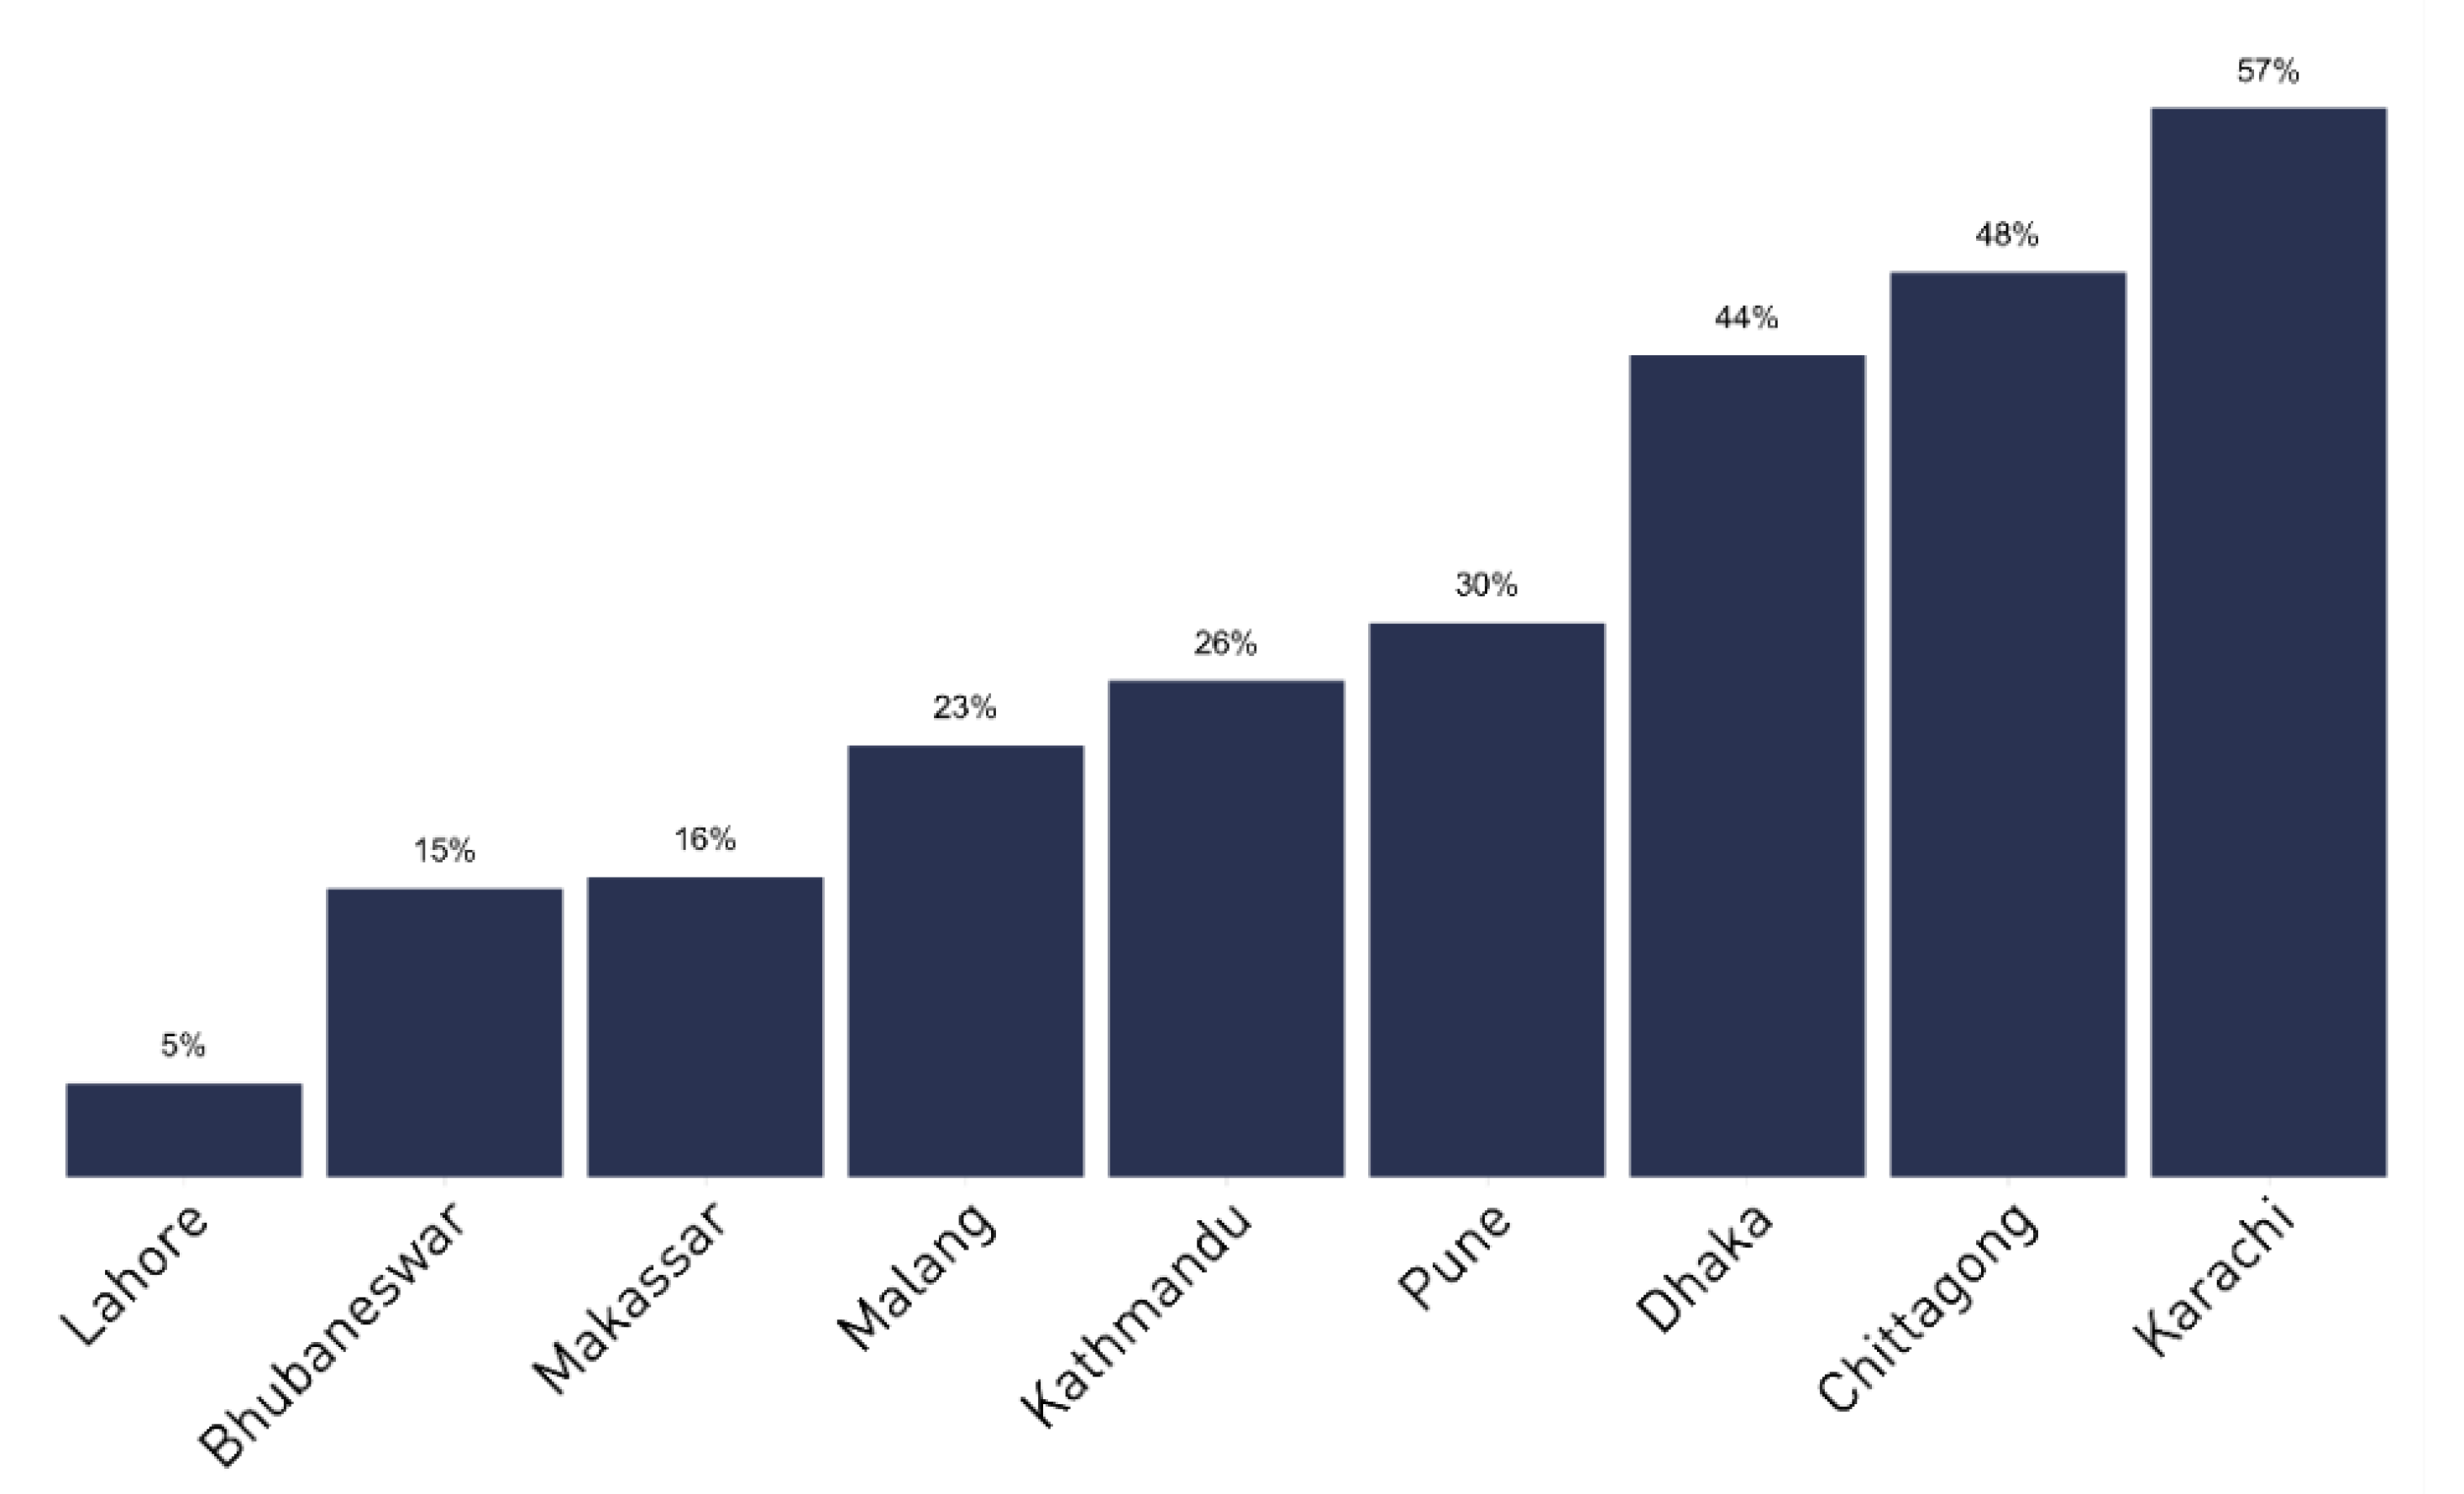
There is a high level of variability in the number of people living in hotspots across Asian cities. Over 40 percent of Dhaka’s population lives in potential hotspots (Figure 6). Some of these cities have some hotspots with densities over 10 times higher than the 0.29 threshold outlined previously. A particular challenge in Dhaka is that over 2.5 million people live in hotspots where flood risk is high—the coincidence of natural hazards and health risks increases the vulnerability of residents.
In Dhaka, the hotspot datasets are being used as an additional dimension to be accounted for in the selection of priority wards/neighborhoods to prioritize for support through a new World Bank-financed urban operation in Dhaka North City Corporation. Taken together with additional maps detailing slum prevalence, poverty, green space availability, and in line with community consultations, the hotspot datasets will help the task team identify and prioritize neighborhoods with immediate and longer-term risks of COVID-19 emergencies and other future public health emergencies.
3.2.3. Freetown, Sierra Leone
Freetown dominates Sierra Leone’s urban landscape with a population of 1.2 million, representing 35 percent of the country’s urban residents. Freetown’s recent growth is remarkable. The city’s population has increased roughly 10-fold in the last 50 years; for similarly sized European cities it took 150 years to achieve this increase. Freetown is also the center of Sierra Leone’s economy. Freetown is projected to welcome more than 535,000 new residents in the next decade [16].
For its population size, Freetown is one of the most crowded cities in the world. The city has a population density of 8450 persons per km2 but its growth has not been evenly spread. The population densities vary enormously, and the city has become fragmented. Freetown’s urban expansion has been characterized by leapfrog development, i.e., construction on unbuilt plots not bordering existing developments. The city struggles to provide affordable housing and basic services for new and existing settlements. This, in turn, has resulted in the proliferation of informal slums. Freetown has one of the highest rates of urban residents living in informal settlements at 75 percent.
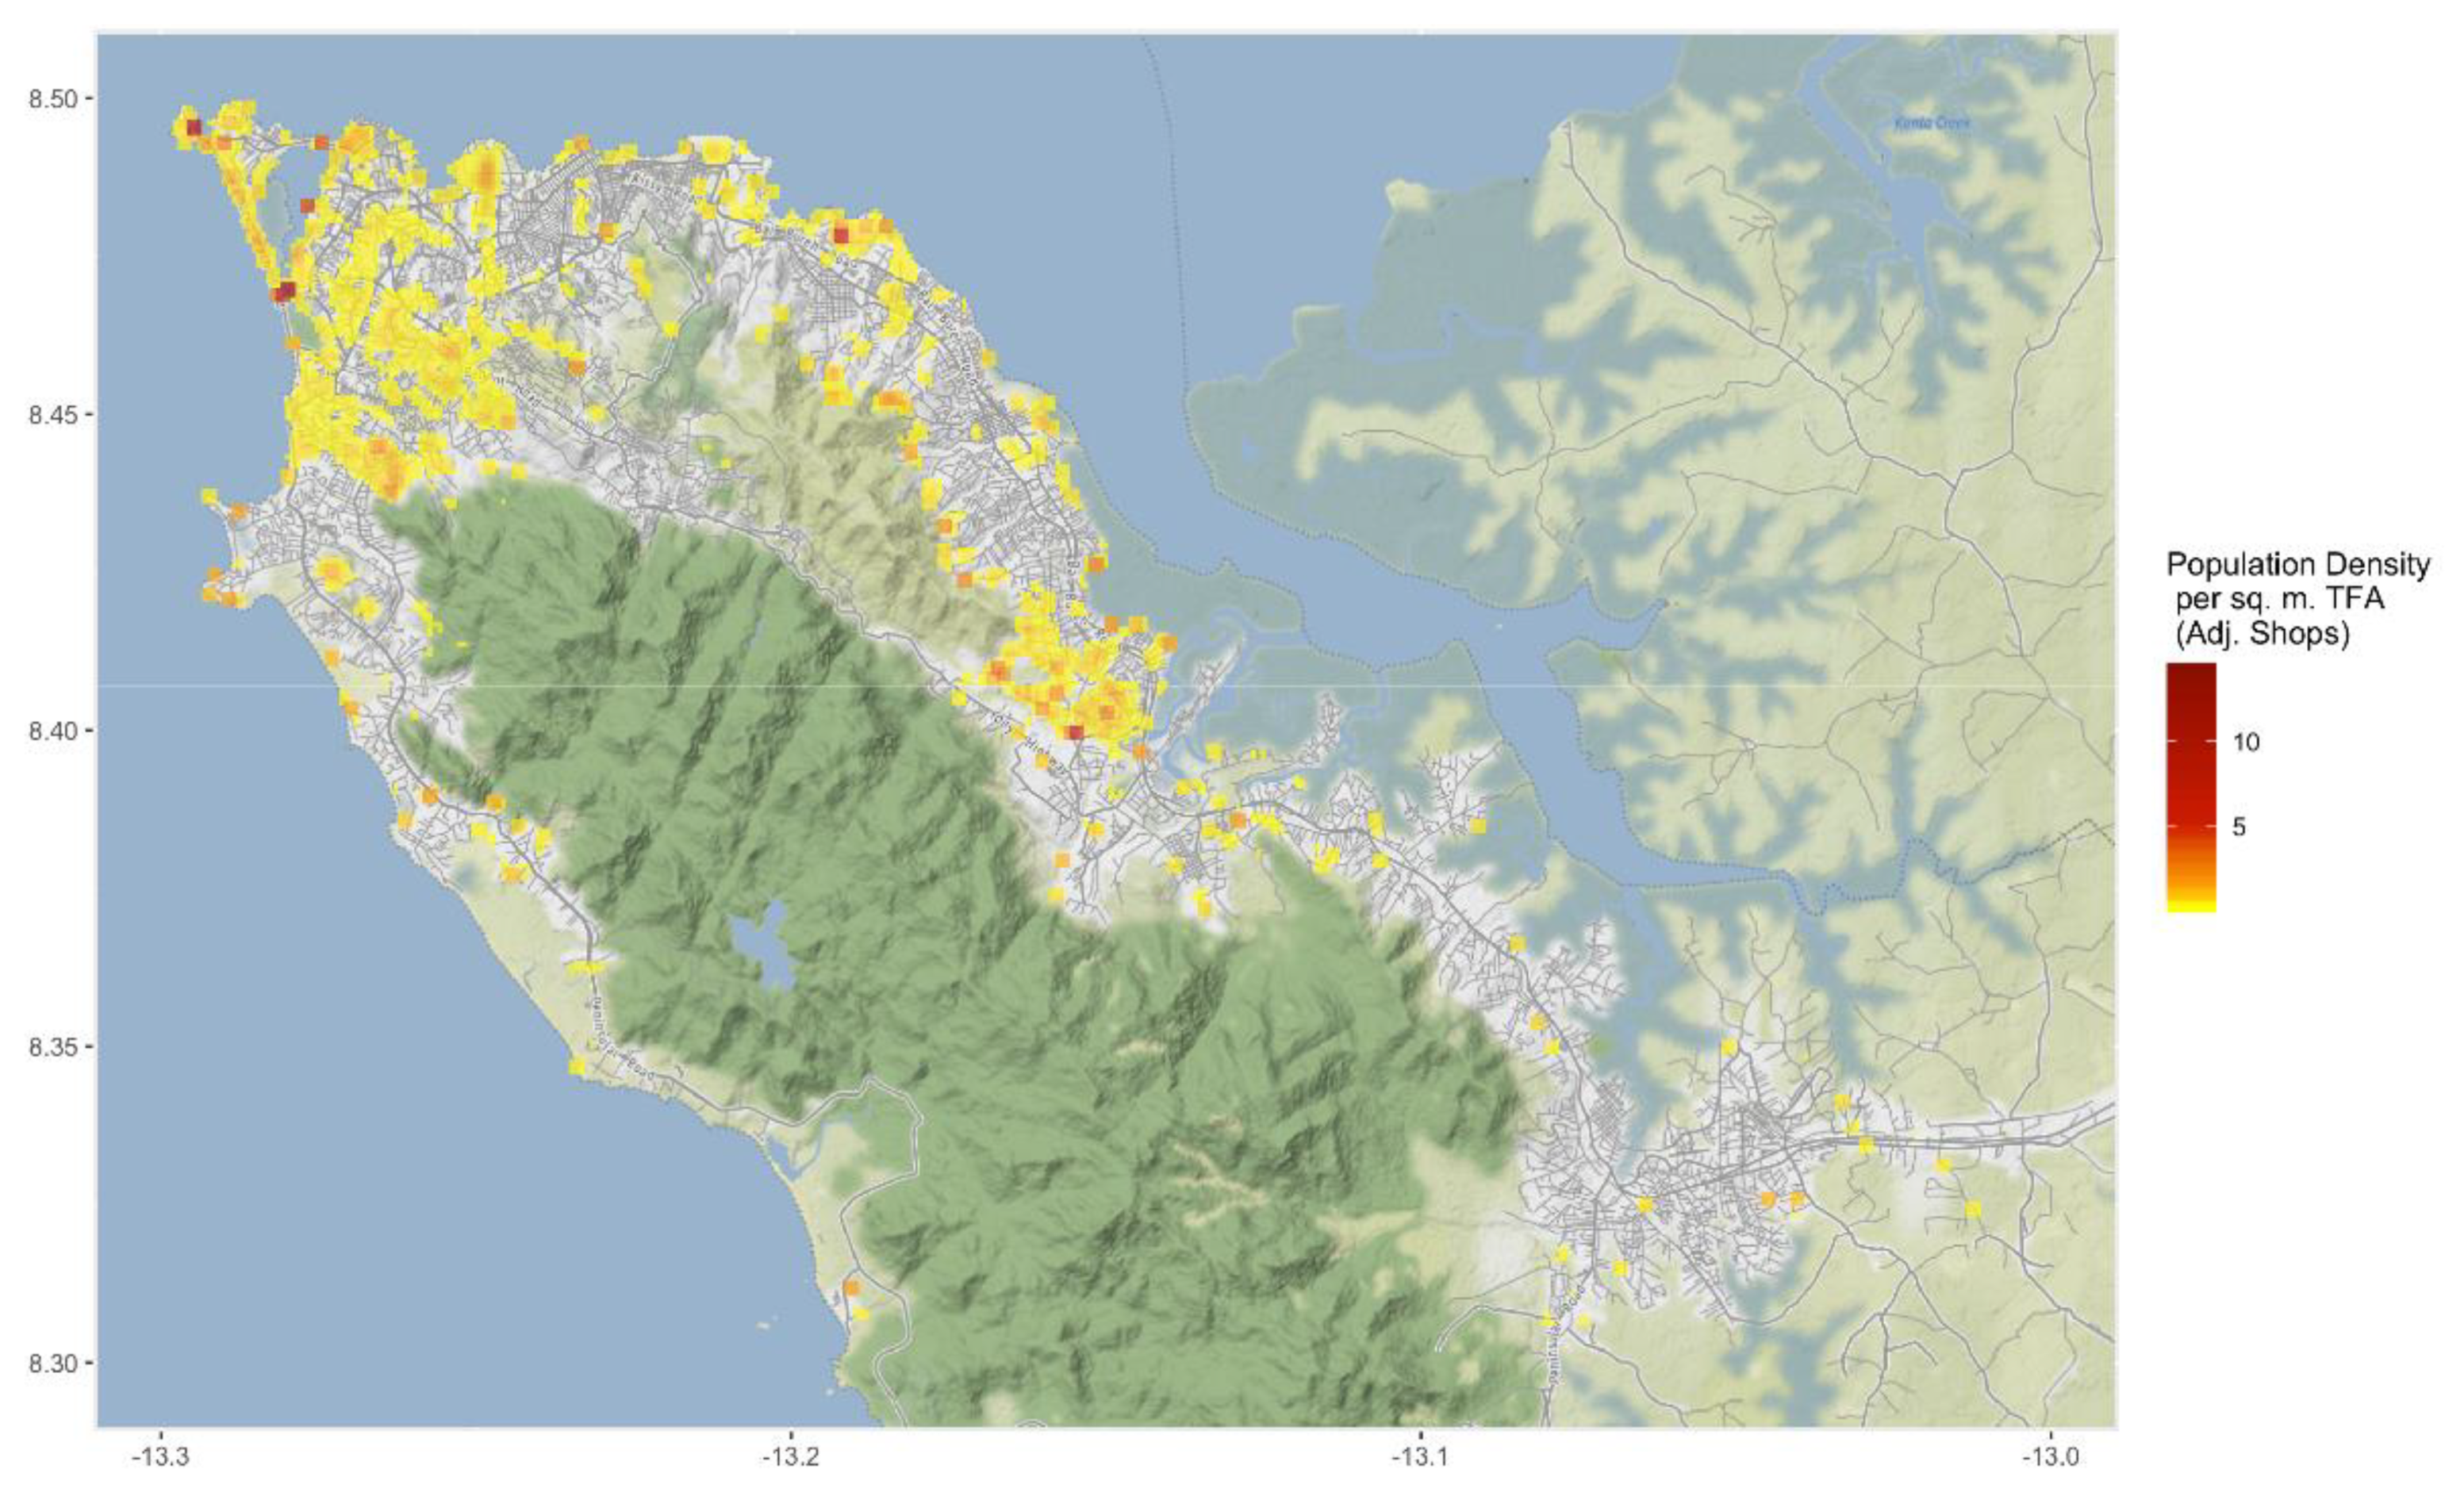
Based on the parameters of our model, thirty percent of Freetown’s population lives in a potential COVID-19 hotspot. Figure 7 shows the location of the hotspots in the city. The population density was adjusted to account for the total floor area. To account for mobility and clustering of people around public services, the map accounts for mobility to and clusters around services identified such as bus stops, water points, public toilets, and markets and food stores whenever they are available in Open Street Maps or collected by project teams. Locations with a red color have higher densities than those in yellow. Higher densities indicate a higher risk of contagion, but it is important to remember that all hotspots are already high-risk locations.
4. Looking Forward—From Crowding to (Livable) Density
This methodology can highlight the places that are most in need of public intervention from local governments and city leaders to transform a situation of crowding—with its implications of increased vulnerability to disease and disaster risk—into livable density. Understanding what factors cause such places to have inadequate housing and living conditions is important in enabling city leaders to adopt the necessary preparatory and remedial measures. The formation of crowded places, slums, and informal settlements in Kinshasa, Dhaka, Freetown, and many other cities in the developing world is largely due to two main issues: distorted land markets, manifested through inadequate access to land and rigid land use planning and development regulations, and insufficient finance to expand access to infrastructure and municipal services to a rapidly growing population.
4.1. Access to Land, Land Use Planning, and Development Regulations
Facilitating the development of dense and livable cities requires access to land with clear property rights. However, globally, some 70 percent of all land lacks secure tenure, which leaves households at risk of eviction and unable to benefit from their property, whether by selling it, using it as collateral to access a loan, or improving their housing situation [17]). In fact, nearly one billion people live in slums and informal settlements where they lack security of tenure and live in substandard housing with poor infrastructure conditions, especially water, sanitation, and stormwater drainage [18]. Unsurprisingly, these places often correlate with the COVID-19 hotspots identified by our work. When countries invest in strengthening their land administration systems as Singapore and Rwanda did, the outcome is decreased insecurity of tenure; less than 10 percent of their populations reported feeling insecure. In contrast, this figure rises to about half of the population in countries that have not invested sufficiently in land registration, such as Burkina Faso and the Philippines [19].
In the absence of (perceived) tenure security, households will not invest in improving their shelter beyond the absolute minimum repairs needed. Furthermore, governments will typically not extend infrastructure and services to informally or illegally developed settlements. Without private or public investment in shelter and infrastructure, slums and informal settlements are overcrowded and unlivable places, at high risk of contagion.
Land use planning (including integration with transport infrastructure) and development/zoning regulations are critical to making cities livable. In the absence of land use planning, the urbanization process occurs predominantly through unplanned development, resulting in crowded, unserviced, and unlivable settlements. Slum upgrading and ex post retrofitting to regularize and transform such places into livable neighborhoods is a much more costly endeavor compared to ex ante planning and infrastructure delivery, costing up to 10 times more [20].
This is not to say that all cities with a land use plan have managed to produce livable urbanization. Master plans are often outdated, unenforceable, or have been developed using rigid planning standards that are ill-adapted to local conditions. On the other hand, cities like Seoul and Singapore have adopted a demand-driven land use planning process that integrates land use and transport infrastructure, embraces high densities and mixed-use development, and focuses on the quality of public space. Some cities with artificially low statutory densities, such as Sao Paulo, have later introduced remedial measures to allow for an increase in densities in specifically designated areas through the auctioning of additional development rights (called certificates of additional construction potential or CEPACs) [21,22]. Cities such as Curitiba and Tokyo have promoted transit-oriented development approaches that create higher densities and mixed uses around public transportation nodes, resulting in a dynamic, dense, and livable built environment.
The introduction of tradeable development rights can enable an efficient development process with densities reflecting demand and land market dynamics and responding to policy objectives. For instance, the preservation of historic buildings in central locations that are subject to important market pressures has been made feasible through a transfer of development rights (TDR) approach that allows owners to sell permissible development rights for developers’ use in other designated areas. This approach has been used in various places including New York City to preserve the historic Grand Central Terminal and the high line, which was transformed into a linear park, as well as in Boston to preserve historic neighborhoods such as Back Bay. In Sao Paulo, besides the CEPACs, the local government has another instrument entitled Outorga Onerosa, wherein property owners are allowed to expand a further 20 percent of their development against the payment of a fee that goes towards a general fund for infrastructure improvement in the city. The rationale used by Sao Paulo city is to decouple the right of land ownership from the right of property development and to monetize the latter for revenue generation that could offset the cost of infrastructure improvement [21].
4.2. Financing
Transforming crowded cities into livable places requires the expansion of infrastructure and basic services, particularly access to potable water and safe sanitation to reduce the incidence of waterborne diseases, as well as transportation to enable access to jobs. Such investments are particularly expensive when unserviced neighborhoods are retrofitted after having been settled, and especially when the rights-of-way needed to lay out the pipes and transportation corridors have not been preserved.
There is a huge deficit in urban infrastructure in the developing world. Today, 156 million urban inhabitants live without access to improved water sources and 700 million without improved sanitation [23]. Since slums and informal settlements mostly lack individual water and sanitation connections, the use of public water taps and toilets exposes residents to contagion risk. This is not the only challenge they face. Poor residents in informal settlements often resort to purchasing water from informal vendors at much higher unit rates—often five times as much as the cost of water in the municipal system [24]. Similarly, under-investment in public transportation and affordability problems mean that poor people either travel on crowded informal minibusses where they are at risk of contagion or walk to work, which affects their access to jobs.
4.3. Concluding Remarks
In this paper, we provide a new methodology to predict COVID-19 contagion risk, drawing on globally sourced datasets. We demonstrate how COVID-19 hotspots are closely linked to urban crowding, exacerbating the inability of residents to maintain social distancing as they are forced to live in cramped quarters and only have to access basic services from communal sources.
As the pandemic wanes, cities can build back better by transforming crowded cities into dense, livable places. This will require functional land markets, clear property rights, and demand-driven land use planning with efficient land development regulations, coupled with both adequate funding and financing to enable investment in infrastructure and service delivery.
Author Contributions
Conceptualization, S.V.L. and S.N.W.; methodology, S.V.L. and S.N.W.; resources, S.V.L. and S.N.W.; writing—original draft preparation, S.V.L. and S.N.W.; writing—review and editing, S.V.L. and S.N.W. All authors have read and agreed to the published version of the manuscript.
Funding
This research was funded by the UK FCDO under a grant to the World Bank.
Institutional Review Board Statement
Not Applicable.
Informed Consent Statement
Not Applicable.
Data Availability Statement
The underlying data can be made available on request by the authors.
Conflicts of Interest
The authors declare no conflict of interest.
References
- Ahlfeldt, G.M.; Pietrostefani, E. The Economic Effects of Density: A Synthesis; International Trade and Regional Economics (DP13440); Centre for Economic Policy Research, London School of Economics and Political Science: London, UK, 2019. [Google Scholar]
- Duranton, G.; Diego, P. The Economics of Urban Density. J. Econ. Perspect. 2020, 34, 3–26. [Google Scholar] [CrossRef]
- Lall, S.; Lebrand, M.; Soppelsa, M. The Evolution of City Form: Evidence from Satellite Data; World Bank Policy Research Working Paper 9618; World Bank: Washington, DC, USA, 2021. [Google Scholar]
- Lall, S.; Vernon Henderson, J.; Anthony, J.V. Africa’s Cities: Opening Doors to the World; World Bank: Washington, DC, USA, 2017. [Google Scholar]
- United Nations. Millennium Development Goals Indicators. Indicator 7.10 Proportion of Urban Population Living in Slums. 2015. Available online: http://mdgs.un.org/unsd/mdg/seriesdetail.aspx?srid=710 (accessed on 21 May 2021).
- World Bank. Measuring Living Standards within Cities. Households Surveys: Dar es Salaam and Durban; World Bank: Washington, DC, USA, 2015. [Google Scholar]
- World Bank. Côte d’Ivoire Urbanization Review. Diversified Urbanization; World Bank: Washington, DC, USA, 2015. [Google Scholar]
- Lall, S.; Wahba, S. No Urban Myth: Building Inclusive and Sustainable Cities in the Pandemic Recovery. 2020. Available online: https://www.worldbank.org/en/news/immersive-story/2020/06/18/no-urban-myth-building-inclusive-and-sustainable-cities-in-the-pandemic-recovery (accessed on 12 May 2021).
- Esch, T.; Zeidler, J.; Palacios-Lopez, D.; Marconcini, M.; Roth, A.; Mönks, M.; Leutner, B.; Brzoska, E.; Metz-Marconcini, A.; Bachofer, F.; et al. Towards a Large-Scale 3D Modeling of the Built Environment—Joint Analysis of TanDEM-X, Sentinel-2 and Open Street Map Data. Remote. Sens. 2020, 12, 2391. [Google Scholar] [CrossRef]
- Marconcini, M.; Metz-Marconcini, A.; Üreyen, S.; Palacios-Lopez, D.; Hanke, W.; Bachofer, F.; Zeidler, J.; Esch, T.; Gorelick, N.; Kakarla, A.; et al. Outlining where humans live, the World Settlement Footprint 2015. Sci. Data 2020, 7, 1–14. [Google Scholar] [CrossRef] [PubMed]
- Angel, S.; Lamson-Hall, P.; Blanco, Z.G. Anatomy of density: Measurable factors that constitute urban density. Build. Cities 2021, 2, 264–282. [Google Scholar] [CrossRef]
- Bhardwaj, G.; Esch, T.; Lall, S.V.; Marconcini, M.; Soppelsa, M.E.; Wahba, S. Cities, Crowding, and the Coronavirus: Predicting Contagion Risk Hotspots; World Bank: Washington, DC, USA, 2020. [Google Scholar]
- Davis Donald, R.; Weinstein David, E. Market access, economic geography and comparative advantage: An empirical test. J. Int. Econ. 2003, 59, 1–23. [Google Scholar] [CrossRef]
- Harris, C.D. The market as a factor in the localization of industry in the United States. Ann. Assoc. Am. Geogr. 1954, 44, 315–348. [Google Scholar]
- Head, K.; Mayer, T. The Empirics of Agglomeration and Trade, ch 59; Vernon Henderson, J., Jacques-François, T., Eds.; Handbook of Regional and Urban Economics; Elsevier: Amsterdam, The Netherlands, 2004; Volume 4, pp. 2609–2669. [Google Scholar]
- World Bank. Freetown Urban Sector Review: Options for Growth and Resilience; World Bank: Washington, DC, USA, 2018. [Google Scholar]
- Global Land Tool Network. Access to Land and Tenure Security. Available online: https://gltn.net/access-to-land-and-tenure-security/ (accessed on 20 February 2021).
- United Nations. Goal 11. Sustainable Cities and Communities. Make Cities and Human Settlements Inclusive, Safe, Resilient and Sustainable. 2019. Available online: https://unstats.un.org/sdgs/report/2019/goal-11/ (accessed on 20 February 2021).
- Prindex. Press Release: Almost 1 Billion People Worldwide Expect to Lose Their Homes against Their Will, Prindex Global Study Reveals. 2018. Available online: https://www.prindex.net/news-and-stories/press-release-almost-1-billion-people-worldwide-expect-lose-their-homes-against-their-will-prindex-global-study-reveals/ (accessed on 20 February 2021).
- Cities Alliance. Paul Romer: Cities Need to Make Room. 2020. Available online: https://www.citiesalliance.org/newsroom/news/cities-alliance-news/paul-romer-cities-need-make-room (accessed on 12 May 2021).
- Smolka, M. Assessing the monetary relevance of land value capture: The case for charges for additional building rights in São Paulo, Brazil; Lincoln Institute for Land Policy: Cambridge, MA, USA, 2018. [Google Scholar]
- World Bank. Toward Great Dhaka: A New Urban Development Paradigm Eastward; World Bank: Washington, DC, USA, 2018. [Google Scholar]
- United Nations. Water and Urbanization. Available online: https://www.unwater.org/water-facts/urbanization/ (accessed on 20 February 2021).
- Klein, M. Infrastructure Policy: Basic Design Options; Policy Research Working Paper No.6274; World Bank: Washington, DC, USA, 2012. [Google Scholar]
Figure 1.
Population density and city income, 2015 (population per km2 of built-up area, log scale). Source: Lall, Lebrand, and Soppelsa 2021.
Figure 1.
Population density and city income, 2015 (population per km2 of built-up area, log scale). Source: Lall, Lebrand, and Soppelsa 2021.

Figure 2.
Floor area adjusted density and city income, 2015 (population per km2 of floor space, log scale). Source: Lall, Lebrand and Soppelsa 2021.
Figure 2.
Floor area adjusted density and city income, 2015 (population per km2 of floor space, log scale). Source: Lall, Lebrand and Soppelsa 2021.

Figure 3.
Distribution of Building Heights—New York and Mumbai.

Figure 4.
COVID-19 hotspot prediction data schematic.

Figure 5.
COVID-19 potential hotspots in Kinshasa (2020). Note: Any colored area has a livability density above 0.29 and is a potential hotspot. The color represents the intensity of the hotspot from low intensity (yellow) to high intensity (red).
Figure 5.
COVID-19 potential hotspots in Kinshasa (2020). Note: Any colored area has a livability density above 0.29 and is a potential hotspot. The color represents the intensity of the hotspot from low intensity (yellow) to high intensity (red).

Figure 6.
Share of the city population living in COVID-19 hotspots in selected Asian cities (2020). Source: World Bank analysis.
Figure 6.
Share of the city population living in COVID-19 hotspots in selected Asian cities (2020). Source: World Bank analysis.

Figure 7.
Hotspots in Freetown (2020). Note: Any colored area has a livability density above 0.29 and is a potential hotspot. The color represents the intensity of the hotspot from low intensity (yellow) to high intensity (red).
Figure 7.
Hotspots in Freetown (2020). Note: Any colored area has a livability density above 0.29 and is a potential hotspot. The color represents the intensity of the hotspot from low intensity (yellow) to high intensity (red).

Publisher’s Note: MDPI stays neutral with regard to jurisdictional claims in published maps and institutional affiliations. |
© 2021 by the authors. Licensee MDPI, Basel, Switzerland. This article is an open access article distributed under the terms and conditions of the Creative Commons Attribution (CC BY) license (https://creativecommons.org/licenses/by/4.0/).
Share and Cite
MDPI and ACS Style
Lall, S.V.; Wahba, S.N. Crowded Cities: New Methodology in COVID-19 Risk Assessment. Sustainability 2021, 13, 7167. https://0-doi-org.brum.beds.ac.uk/10.3390/su13137167
AMA Style
Lall SV, Wahba SN. Crowded Cities: New Methodology in COVID-19 Risk Assessment. Sustainability. 2021; 13(13):7167. https://0-doi-org.brum.beds.ac.uk/10.3390/su13137167
Chicago/Turabian StyleLall, Somik V., and Sameh N. Wahba. 2021. "Crowded Cities: New Methodology in COVID-19 Risk Assessment" Sustainability 13, no. 13: 7167. https://0-doi-org.brum.beds.ac.uk/10.3390/su13137167
Note that from the first issue of 2016, this journal uses article numbers instead of page numbers. See further details here.