Article

Public Norms in the Operation Scheme of Urban Rail Transit Express Trains: The Case of the Beijing Changping Line

1
School of Reliability and Systems Engineering, Beihang University, Beijing 100191, China
2
Beijing Transportation Information Center, Beijing 100161, China
3
Beijing Key Laboratory for Comprehensive Traffic Operation Monitoring and Service, Beijing 100161, China
*
Author to whom correspondence should be addressed.
Sustainability 2021, 13(13), 7187; https://0-doi-org.brum.beds.ac.uk/10.3390/su13137187
Submission received: 30 May 2021 / Revised: 23 June 2021 / Accepted: 24 June 2021 / Published: 26 June 2021

Abstract

:
The development of urban rail transit is of great significance to the sustainable development of cities. However, the formulation of public norms of the urban rail transit train operation scheme lacks the corresponding theoretical support, rationality and scientificity. Therefore, based on the research on passenger flow conditions, this paper establishes an optimization model of express train operation and uses a heuristic genetic algorithm to solve it. In addition, this paper takes the Beijing Changping Line as an example to conduct empirical research. Results show that the optimization model established reduces the operation cost of operating enterprises, improves the capacity of urban rail transit, reduces travel time and maintains the full load rate of trains at a more comfortable level. This will improve the attractiveness of urban rail transit and promote benign interaction between operators and passengers. It will also provide a theoretical basis for formulating public norms of transit train operation, make it more scientific and reasonable and promote the development of urban rail transit.

1. Introduction

Urban rail transit is the main method of urban public transport, with the advantages of large volume, fast speed, energy savings, environmental protection, etc. The construction of urban rail transit can promote the development of cities along the rail transit profile and their prosperity and form suburban satellite cities and a number of subcenters so as to alleviate common urban issues such as dense population, tight housing and severe air pollution in city centers, which is of great significance to realize the sustainable development of cities. However, with increasing urban population, people’s travel demand is growing day by day. Urban rail transit is facing problems of insufficient transport capacity, low operation efficiency and inability to meet the passengers’ need for fast travel, which reduces the attractiveness and hinders the development of urban rail transit. The successful experience of some cities worldwide shows that a reasonable train operation scheme can effectively solve these problems and further tap the potential of existing urban rail transit.
Compared with line reconstruction and setting of overtaking lines, the cost of optimizing the train operation scheme is low. Therefore, it is necessary to formulate reasonable and effective public norms to promote rail transit development. Willem [1] proposed that public norms should create normative conditions for social interaction, rather than focusing on the realization of goals. Therefore, public norms for the train operation scheme should, on the one hand, reduce the operation cost and efficiency of operating enterprises and, on the other hand, improve the rail capacity, reduce travel time, enhance comfort and enhance the attraction of rail transit so as to promote the development of rail transit. At present, most train operation schemes are stop-by-stop trains, and the stop arrangement of express trains lacks objectivity. Therefore, this work establishes an optimization model for the express train operation scheme on the basis of analyzing urban passenger flow conditions and creates an optimal operation scheme by solving the model so as to provide theoretical support for the formulation of public norms.

1.1. Related Work

The characteristics of urban passenger flow form the basis of creating a train operation scheme. Li et al. [2] studied the problem of passenger flow gravity in rail transit and proposed the concept of a passenger flow gravitational field. Zhao et al. [3] studied the total passenger, section passenger and transit passenger flows and other aspects based on the passenger flow data from 2010 to 2016 and compared the results with those of Beijing, Shanghai and Guangzhou. Li et al. [4] studied the characteristics of passenger flow, analyzing specific stations to find the cause of congestion at those stations. Tu et al. [5] established a risk assessment model based on clustering for dynamic identification of passenger flow congestion risk at the rail transit hub. Liu et al. [6] studied the increased passenger flow, the diversion of passenger flow caused by new lines and induced passenger flow. Li et al. [7] established a passenger flow distribution model to quantify the passenger flow characteristics of the time and space distribution of rail transit and introduced four radial and two branch fractal dimensions using the fractal method in order to provide a good description of the complexity of passenger flow changes in the network. Tong et al. [8] used cluster analysis to establish a model for attracting traffic flow. Sone [9] introduced the passenger flow characteristics in the Tokyo metropolitan area and researched commuter passenger transport using the commuter train on the JR East Line in Japan as an example. Sakano et al. [10] developed a structural equation model to check commuters’ planning decisions on activities and patterns during a working day. Sakano et al. [11] extended the structural equation model to analyze activity-based travel behaviors by combining displayed and stated preference data. Johansson et al. [12] used indicators of attitudes and personality traits to form latent variables for inclusion in a standard discrete pattern selection model. Zhi et al. [13] provided a novel method for urban rail station characteristics analysis in intelligent transportation considering city land usages. Li et al. [14] adopted the method of smart card data mining to analyze commuting characteristics and spatial distribution of origin-destination travel demand for different categories of stations. Wang et al. [15] proposed a learning network based on the optimal passenger flow input information algorithm method. Based on the passenger flow information attribute of the predicted target station and the correlation coefficient distribution characteristics in different stages, the parameters of the optimal passenger flow information input algorithm were set reasonably.
Research on the express and slow train operation mode has been carried out worldwide. Song et al. [16] pointed out that passenger flow has tidal characteristics and that trip operations can be optimized on regional lines to further optimize train operation. Zhang et al. [17] proposed that train operation can be optimized by combining conventional, uninterrupted, short-distance and partial-stop operations. Xiang [18] put forward a design basis of mixed express and slow train operation. Chen et al. [19] pointed out that express and slow train operation mode can obtain the most economic benefits of rail transit and can effectively use the transportation capacity. They proposed a formula for the loss of system capacity for mixed express and slow train operation. Tang et al. [20] pointed out that in express and slow train operation mode, the setting of overtaking stations is closely related to the density of trains, the interval between express and slow trains and project implementation conditions. Therefore, the choice of overtaking points is critical for express and slow trains. Chun et al. [21] studied urban commuter lines and pointed out that express trains should be synchronized with ordinary trains to improve the system to minimize travel time and station transfer delays. Hao et al. [22] studied the express and slow train operation scheme, established a multi-objective optimization model based on travel time and operating cost and conducted an empirical study on the Shenzhen Metro Line 14. Ding et al. [23] studied the average travel time under the express and slow train operation scheme, analyzed the main factors that affect travel time and determined 0 the dynamic interaction between the factors. Based on the study of the station timetable and the proportion of fast and slow trains, a new evolutionary algorithm of travel time was proposed. Ding et al. [24] put forward a measurement method to measure the urban railway carrying capacity in express and slow train operation mode in seven different scenarios, considering the proportion of fast trains and slow trains, overtaking stations and overtaking times. Zhao et al. [25] proposed the main factors affecting the operation of express and slow trains, including project investment, number of trains, travel time and operation cost. Then, they used AHP to establish a comprehensive evaluation index system of express and slow train operation and evaluate operation performance. Pan [26] analyzed the influence of the express and slow train operation scheme on the line passing capacity and discussed the departure ratio of express and slow trains based on the relationship between the ratio of the express and slow trains and the maximum passing capacity. Xu [27] analyzed express and slow train operation on Shenzhen Line 13 based on express train stop, system capacity loss of express and slow train operation, configuration of the train overtaking line and the investment return rate. Wang and Yu [28] studied the overtaking situation of express and slow trains at different departure ratios and departure intervals and established a cellular automaton model based on express and slow train operation mode. The effectiveness of the model was verified by simulation.
Many studies have investigated the optimization of express and slow train models. Castelli et al. [29] proposed a Lagrangian heuristic program for transportation network scheduling. Salzborn [30] believed that the problem of finding the optimal stop schedule can be solved by dynamic programming and proposed a scientific method to establish the timetable of suburban railway without branches. Ghoseiri et al. [31] developed a multi-objective optimization model for passenger train scheduling on the railway network. Gupta et al. [32] proposed a new two-step linear optimization model to calculate the energy-saving schedule of the subway railway network. Assis et al. [33] proposed a new method for calculating the optimal train schedule of subway lines using a model-based predictive control formula based on linear programming. He et al. [34] established a multi-particle operation model considering the practical line environment and uncertain trainload simultaneously and developed a new optimization method based on mutated dichotomy and differential evolutionary algorithm to solve the model. Xu and Yan [35] presented an integrated model based on TOD theory to optimize land use and transportation simultaneously for a region covered by URT in China under New-type urbanization, and proposed max-min ant system (MMAS) algorithm integrated with the Frank-Wolfe and Dial algorithms. Huang et al. [36] discussed three models in a progressive fashion to optimize the last train timetable incorporating multimodal coordination and transformed these models into mixed integer linear programming to obtain the optimal time table solution through the linearization technique. Yin et al. [37] constructed a single-line equilibrium passenger flow control model which minimizes the total passenger delay, and proposed an improved simulated annealing algorithm to solve the model.

1.2. The Main Contributions of This Paper

Rail transit faces the problem of insufficient capacity and the inability to meet diversified travel needs of passengers. Adjusting and reconstructing the operation line of a train consumes a lot of resources, but optimizing the train’s operation scheme can not only save costs but also improve the transport capacity of rail transit. Most rail transit still adopts the stop-by-stop operation scheme, which limits the capacity of rail transit and cannot meet the passengers’ need for fast travel. In addition, although many studies have investigated express and slow trains, determining the stop of express and slow trains is mainly through subjective judgment. Therefore, there is a lack of scientific and reasonable public norms the train operation scheme, and the formulation of public norms lacks theoretical support. To solve the above problems, this paper studies the express train operation scheme.
In this paper, an optimization model of the express train operation scheme is established and a heuristic genetic algorithm is used to solve the model. Through the theoretical model, an optimal express train operation scheme is obtained, which provides theoretical support for the formulation of public norms of the train operation scheme so as to enhance the capacity and promote the development of rail transit.
In current research, to facilitate the calculation, some constraints in the model are simplified, which leads to a mismatch with the actual situation and the model cannot be used directly. In addition, when assuming passenger flow, most studies consider the number of people boarding and alighting to be fixed, but this is quite different from the actual situation. The model in this paper fully considers the actual situation and adds corresponding constraints. In addition, this paper uses the actual passenger flow as the number of people boarding and alighting. Therefore, the research results have more practical value.
Finally, this paper uses the actual passenger flow data of Beijing Changping Line to verify the effectiveness and superiority of the model and method. The optimized express train operation scheme can save travel time and enhance comfort. Faster train operation can save more resources and improve the operation efficiency of operating enterprises, increasing increases the attraction of urban rail transit and forming a benign interaction between passengers and operating enterprises. The method and model proposed in this paper provide theoretical support for the formulation of public norms of the train operation scheme and can promote the overall development of urban rail transit.

2. Research on the Express Train Operation Scheme Based on Passenger Flow Conditions

An express train refers to a train that does not stop at some stations. Compared with the stop-by-stop train operation scheme and the express and slow train operation scheme, the express train operation scheme can save travel time to a greater extent. In addition, the express train operation scheme does not need to transform the line, set overtaking lines, etc. and speeds up the turnover of the train, reduces the number of stops and reduces the operation cost of the operating enterprise to the greatest extent. Therefore, this paper studies the optimization of the express train operation scheme.
The passenger flow characteristics of the line is the premise to decide whether to adopt the express train operation scheme. Through the specific passenger flow distribution law, the advantages of the express train operation scheme are compared with the existing scheme, so this section summarizes the passenger flow characteristics of rail transit.

2.1. Time Distribution Characteristics of Passenger Flow

In urban rail transit, the time distribution characteristics of passenger flow at the same station and the same line are analyzed by comparing the passenger flow at different time periods for the same station and the same line.
The time distribution characteristics of passenger flow reflect the differences in passenger flow intensity in different periods. The hourly coefficient P refers to the ratio of passenger flow per unit hour to the whole-day passenger flow. The maximum value of P is defined as the peak hour passenger flow coefficient, which can reflect the concentration degree of passenger flow in time.
To reflect the equilibrium degree of passenger flow on rail transit lines, the equilibrium coefficient S, which refers to the ratio between the average value of the passenger transport coefficient in the peak period and the average value of the passenger transport coefficient in the off-peak period, is used. Zhou et al. [38] evaluated the equilibrium of lines using the equilibrium coefficient S, as shown in Table 1.

2.2. Spatial Distribution Characteristics of Passenger Flow

In the spatial distribution of urban rail transit passenger flow, the main research focuses on direction distribution and section distribution.

2.2.1. Direction Distribution Characteristics

According to the passenger flow on up and down lines, the direction distribution characteristics of urban rail transit lines are mainly divided into one-way and two-way types. The analysis is also based on the passenger flow on up and down lines per hour.
The spatial distribution characteristics of passenger flow reflect the differences in passenger flow intensity in different directions. The directional equilibrium coefficient F refers to the ratio of the maximum passenger flow in the up and down directions to the average total passenger flow in the up and down directions. Zhou et al. [38] evaluated the direction equalization degree of a line using the direction equalization coefficient F, as shown in Table 2.

2.2.2. Section Distribution Characteristics

The single-direction spatial distribution characteristics of urban rail transit lines can be reflected by the passenger flow on the line section.
The degree of unbalanced passenger flow at the line section is expressed by the section equilibrium coefficient β . Zhou et al. [38] evaluated the section equalization degree of a line using the section equalization coefficient β , as shown in Table 3.

2.3. Distribution Characteristics of Average Riding Stations

The average transportation distance of Beijing rail transit is 16.59 km. The total line length is 611.2 km, the total number of stations is 395 and the average distance between stations is 1.55 km. Table 4 shows the statistics of line length and station number of Beijing rail transit.
Therefore, it can be roughly considered that the average number of stations is 16.59/1.55 ≈ 11.

2.4. Distribution Characteristics of Passenger Flow between Stations

When considering express and slow trains, it is necessary to consider the number of stations in and out, respectively, which is important for choosing whether to stop.
In addition, in urban rail transit lines, the traffic proportion between stations is particularly important for the selection of stops. Due to the different positioning between stations, the passenger flow intensity between stations varies. The balance degree of passenger flow between stations μ is used to show the difference.

2.5. Distribution Characteristics of the Full Load Rate

The passenger flow intensity of urban rail transit expresses the passenger service experience mainly through the full load rate. Table 5 shows the classification standards of the full load ratio for passenger compartment comfort in Beijing urban rail transit.
As long as the rating does not exceed 60%, the standard of each city believes that passengers are relatively comfortable.
The distribution of the full load rate is generally divided into two parts based on the time period, the peak period full load rate and the off-peak period full load rate.

3. Optimization Model of the Express Train Operation Scheme

In the express train operation scheme, the time saved is mainly the stop time of the express train and the time lost by acceleration and deceleration. In this section, the goal is to minimize the total travel time of all passengers. An optimization model of the express train operation scheme is established considering the uniform arrival of passengers to optimize the operation scheme of three types of express trains. In addition, a heuristic genetic algorithm is designed to solve the problem. Figure 1 shows the flowchart of establishing an optimization model of the express train operation scheme.

3.1. Problem Description

In this section, the OD passenger flow and related parameters of urban rail transit lines were obtained from the Beijing Transportation Information Center. In the linear urban rail transit line, the objective function is to minimize the total travel time. The train operation scheme, that is, the stop scheme, departure frequency and operation time, is adjusted. When the total travel time of all passengers is minimum, the optimal express operation scheme can be obtained.
The goal of reducing travel time is achieved by reducing the number of train stops. Considering that several types of express trains depart, the passenger behavior, line capacity and train full load rate, maximum passenger flow on the cross section and minimum safety tracking interval, different types of stop schemes, departure frequency and operation time of express trains are determined. This can optimize and reduce the travel time of the vast majority of passengers, improve the service level of urban rail transit and enhance the attraction of rail transit to passengers.

3.2. Model Hypothesis and Parameter Definition

3.2.1. Model Hypotheses

According to the model:
(1)
The train operation is studied in one direction during peak time.
(2)
The line is a single routing, the technical parameters of different stops are the same and the train capacity is the same.
(3)
Express trains of different stop types depart evenly at the starting station, with the proportion of operation being 1:1:1.
(4)
Passengers arrive evenly and in the right direction, do not ride in the opposite direction and are not stranded.
(5)
When there are two or more passenger schemes, the scheme with the least travel time is selected as the passenger choice.

3.2.2. Parameter Definition

The following parameters are measured:
M—total number of stations along the line
m—station number m { 1 , 2 , , M }
o—departure site
d—destination site
N—total number of running trains
n—train number n { 1 , 2 , , N }
S—total number of train types
s—train type no. s { 1 , 2 , , S }
x m n —whether train n stops at station M  x m n { 0 , 1 }
I o d s —OD of the S-class train
f s —departure frequency per hour of S-type train
B s n —vehicle n of category s
T—research duration
t o d —running time between OD
t m l o s t —time lost for parking at station M
t n g o —departure time of the n-th vehicle
t m i n —minimum tracking interval
t m n —time from train n to station M
t m n —departure time of train n at station M
p o d —OD hourly passenger flow
C—train capacity
η m i n —minimum full load rate
η m a x —maximum full load rate

3.3. Objective Function

In urban rail transit, the travel time and total travel time of all passengers should be reduced and the operation efficiency of rail transit improved. Therefore, in the model established in this paper, the minimum total travel time of all passengers is taken as the objective function. The total travel time of all passengers is mainly related to the number of stops. To facilitate the calculation, the running time of a train between two stations is determined according to the actual distance. The loss time of the train at each station is calculated as the acceleration and deceleration loss time plus the waiting time of the stop (the average value of the whole line).
The minimum total travel time of all passengers can be expressed as:
    m i n Z = o = 1 M 1 d = o + 1 M s = 1 S p o d I o d s ( t o s t d s )

3.4. Constraint Condition

For the optimization model of the express train operation scheme to fit the actual situation and play a guiding role in solving actual problems, the constraints are as follows:
(1)
The restriction of the OD route ensures that only one type of express train is selected by one passenger in the model.
    s = 1 S I o d s = 1               o m , d m , o < d  
    x 0 s + x d s 2 I o d s         o m , d m , o < d , s { 1 , S }
(2)
The express-train-type constraint ensures that all trains in the operation scheme are of the given express train type.
    s = 1 S B s n = 1                 n { 1 , 2 , , N }  
(3)
The line capacity and full load ratio are constrained to ensure that passengers per unit hour can reach the destination without exceeding the range of the full load ratio of the train.
  η m i n max { p o d I o d s } f s C η m a x
(4)
The departure frequency constraint ensures that sufficient trains can be sent out in unit time.
s = 1 S f s = N
t n T     n { 1 , 2 , , N }
(5)
The arrival and departure times of train n at station M are calculated.
t 1 n = t n g o + 2
  t m n = t m 1 n + t ( m 1 ) m + t m 1 l o s t x m 1 n     m { 2 , 3 , M } ,   n { 1 , 2 , N }
t m n = t m n + t m l o s t x m n
(6)
The minimum tracking interval constraint ensures that the front and rear trains are always kept outside the safe distance.
  t m n t m n + 1 t m i n + t m l o s t x m n
(7)
Through capacity constraints, at least one type of express train stops at the same time between two stations.
n = 1 S x o n x d n 1             o , d m ,     o < d
(8)
The number of stops is limited to ensure that no train stops at specific stations.
m = 1 M x m n M 2           n { 1 , 2 , N }
(9)
The stop constraint ensures that the number of trains of a type can maintain the same stop sequence as that of others of the same type.
x m n       x m s B s n     m { 1 , 2 , M } ,   n { 1 , 2 , N } ,   s { 1 , S }
t o n t d n   ( t o s t d s ) B s n                 s { 1 , 2 , , S } , n { 1 , 2 , , N }
(10)
The sequence of departure is constrained to ensure that the departure frequency between trains is the same.
B s n = B s n + 3                 s { 1 , 2 , , S } , n { 1 , 2 , , N }
(11)
The starting and terminal stations are constrained to ensure that the train stops at the initial and terminal stations and turns back.
x 1 n + x M n = 2               n { 1 , 2 , , N }
(12)
The decision variables are only 0 and 1.
I o d s , x m n , B s n { 0 , 1 }         o , d m , n { 1 , 2 , , N } , m { 1 , 2 , M } , s { 1 , S }
The total travel time in the objective function is equal to the travel time of each passenger flow multiplied by the type of express train between different OD. Constraint 2 ensures that each OD belongs to only one type of express train, and then constraint 4 ensures that all trains running are of their given types. These two constraints jointly ensure that each OD belongs to one type of train and ensure that all passengers from different time periods take the same type of train. Constraint 5 ensures that the carrying capacity of each type of train is greater than the maximum cross-sectional passenger flow and that all passengers can be transported to the destination. Constraints 6 and 7 ensure that the number of trains required for each type of express train can be sent out within the specified time. Constraints 8–10 are used to calculate each passenger’s on-board time by marking the arrival time of each type of express train at different stations and finally to calculate the objective function. Constraints 2–4, 12 and 14 ensure that the train belonging to the OD stops at two stations at the same times. Constraint 16 ensures the same number of times for different types of express trains so that the OD of a large passenger flow can be distributed in different types of express trains.

3.5. Algorithm Design

The optimization model of the express train operation scheme is a single-objective nonlinear model, with the minimum total travel time of all passengers as the objective function. Since the solution space of the model is large and many factors are involved, it is impossible to use the solver AMPL to obtain the optimal solution. Therefore, a heuristic genetic algorithm is used to solve the problem as follows:
(1)
Coding
The feasible solution of the problem is expressed by chromosome coding. In this paper, two coding methods are used, binary and decimal. According to the specific form of the problem, three chromosomes are chosen as a whole to form a project. As shown in Figure 2, the three chromosomes contain two parts. The first part is the express train stop scheme, which is binary 0–1 code and contains 12 codes representing 12 stations. The second part is the departure frequency of the express train, which is decimal code with only one code representing the number of trains of different express train types running in 1 h.
(2)
Generating the initial population
Step 1: Set the parameters so that the population size is x and the number of iterations is y.
Step 2: Restrict the upper and lower limits of the departure frequency and reduce the range of frequency variation to quickly generate a feasible solution and improve the solution speed.
Step 3: Determine whether the initial population meets the constraints. If so, go to step 4 else return to step 2.
Step 4: Determine whether the population size reaches the predetermined value. If so, the initial population will be generated.
(3)
Selecting an action
Step 1: According to the previous model, calculate the objective function of the i-th chromosome, that is, the total travel time of all passengers. The fitness of each chromosome is subtracted from the total travel time.
Step 2: Calculate the cumulative adaptation probability. The corresponding probability of each chromosome is p i = f i i = 1 X f i .
Step 3: Generate a random number r between 0 and 1. If r p 1 , select the first chromosome; if p i 1 r p i , select the i-th chromosome.
Step 4: Repeat steps 2 and 3 for X times.
(4)
Crossing operation
Step 1: Randomly select two chromosomes to be crossed and select one station for stations 1–12. This station corresponds to the stop scheme of three kinds of trains. Directly exchange the two chromosomes for the stop scheme of this station. With a specific probability, the frequency of the two selected chromosomes will continue to cross and the principle is the same. New individuals are created.
Step 2: Determine whether the chromosome produced after crossing is a feasible solution. If not, return to step 1 and cross according to the same parent chromosome until a feasible chromosome is produced.
Step 3: Acquire X chromosome population by crossing operation.
Step 4: Calculate the fitness of 2 ∗ X chromosomes and select x as the elite chromosome population.
(5)
Mutation operation
Step 1: Set the mutation probability to p m . Randomly select a gene position of a chromosome from the population and generate a random number τ between 0 and 1. If τ p m , the gene position changes; if τ > p m , the gene position does not change. For the first part of the gene, if mutation occurs, the gene position will change from 0 to 1 or from 1 to 0. For the second part of the gene, according to the limit of frequency, the difference between the frequency of the current solution and the upper and lower bounds is calculated. Random selection is performed to make the variation toward the upper or the lower bound, and the variation range is related to the maximum number of iterations and the current number of iterations.
Step 2: Determine whether the chromosome produced after mutation is a feasible solution and replace the original chromosome, if possible. If the chromosome is not feasible, perform the mutation operation again until a feasible offspring chromosome is produced.
(6)
Termination operation
The algorithm needs to select a specific node to terminate the operation. Usually, the given node includes the following aspects: when the fitness of the optimal individual and group no longer increases or the fitness reaches the given limit.
Otherwise, continue to obtain new individuals and groups through selection, crossover and variation. In this paper, the best result of the Y generation was the largest iteration and the algorithm was finished.

4. Empirical Research on the Express Train Operation Scheme

The Changping Line of Beijing Metro starts from the Xierqi station in Haidian District in the south and ends at the Xishankou station in Changping District in the north, connecting Changping District and the central urban area of Beijing. As of October 2019, the Beijing Metro Changping Line had a total length of 31.9 km, including 15.5 km of elevated line, 13.8 km of underground line, 2.4 km of ground line and 0.2 km of transition line. There are 12 stations in total, including 6 elevated and 6 underground stations; there is one depot in the Shisanling scenic area and the Dingsi Road parking lot.
As the selection principle of the up and down express train is the same, this paper only studied the line scheme shown in Table 6 as an example. Table 6 shows the length and operation time of the down section of the line, and the stop loss time is 50 s.
This paper studies the passenger flow on the Changping Line in two different time periods, 10:00–11:00 a.m. on 14 April and 8:00–9:00 a.m. on 15 April, representing the passenger flow characteristics of the Changping Line during weekends and weekdays, respectively, to verify the effectiveness of the model in two different situations.

4.1. Analysis of Passenger Flow Characteristics of the Changping Line

4.1.1. Time Distribution Characteristics

According to Section 2.1 and Figure 3, the peak hour passenger transport coefficients on 14 and 15 April were 7.88% and 15.60%, respectively. In addition, the equilibrium degree of passenger flow on rail transit lines, S, was 1.52 and 2.74, respectively. Therefore, from the time distribution characteristics of passenger flow, the passenger flow on the Changping Line is not balanced on weekends or weekdays and the passenger flow conditions meet the requirements of the express train operation scheme.

4.1.2. Spatial Distribution Characteristics

Section passenger flow: According to Figure 4 and Section 2.2, the section equilibrium coefficients on 14 and 15 April were 1.96 and 2.16, respectively. The section equilibrium capacity is poor on both weekends and weekdays, and it can be seen from Figure 4 that the spatial section distribution pattern of passenger flow on 14 and 15 April was gradual, that is, the passenger flow at one end of the line was less, while that at the section extending to the other end was more. This situation shows that most of the passenger flow is concentrated to the back station, so the more the number of back station sections, the more the number people.
Downlink number: As can be seen from Figure 5, on 14 April, the passenger flow throughout the day was relatively average and the total number of people was relatively small. On 15 April, the passenger flow from 7:00 to 9:00 a.m. was large and the passenger flow in other periods dropped sharply.
Therefore, based on Figure 4 and Figure 5, the spatial distribution of passenger flow on the Changping Line is uneven and the use of express trains is an effective solution to this problem.

4.1.3. Distribution Characteristics of Passenger Flow between Stations

Figure 6 and Figure 7 represent the cumulative proportion of passenger flow between stations in the time periods of 10:00 a.m. on 14 April and 8:00 a.m. on 15 April, respectively.
It can be concluded from Figure 6 and Figure 7 that most of the passenger flow on the Changping Line is concentrated in 18 stations and the express train operation scheme can be optimized to facilitate the rapid arrival of these passengers.

4.1.4. Distribution Characteristics of Full Load Rate

Compared with the traditional station stop scheme, one of the most important constraints of the express train operation scheme is that this scheme will lose part of the line capacity. According to Figure 8 and Figure 9, the existing line capacity is greater than the existing passenger flow, so the express train operation scheme can still ensure that the line capacity is greater than the passenger flow, Moreover, the express train operation scheme can adjust the full load rate of trains in peak time and flat peak time so that the passenger and train operation can improve.

4.2. Solution of the Optimization Model for the Express Train Operation Scheme

Analysis of the passenger flow characteristics of the Changping Line shows that the conditions are suitable to implement the express train operation scheme. Therefore, according to the optimization model of the express train operation scheme established in Section 3, we can determine the scheme that is suitable for the passenger flow demand on the weekend and Monday.

4.2.1. Model Parameter Setting

According to the design requirements of the Beijing rail transit system, the minimum interval time of train operation is greater than 2 min, so the minimum interval time in this paper was set to be greater than 120 s. In addition, combined with the actual operation of the Changping Line, the setting of other parameters is shown in Table 7.

4.2.2. Model Solution

The heuristic genetic algorithm adopted in this paper needs to consider values of relevant parameters in advance, and the specific values are shown in Table 8.
The final results are the stop sequence and departure frequency of three types of express trains in 12 stations and the types of express trains selected by OD passenger flow according to the principle of minimum time.
Based on the above parameters, MATLAB software was used to solve the optimization model of the express train operation scheme. The specific solution results are shown in Figure 10 and Figure 11.
According to Figure 10 and Figure 11, the optimal fitness values of the heuristic genetic algorithm remained unchanged from generations 25 and 35, respectively, which shows that the designed algorithm has good convergence and can effectively solve the optimization model of the express train operation scheme.
The solution results of 10:00–11:00 a.m. on 14 April are as shown in Table 9.
Here, 1 means that the express train stops at the station, while 0 means that the train does not stop at the station.
According to the optimization model, there are three types of express trains running in 1 h from 10:00 to 11:00 a.m. on 14 April. The first type of express train does not stop at stations 3, 9, 10 and 11; the second type of express train does not stop at stations 4, 5, 6, 7 and 8; the third type of train does not stop at station 2; and the running frequency of the three types of trains is 3.
The solution results of 8:00–9:00 a.m. on 15 April are as shown in Table 10.
According to the optimization model, there are three types of express trains running in 1 h from 8:00 to 9:00 a.m. on 15 April. The first type of express train does not stop at station 3; the second type of express train does not stop at stations 5, 6, 9 and 10; the third type of express train does not stop at stations 2, 4, 7 and 8; and the running frequency of the three types of trains is 4.

4.3. Analysis of the Effect of the Optimization Model of the Express Train Operation Scheme

The evaluation index of the model’s effect evaluates the established model and should be able to show the travel time, cost of operating enterprises and transportation capacity of urban rail. In this paper, the time-saving passenger flow, the full load ratio of different types of express trains, passengers saving time, the number of stops saved and the number of classified stops reduced were selected as the evaluation indexes of the model. These indicators can reflect the reduction in travel time, enhancement of service quality and saving of costs of enterprises operating urban rail transit. In this paper, the optimized train operation scheme was compared with the traditional stop-by-stop train operation scheme to verify the effectiveness of the optimization model.
Time-saving passenger flow: According to the type of express train that each OD belongs to, as solved by the model, the time saved between ODs in the express train model can be calculated. The number of time-saving passengers is shown in Table 11.
As can be seen from Table 11, compared with the stop-by-stop train operation scheme, 56.42% of the passengers saved travel time on Sunday, while 77.03% of the passengers saved travel time on Monday, covering more passengers. The express train operation scheme can not only be applied to the peak period but also has a higher proportion of time saving for passengers in the peak period. Therefore, the express train operation scheme is feasible and effective in both the peak period and the off-peak period.
Full load rates of different types of express trains: Different ODs belong to different types of express trains, so the load factor of different types of express trains is different, as shown in Table 12.
It can be seen from Figure 12, on the weekend, the full load rates of the three types of express trains were maintained at 60–70%. The optimized express train operation scheme not only distributes the passenger flow more evenly among the three types of express trains but also ensures, through the optimization of the departure frequency, that the full load rate of the three types of express trains is not too low, resulting in a waste of train resources and a decline in passenger comfort. On Monday, however, there was a big difference between the full load rates of the three types of express trains, which were 43.88%, 101.04% and 64.42%, respectively. Compared with the full load rate of 131% in the stop-by-stop train operation scheme, the severity of crowding was significantly reduced. Therefore, the express train operation scheme can better arrange express trains in the flat peak period with average OD passenger flow, so the difference between the full load rates of the three types of express trains is not large. In the peak period, the scheme can reduce the full load rate to a certain extent. However, whether on weekends or Mondays, the express train operation scheme can adjust the full load rate of the express train and enhance the passengers’ comfort. Therefore, with regard to the full load rate, the express train operation scheme is feasible.
Passengers saving time: The time saving for passengers is considered from two aspects, the total travel time of passengers and the time passengers need to park and wait. The data of the two aspects are shown in Table 13.
It can be seen from Figure 13, on the weekend, compared with the stop-by-stop train operation scheme, passengers saved 11.48% of the total travel time and 59.52% of the total stop time. On Monday, passengers saved 11.24% of the total travel time and 57.54% of the total stop time. In other words, it takes 60 min or passengers to travel before optimization and only 53 min after optimization. Passengers need to wait 10 min before optimization and only about 4 min after optimization, which is more valuable for passengers in the peak period. Therefore, in terms of saving time, the express train operation scheme is feasible and effective.
Reducing the number of stops: Reducing the number of stops is beneficial for both passengers and operating enterprises. Passengers can save time and operating enterprises can save operating costs by reducing the number of stops, because there are corresponding costs of starting and stopping a train.
As can be seen from Table 14, on the weekend, the proportion of per capita reduction in the number of stops was 59.55% and the proportion of operating enterprises reducing the number of starts and stops was 27.78%. On Monday, the number of stops per capita decreased by 57.52% and the proportion of operating enterprises reducing the number of starts and stops was 27.78%. For passengers, whether on weekends or Mondays, the proportion of stops that can be reduced is large, which can greatly reduce the unnecessary waiting time of passengers. For operating enterprises, the biggest cost after the operation of rail transit is the cost of starting and stopping, which means that the express train operation scheme can reduce starting and stopping costs by 27.78%, which is a considerable cost saving. Therefore, the express train operation scheme is feasible and a favorable choice for both passengers and operating enterprises.
Saving the number of classified stops: Taking the first histogram in Figure 12 as an example, the number of corresponding ODs is 8 and the number of ODs that can be saved after optimization of the express train operation scheme is 3, accounting for 37.50% of the total. Among them, the maximum and minimum number of stops that can be reduced is 3 and 1, respectively, and the average number of stops that can be reduced is 0.625.
Therefore, it can be seen from Figure 12 that the more stops the OD needs to make, the greater the proportion of reduction after optimization, which is also in line with the purpose of operating the express train, that is, the passengers traveling a long distance can reduce the time as much as possible. Therefore, the optimization model of the express train operation scheme proposed in this paper is suitable and successful under the weekend passenger flow conditions.
It can be seen from Figure 13 that a large proportion of OD passenger flow with a different number of stops can be optimized, and the minimum reduction is 2. The OD with 3 and 4 stops can reduce 2 stops at least, which means that the waiting time can be saved by more than 50%. Therefore, the express train operation scheme can reduce the waiting time of not only long-distance passengers but also short-distance passengers. Therefore, from the perspective of the number of classified stops, the express train operation scheme is in line with the passengers’ travel needs.
To summarize, the express train operation scheme obtained by the optimization model proposed in this paper can be successfully applied in both peak hours on weekdays and off-peak periods on weekends. Compared with the original stop-by-stop train operation scheme, the express train operation scheme can effectively improve the capacity of urban rail transit so as to reduce the time and cost of passenger travel, On the premise of meeting the passengers’ travel needs, the express train operation scheme reduces the operating costs of operating enterprises so as to form a benign interaction between operating enterprises and passengers.

5. Discussion and Conclusions

5.1. Discussion

At present, the main stopping schemes of urban rail transit include stop-by-stop trains, express and slow trains and express trains.
In the stop-by-stop train operation scheme, the train stops at all stations. Currently, in addition to a single stop by the stop plan, the stop-by-stop train operation scheme also appears in express and slow trains.
In the express-and-slow train operation scheme, there are one or more express schemes in addition to the stop-by-stop scheme. These express trains only stop at some stations. The express and slow trains work in the following two modes:
(1)
Overtaking mode
When express and slow trains adopt the common track operation, the express train may need to overtake the slow train. At present, in countries that have opened express and slow trains, the main way is to set overtaking stations. When the express train needs to overtake, the slow train stops at the overtaking station and waits. After the express train overtakes, the slow train continues to run.
(2)
No-overtaking mode
If the express and slow trains adopt the common rail operation without overtaking, it is necessary to adjust the departure interval of the express and slow trains and focus on the running speed of the express train. If the express train might overtake the slow train, slow down or stop it in advance to ensure that the express train in the rear does not overtake the slow train in the front.
There is no stop-by-stop operation scheme for the express train, and several express trains are complementary in order to meet the travel needs of all passengers and ensure that at least one express train stops at the same time between two stations.
This paper compared and analyzed the stop-by-stop train operation scheme, the overtaking scheme of express and slow trains, the no-overtaking scheme of express and slow trains and the express train operation scheme according to the actual situation of Beijing rail transit.
From the perspective of passenger travel time, the longest travel time is required for passengers in the stop-by-stop train operation scheme. In the express-and-slow train operation, only some passengers can reduce their travel time and these passengers are limited to a few lines that express trains can reach. The express train operation scheme can ensure that the travel time of most passengers can be reduced, not just the travel time of short-distance passengers. Therefore, the express train operation scheme is the most efficient way to save passengers’ travel time.
From the aspect of line passing capacity, the stop-by-stop train operation scheme can maximize the layout and drawing of the operation diagram as long as the train between trains does not exceed the minimum safety interval. In the express-and-slow train operation scheme, the total travel time gap between express and slow trains is large, so in the same time interval, the number of trains that can be drawn is reduced, leading to a decline in the line passing capacity. In the express train operation scheme, the difference in total travel time between different types of express trains is much smaller compared with express and slow trains. Therefore, although the number of trains paved may be less than that in the stop-by-stop train operation scheme, it is far larger than the number of express and slow trains. In view of the actual situation of Beijing rail transit, the line capacity during the off-peak period is far greater than the passenger flow demand. Therefore, the express train operation scheme can fully adapt to the current situation of Beijing rail transit.
From the perspective of the operation cost of the operating enterprise, the number of stops in the stop-by-stop train operation scheme is the highest and the number of trains is also the highest because of the long total travel time. Since the turnover time of the express train is reduced, the express-and-slow train operation scheme can reduce the number of stops to a certain extent, which reduces the energy consumption required for train starts and stops and also reduces the number of trains required. However, in the overtaking mode of express and slow trains, an overtaking station needs to be established, which costs a lot. In the no-overtaking mode of express and slow trains, if the line is divided in a common track, a lot of rectification work needs to be carried out to the line. In the express train operation scheme, the number of stops is the least. Moreover, all express trains have the least total turnover time and the minimum number of trains required. Express trains can run on a common track, and no additional planning is required. Therefore, in terms of operating costs of operating enterprises, the express train operation scheme saves the most cost. Combined with the current situation of Beijing rail transit, the conditions are unsuitable to set up overtaking stations on the existing rail transit lines. In addition, the cost is huge. Therefore, the express train operation scheme is feasible for Beijing rail transit.
The results of empirical research show that the express train operation scheme reduces the cost of train starts and stops by 27.78%, which will speed up the operation of trains, improve the operation efficiency of the operating enterprise and reduce the operation cost. After optimization of the express train operation scheme, more than half of the passengers’ travel time will be reduced, the total travel time can be reduced by more than 11%, the unnecessary waiting time can be reduced by more than 57% and the full load rate of the train can be maintained at a more comfortable level. Therefore, the method adopted in this paper can meet the needs of fast travel and enhance the comfort of trains, which will improve the attractiveness of urban rail transit. The model and method proposed in this paper can promote the benign interaction between operators and passengers, provide a theoretical basis for the formulation of public norms of a train operation scheme, make the public norms more scientific and reasonable and promote the development of urban rail transit.

5.2. Conclusions

The train operation scheme is the most critical part of the rail transit operation. A reasonable operation plan can speed up the train turnover, improve the operation efficiency and improve the capacity of the urban rail, thus saving the travel time and cost of passengers, reducing the operation cost of operating enterprises and comprehensively developing the transportation capacity of urban rail transit. In this paper, based on the passenger flow conditions, the express train operation scheme was studied, an optimization model of the express train operation scheme was stablished and a heuristic genetic algorithm was used to solve the model.
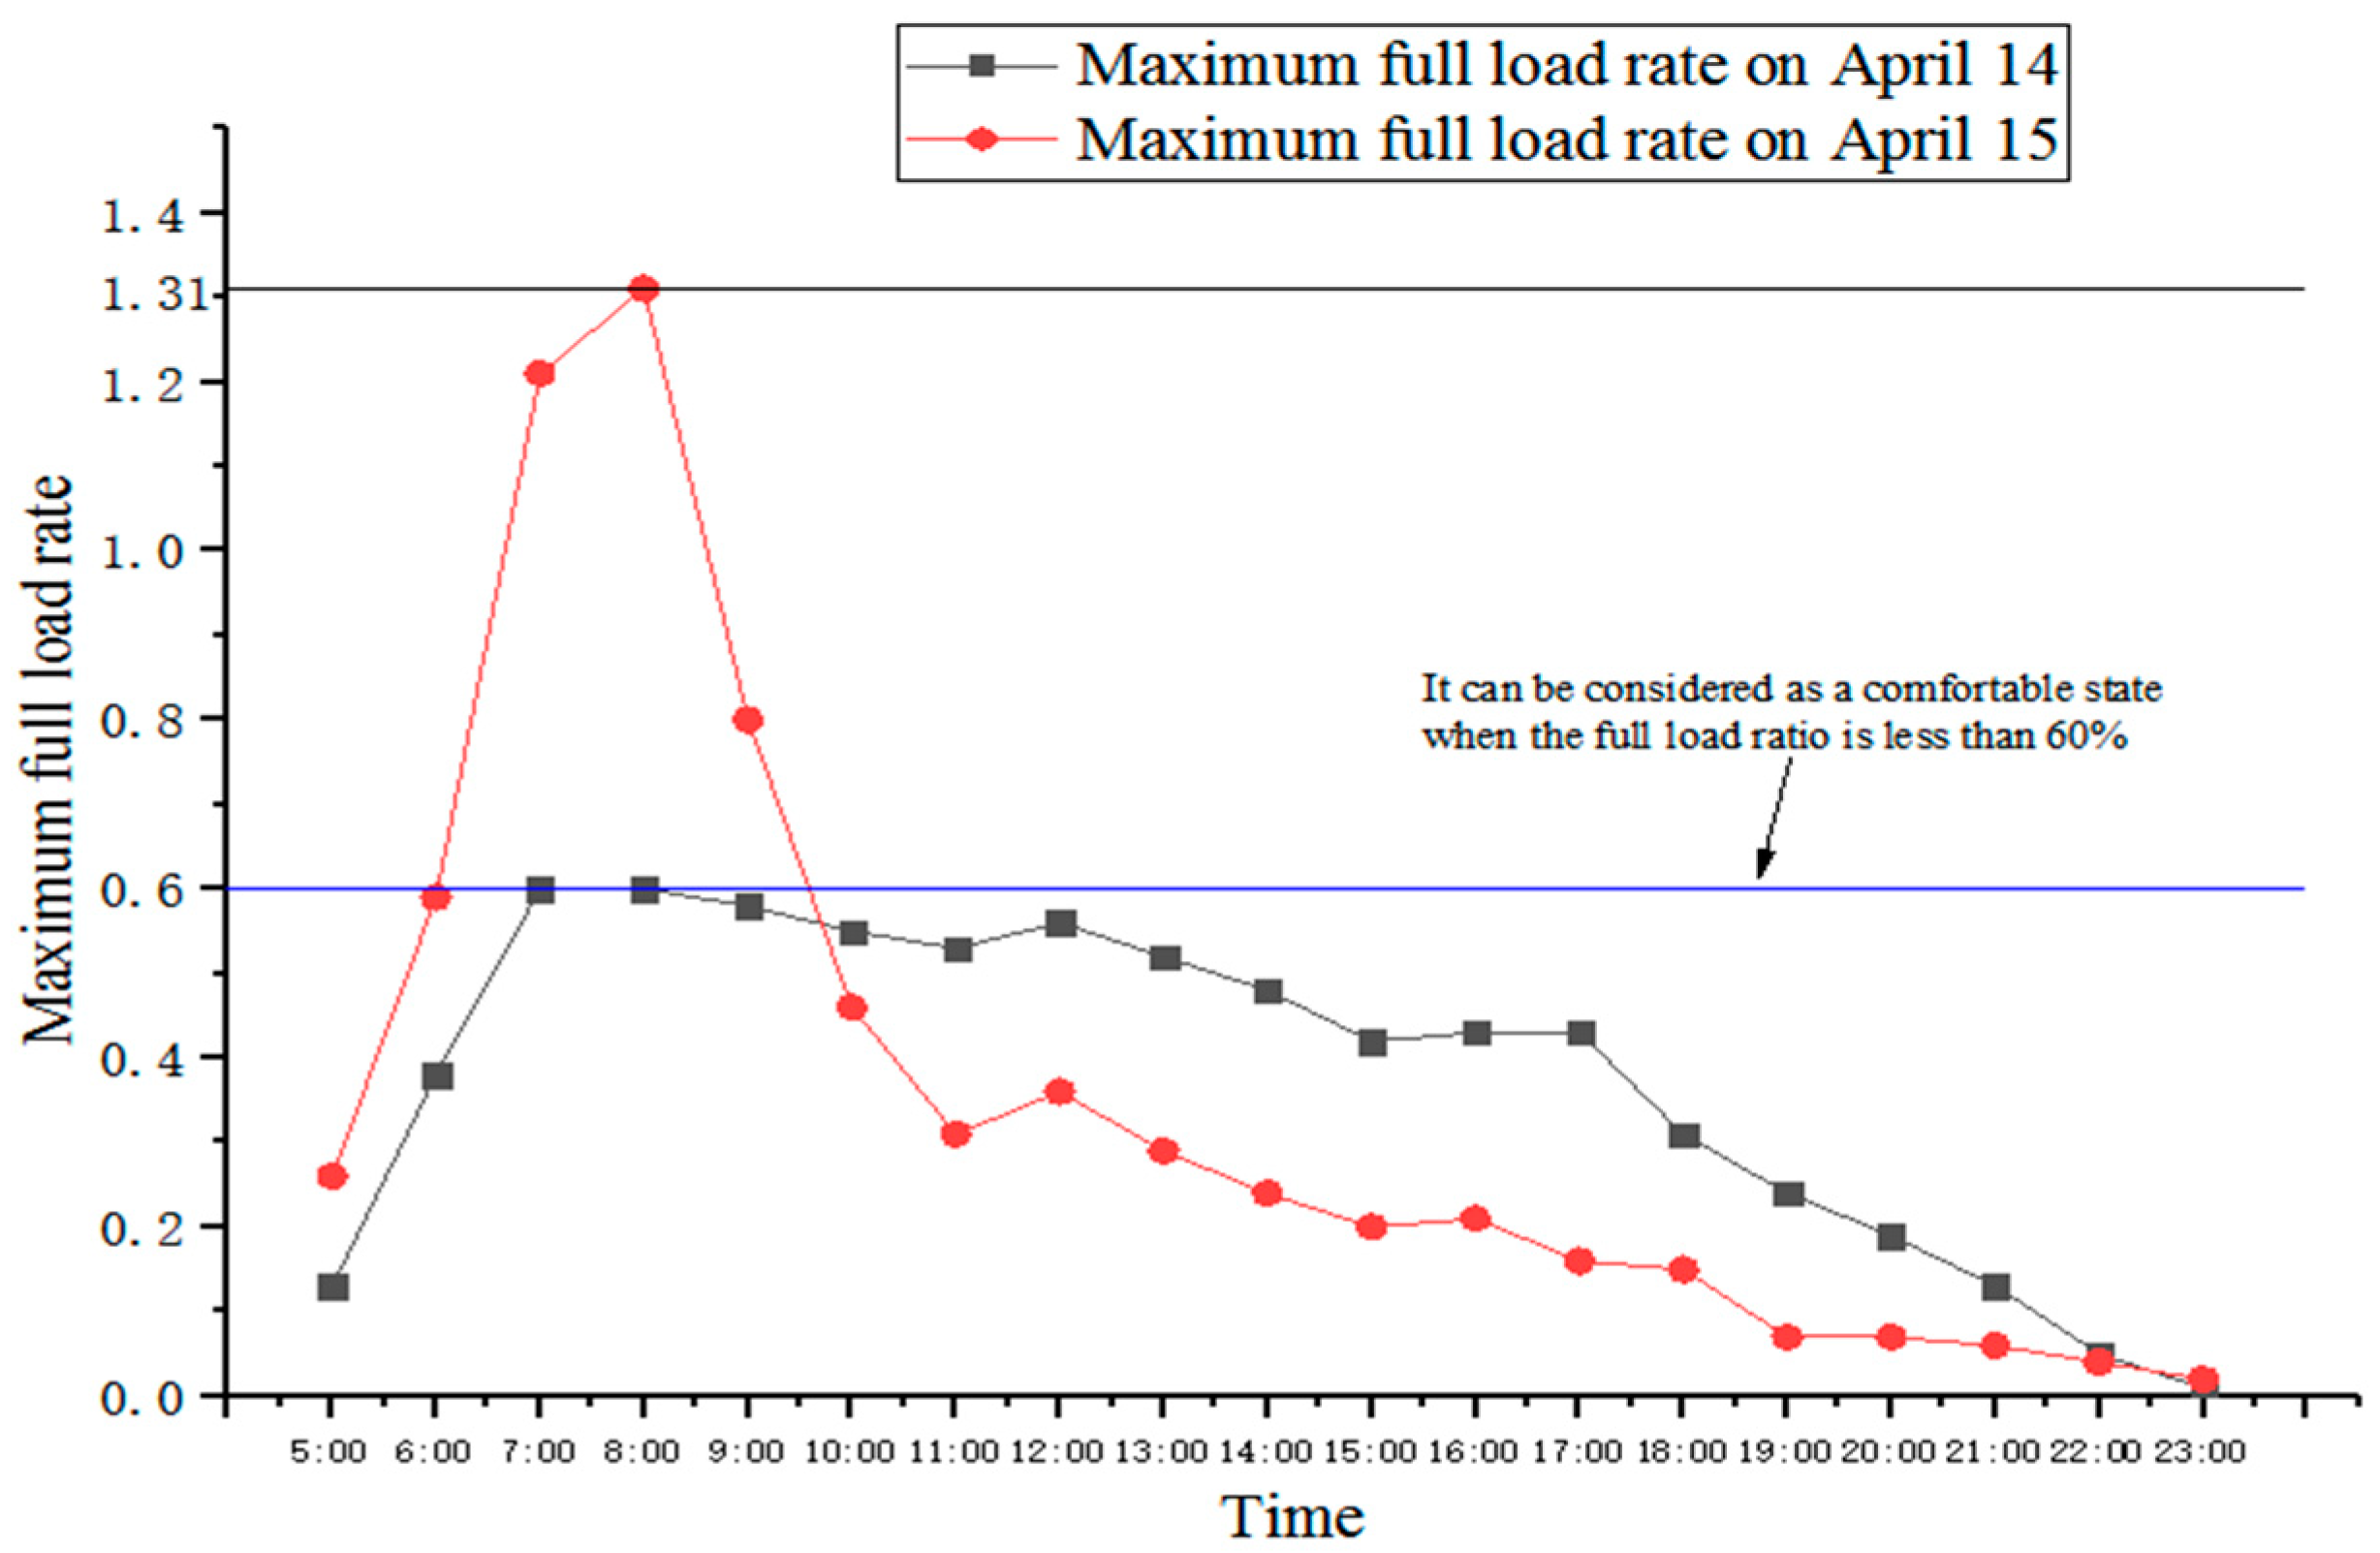
Based on the actual passenger flow data of the Changping Line in Beijing, the model was validated and analyzed. From the experimental data, after the operation of the express train operation scheme, the full load rate of the train was maintained at about 60% on weekends and the maximum full load rate of the train in the peak period on Monday also decreased to a certain extent. This can not only enhance the comfort of passengers but also reduce the resource wastage caused by trains. In terms of time, more than half of the passengers can reduce their travel time whether on weekends or Mondays. The total travel time can be reduced by more than 11%, and the unnecessary waiting time can be reduced by more than 57%. From the perspective of operating costs of operating enterprises, the starting and stopping costs of trains can be reduced by 27.78%, which speeds up the operation of trains, improves the operating efficiency of operating enterprises and reduces operating costs. Therefore, the optimization model of the express train operation scheme proposed in this paper is reasonable, feasible and effective and can significantly improve the capacity of urban rail transit, reduce the travel time and cost of passengers and the operating cost of operating enterprises, enhance the attractiveness of rail transit, meet the fast travel needs of passengers and form a benign interaction between operating enterprises and passengers. The model and method proposed in this paper provide a theoretical basis for the formulation of public norms of the express train operation scheme, make it more reasonable and scientific and promote the development of urban rail transit.

Author Contributions

Conceptualization, H.L. and S.Z.; methodology, H.L.; software, H.L.; validation, B.C., W.C. and Y.Z.; formal analysis, H.L., B.W. and B.C.; investigation, W.C.; resources, W.C.; data curation, B.W.; writing—original draft, H.L.; writing—review and editing, W.C.; visualization, H.L. and S.Z.; supervision, S.Z.; project administration, S.Z.; funding acquisition, S.Z. All authors have read and agreed to the published version of the manuscript.

Funding

This research was funded by the National Natural Science Foundation of China (grant no. 71971013) and the Fundamental Research Funds for the Central Universities (YWF-20-BJ-J-943). This research was also funded by the Graduate Student Education & Development Foundation of Beihang University.

Institutional Review Board Statement

Not applicable.

Informed Consent Statement

Not applicable.

Data Availability Statement

Not applicable.

Conflicts of Interest

The authors declare no conflict of interest.

References

  1. Salet, W. Public Norms in Practices of Transitional Planning—The Case of Energy Transition in The Netherlands. Sustainability 2021, 13, 4454. [Google Scholar] [CrossRef]
  2. Li, M.; Wang, Y.; Jia, L. The modeling of attraction characteristics regarding passenger flow in urban rail transit network based on field theory. PLoS ONE 2017, 12, e0184131. [Google Scholar] [CrossRef] [PubMed] [Green Version]
  3. Zhao, R.; Zhang, Z.; Cheng, F.; Tang, H. Characteristics of Urban Rail Transit Passenger Flow in Chongqing. DEStech Trans. Comput. Sci. Eng. 2017. [Google Scholar] [CrossRef] [Green Version]
  4. Hongyan, L.; Hua, Z.; Xi, H. Analysis of Characteristics of Passenger Flow of Zhaojiabang Road Station on Shanghai Rail Transit Line 9. In Proceedings of the Second International Conference on Business Computing and Global Informatization (BCGIN), Shanghai, China, 12–14 October 2012. [Google Scholar]
  5. Tu, Q.; Weng, J.C.; Wang, C. A dynamic identification method of passenger flow congestion risk in rail transit hub station based on grey clustering. In Proceedings of the International Conference on Transportation Information & Safety, Banff, AB, Canada, 8–10 August 2017. [Google Scholar]
  6. Liu, S.; Yao, E.; Cheng, X.; Zhang, Y. Evaluating the impact of new lines on entrance/exit passenger flow of adjacent existing stations in urban rail transit system. Transp. Res. Procedia 2017, 25, 2625–2638. [Google Scholar] [CrossRef]
  7. Li, X.; Chen, P.; Chen, F.; Wang, Z. Passenger flow analysis of Beijing urban rail transit network using fractal approach. Mod. Phys. Lett. B 2018, 32, 1850001. [Google Scholar] [CrossRef]
  8. Tong, T.T.; Cheng, L.Q. Research on Attraction Scope of Urban Rail Transit Station to the Conventional Bus Passenger Flow. In Proceedings of the International Conference on Intelligent Computation Technology & Automation, Changsha, China, 11–12 May 2010. [Google Scholar]
  9. Sone, S. Initiative to standardize Tokyo commuter EMUs. Jpn. Railw. Transp. Rev. 2005, 41, 24–29. [Google Scholar]
  10. Sakano, R.; Benjamin, J. A structural model of mode-activity choice: The case of commuter rail in a medium-size metropolitan area. Transp. Policy 2011, 18, 434–445. [Google Scholar] [CrossRef]
  11. Sakano, R.; Benjamin, J.M. A structural equations analysis of revealed and stated travel mode and activity choices. Transportmetrica 2008, 4, 97–115. [Google Scholar] [CrossRef]
  12. Johansson, M.V.; Heldt, T.; Johansson, P. The effects of attitudes and personality traits on mode choice. Transp. Res. Part A 2006, 40, 507–525. [Google Scholar] [CrossRef] [Green Version]
  13. Cai, Z.; Li, T.; Su, X.; Guo, L.; Ding, Z. Research on Analysis Method of Characteristics Generation of Urban Rail Transit. IEEE Trans. Intell. Transp. Syst. 2019, 21, 1–13. [Google Scholar] [CrossRef]
  14. Li, T.; Chen, Y.; Wang, Z.; Liu, Z.; Ding, R.; Xue, S. Analysis of Jobs-Housing Relationship and Commuting Characteristics Around Urban Rail Transit Stations. IEEE Access 2019, 7, 175083–175092. [Google Scholar] [CrossRef]
  15. Wang, B.; Ye, M.; Zhu, Z.; Li, Y.; Liang, Q.; Zhang, J. Short-Term Passenger Flow Prediction for Urban Rail Stations Using Learning Network Based on Optimal Passenger Flow Information Input Algorithm. IEEE Access 2020, 8, 170742–170753. [Google Scholar] [CrossRef]
  16. Song, J.; Xu, R.; Miao, H. Problems of Operating the Express/Slow Train on the Regional Urban Rail Transit Line. Urban Mass Transit Mag. 2006, 12, 23–37. [Google Scholar]
  17. Lun, Z.; Yan, Y.; Wei, N.; Wenyi, Z.; Shuai, C. Analysis of Multi Running Modes for Long-short Route Operation Organization Based on Shanghai Metro Line 16. In Proceedings of the Fifth International Conference on Intelligent Computation Technology & Automation, Zhangjiajie, China, 12–14 January 2012. [Google Scholar]
  18. Xiang, H. The establishment of the express/slow metro train organization mode’s research system. J. Railw. Eng. Soc. 2014, 31, 101–104. [Google Scholar]
  19. Fu-Gui, C.; Jue, T. Research on the Principle of System Capacity Loss in the Mode of Express /Slow Urban Rail Transit. J. Railw. Eng. Soc. 2014, 31, 96–100. [Google Scholar]
  20. Tang, J.; Chen, F.G. Determination method of overtaking point in the metro express/slow train mode. J. Railw. Eng. Soc. 2014, 31, 89–93. [Google Scholar]
  21. Chun, J.H.; Anderson, R.M.; Paik, D. The S-train system: Synchronized express & local trains for urban commuter rail systems. In Proceedings of the 14th International IEEE Conference on Intelligent Transportation Systems (ITSC), Washington, DC, USA, 5–7 October 2011. [Google Scholar]
  22. Li, H.; Qin, L. Research on Optimization of City Line Express Trains Based on Multi-objective Particle Swarm Optimization Algorithm. In Proceedings of the 4th International Conference on Intelligent Transportation Engineering, Singapore, 6–8 September 2019. [Google Scholar]
  23. Ding, X.; Yang, X.; Hu, H.; Liu, Z.; Pan, H. The Optimization of Passengers’ Travel Time under Express-Slow Mode Based on Suburban Line. Math. Probl. Eng. 2016, 2016, 1–7. [Google Scholar] [CrossRef]
  24. Ding, X.; Zhang, S.; Liu, Z.; Hu, H.; Xu, X.; Xu, W. The Analysis and Calculation Method of Urban Rail Transit Carrying Capacity Based on Express-Slow Mode. Math. Probl. Eng. 2016, 2016, 1–9. [Google Scholar] [CrossRef]
  25. Zhao, Y.; Tan, X.T.; Chen, F.G.; Cao, S.C. On Comprehensive Evaluation System for Mixed Express and Slow Train Operation of Urban Rail Transit. Railw. Stand. Des. 2017, 61, 65–67, 75. [Google Scholar]
  26. Pan, H.; Yang, T. Express/Slow Train on Urban Rail Transit Line Based on Carrying Capacity. Urban Mass Transit 2009, 12, 48–51. [Google Scholar]
  27. Xu, J.Q. Research on the Combined Express/Slow Train Operation Mode on Shenzhen Metro Line 13. Urban Mass Transit 2018, 21, 47–51, 55. [Google Scholar]
  28. Wang, X.; Yu, D. Modeling and Simulation of Express/Slow Trains Operation in Rail Transit. Railw. Signal. Commun. Eng. 2017, 14, 69–73. [Google Scholar]
  29. Castelli, L.; Pesenti, R.; Ukovich, W. Scheduling multimodal transportation systems. Eur. J. Oper. Res. 2004, 155, 603–615. [Google Scholar] [CrossRef]
  30. Salzborn, F.J.M. Timetables for a Suburban Rail Transit System. Transp. Sci. 1969, 3, 297–316. [Google Scholar] [CrossRef]
  31. Ghoseiri, K.; Szidarovszky, F.; Asgharpour, M.J. A multi-objective train scheduling model and solution. Transp. Res. Part B Methodol. 2004, 38, 927–952. [Google Scholar] [CrossRef]
  32. Gupta, S.D.; Tobin, J.K.; Pavel, L. A Two-Step Linear Programming Model for Energy-Efficient Timetables in Metro Railway Networks. Transp. Res. Part B 2016, 93, 57–74. [Google Scholar] [CrossRef] [Green Version]
  33. Assis, W.O.; Milani, B.E.A. Generation of optimal schedules for metro lines using model predictive control. Automatica 2004, 40, 1397–1404. [Google Scholar] [CrossRef]
  34. He, D.; Zhang, L.; Guo, S.; Chen, Y.; Shan, S.; Jian, H. Energy-efficient Train Trajectory Optimization Based on Improved Differential Evolution Algorithm and Multi-particle Model. J. Clean. Prod. 2021, 304, 127163. [Google Scholar] [CrossRef]
  35. Xu, H.; Yan, Y.S. Integrated Planning Model of Land-Use Layout and Transportation Network Design for Regional Urbanization in China Based on TOD Theory. J. Urban. Plan. Dev. 2021, 147. [Google Scholar]
  36. Huang, K.; Wu, J.; Liao, F.; Sun, H.; He, F.; Gao, Z. Incorporating multimodal coordination into timetabling optimization of the last trains in an urban railway network. Transp. Res. Part C Emerg. Technol. 2021, 124, 102889. [Google Scholar] [CrossRef]
  37. Yin, Y.; Li, D.; Zhao, K.; Yang, R. Optimum Equilibrium Passenger Flow Control Strategies with Delay Penalty Functions under Oversaturated Condition on Urban Rail Transit. J. Adv. Transp. 2021, 2021, 1–27. [Google Scholar]
  38. Zhou, Y.; Zhou, S.; Wang, B.; Xiao, Y.; Chang, W.; Wei, F. The Feasibility Research on Express/Local Train Plan of Beijing Subway with Passenger Flow Analysis. In Proceedings of the International Conference on Decision Science & Management, Hong Kong, China, 8–10 January 2020. [Google Scholar]
Figure 1. Flowchart of establishing an optimization model of the express train operation scheme.
Sustainability 13 07187 g001
Figure 2. Coding diagram.
Sustainability 13 07187 g002
Figure 3. Hourly coefficients of the Changping Line.
Sustainability 13 07187 g003
Figure 4. Section passenger flow on 14 and 15 April.
Sustainability 13 07187 g004
Figure 5. Number of people traveling down the Changping Line.
Sustainability 13 07187 g005
Figure 6. Cumulative proportion of passenger flow between stations at 10:00 a.m. on 14 April.
Sustainability 13 07187 g006
Figure 7. Cumulative proportion of passenger flow between stations at 8:00 a.m. on 15 April.
Sustainability 13 07187 g007
Figure 8. Average full load rate of the Changping Line.
Sustainability 13 07187 g008
Figure 9. Maximum full load rate of Changping line.
Sustainability 13 07187 g009
Figure 10. Adaptability curve of passenger flow data on 14 April.
Sustainability 13 07187 g010
Figure 11. Adaptability curve of passenger flow data on 15 April.
Sustainability 13 07187 g011
Figure 12. Statistics on saving the number of classified stops (4.14).
Sustainability 13 07187 g012
Figure 13. Statistics on saving the number of classified stops (4.15).
Sustainability 13 07187 g013
Table 1. Evaluating the balance of the line passenger flow time distribution.
EquilibriumEquilibrium Coefficient
Uneven≥2.0
General disequilibrium1.5–1.9
More balanced<1.5
Table 2. Evaluating the direction equalization degree of a line.
Direction Equalization DegreeDirection Equalization Coefficient
More balanced<1.5
Poor degree of equilibrium≥1.5
Table 3. Evaluating the section equalization degree of a line.
Section Equalization DegreeSection Equalization Coefficient
More balanced<1.5
Poor degree of equilibrium≥1.5
Table 4. Basic information of Beijing rail transit lines.
Line NameNumber of StationsLength (km)Line NameNumber of StationsLength (km)
Line 12331Line 142643.8
Line 21823.1Line 152041.4
Line 43528.2Line 161019.4
Line 52327.6Batong Line1319
Line 63553.1Changping Line1231.9
Line 71923.7Fangshan Line1225.4
Line 81926.6Yizhuang Line1323.2
1318.3Yanfang Line1214.4
Line 91316.5Line S179.4
Line 104657.1Xijiao Line69.1
Line 131640.9Airport Line428.1
Table 5. Comfort classification standard of domestic urban rail transit cars.
CityComfort RatingRemarks
BeijingComfort: (0%, 60%)
Mild crowding: (60%, 90%)
Crowding: (90%, 110%)
Severe congestion: ≥110%
Sustainability 13 07187 i001
Table 6. Section line length and pure running time.
Start/End StationInterval Distance (m)Pure Run Time (s)
Changping Xishankou/Ming Tombs121390
Ming Tombs/Changping3508180
Changping/Changping Dongguan2433138
Changping Dongguan/Beishaowa1683108
Beishaowa/Nanshao1958120
Nanshao/Shahe University Park5357240
Shahe University Park/Shahe1964120
Shahe/Gonghuacheng2025120
Gonghuacheng/Zhuxinzhuang3799180
Zhuxinzhuang/Life Science Park2367138
Life Science Park/Xi’erqi5440240
Table 7. Model parameter value.
ParameterValue
Research duration T1 h
Stop loss time t l o s t 50 s
Train capacity C1200 people
Minimum time interval between trains t m i n 120 s
Lower limit of full load rate η m i n 0.1
Upper limit of full load rate η m a x 0.85
Table 8. Parameter selection of the heuristic genetic algorithm.
ParameterValue
Initial population size (popsize)100
Crossover probability (pc)0.9
Mutation probability (pm)0.1
Maximum number of iterations (maxgen)50
Penalty coefficient of infeasible solution (pe)6,000,000
Table 9. Express train stop plan on 14 April from 10:00 to 11:00 a.m.
Station123456789101112Frequency
11101111100013
21110000011113
31011111111113
Table 10. Express train stop plan on 15 April from 8:00 to 9:00 a.m.
Station123456789101112Frequency
11101111111114
21111001100014
31010110011114
Table 11. Time-saving passenger flow.
DateTotal Passenger FlowTime-Saving Passenger FlowProportion
14 April6769381956.42%
15 April10,048774077.03%
Table 12. Full load ratios of three types of express trains.
DateExpress Train TypePassenger Flow VolumeFull Load RateFull Load Rate before Optimization
14 April1256771.31%55%
2205357.03%
3214959.69%
15 April1210643.88%131%
24850101.04%
3309264.42%
Table 13. Passengers saving time.
Total Travel Time (s)Total Stop Time (s)
Total travel time before optimization6,011,818 (4.14)Total stop time before optimization1,160,050 (4.14)
9,388,678 (4.15)1,827,850 (4.15)
Total travel time after optimization5,321,368 (4.14)Total stop time after optimization469,600 (4.14)
8,333,278 (4.15)776,100 (4.15)
Total travel time saved690,450 (4.14)Total stop time saved690,450 (4.14)
1,055,400 (4.15)1,051,750 (4.15)
Saving ratio11.48% (4.14)Saving ratio59.52% (4.14)
11.24% (4.15)57.54% (4.15)
Table 14. Reducing the number of stops.
PassengerOperating Enterprise
Total number of stops per capita before optimization3.41 (4.14)Number of stops before optimization108 (4.14)
3.63 (4.15)108 (4.15)
Total number of stops per capita after optimization1.38 (4.14)Number of stops after optimization78 (4.14)
1.54 (4.15)78 (4.15)
Saving ratio59.55% (4.14)Saving ratio27.78% (4.14)
57.52% (4.15)27.78% (4.15)
Publisher’s Note: MDPI stays neutral with regard to jurisdictional claims in published maps and institutional affiliations.

