
Configuration of an Integrated Quality-Social Responsibility-Performance Management System in the Hospitality Industry. Case Studies: Balneary Tourism Romania


Abstract
:1. Introduction
2. Literature Review
- Australian Business Excellence Framework (ABEF)—implemented in Australia, the model takes into consideration seven categories: leadership, customers and other stakeholders, strategy and planning, people, information and knowledge, process management—implementation and innovation, results, and sustainable performances [43];
- Malcolm Baldrige National Quality Award (MBNQA)—used in over 25 countries including the U.S.A. and New Zeeland, the model is configured on three main elements: strategy and action plans, an organizational system and the results according to which it is assessed on whether the performance criteria are met. The seven categories of criteria include decisive factors (1–6) and results (7), developed around 19 sub-criteria with scores between 15 and 115 points: leadership—125p., strategic planning—85p., customer and market orientation—85p., human resources orientation—85p., process management—85p., business results (4–50p.), and information and analysis (4–85p.). [44];
- Canadian Business Excellence Model (CBEM)—developed in Canada, the model takes into consideration the following criteria: leadership, planning, customer orientation, human resources orientation, process management, and partner orientation [45];
- European Foundation for Quality Management (EFQM)—applied in Europe, the model is based on nine criteria: five decisive factors (leadership—10%, policy and strategy—8%, personnel—9%, partnerships and resources—9%, processes—14%) and four results (results regarding customers—20%, results regarding personnel—9%, results regarding society—6%, and results regarding critical performances—15%) [46];
- The Deming Award (Japan Quality Award Premium) (JQAP)—used in Japan and the countries in Southeast Asia, the model is based on eight criteria: leadership and social responsibility—150p., strategic planning—50p., information management—50p., human resources—50p., customers and market—100p., value development—100p., results—400p., learning process—50p. [47];
- Singapore Quality Award Model (SQAM)—applied in Singapore, the model aims at: management (vision and leadership), systems (strategies, human resources, development and learning, environment, process), and results (organization results, customer satisfaction) [48].
3. Materials and Methods
4. Results and Discussion
4.1. Distinctness and Commonness in the Approaches of the Quality Management, Performance and Social Responsibility Systems
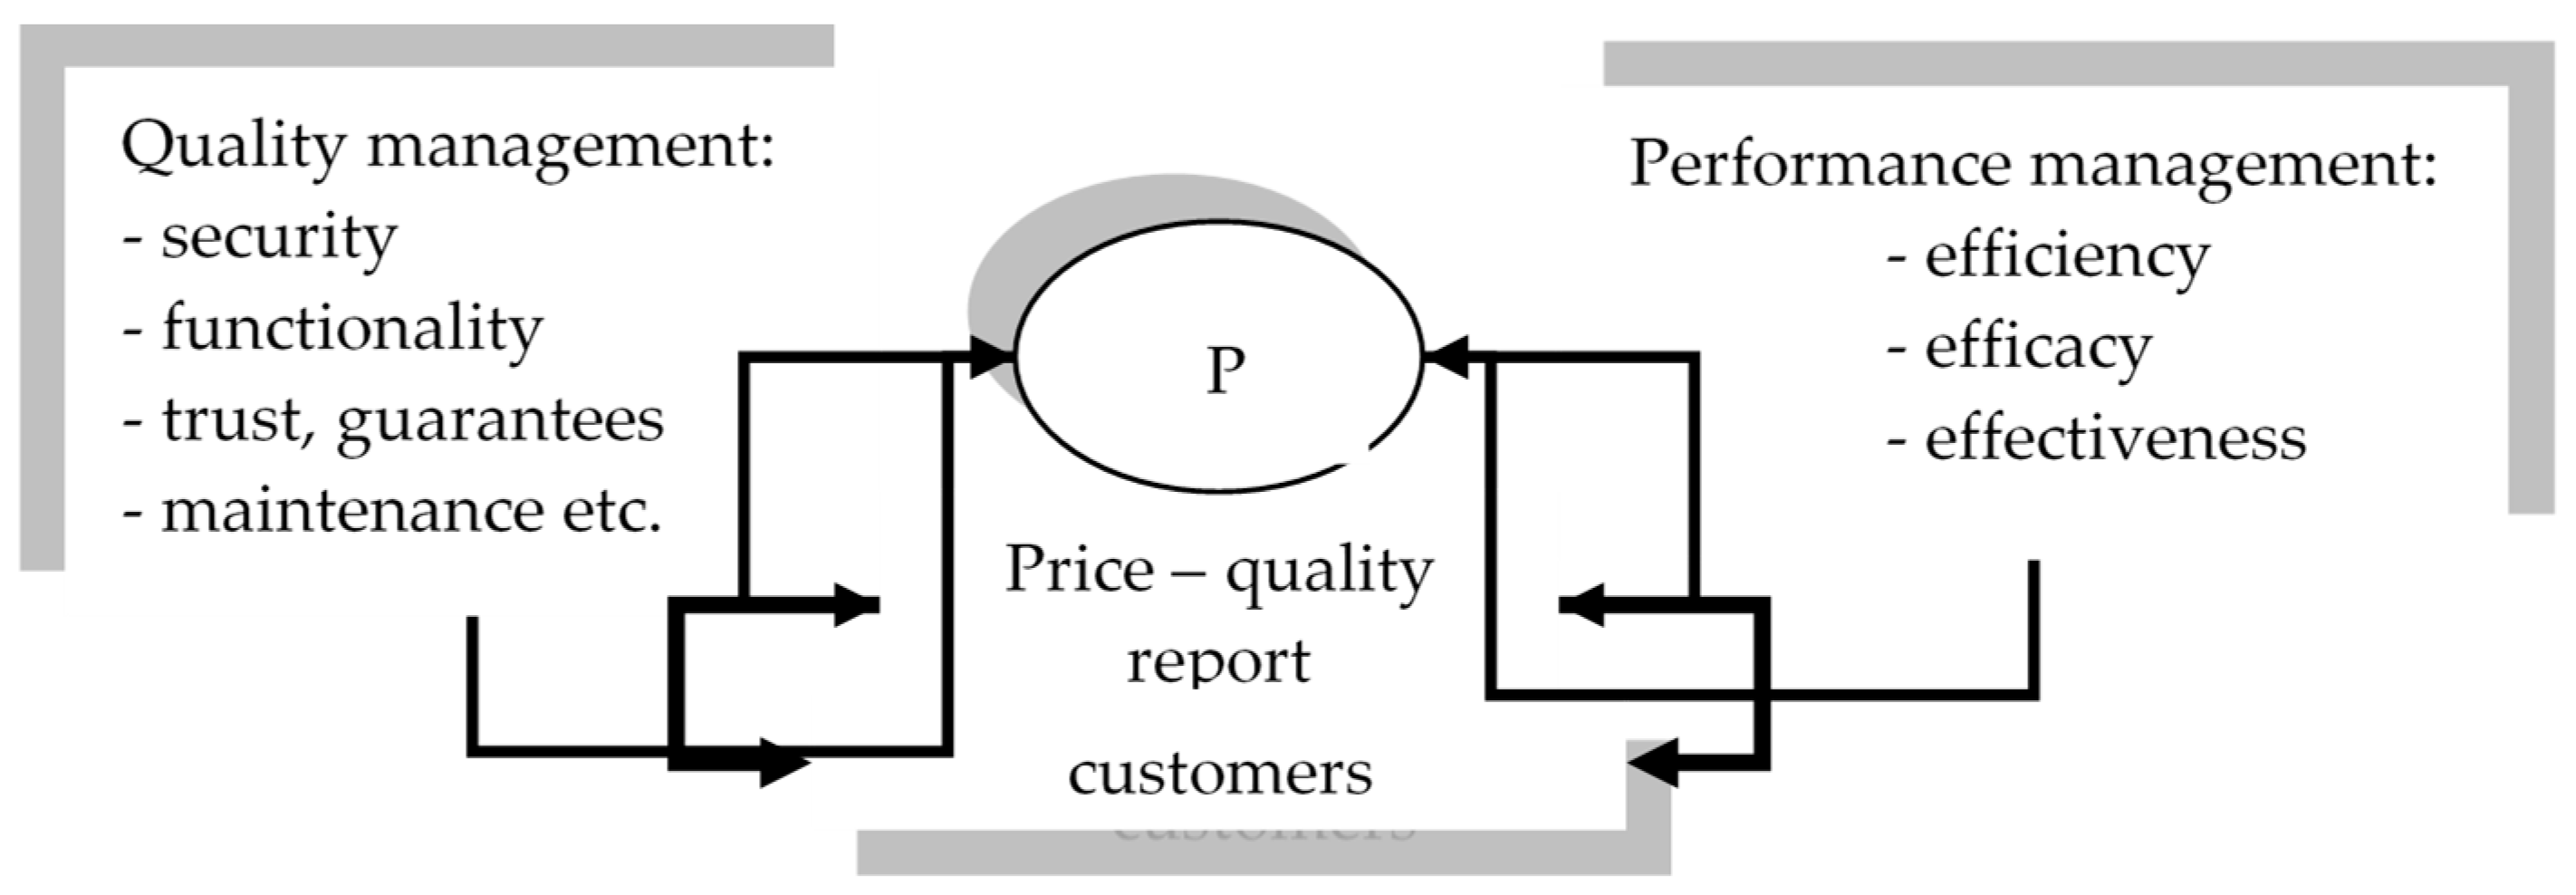
- Quality management is oriented to the customer and validates the organization’s effort for quality and performance; the entire philosophy of quality management is focused on customer satisfaction by providing products and services that meet the customer’s expectations and perceptions. These are used under the conditions of maximum security with minimal supplementary costs. To that end, quality standards require quality follow-up during the entire life cycle of the product, from design, production, distribution, sale, and utilization to its elimination;
- Performance targets efficiency, efficacy, and effectiveness. Performance assessment is subjective, interpretative, and assessed in a certain context in line with certain relevant values and subjects. It refers to a result/action or a diversity of results/actions that are individual, related to team/organization/sector/system, or general. At the organizational level, the cost/benefit ratio will always guide performance management, as it determines the monetary and non-monetary remuneration of stakeholders;
- Social responsibility involves two major components: the assumption and the identification and commitment to meet the expectations of stakeholders. The main expectations of society (population, community, authorities) are aimed at urban development, supporting education and art, cooperation with the local administration, paying taxes and contributions, and participating in the establishment of regulations. A major component of responsibility is the ecologic one. From this point of view, one can say that the stakeholder represents the planet and its entire population (primum non nocere), having obligations regarding the reduction of pollution, the parsimony of resource consumption, and the preservation of diversity as an imperative of sustainable development. Consumers’ expectations are based on information, accurate treatments, and the quality and safety for products, services, and guarantees. The shareholders’ allocation of capital into organizations involves expectations concerning business growth, wealth maximization, and the optimal remuneration of capital. The organizations’ employees wish for good working conditions and remuneration, the on time payment of salaries and related debts, safety at work, freedom of speech, training opportunities, and perspective. Creditors ask for the discharge of obligations on time and the horizontally and vertically aggregated margin growth on the value chain.
- They are orientated, and their final goal is to meet the expectations of stakeholders. Even if the orientations of the three systems are distinct and well-established, we must notice the fact that there is an explicitly common target: the customer. Every good/service is created to be sold on the market, and organizations have the obligation to provide products that have been manufactured according to quality standards at the most favorable prices (performance);
- They require the implication of top management. Leaders are those who actually have the vision of organizational growth. They elaborate strategies, establish goals, and organize the processes for their achievement;
- Their common purpose is to create added value as a consequence of business performance and quality resulting in the quality-price ratio validated by consumers (Figure 1). The added value ensures the direct remuneration of certain stakeholders: employees, the state (at central and local level), and financial creditors. According to the adopted strategies, the remaining value is destined for shareholders, employees, and organizational growth as well as to the payment of corporate tax. A part of it can be oriented to charity. In this case, the state becomes a partner in supporting the organization’s initiatives;
- They are process oriented. During the transformation of goods/services inputs into outputs, a series of productive, administrative and, leadership processes take place [50]. Quality management aims at the stakeholders’ satisfaction during all of the transformation processes, orienting them towards the avoidance of losses and scrap (cost savings, quality growth). The models used in performance management (BSC, PP, TQM etc.) have components orientated to the processes of strategy implementation. Generally, they are classified as processes of production, generation and satisfaction of demand, and planning and leadership and are structured into sub-processes and activities. The value chain identifies five primary activities and four support activities. In all approaches, the management must guarantee the fact that the processes concern the application of strategies and the achievement of objectives through different measures: incrementalism or redesign, which will generate other processes, the performance of which must be monitored. The BSC model explicitly provides organizational measures as well (eliminating the redundancy of certain activities and informational circuits, the inappropriate establishment intro structures, and automation), with an impact on performance. Social responsibility intervenes from two points of view: one regarding the concern for the reduction or eradication of pollution within all processes and the other regarding the enduring of stakeholders’ satisfaction through creative added value processes;
- Continuous learning and improvement are major components, well-defined both in the quality and performance management. In a situation where it is acknowledged that there is no perfect method of organization, this principle, which is common to all three approaches, implies a continuous analysis of processes and activities in relation to the internal and external constraints as well as the dynamic adoption of decisions that ensures the achievement of objectives. Moreover, the continuous training of 1employees through new information, regulations, etc., is considered vital for the organization. The improvement of communication through adopting a common language, concepts, procedures, and regulations, all equally perceived and assumed, will lead to the elimination of errors, irregularities, and delays, reflected in the elimination of losses and the reduction of hidden costs;
- They use a similar combinationof theories: the organizational theory, the system theory, the contingency theory, the strategic analysis (the most recent version of the quality standards explicitly affirms the necessity of enumerating the threats and constrictions in the assessment and prevention of risks; in this context, there is mention of the role of the internal audit in the verification of compliance with the established procedures and also of the efficacy and efficiency of organizational regulations, structures, and mechanisms), the stakeholders theory etc.;
- They approach the organization as a distinct organism, different from all the others, and specifically adapt the instruments to each system. From the quality, performance, and social responsibility point of view, equifinality does not reject the diversity of the ways to achieve the specific objectives to each organization;
- The interdisciplinary and multidisciplinary characteristics of the three systems generated by the complexity of these issues.
4.2. Economic and Financial Analysis in the Assessment of Integrated Systems
5. Conclusions
Author Contributions
Funding
Institutional Review Board Statement
Informed Consent Statement
Data Availability Statement
Conflicts of Interest
References
- Longo, M.; Mura, M.; Bonoli, A. Corporate social responsibility and corporate performance: The case of Italian SMEs. Corp. Gov. 2005, 5, 28–42. [Google Scholar] [CrossRef]
- ISO 26000 SOCIAL Responsibility. Available online: https://www.iso.org/iso-26000-social-responsibility.html (accessed on 30 March 2021).
- Anica-Popa, A. The notion of performance and economic analysis. J. Appl. Econ. 2017, 1, 46–54. [Google Scholar]
- Wholey, J.S. Formative and Summative Evaluation: Related Issues in Performance Measurement. Am. J. Eval. 1996, 17, 145–149. [Google Scholar]
- Mcwilliams, A.; Siegel, D. Corporate social responsibility and financial performance: Correlation or misspecification? Strateg. Manag. J. 2000, 21, 603–609. [Google Scholar] [CrossRef]
- Cochran, P.L.; Wood, R.A. Corporate Social Responsibility and Financial Performance. Acad. Manag. J. 1984, 27, 42–56. [Google Scholar]
- Nollet, J.; Filis, G.; Mitrokostas, E. Corporate social responsibility and financial performance: A non-linear and disaggregated approach. Econ. Model. 2016, 52, 400–407. [Google Scholar] [CrossRef] [Green Version]
- Tsoutsoura, M. Corporate Social Responsibility and Financial Performance. UC Berkeley Working Paper Series. Available online: https://escholarship.org/content/qt111799p2/qt111799p2.pdf (accessed on 19 June 2021).
- Becchetti, L.; Di Giacomo, S.; Pinnacchio, D. Corporate social responsibility and corporate performance: Evidence from a panel of US listed companies. Appl. Econ. 2008, 40, 541–567. [Google Scholar] [CrossRef] [Green Version]
- Mackey, A.; Mackey, T.B.; Barney, J.B. Corporate social responsibility and firm performance: Investor preferences and corporate strategies. Acad. Manag. Rev. 2007, 32, 817–835. [Google Scholar] [CrossRef]
- Barnett, M.L.; Salomon, R.M. Beyond dichotomy: The curvilinear relationship between social responsibility and financial performance. Strateg. Manag. J. 2006, 27, 1101–1122. [Google Scholar] [CrossRef]
- Han, J.J.; Kim, H.J.; Yu, J. Empirical study on relationship between corporate social responsibility and financial performance in Korea. Asian J. Sustain. Soc. Responsib. 2016, 1, 61–76. [Google Scholar] [CrossRef] [Green Version]
- Castka, P.; Bamber, C.J.; Bamber, D.J.; Sharp, J.M. Integrating corporate social responsibility (CSR) into ISO management systems—in search of a feasible CSR management system framework. TQM Mag. 2004, 16, 216–224. [Google Scholar] [CrossRef]
- CAB International. Available online: https://www.cabi.org (accessed on 19 June 2021).
- ISO 9000 Family—Quality Management. Available online: https://www.iso.org/iso-9001-quality-management.html (accessed on 30 March 2021).
- Camison, C. Total quality management in hospitality: An application of the EFQM model. Tour. Manag. 1996, 17, 191–201. [Google Scholar] [CrossRef]
- Augustyn, M.; Ho, S.K. Service Quality and Tourism. J. Travel Res. 1998, 37, 71–75. [Google Scholar] [CrossRef]
- Witt, C.; Muhlemann, A. The implementation of total quality management in tourism: Some guidelines. Tour. Manag. 1994, 15, 416–424. [Google Scholar] [CrossRef]
- Frolova, I.; Lapina, I. Corporate Social Responsibility in the Framework of Quality Management. Procedia Soc. Behav. Sci. 2016, 156, 178–182. [Google Scholar] [CrossRef] [Green Version]
- Brander Brown, J.; McDonnell, B. The balanced score-card: Short-term guest or long-term resident? Int. J. Contemp. Hosp. Manag. 1995, 7, 7–11. [Google Scholar] [CrossRef] [Green Version]
- Kaplan, R.S.; Norton, D.P. The Balanced Scorecard—Measures that Drive Performance. Harv. Bus. Rev. 1992, 83, 172. [Google Scholar]
- Phillips, P.; Louvieris, P. Performance measurement systems in tourism, hospitality and leisure small medium-sized enterprises: A balanced scorecard perspective. J. Travel Res. 2005, 44, 201–211. [Google Scholar] [CrossRef]
- Kaplan, R.S.; Norton, D.P. Linking the Balanced Scorecard to Strategy. Calif. Manag. Rev. 1996, 39, 53–79. Available online: http://www.strimgroup.com/wp-content/uploads/pdf/KaplanNorton_Linking-the-BSC-to-Strategy.pdf (accessed on 5 April 2021). [CrossRef]
- Neely, A.; Adams, C.; Crowe, P. The Performance Prism in Practice. Meas. Bus. Excell. 2001, 5, 6–13. [Google Scholar] [CrossRef]
- Hellsten, U.; Klefsjö, B. TQM as a management system consisting of values, techniques and tools. TQM Mag. 2000, 12, 238–244. [Google Scholar] [CrossRef]
- Speckbacher, G.; Bischof, J.; Pfeiffer, T. A descriptive analysis on the implementation of Balanced Scorecards in German-speaking countries. Manag. Account. Res. 2003, 14, 361–388. [Google Scholar] [CrossRef]
- Vila, M.; Costa, G.; Rovira, X. The creation and use of scorecards in tourism planning: A Spanish example. Tour. Manag. 2010, 31, 232–239. [Google Scholar] [CrossRef]
- Fatima, T.; Elbanna, S. Balanced scorecard in the hospitality and tourism industry: Past, present and future. Int. J. Hosp. Manag. 2020, 91, 102656. [Google Scholar] [CrossRef] [PubMed]
- Kaplan, R.S.; Norton, D.P. Strategy Maps: Converting Intangible Assets into Tangible Outcomes; Harvard Business School Press: Boston, MA, USA, 2004. [Google Scholar]
- Perlman, Y. Causal Relationships in the Balanced Scorecard: A Path Analysis Approach. J. Manag. Strategy 2013, 4, 1–10. [Google Scholar] [CrossRef] [Green Version]
- Ribeiro, M.L.; Vasconcelos, M.L.; Rocha, F. Monitoring performance indicators in the Portuguese hospitality sector. Int. J. Contemp. Hosp. Manag. 2019, 31, 790–811. [Google Scholar] [CrossRef]
- Truong, D.D.; Nguyen, H.; Duong, T.Q.L. Factors Influencing Balanced Scorecard Application in Evaluating the Performance of Tourist Firms. J. Asian Financ. Econ. Bus. 2020, 7, 217–224. [Google Scholar] [CrossRef]
- Sainaghi, R.; Phillips, P.; Corti, V. Measuring hotel performance: Using a balanced scorecard perspectives’ approach. Int. J. Hosp. Manag. 2013, 34, 150–159. [Google Scholar] [CrossRef]
- Giannoukou, I.; Beneki, C. Towards sustainability performance management system of tourism enterprises: A tourism sustainable balanced scorecard framework. Int. J. Glob. Environ. Issues 2018, 17, 175–196. [Google Scholar] [CrossRef]
- Steele, J. Implementing total quality management for long- and short-term bottom-line results. Natl. Product. Rev. 1993, 12, 425–441. [Google Scholar] [CrossRef]
- Kanji, G.K. Total quality management: The second industrial revolution. Total Qual. Manag. 1990, 1, 3–12. [Google Scholar] [CrossRef]
- Dale, B. Starting on the road to success. TQM Mag. 1999, 3, 125–128. [Google Scholar] [CrossRef]
- Claver-Cortés, E.; PereiragMoliner, J.; José Tarí, J.; Molina-Azorín, J.F. TQM, managerial factors and performance in the Spanish hotel industry. Ind. Manag. Data Syst. 2008, 108, 228–244. [Google Scholar] [CrossRef]
- Kapiki, S. Quality Management in Tourism and Hospitality: An Exploratory Study among Tourism Stakeholders. Int. J. Econ. Pract. Theor. 2012, 2, 1–9. [Google Scholar]
- Silvestri, C.; Aquilani, B.; Ruggieri, A. Service quality and customer satisfaction in thermal tourism. TQM J. 2017, 29, 55–81. [Google Scholar] [CrossRef]
- Talib, F.; Rahman, Z.; Qureshi, M.N.; Siddiqui, J. Total quality management and service quality: An exploratory study of management practices and barriers in service industries. Int. J. Serv. Oper. Manag. 2011, 10, 94–118. [Google Scholar] [CrossRef]
- Benavides-Velasco, C.A.; Quintana-Garcia, C.; Marchante-Lara, M. Total quality management, corporate social responsibility and performance in the hotel industry. Int. J. Hosp. Manag. 2014, 41, 77–87. [Google Scholar] [CrossRef]
- Australian Business Excellence Framework. Available online: https://www.saiglobal.com/improve/excellencemodels/businessexcellenceframework/ (accessed on 5 April 2021).
- Malcolm Baldrige National Quality Award. Available online: https://corporatefinanceinstitute.com/resources/knowledge/other/malcolm-baldrige-national-quality-award-mbnqa/ (accessed on 6 April 2021).
- Canadian Business Excellence Model. Available online: https://www.excellence.ca/en/knowledge-centre/products-and-tools/canadian-framework-for-business-excellence2 (accessed on 7 April 2021).
- European Foundation for Quality Management. Available online: https://www.efqm.org/efqm-model (accessed on 7 April 2021).
- Japan Quality Award Premium. Available online: http://www.jqac.com/en/index.asp?patten_cd=12&page_no=9 (accessed on 9 April 2021).
- Singapore Quality Award Model. Available online: https://www.enterprisesg.gov.sg/-/media/esg/files/quality-and-standards/business-excellence/be_framework.pdf?la=en (accessed on 12 April 2021).
- Demetrescu, M.C. Mecanismele Decizionale în Marketing; Editura Politica: Bucuresti, Romania, 1983; p. 560. [Google Scholar]
- Popescu, A.M. Responsibility in business, condition and expression of the durable, healthy development. Qual. Access Success 2015, 1, 525–528. [Google Scholar]
- Petcu, M.A.; David-Sobolevschi, I.M. Matrix approach of strategic positioning in the hospitality industry. Theor. Appl. Econ. 2009, 5, 134–142. [Google Scholar]
- European Commission: Internal Market, Industry, Entrepreneurship and SMEs. Available online: https://ec.europa.eu/growth/sectors/tourism/offer/sustainable/indicators_en (accessed on 20 June 2021).
- Haber, S.; Reichel, A. Identifying Performance Measures of Small Ventures—The Case of the Tourism Industry. J. Small Bus. Manag. 2005, 43, 257–286. [Google Scholar] [CrossRef]
- Cui, D. Factors Affecting Financial Performance of Tourism Destination Firms Listed on Stock Exchanges in China. Proc. Bus. Econ. Stud. 2019, 2, 1–6. [Google Scholar] [CrossRef]
- Hiadlovský, V.; Rybovičová, I.; Vinczeová, M. Importance of liquidity analysis in the process of financial management of companies operating in the tourism sector in Slovakia: An empirical study. Int. J. Qual. Res. 2017, 10, 799–812. [Google Scholar]
- Ghalayini, A.; Noble, J. The Changing Basis of Performance Measurement. Int. J. Oper. Prod. Manag. 1996, 16, 63–80. [Google Scholar] [CrossRef]
- Lee, J.W.; Manorungrueangrat, P. Regression Analysis with Dummy Variables: Innovation and Firm Performance in the Tourism Industry. In Quantitative Tourism Research in Asia. Perspectives on Asian Tourism; Rezaei, S., Ed.; Springer: Singapore, 2019. [Google Scholar]
- Walmsley, A. Assessing staff turnover: A view from the English Riviera. Int. J. Tour. Res. 2004, 6, 275–287. [Google Scholar] [CrossRef]
- European Spas Association. Available online: https://www.europeanspas.eu/ (accessed on 20 June 2021).


| Criteria | Sub-Criteria | % | E1 | E2 | E3 | E4 | E5 | E6 | E7 | E8 | E9 | E10 | E11 |
|---|---|---|---|---|---|---|---|---|---|---|---|---|---|
| leadership 10% | mission, vision, culture | 25 | 0.75 | 1 | 1 | 0.75 | 0.5 | 1 | 0.75 | 0.5 | 0.75 | 1 | 0.75 |
| involvement management system | 25 | 0.75 | 1 | 1 | 0.5 | 0.75 | 1 | 0.75 | 0.5 | 1 | 1 | 0.75 | |
| involvement customers, partners, society | 25 | 1 | 1 | 1 | 0.75 | 0.75 | 1 | 1 | 0.5 | 1 | 1 | 1 | |
| motivation | 25 | 0.75 | 0.75 | 0.75 | 1 | 1.25 | 0.75 | 0.5 | 1.25 | 0.75 | 1 | 1 | |
| Subtotal | 3.25 | 3.75 | 3.75 | 3 | 3.25 | 3.75 | 3 | 2.75 | 3.5 | 4 | 3.5 | ||
| policy strategy 8% | needs expectations stakeholders | 20 | 0.8 | 0.8 | 0.8 | 0.6 | 0.6 | 0.8 | 0.6 | 0.4 | 0.8 | 0.8 | 0.6 |
| creativity | 20 | 0.6 | 0.6 | 0.6 | 0.6 | 0.4 | 0.6 | 0.4 | 0.6 | 0.6 | 0.8 | 0.6 | |
| updated | 20 | 0.6 | 0.8 | 0.8 | 0.6 | 0.4 | 0.6 | 0.4 | 0.6 | 0.8 | 0.6 | 0.6 | |
| key processes | 20 | 0.8 | 0.8 | 0.6 | 0.6 | 0.6 | 0.8 | 0.6 | 0.4 | 0.6 | 0.6 | 0.6 | |
| communication implementation | 20 | 0.6 | 0.8 | 0.8 | 0.6 | 0.6 | 0.8 | 0.6 | 0.4 | 0.6 | 0.6 | 0.6 | |
| Subtotal | 3.4 | 3.8 | 3.6 | 3 | 2.6 | 3.6 | 2.6 | 2.4 | 3.4 | 3.4 | 3 | ||
| personnel 9% | planning, management, improvement | 20 | 0.6 | 0.8 | 0.8 | 0.6 | 0.6 | 0.8 | 0.6 | 0.6 | 0.8 | 0.6 | 0.6 |
| knowledge, competences | 20 | 0.6 | 0.6 | 0.6 | 0.6 | 0.6 | 0.6 | 0.6 | 0.4 | 0.6 | 0.6 | 0.6 | |
| involvement | 20 | 0.6 | 0.8 | 0.8 | 0.6 | 0.6 | 0.8 | 0.6 | 0.6 | 0.8 | 0.6 | 0.6 | |
| dialogue | 20 | 0.6 | 0.8 | 0.8 | 0.6 | 0.6 | 0.8 | 0.4 | 0.4 | 0.8 | 0.8 | 0.8 | |
| reward | 20 | 0.6 | 0.6 | 0.6 | 0.8 | 1 | 0.6 | 0.4 | 1 | 0.6 | 0.8 | 0.8 | |
| Subtotal | 3 | 3.6 | 3.6 | 3.2 | 3.4 | 3.6 | 2.6 | 3 | 3.6 | 3.4 | 3.4 | ||
| partnerships and resources 9% | partnerships management | 20 | 0.8 | 0.8 | 0.8 | 0.6 | 0.6 | 0.8 | 0.6 | 0.6 | 0.8 | 0.6 | 0.6 |
| financial resources management | 20 | 0.8 | 0.8 | 0.8 | 0.6 | 0.6 | 0.8 | 0.6 | 0.6 | 0.8 | 0.6 | 0.6 | |
| buildings, equipments, materials management | 20 | 0.8 | 0.8 | 0.8 | 0.6 | 0.6 | 0.8 | 0.6 | 0.6 | 0.8 | 0.6 | 0.6 | |
| technologies management | 20 | 0.6 | 0.6 | 0.8 | 0.6 | 0.6 | 0.6 | 0.6 | 0.6 | 0.6 | 0.6 | 0.6 | |
| information, knowledge management | 20 | 0.6 | 0.6 | 0.8 | 0.6 | 0.6 | 0.8 | 0.6 | 0.6 | 0.6 | 0.6 | 0.6 | |
| Subtotal | 3.6 | 3.6 | 4 | 3 | 3 | 3.8 | 3 | 3 | 3.6 | 3 | 3 | ||
| processes 14% | systemically designed and managed | 25 | 1 | 1 | 1 | 0.75 | 0.75 | 0.75 | 0.75 | 0.5 | 0.75 | 1 | 0.75 |
| improved | 25 | 1 | 1 | 1 | 0.75 | 0.5 | 0.75 | 0.5 | 0.5 | 1 | 1 | 0.75 | |
| customers needs and expectations | 25 | 1 | 1 | 1.25 | 0.75 | 0.5 | 1 | 0.5 | 0.5 | 1 | 1 | 0.75 | |
| managed and consolidated customer relations | 25 | 1 | 1.25 | 1.25 | 0.75 | 0.75 | 1.25 | 0.75 | 0.5 | 1 | 1 | 0.75 | |
| Subtotal | 4 | 4.25 | 4.5 | 3 | 2.5 | 3.75 | 2.5 | 2 | 3.75 | 4 | 3 | ||
| Total | 1.75 | 1.92 | 1.98 | 1.52 | 1.46 | 1.85 | 1.36 | 1.29 | 1.80 | 1.81 | 1.59 | ||
| Assessment | 0.35 | 0.38 | 0.40 | 0.30 | 0.29 | 0.37 | 0.27 | 0.26 | 0.36 | 0.36 | 0.32 |
| Tourist-Receiving Structures | Customer | |||||
|---|---|---|---|---|---|---|
| Analysis Indicators | Satisfaction 20% | |||||
| Occupancy (%) | Penalties/Profit (%) | Average Score | Standard Deviation | Position Index | Assessment | |
| E1 | 60.59 | 1.23 | 3.90 | 0.12 | 0.78 | 0.16 |
| E2 | 71.36 | 2.01 | 4.40 | 0.16 | 0.88 | 0.18 |
| E3 | 74.72 | 0.25 | 4.20 | 0.06 | 0.84 | 0.17 |
| E4 | 65.01 | 2.80 | 3.20 | 0.19 | 0.64 | 0.13 |
| E5 | 55.47 | 3.11 | 2.98 | 0.26 | 0.60 | 0.12 |
| E6 | 72.73 | 1.05 | 3.50 | 0.14 | 0.70 | 0.14 |
| E7 | 76.70 | 3.95 | 2.10 | 0.39 | 0.42 | 0.08 |
| E8 | 19.69 | 0.00 | 3.45 | 0.25 | 0.69 | 0.14 |
| E9 | 88.50 | 0.11 | 4.00 | 0.15 | 0.80 | 0.16 |
| E10 | 42.02 | 0.50 | 3.70 | 0.16 | 0.74 | 0.15 |
| E11 | 71.70 | 0.12 | 3.80 | 0.21 | 0.76 | 0.15 |
| Tourist-Receiving Structures | Personnel | ||||
|---|---|---|---|---|---|
| Analysis Indicators | Satisfaction 9% | ||||
| RW * (%) | Return Rate Seasonal Personnel (%) | RC ** (%) | Positioning Index | Assessment | |
| E1 | 151.98 | 80 | 70.21 | −0.30 | −0.03 |
| E2 | 163.91 | 75 | 72.05 | −0.28 | −0.03 |
| E3 | 149.41 | 80 | 71.62 | −0.28 | −0.03 |
| E4 | 123.14 | 50 | 75.11 | −0.25 | −0.02 |
| E5 | 142.41 | 50 | 80.02 | −0.20 | −0.02 |
| E6 | 154.92 | 85 | 72.35 | −0.28 | −0.02 |
| E7 | 148.30 | 75 | 65.21 | −0.35 | −0.03 |
| E8 | 68.52 | 80 | 79.32 | −0.21 | −0.02 |
| E9 | 117.11 | 90 | 70.42 | −0.30 | −0.03 |
| E10 | 120.65 | 70 | 76.23 | −0.24 | −0.02 |
| E11 | 117.14 | 95 | 74.95 | −0.25 | −0.02 |
| Tourist-Receiving Structures | Society | ||||
|---|---|---|---|---|---|
| Analysis Indicators | Satisfaction 6% | ||||
| Taxes/Value Added (%) | Penalties/Profit (%) | Sponsorship/Profit (%) | Positioning Index | Assessment | |
| E1 | 17.85 | 1.23 | 6.78 | 0.34 | 0.02 |
| E2 | 21.27 | 2.01 | 18.23 | 0.91 | 0.05 |
| E3 | 21.11 | 0.25 | 20.98 | 1.05 | 0.06 |
| E4 | 16.92 | 2.80 | 0.00 | 0.00 | 0.00 |
| E5 | 23.41 | 3.11 | 12.95 | 0.65 | 0.04 |
| E6 | 22.49 | 1.05 | 22.12 | 1.11 | 0.07 |
| E7 | 23.68 | 3.95 | 0.00 | 0.00 | 0.00 |
| E8 | 28.95 | N/A | N/A | N/A | N/A |
| E9 | 18.49 | 0.11 | 16.23 | 0.81 | 0.05 |
| E10 | 20.85 | 0.50 | 20.11 | 1.01 | 0.06 |
| E11 | 19.90 | 0.12 | 5.94 | 0.30 | 0.02 |
| Tourist -Receiving Structures | Shareholders | ||||
|---|---|---|---|---|---|
| Analysis Indicators | Satisfaction 20% | ||||
| Occupancy (%) | Return on Sales (%) | Profit/Accommodation-Day (lei) | Positioning Index | Assessment | |
| E1 | 60.59 | 27.37 | 3.58 | 0.52 | 0.08 |
| E2 | 71.36 | 39.42 | 14.18 | 2.08 | 0.31 |
| E3 | 74.72 | 35.88 | 14.07 | 2.06 | 0.31 |
| E4 | 65.01 | 12.38 | 2.42 | 0.36 | 0.05 |
| E5 | 55.47 | 25.00 | 6.05 | 0.89 | 0.13 |
| E6 | 72.73 | 33.75 | 13.49 | 1.98 | 0.30 |
| E7 | 76.70 | 34.93 | 12.43 | 1.82 | 0.27 |
| E8 | 19.69 | N/A | N/A | N/A | N/A |
| E9 | 88.50 | 19.25 | 9.08 | 1.33 | 0.20 |
| E10 | 42.02 | 14.85 | 3.42 | 0.50 | 0.08 |
| E11 | 71.70 | 12.89 | 5.53 | 0.81 | 0.12 |
| Tourist-Receiving Structures | Decisive Factors | Results | Assessment | Position |
|---|---|---|---|---|
| E1 | 0.35 | 0.23 | 0.58 | 8 |
| E2 | 0.38 | 0.52 | 0.90 | 2 |
| E3 | 0.40 | 0.51 | 0.91 | 1 |
| E4 | 0.30 | 0.16 | 0.46 | 10 |
| E5 | 0.29 | 0.27 | 0.57 | 9 |
| E6 | 0.37 | 0.48 | 0.85 | 3 |
| E7 | 0.27 | 0.33 | 0.60 | 6 |
| E8 | 0.26 | 0.12 | 0.38 | 11 |
| E9 | 0.36 | 0.38 | 0.74 | 4 |
| E10 | 0.36 | 0.26 | 0.62 | 5 |
| E11 | 0.32 | 0.27 | 0.59 | 7 |
Publisher’s Note: MDPI stays neutral with regard to jurisdictional claims in published maps and institutional affiliations. |
© 2021 by the authors. Licensee MDPI, Basel, Switzerland. This article is an open access article distributed under the terms and conditions of the Creative Commons Attribution (CC BY) license (https://creativecommons.org/licenses/by/4.0/).
Share and Cite
Petcu, M.A.; Sobolevschi-David, M.I.; Curea, S.C. Configuration of an Integrated Quality-Social Responsibility-Performance Management System in the Hospitality Industry. Case Studies: Balneary Tourism Romania. Sustainability 2021, 13, 7303. https://0-doi-org.brum.beds.ac.uk/10.3390/su13137303
Petcu MA, Sobolevschi-David MI, Curea SC. Configuration of an Integrated Quality-Social Responsibility-Performance Management System in the Hospitality Industry. Case Studies: Balneary Tourism Romania. Sustainability. 2021; 13(13):7303. https://0-doi-org.brum.beds.ac.uk/10.3390/su13137303
Chicago/Turabian StylePetcu, Monica Aureliana, Maria Iulia Sobolevschi-David, and Stefania Cristina Curea. 2021. "Configuration of an Integrated Quality-Social Responsibility-Performance Management System in the Hospitality Industry. Case Studies: Balneary Tourism Romania" Sustainability 13, no. 13: 7303. https://0-doi-org.brum.beds.ac.uk/10.3390/su13137303