Article

Does Bus Rapid Transit System (BRTS) Meet the Citizens’ Mobility Needs? Evaluating Performance for the Case of Multan, Pakistan

1
Graduate School of Urban Innovation, Yokohama National University, Yokohama 240-8501, Japan
2
Directorate of Town Planning, Multan Development Authority, Multan 60000, Pakistan
3
School of Civil Engineering, Universiti Teknologi Malaysia, Johor Bahru 81310, Malaysia
4
Department of City & Regional Planning, University of Engineering & Technology, Lahore 54890, Pakistan
5
Department of City and Regional Planning, School of Architecture and Planning, University of Management and Technology, Lahore 54770, Pakistan
6
School of Professional and Continuing Education, Universiti Teknologi Malaysia, Johor Bahru 81310, Malaysia
7
Faculty of Engineering and Architecture, Kore University of Enna, 94100 Enna, Italy
*
Authors to whom correspondence should be addressed.
Sustainability 2021, 13(13), 7314; https://0-doi-org.brum.beds.ac.uk/10.3390/su13137314
Submission received: 9 June 2021 / Revised: 25 June 2021 / Accepted: 28 June 2021 / Published: 30 June 2021

Abstract

:
Bus rapid transit (BRT) has emerged as an efficient and cost-effective transport system for urban mobility that offers safe and high-quality transport services for city dwellers. Recent research has widely discussed BRT systems’ performance evaluation, but such assessments have remained limited in the South Asian context, where users’ needs might be distinct. The present study addresses this research gap and evaluates the performance of the BRT system in Multan, Pakistan, based on the passengers’ perceptions and the BRT standard scorecard. The data were collected at 21 BRT stations, and a face-to-face questionnaire survey was carried out with 420 users. The BRT standard scorecard method was also applied by conducting an observation survey and semi-structured interviews based on the aspects as specified by the Institute of Transportation and Development Policy (ITDP). The Statistical Package for the Social Sciences (SPSS) software package was mainly utilised for data analysis. This research concluded that around 54% of passengers are highly satisfied and opted for BRT due to comfort. Cronbach’s Alpha reliability analysis concluded that most of the BRT stations possess the acceptable value (0.8 > α ≥ 0.7), with only six out of 21 stations categorised as unacceptable (α < 0.5). Multan BRT achieved overall 79 scores and classified as Silver-Standard BRT. The study suggests critical insights to improve the citizens’ mobility with the existing BRT system, serving as a benchmark for policymakers and transport planners.

1. Introduction

Public transport systems are crucial to the development of any country. Inadequate public transport systems, particularly in developing countries, give rise to severe socio-economic and environmental issues, including traffic congestion, social exclusion, environmental degradation, etc. [1,2,3]. Hence, healthcare, life quality, and social inclusion are imperative and should be prioritised while planning public transport projects to contribute to long-term socio-economic growth [4,5,6,7]. Furthermore, the presence of sensible public transport services means that users can reduce the use of private vehicles, encouraging sustainable mobility and therefore reducing congestion and environmental impacts [8,9,10].
Bus rapid transit (BRT) systems are a great solution to meet the desired goals that offer high capacity, speed, and service quality at a relatively low cost [11,12]. BRT can be defined as a flexible, rubber-tired rapid transit mode that combines stations, vehicles, services, and intelligent transportation system (ITS) elements into an integrated system with a strong positive image and identity. In addition, BRT systems combine segregated bus lanes that are typically median aligned with off-board fare collection, level boarding, bus priority at intersections, and other service quality elements [13].
Several physical and operational features can influence the BRT performance necessary for attracting users. Hinebaugh [14] presented the comprehensive report on characteristics of BRT for decision making, which includes the significant elements of BRT (running way, stations, vehicles, fare collection, intelligent transport systems, service and operating plans, branding elements, and integration of BRT elements into BRT systems), BRTS performance (travel time, reliability, image and identity, passenger safety and security, system capacity, and accessibility), and BRTS benefits (higher ridership, capital cost-effectiveness, operating cost efficiency, transit-supportive land development, and environmental quality). Some studies have analysed how the inclusion of a BRT service can vary the level of service (LOS) of the roundabout and its relative safety as vehicle flows change [15,16,17]. Siedler [18] suggested the main characteristics of BRTS, including roadways, stations, rolling stock, service, ticketing, and ITS, are essential for providing sustainable mobility and catering to public transport concerns in fast-growing cities. Similarly, ten critical features of BRT, including availability, service delivery, community, travel time, safety and security, maintenance and construction, economic, capacity, para-transit, and comfort, are essential to capture the users’ interest in BRT [19]. Moreover, Bayle et al. [20] identified the several elements of BRTS such as accessible stations, convenient fare collection, ITS, service, and user-friendly operational plans. They further suggested that many indicators, including travel time, image and identity, reliability, passenger safety and security, and system capacity, could enhance the performance of BRTS [20].
BRT systems have recently been implemented in numerous cities of Pakistan such as Lahore, Rawalpindi-Islamabad, Multan, and Peshawar, whereas BRTS are under construction and planning phase in other cities of the country. BRT projects can prove crucial in addressing everyday mobility needs. However, there is a scarcity of research highlighting the citizens’ mobility issues with the existing BRT systems in Pakistan. Thus, the present study addresses this gap and analyses how Multan BRT caters to citizens’ needs. The research involves multiple data from the BRT users, observation surveys, and policymakers interviews. Moreover, it evaluates the BRT performance on the ITDP standard scorecard. Given the critical deficiencies identified from this research, the study recommends the improvements and offers practical implications to augment the users’ mobility with BRT in Pakistan. The paper is organised as follows: a brief literature review is presented in Section 2; study context and an overview of the Multan BRT is detailed in Section 3; research methodology and data collection are explained in Section 4; study results are briefly discussed in Section 5, while Section 6 concludes this paper and offers practical implications and suggestions.

2. Literature Review

2.1. Evaluation Based on User Perception

Evaluation of a BRT system provides a base for future decision-making regarding the planning and execution of such systems in many cities of the world. The BRT performance is assessed based on its planning, design, and services aspects during its operational phase. Later it is called user satisfaction which is influenced by the user expectations and the actual level of service offered by the system [12]. User satisfaction with the system is critical to assess for regular monitoring and continuous system improvement. Various studies in this regard used user perception surveys. A survey conducted by dell’Olio et al. [21] aimed to assess the user expectations from the system. The methodology involved the design and execution of a survey from the 305 commuters of public transport buses in the capital of the Cantabria region, located on the north coast of Spain. The stated preference survey documented the user responses for six important variables: waiting time, journey time, vehicle occupancy, vehicle cleanliness, driver kindness, and comfort on the journey. They reported the three most influential variables to define the quality of an efficient and safe public transport service: waiting time, cleanliness, and comfort.
Eboli and Mazzulla [22] proposed a methodology to evaluate the transit services based on passenger perception and transit agency performance measures. The proposed method was implemented to interview 123 respondents in the towns of Cosenza and Rende, sited in the South of Italy. Users of a public transport bus were interviewed, and objective indicators for service evaluation based on 22 service attributes were calculated. Out of 26 service attributes, 22 were calculated through user perception, and the other four from the transit agency. The results showed a satisfaction score greater than 6 for all 22 attributes, and three attributes were highly satisfactory, including ease of purchasing the ticket, personnel appearance, and security against crimes on the bus.
Some studies have been focused on analysing the service quality of public transportation by using the impact score methodology. Alçura et al. [23] conducted a study that evaluates the service quality of the high-speed railway system (HSRS) in Turkey. In this study, a detailed evaluation was carried out to measure the service quality based on the passengers’ perception of the seven dimensions of services: passenger information, fare level and type, accessibility, service delivery, station environment, security, and vehicle environment the public transportation system. This study concluded that the operator of HSRS should offer enhancement, particularly in the seat design of the railway and regarding the frequency and time of the service. A similar study [24] focused on discovering the degree of urban transport management and customer perceived quality towards the offer of public transport in the metropolitan area of Cagliari (Italy). In this research, ten attributes were considered to measure the service quality of public transport, including the proximity of bus stops, boarding-alighting ease, service frequency, service reliability, route characteristic, bus drivers’ ability to drive safely, bus drivers’ behaviours, onboard cleanliness, onboard comfort, and onboard security. This research inferred a substantial lack of structural problems and a high level of perceived quality.
A few studies have been conducted to measure service quality by adopting the methods of SERVQUAL and TRANSQUAL. For example, Ladhari [25] reviewed 20 years (1988–2008) of SERVQUAL research to measure service quality. This study identified the various theoretical and empirical criticisms of the SERVQUAL scale and concluded that the SERVQUAL method is a beneficial instrument for measuring service quality research. In another study, Barabino and Di Francesco [26] characterised, measured and managed the transit service quality by parameters adopting both passengers’ and transit operators’ perspectives. In this study, the Transit Quality (TRANSQUAL) framework was used, which provides for the engagement of all stakeholders in characterisation, measurement, and management of the stages of quality monitoring.
Like other bus transport and transit services, rail transport in the urban environment also faces particular challenges in offering passengers the desired quality of service. Hence, attracting private vehicle owners cannot be fulfilled without efficient and effective public transport services. A study conducted by Khalid et al. [27] quantified the user perceptions towards rail transport in Malaysia. This study utilised a structured survey to record responses from 1000 boarded passengers. The results showed that users were unsatisfied with the services due to irregularities in train punctuality and frequencies. Around 78% of passengers had experienced delays ranging from 30 min to 120 min. The study recommended reduced headways from 30 min to 15 min to overcome the delays caused by commuters.
Most of the studies conducted on user satisfaction identify the user concerns on prolonged waiting time, comfort, and behaviour of drivers and personnel during the journey. Incorporating the critical indicators for passenger perception and covering the whole travel process, constructed an evaluation system based on six first-level indexes and 21 second-level indexes. The study collected 3012 field questionnaire surveys from 100 bus lines in Beijing, China. The results show that the overall satisfaction score is 78.2, and the proportion of bus passengers who are satisfied with the bus service exceeds 80%. Moreover, they found the primary factor in user satisfaction is bus type. Multivariate analysis showed that the least satisfaction score is timeliness, influenced by passengers’ age, travel purpose, and time.
With the increasing population in major cities globally, transport demands are increasing both in traffic volumes and travel distances. This rising demand is catered to either by increased private vehicle ownership or by enhancing public transport facilities. In a city with more private vehicle dependency, it is challenging to attract daily travellers to use public transport unless the provided system is efficient in time, comfort, economy, and accessibility. Therefore, the user perception surveys are essential to gain their confidence, which helps decision-makers move in the right direction to meet user expectations. Utilising the same strategy, a study conducted in India by Dube et al. [28] evaluated 11.4 km long BRTS running buses in mixed traffic lanes. The study utilised a designed questionnaire and response from 368 passengers was collected and analysed. The results showed that more than 91% of people were above the satisfaction category with BRT speed, more than 84% above satisfaction for reliability, and around 81% responded above the satisfaction category for frequency of services. Also, more significant satisfaction percentages were observed for safety, convenience, pedestrian crossings, fare, comfort, and cleanliness. The study concluded that about 83% of the respondents are delighted with the services offered by the system.
A reliable and efficient public transport system alleviates various congestion and environmental issues in urban areas and encourages visitors and users to travel in a city more safely and economically. Conducted a study to evaluate visitors’ perception towards services offered by public transport in Munich (Germany). The study employed a questionnaire-based survey, and a five-point Likert scale was used to identify the satisfaction level of users. The survey questionnaire was distributed to 500 users, where only 466 were fully completed and used for the results. The results showed that visitors were satisfied with most service aspects of public transport in Munich except the ticket price. Higher appreciation was given to four factors; punctuality, reliability, network connection, and service frequency.
Public transport services are always expected to meet mobility demand and attract private users to account for an effective modal shift. A study conducted by Wan et al. [29] evaluated rider satisfaction towards a light BRT system in New York City, called Select Bus Service (SBS). The questionnaire survey was conducted from 1700 SBS users, and statistical analysis and regression were performed. Results revealed that more than 80% of the riders were satisfied with system performance, and they rated the overall performance of SBS as at least 6 out of 10. The key results showed that most of the riders were attracted by service and accessibility. Results also showed that rider satisfaction was greatly influenced by service frequency, speed, and on-time performance.

2.2. Evaluation Based on the BRT Standard Scorecard
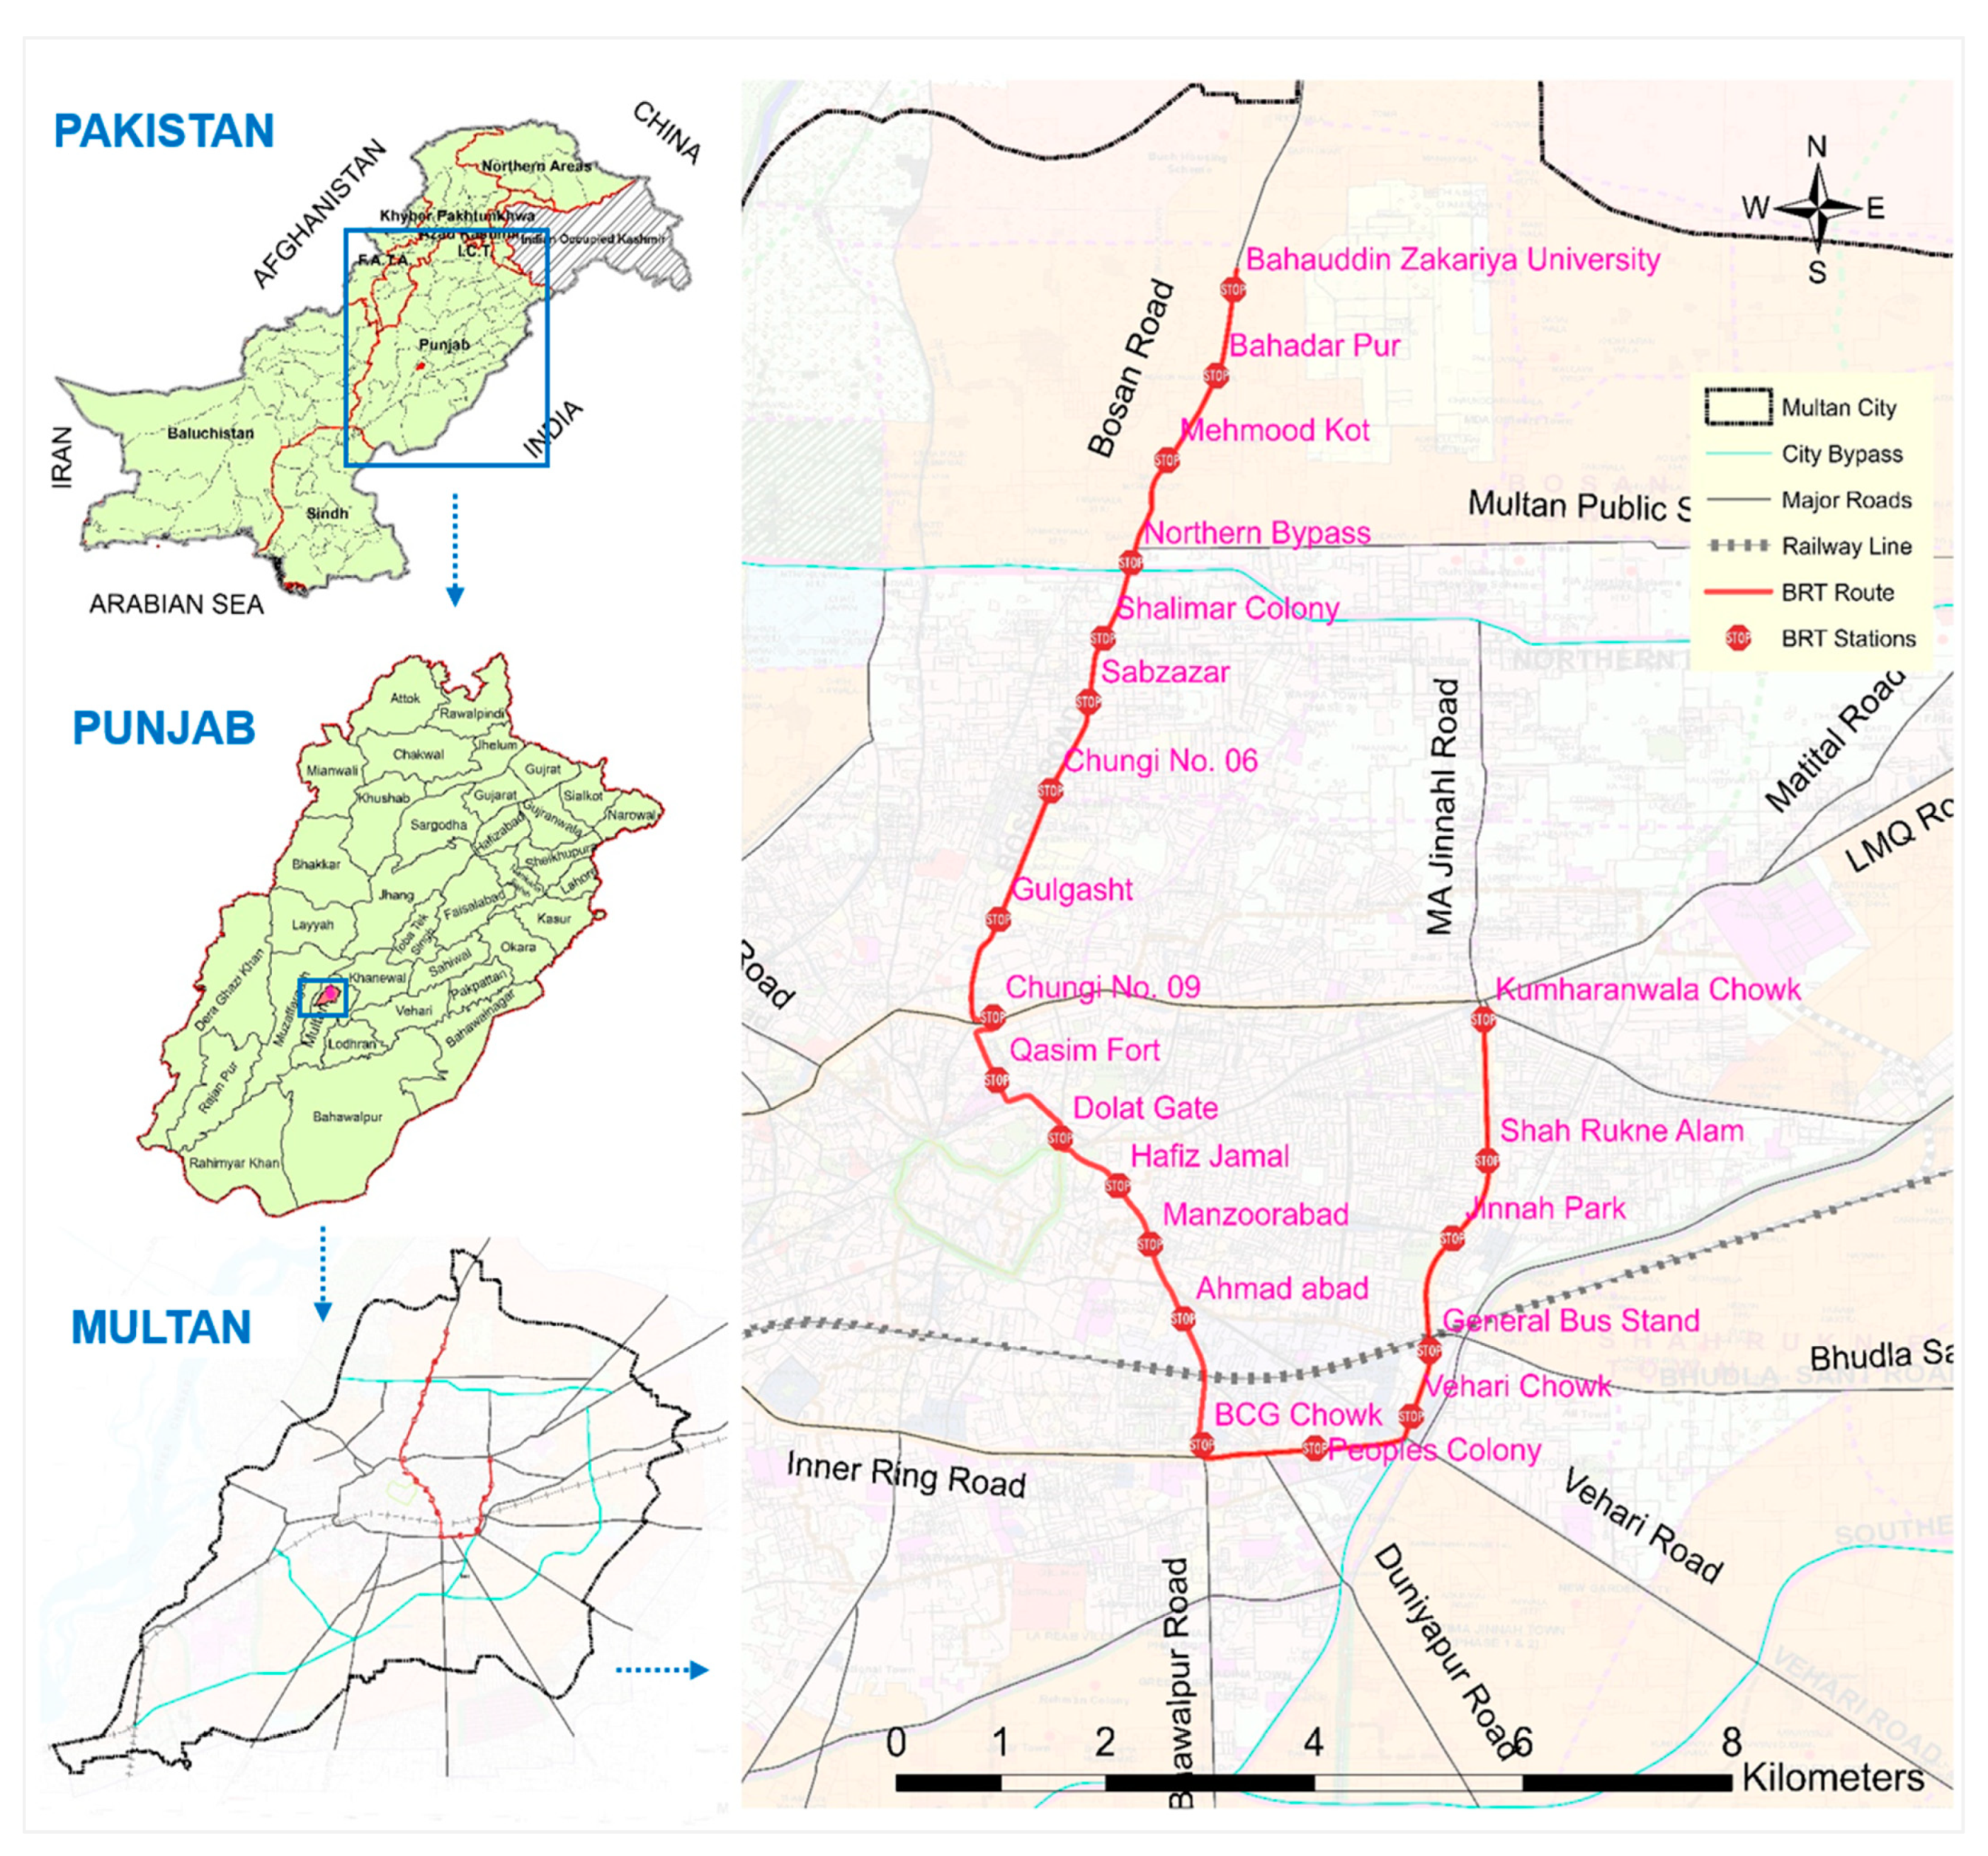
The BRT standard scorecard provided by Institute for Transportation Development and Policy (ITDP) evaluates the BRT corridors based on the best international practices. This standard incorporates the planning, design, and operation of a BRT corridor to identify it as a gold, silver, or bronze category based on the scoring. Various studies implemented this scoring to evaluate the BRT corridors throughout the world and determine the best features of the successful BRT corridors. This standard was applied by Rathore and Ali [30] to evaluate the Lahore Bus Rapid Transit System, located in the provincial capital of Punjab, Pakistan. Observations on BRT basics, service planning, infrastructure, station design, communication, access, and integration. Point deduction based on overcrowding and busway maintenance was also observed. The study found that BRTS Lahore falls under the basic category of BRT Standard with a score of 47. Significant issues were observed for poor service planning, infrastructure, and communication. Also, the deduction was made based on overcrowding and pathway conditions.
Another similar study conducted in Tehran, Iran, by Saidi et al. [31] applied the BRT Standard 2013 to evaluate the BRT Line Three. The selected BRT line is 14.4 km long with 18 stations. They assessed the system based on the set criteria as given by standard. The overall score of the selected BRT line appeared to be 50 and has gained basic rank close to the bronze rank in standards. The low scoring is due to three aspects, including system integration and providing access and infrastructure.

3. Research Setting

Multan is the 3rd largest city of Punjab province in Pakistan. The city is famous as the city of Sufis, Saints, and Shrines. Multan city is a central hub of southern Punjab in Pakistan (refer to Figure 1). The city is located at 30.1575° N latitude and 71.5249° E longitude. A city with a 1.87 million population, 362 km2 area, and a population density of 6239 persons/km2 [32,33]. Multan city has massive intra-city and intercity movement of people by conventional modes of transportation. The city’s road network is sharing the load and is overburdened, consequently causing several problems to the residents of Multan city like congestion, environmental degradation, accidents, and economic losses. These problems increased due to limited right of way and inefficient public transportation system. Therefore, the Government of Punjab decided to operate the BRT Multan in January 2017 to cater to the growing problems. The detailed description of the context and the BRT route is shown in Figure 1.
The total length of the BRT route is about 18.5 km with 21 stations and an average distance of around 880 m between stations. This route is physically separated from regular roadway through a fence. The BRT Multan provides commuter services to the city residents seven days a week between 6:15 am to 10:00 pm. The Multan Metrobus System has eleven feeder lines proposed by the Punjab Masstransit Authority. The feeder lines complement the Metrobus Line regarding the operation, pricing, and physical integration. Moreover, the demand-responsive transport, including online taxi services, also provides services to the citizens, serving as the key for door-to-door connectivity with the metro bus.

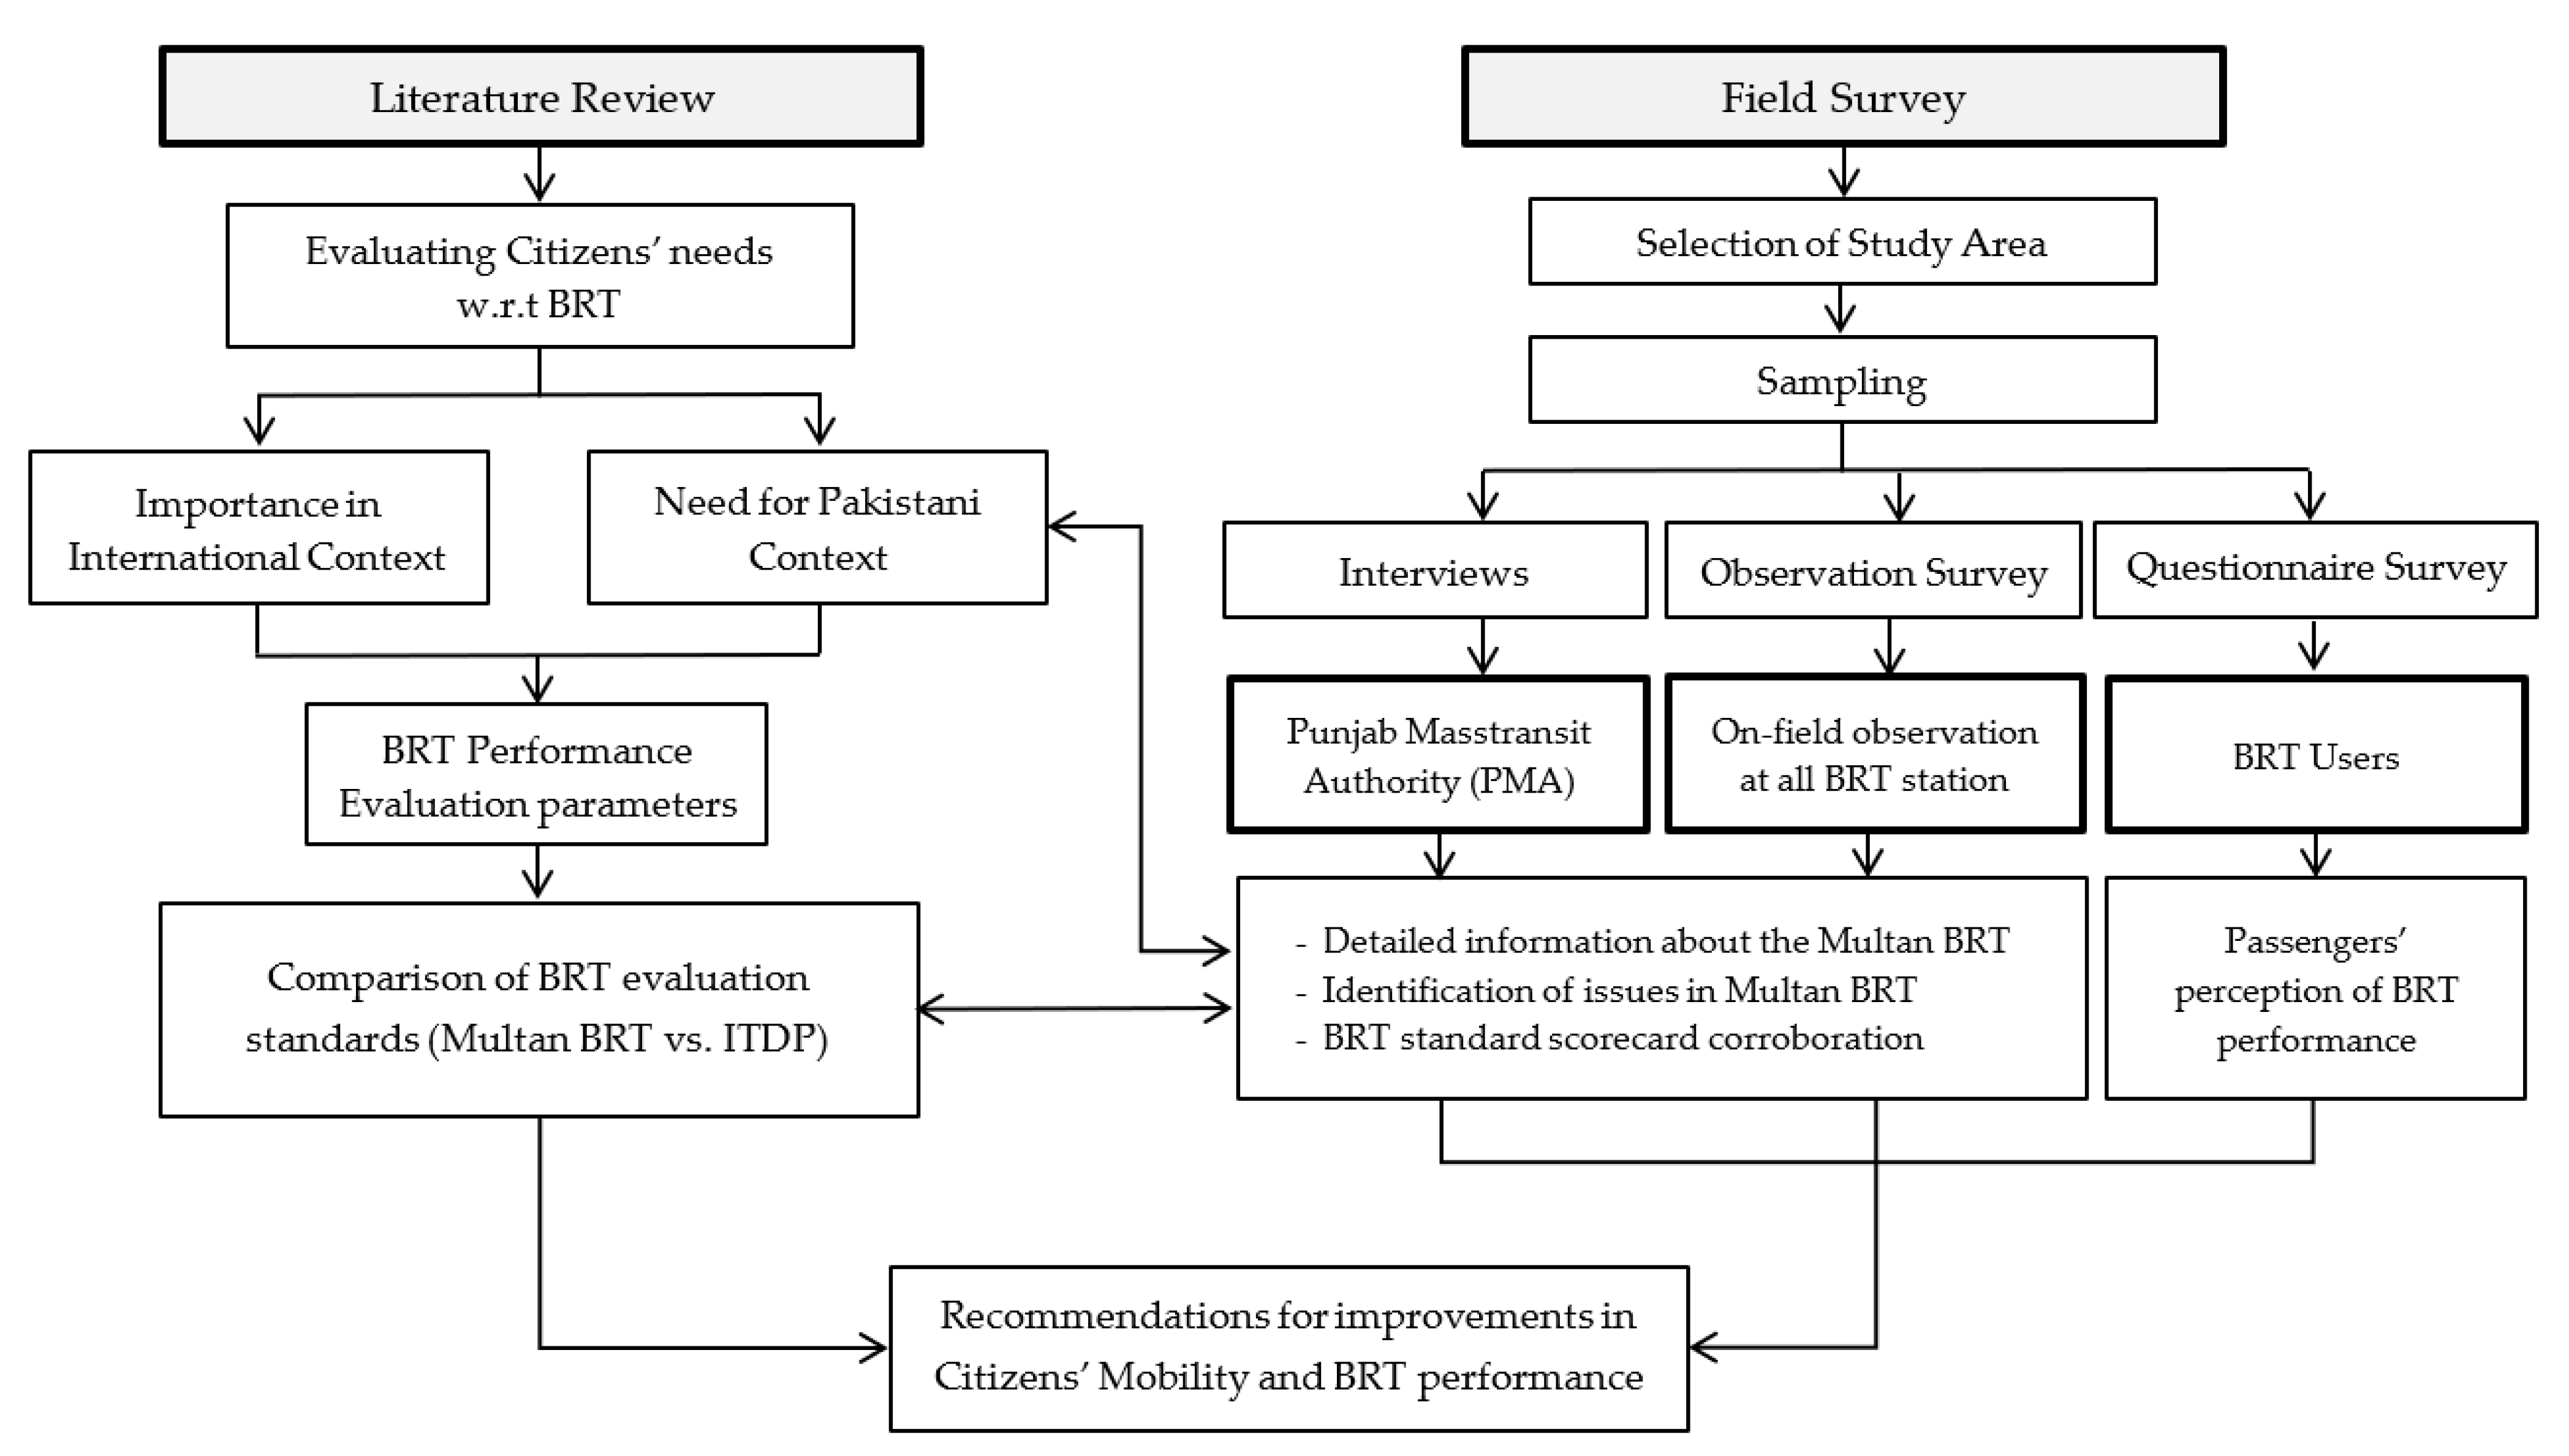
4. Research Methodology

Extensive literature has been reviewed for this research study on evaluating the mobility needs of citizens concerning the BRT performance in the world. For this study, data is required for two aspects: (1) passengers’ perception (mobility needs), and (2) system performance for BRTS Multan. The primary survey was conducted from passengers at 21 stations of BRT in Multan to measure passengers’ perceptions towards BRT. For this purpose, the sample size was calculated by applying Kohran’s formula n = N/1 + Ne2 [34] where n is a sample size, N is a ridership, and e is the random error. The sample size was computed to be 420 by using a random error of 5%. The required data for this research study was collected from all BRT stations by adopting a simple random sampling technique. The surveys were conducted from December 2019 to January 2020 for BRTS Multan. It is pertinent to mention here that passengers were diverse concerning gender, age, education level, and profession. Moreover, the mode of transport to reach the nearest station, distance covered, mode before BRT, frequency, number of the station to reach destination, origin, destination, fare collection method, and issues with the BRT utilisation were analysed. Furthermore, reliability analysis was performed, five-point Likert scale was used to identify the users’ satisfaction level by using the Cronbach’s Alpha technique through the SPSS software (21, IBM, Armonk, NY, USA).
For evaluation of system performance, observation surveys and structured interviews were conducted. Observation surveys were conducted on all the stations and along the route of BRTS in Multan. A structured interview was conducted with the officers of Punjab Masstransit Authority (PMA) to get information about the BRTS Multan. The output of observation surveys and the structured interview was presented in the form of a standard scorecard. The BRT Standard Scorecard 2016 was used to evaluate BRT Multan based on the data collected from observation surveys and semi-structured interviews. Besides, official data of ridership and mechanical failure were collected from PMA. Finally, recommendations were offered for the improvements in BRT performance. A graphical representation of the research methodology is presented in Figure 2.

5. Results and Discussion

First, the general characteristics were determined based on the primary data collected from 420 passengers at all stations of BRT Multan. These characteristics were divided into two types, i.e., demographic and trip features. Then, the satisfaction level with the numerous factors was calculated and analysed whether these factors are crucial in restricting the BRT accessibility among users. In addition, the reliability analysis was performed on SPSS software based on passengers’ satisfaction level by taking the information on various indicators. It includes the performance of escalators, facilities for the disabled, location of BRT station, fare collection process, time from station to fare collection point, time from fare collection point to bus platform, condition and performance of informatory signs at stations, platform boarding, time of bus stays at the station, maintenance of buses and bus station, condition of seating facilities at buses and station, spaces for female at buses, bus door system, bus speed, waiting time at the station, headway, performance of BRT during peak hours, operational hours, and waiting time at the intersection.
After analysing the significant factors affecting the BRT utilisation, the ridership and mechanical failure of BRTS Multan were discussed. The data collected from PMA helped analysed the ridership frequency with the Multan BRT. Moreover, the issues during the observation survey and those indicated by the officials helped evaluate BRT Multan against the ITDP Standard Scorecard 2016.

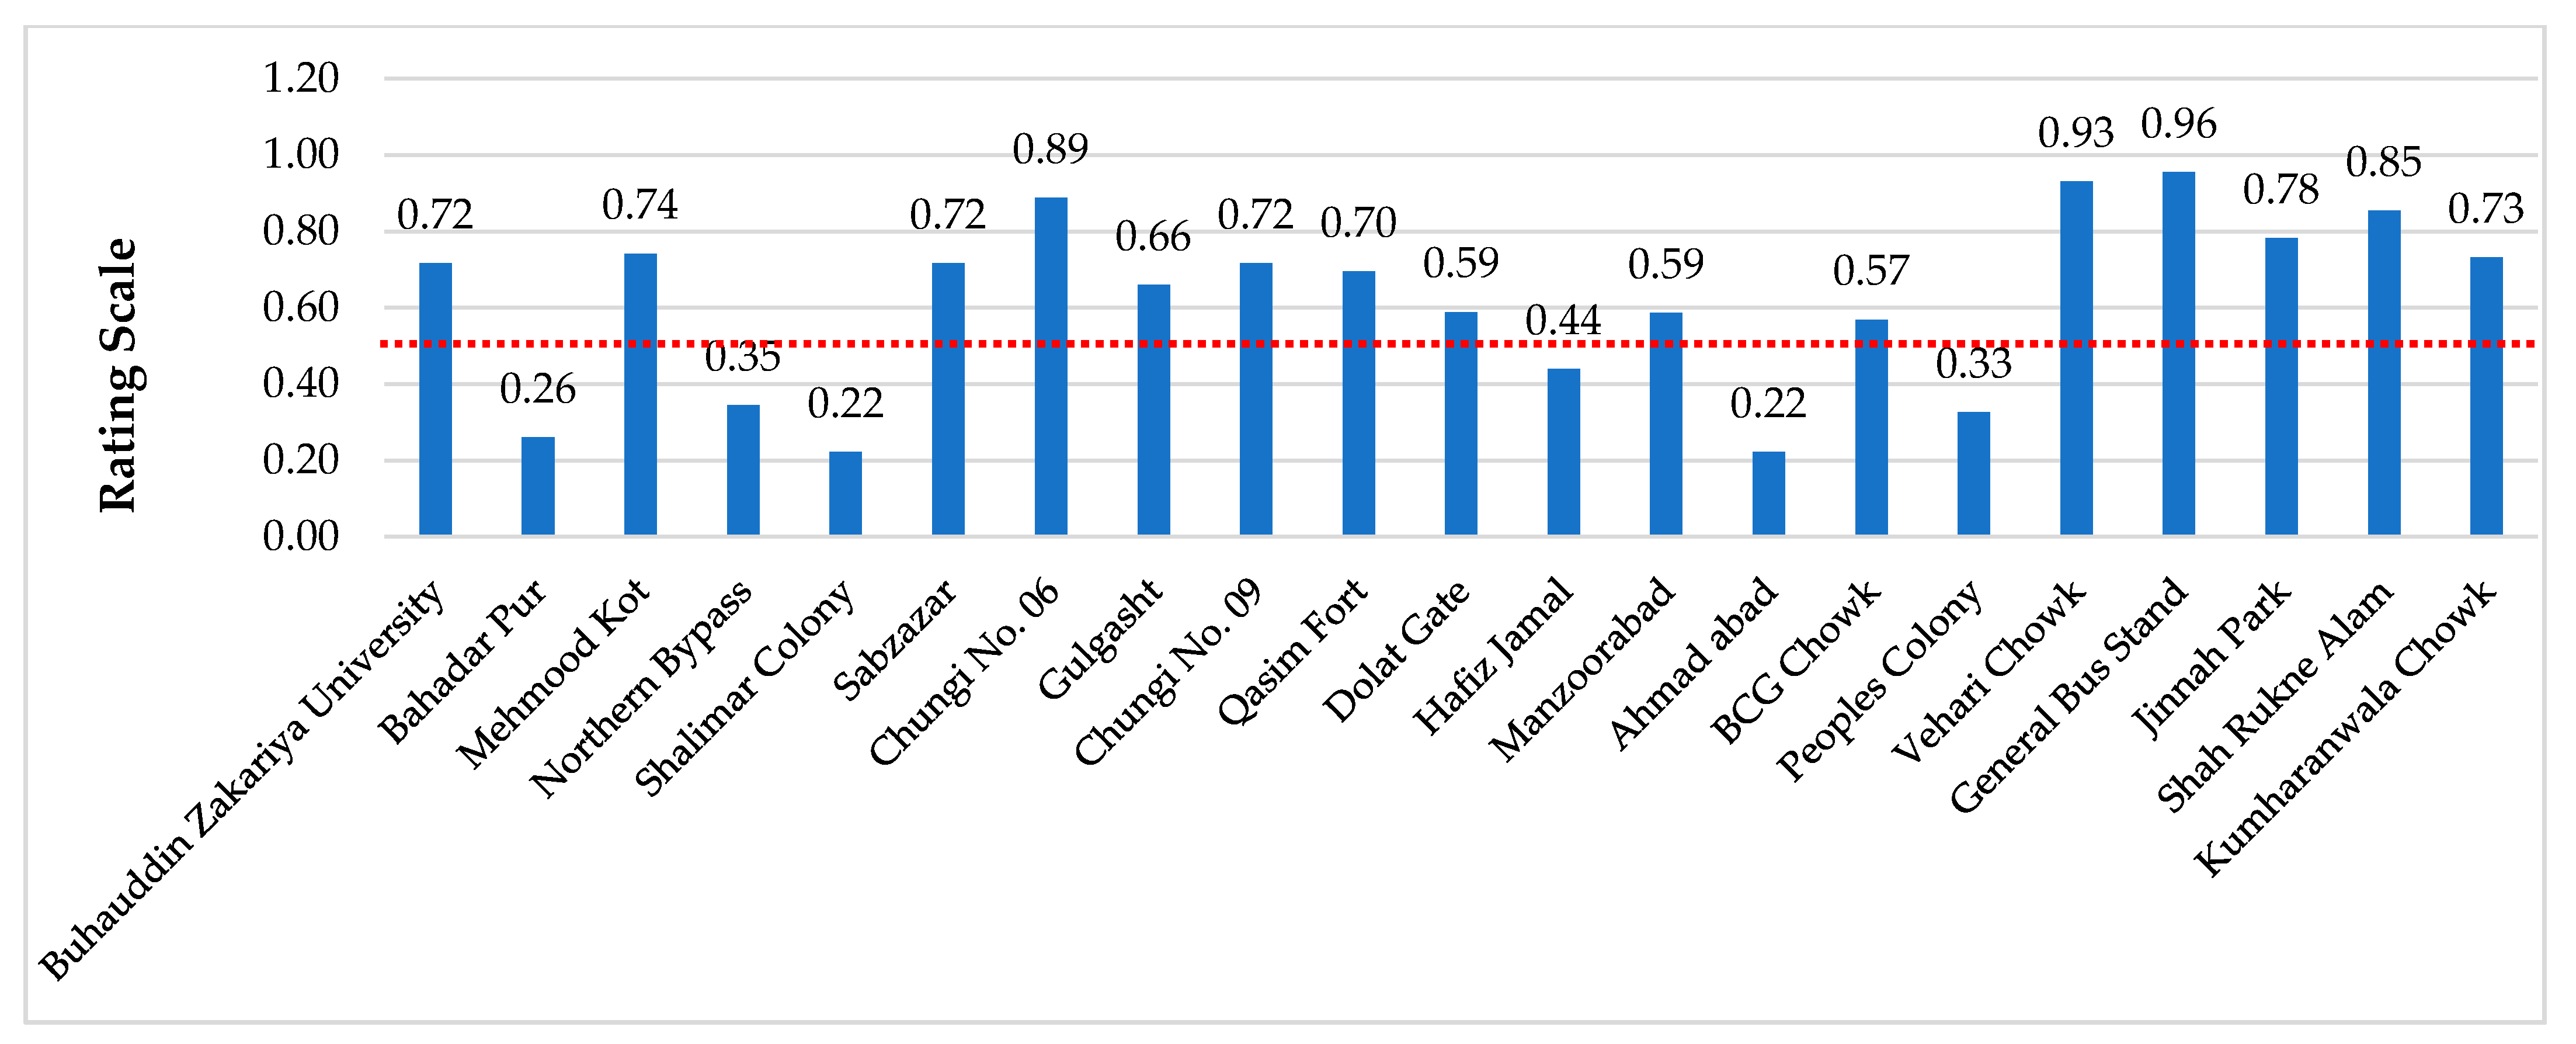
5.1. Passengers’ Perception

5.1.1. General Characteristics

The general characteristics are divided into two categories; demographic characteristics and trip information. At the end of each survey form, reasons for opting for BRT as their travel mode were asked. The details of the general features collected from the respondents are given in Table 1.
Data analysis shows the sample distribution to both males and females and represents a proportion of more than 59% for males and around 40% for females. Thus, the data collected represents a good reflection of both genders to have aggregate results regarding user perception towards services of BRT Multan. The selected sample indicates the people from all age groups, including those below 18 years to more than 45 years. Table 1 above shows that more than 50% of data samples have ages between 18–30 years. People aged more than 45 years comprise more than 4% of the overall respondents. The qualification profile of the respondents also reflects the excellent representation ranging from primary to post-graduation. Graduation appears as the most frequent with a proportion of more than 30%, and people with post-graduation are around 6%. Most of the respondents are students, with a 56% proportion of the total respondents. The second-highest ratio (i.e., about 22%) for profession is employees.
Bus/wagon, rickshaw, and motorcycle are the most frequently used modes to access BRT stations, represented by more than 80% of the respondents. Around 85% of people have access to BRT station within 0.5–5 km. Bus/wagon, rickshaw and motorcycle were the most frequently used mode of travel in the city before the introduction of BRT, and these modes represent a proportion of more than 90% among the respondents. Around 50% of the respondents travel once in 4–7 days, and very few travel once a week. An estimate of the trip length of each of the respondents can be made by asking the number of stations of BRT they travel to reach their destination. Since the average distance between stations is around 880 m, people traversing ten stations travel more, approximately 9 km, to get to the destination. Statistics show that a significant proportion (more than 48%) of the respondents usually travel 5–10 stations before reaching their destinations. Around 9% travels more than 15 km to reach their destination. Home is the most frequently responded origin of the trip with a proportion of around 70%, whereas educational institutes are the most responded destination, represented by more than 54% of respondents. An acceptable ratio (about 55%) use a metro card for fare payment. More than 97% of the respondents reported comfort, time, and money as the prime reasons for opting for BRT as their travel mode.

5.1.2. Issues with BRT Utilisation

Users’ perception of BRT utilisation was obtained based on 18 key variables, as shown in Table 2 below. These indicators were primarily derived from [23] and ITDP standard scorecard [13]. The interviews with policymakers further helped in finalising the variables crucial for the BRT utilisation in the context of Multan. Results indicate that the respondents are satisfied with most of the BRT facilities. However, out of 18 variables, the respondents show dissatisfaction with four potential aspects concerning spatial access and location of BRT, city-wide accessibility, parking facilities at the station, speed of metro buses, and barrier-free physical access. All these five aspects significantly affect the BRT utilisation as respondents are more concerned about accessibility and overall journey time than other available modes. In addition to these potential variables, some other factors such as ease of getting a ticket, the performance of BRT system during rush hour, and waiting time at the intersection are also considered significant for BRT utilisation, but respondents seem contented with those aspects. Considering the four key variables in future urban plans can significantly improve BRT utilisation. Since decisions on the BRT alignment and location of BRT stations are already established, efficient feeder routes can improve the city-wide accessibility of the system. In addition, certain enhancements of parking facilities at stations and the speed of metro buses can be considered to satisfy the users further.
The passengers’ perceptions regarding the facilities provided on all BRT Multan stations were set as the benchmark for reliability analysis. Cronbach’s Alpha is one of the most widely used reliability measures in the social and organisational sciences [35]. Lee Cronbach developed Cronbach’s Alpha in 1951 to provide a measure of the reliability of a test. It is expressed as a number between 0 and 1. The higher Alpha value indicates that the items are highly correlated to each other [36]. However, the Alpha value of less than 0.5 is regarded. The results of Cronbach’s Alpha are shown in Figure 3 below.
The Cronbach’s Alpha results concluded that some BRT Multan stations are above the acceptable value (0.8 > α ≥ 0.7) of the test. These stations include Buhauddin Zakariya Univerisity (BZU), Mehmood Kot, Sabzazar, Chungi No.09, Qasim Fort, Jinnah Park, and Kumharanwala Chowk. The internal consistency of Chungi No.06 station and Shah Rukne Alam station within the limit of “Good”, as Chungi No. 06 is the hub of commercial activities for all class of people where students from BZU and other institutions come there for shopping, food, and amusement and Shah Rukne Alam station is near the vegetable and fruit market. Vehari Chowk station and General Bus Stand Stations fall under the internal inconsistency range of “Excellent” because both stations are near the central city bus terminal (Lari Adda). The remaining stations come under the inadequate and unacceptable range of the test, mainly due to the location of these stations, i.e., present in the old built-up area. The main reason behind the unacceptable degree lies in the lack of recognition and awareness of BRT benefits among users. The red line in Figure 3 shows the unacceptable level of BRT Multan.

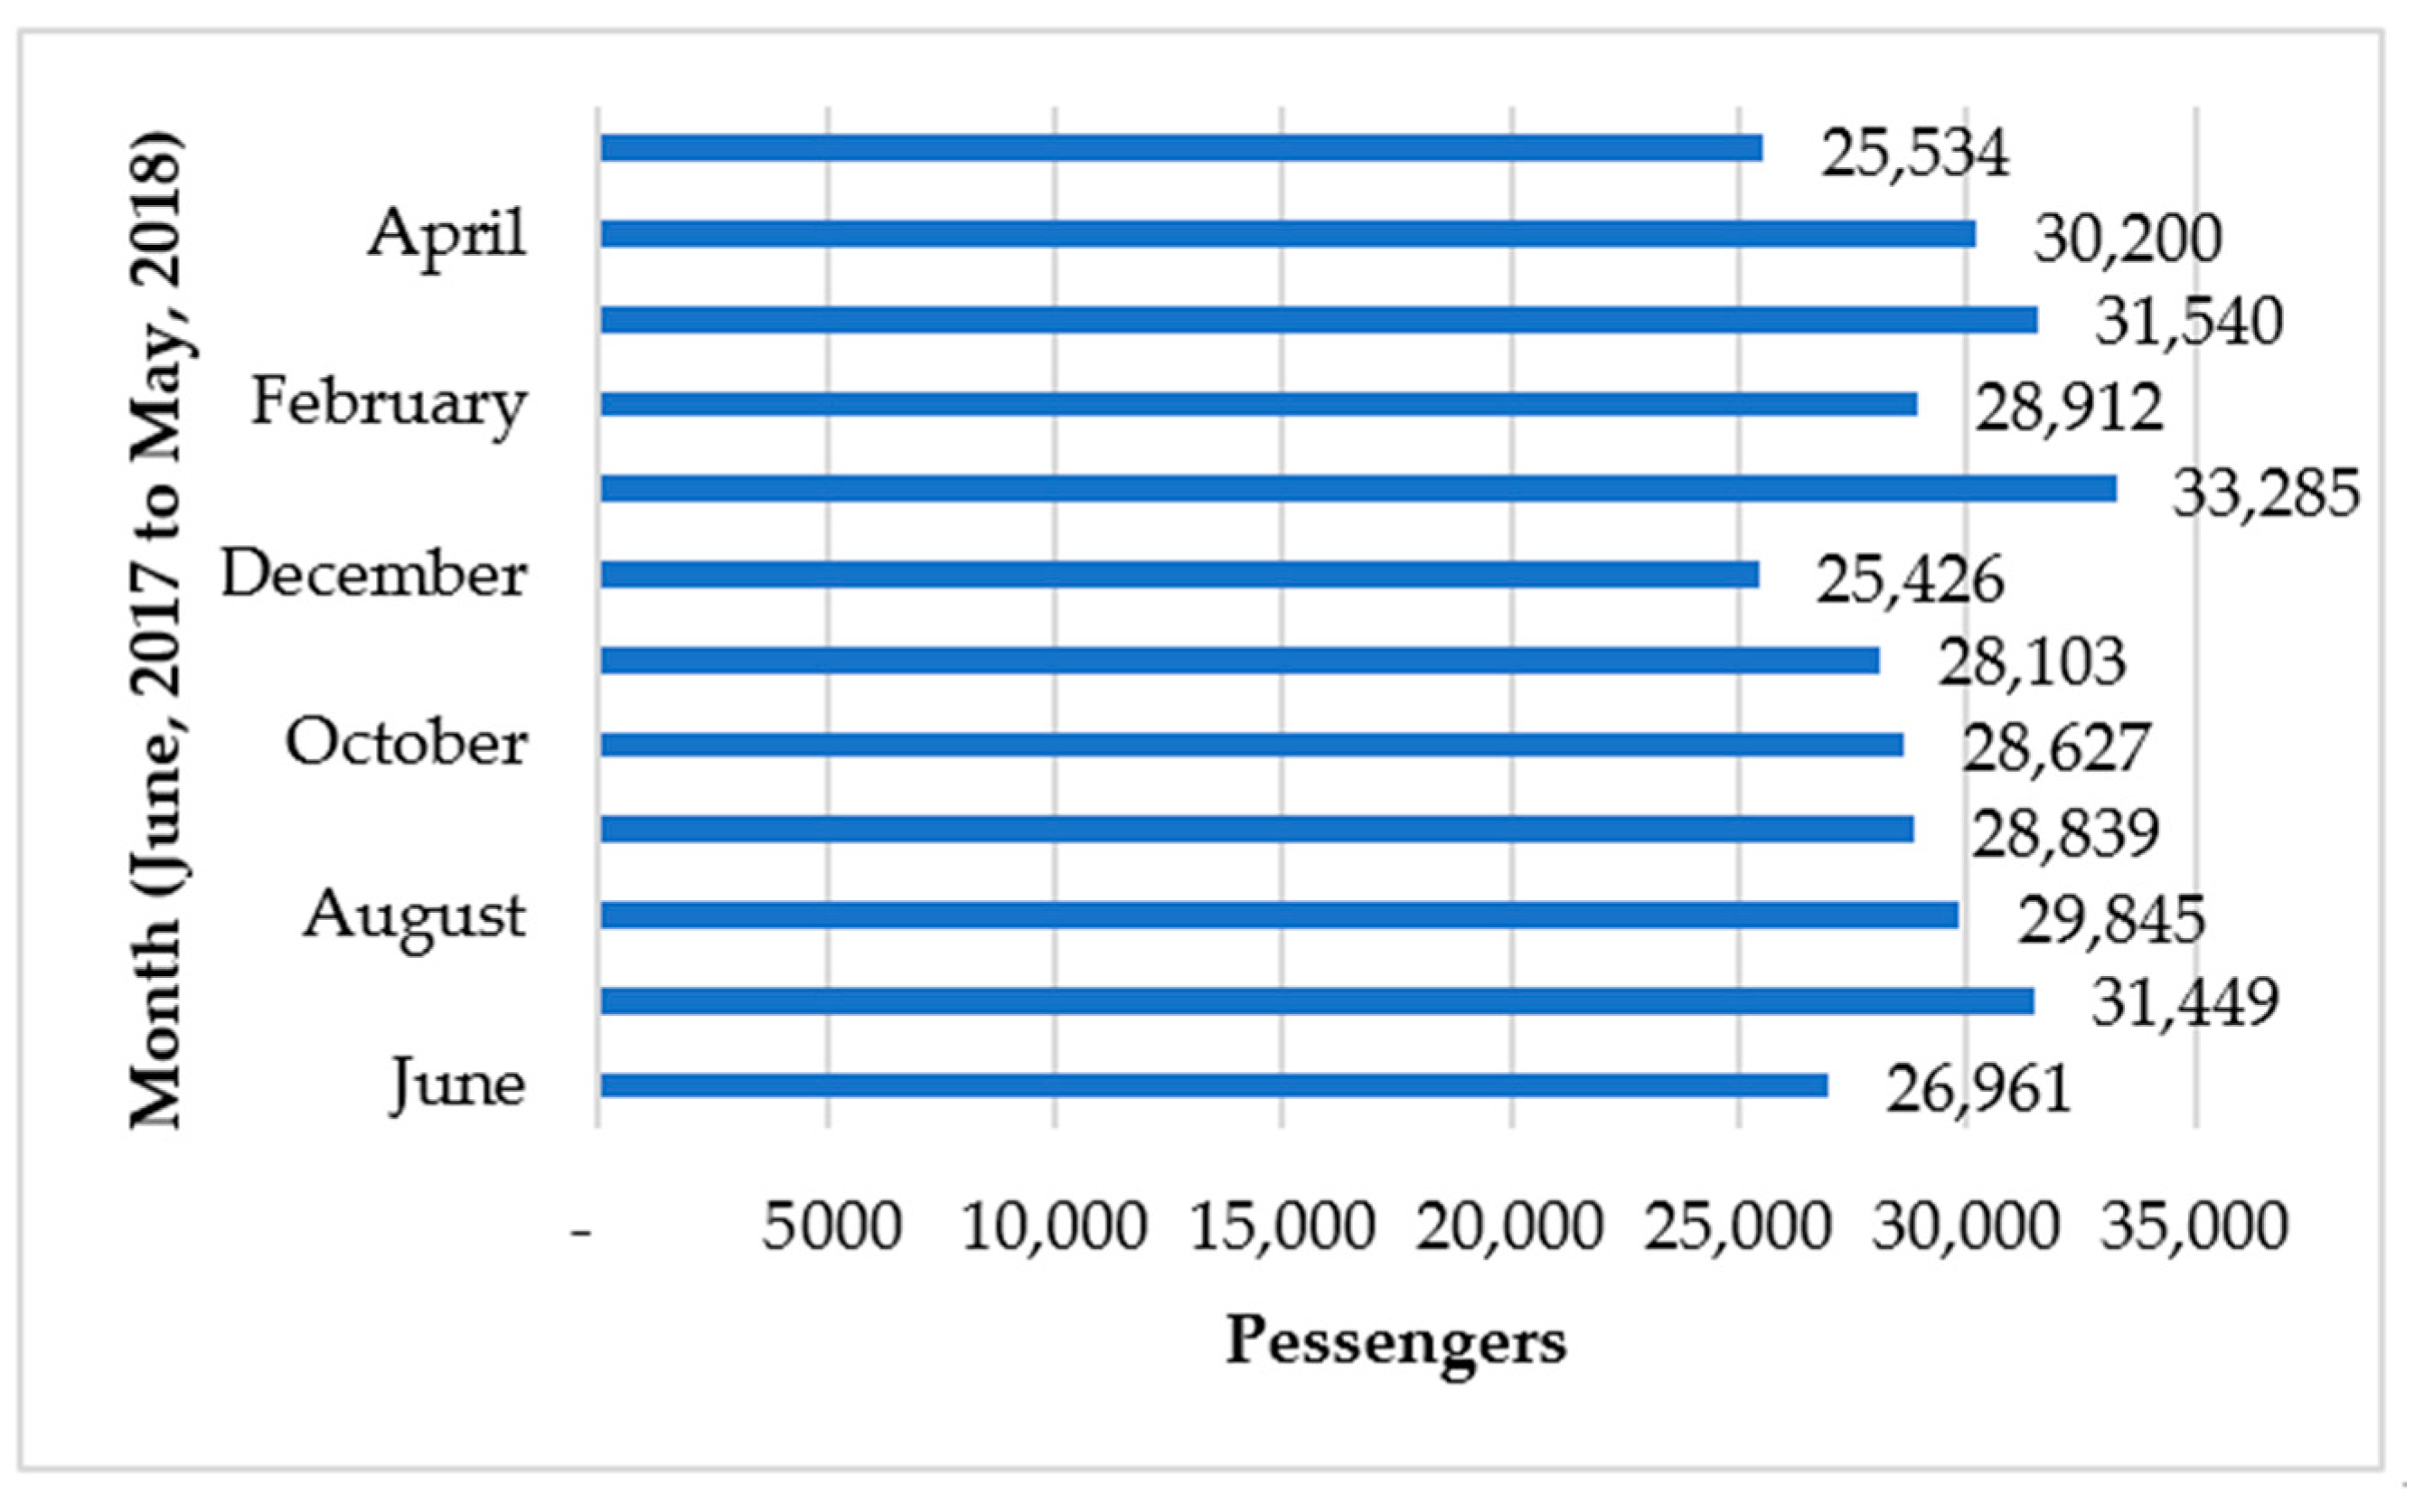
5.2. Ridership in BRT

Average daily ridership data for BRTS Multan obtained from Punjab Masstransit Authority (PMA) for months June 2017 to May 2018 is illustrated in Figure 4 below. Ridership data shown against each month is the average daily ridership for the whole month.
Figure 4 shows that the average daily ridership for each month lies between 25,000 and slightly greater than 33,000, with a maximum value of 33,285 observed for January 2018. Thus, the average daily ridership for the whole year is 28,820 passengers. The other operational BRT in Pakistan is achieving higher daily ridership as compared to BRT Multan. Lahore Metrobus System, the first BRTS in Pakistan, has acquired a record ridership of more than 179,000 per day, whereas Rawalpindi-Islamabad Metrobus System has achieved the highest ridership of 151,000 per day [37]. On the other hand, the ridership of BRTS Multan is not satisfactory owing to a lack of awareness among the public. The primary data indicated that most people in Multan are not well educated and do not prefer to use BRT Multan due to the perceived complexities of the ITS system in BRT.

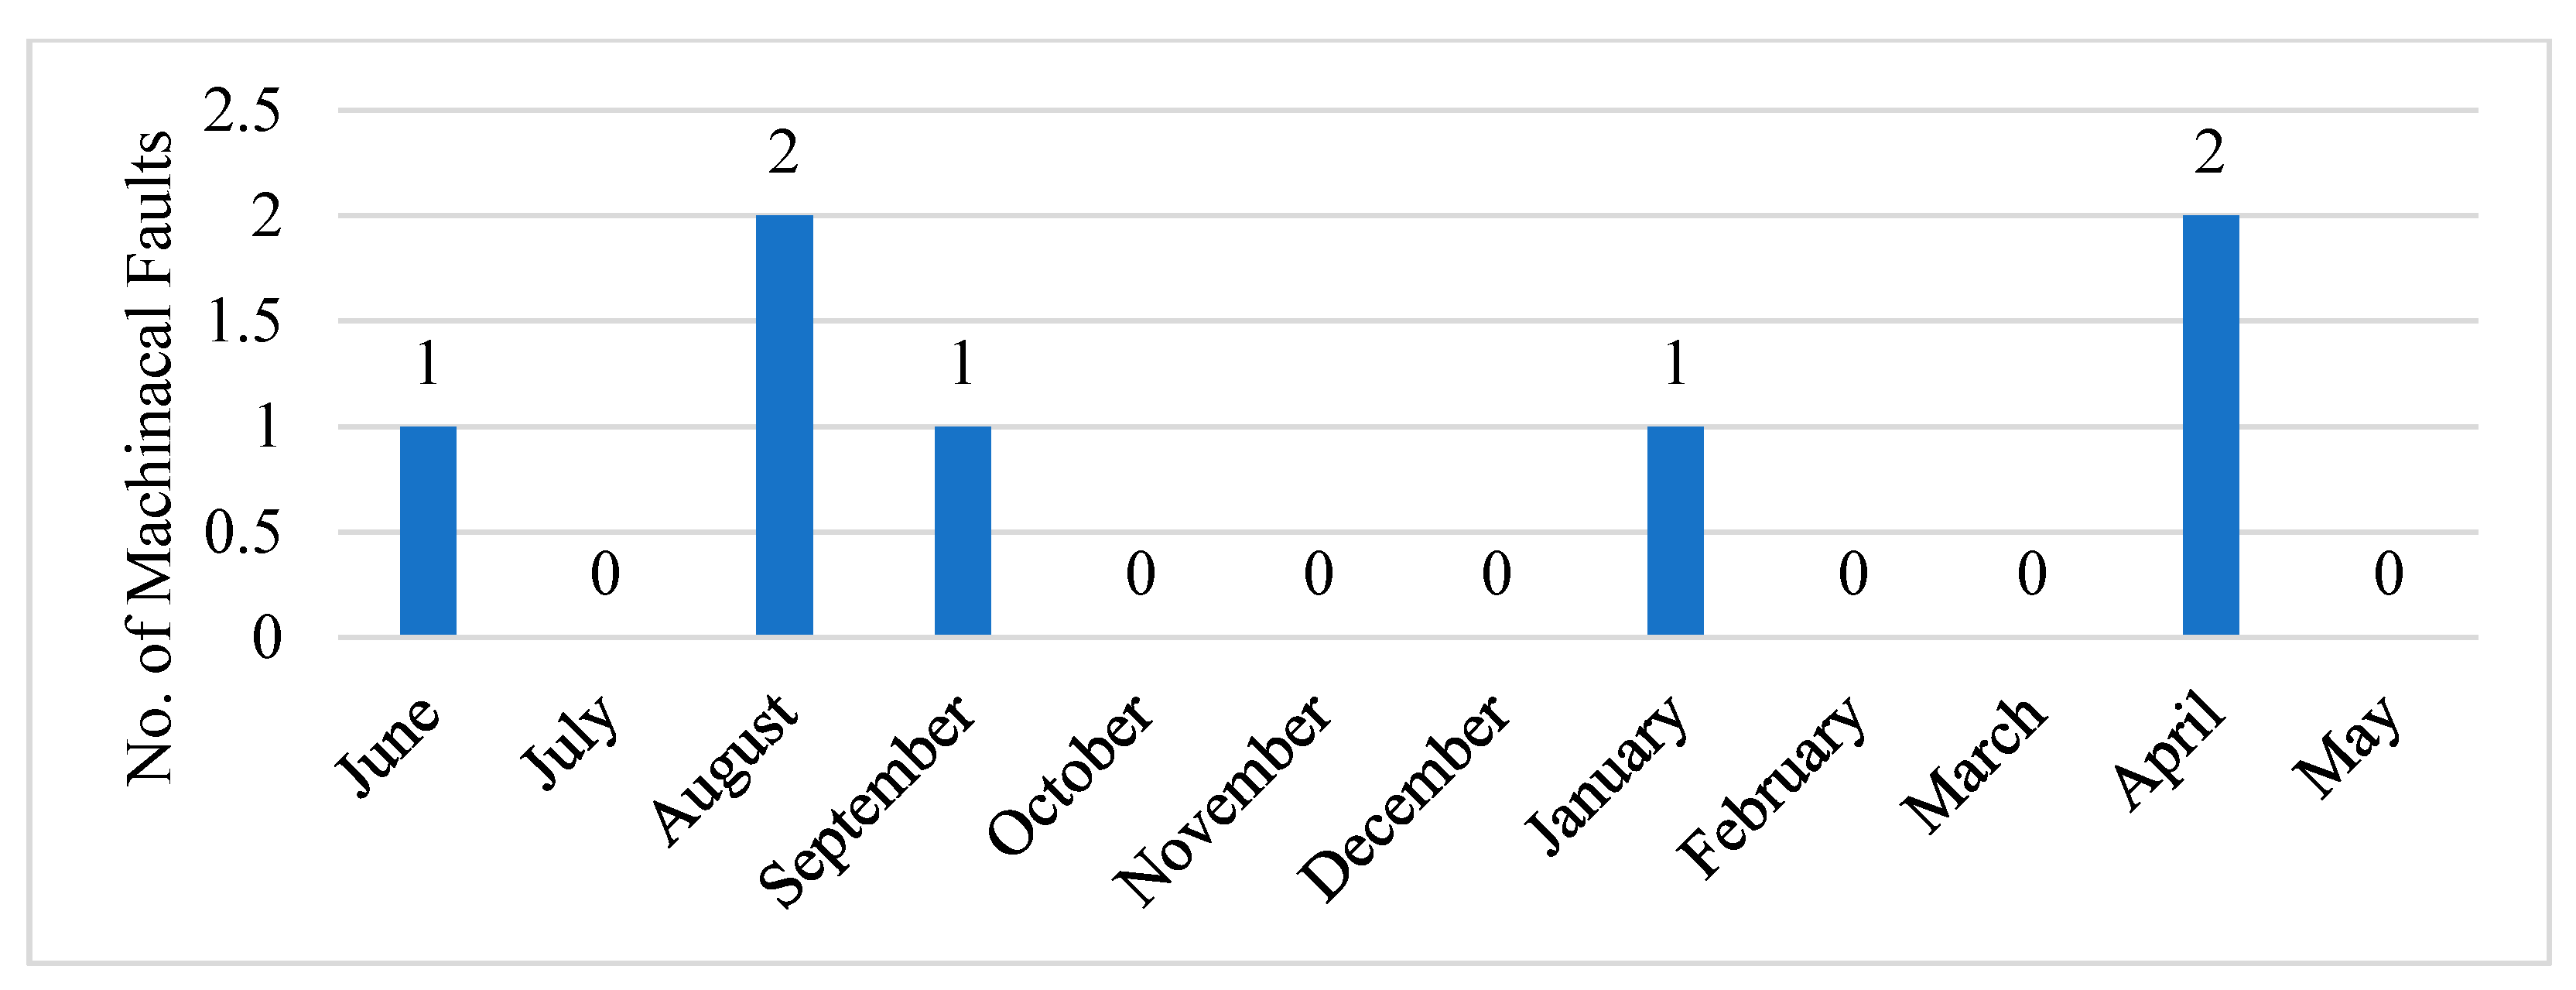
5.3. Mechanical Faults in BRT

Quantification of any faults or failures gives a measure of the system design and maintenance. For example, the graph shown in Figure 5 below describes the mechanical shortcomings experienced by the articulated buses during 12 months period from June 2017 to May 2018.
Figure 5 shows a total of 7 mechanical failures experienced by articulated buses in a year. In case of any fault, the availability of another bus smoothens the system continuity and makes a minimum disturbance to the dwellers. Therefore, less mechanical failure shows that the better performance of BRT Multan.

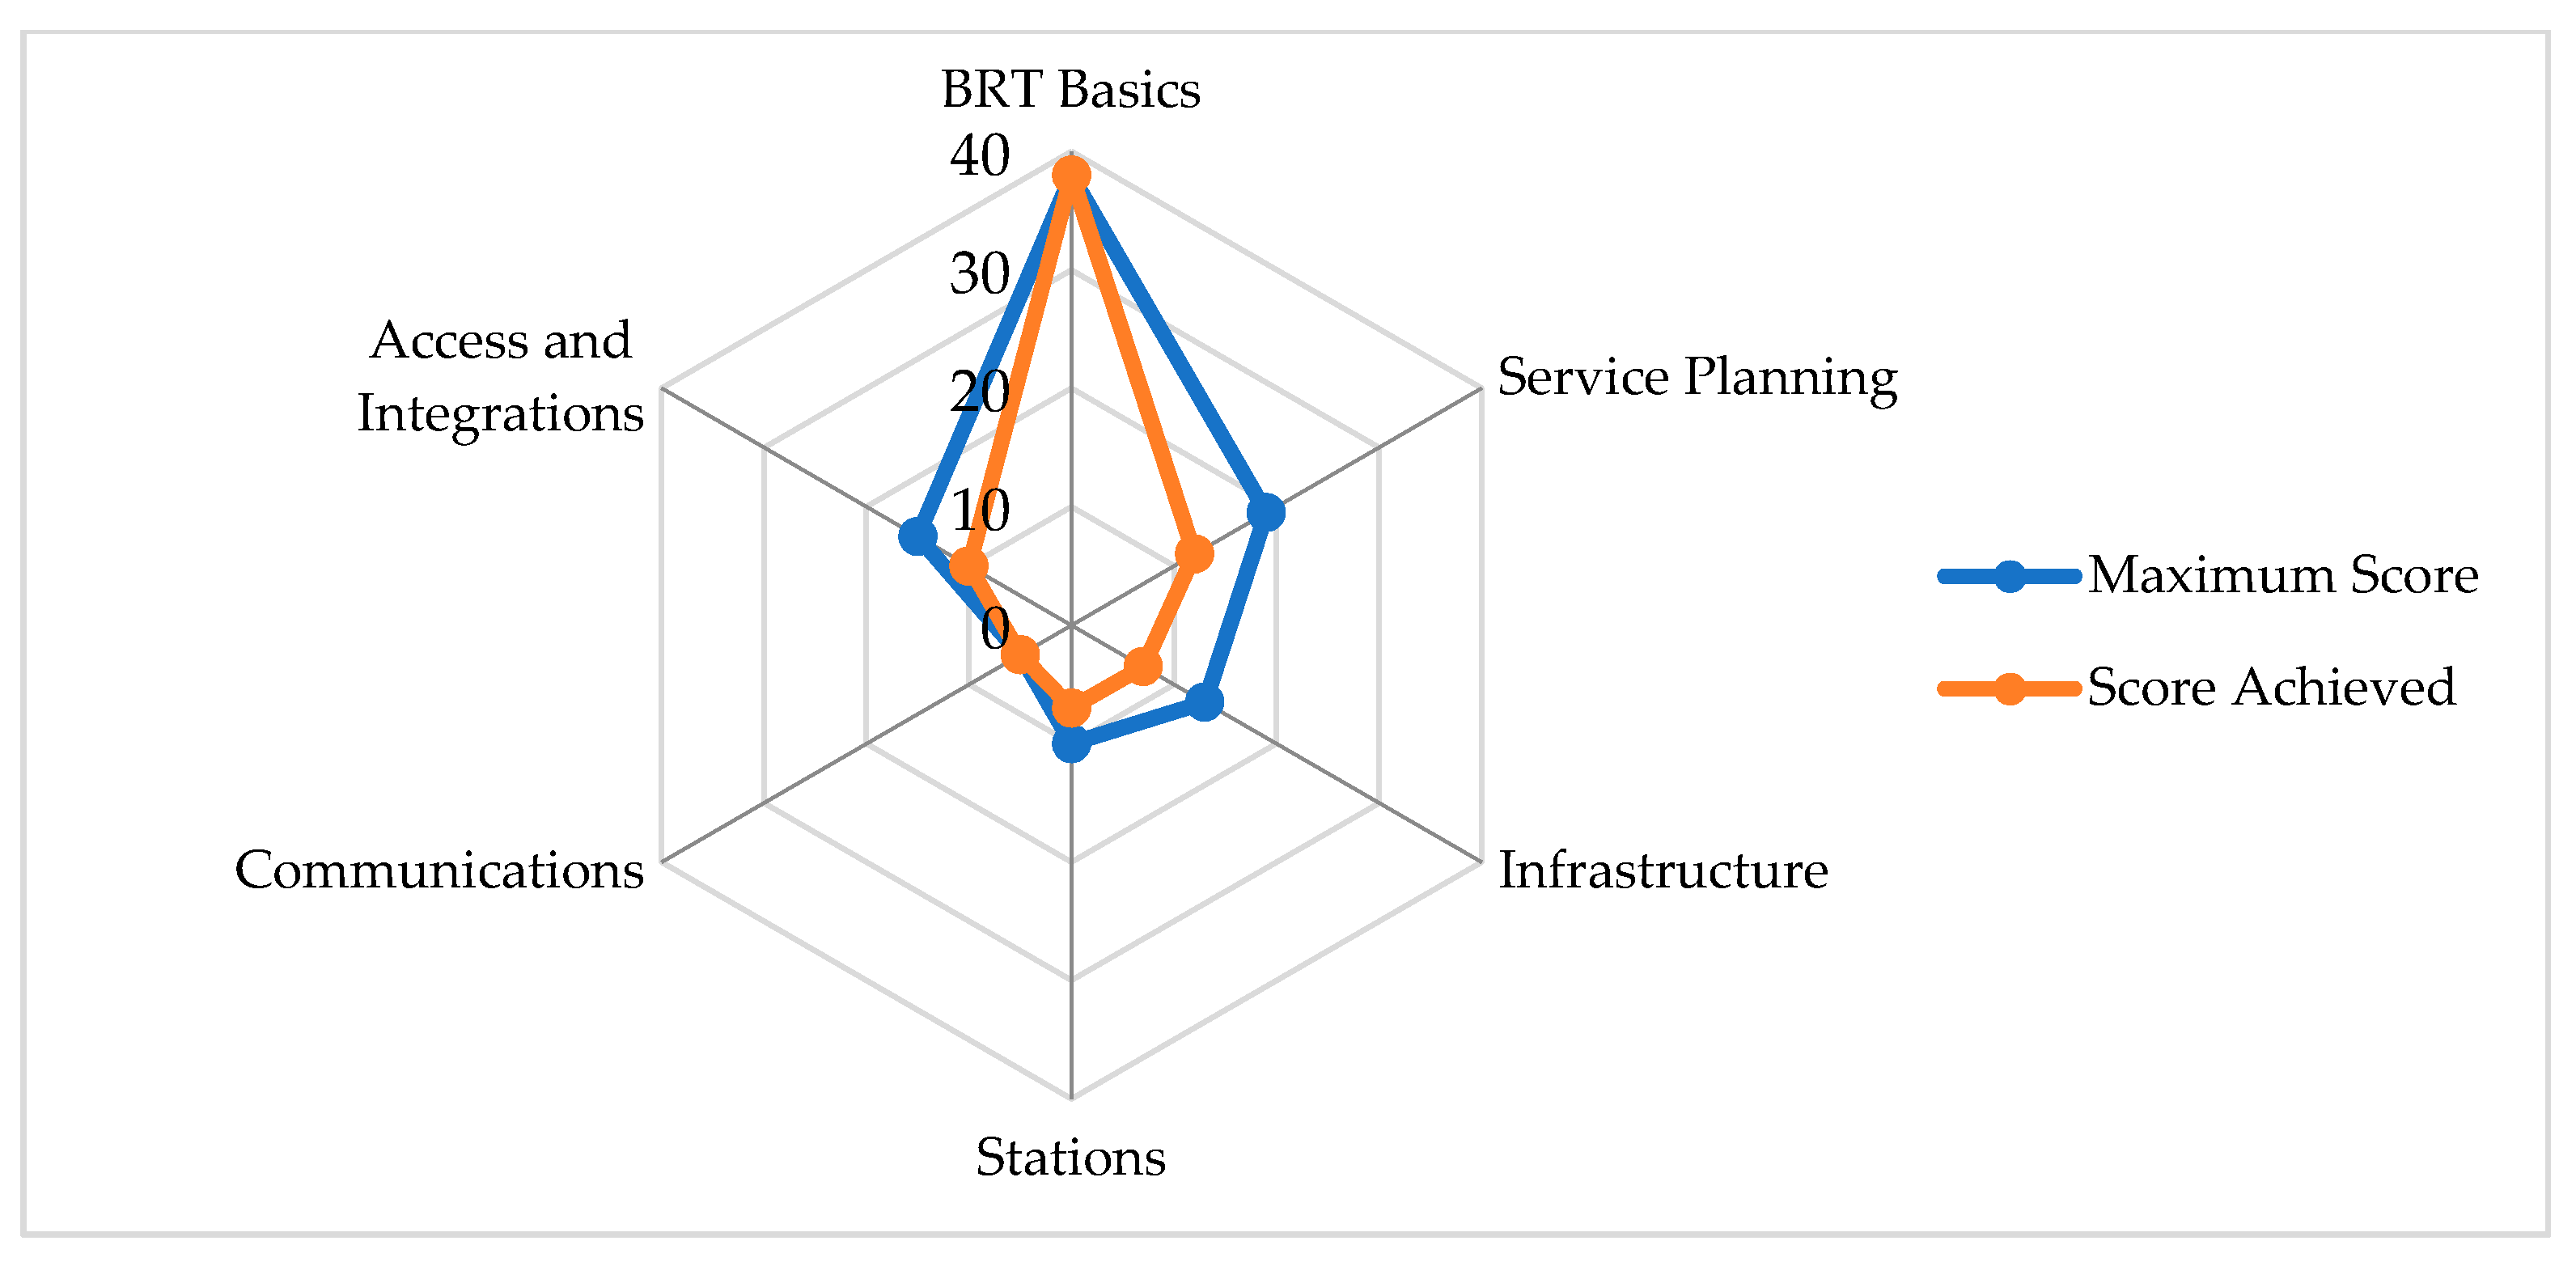
5.4. Evaluation Based on the BRT Standard Scorecard

The BRT standard developed by the Institute of Transportation and Development Policy (ITDP) was used for evaluation. The BRT Standard is an evaluation tool for world-class BRT based on international best practices. These standard uses design characteristics that act as proxies for improved the performance and customer experience. This BRT standard scoring method celebrates high-quality BRT systems but is not intended to denigrate lighter BRT improvements which may also yield significant benefits. The BRT Standard provides a framework for system designers, decision-makers, and the sustainable transport community to implement and identify the features of top-quality BRT systems. Based on the BRT Standard scorecard, the system can be categories as Gold Standard, Silver Standard, Bronze Standard and Basic Sets which are internationally recognised. The BRT Standard scoring system was created to protect the BRT brand and offer recognition to high-quality BRT corridors around the globe. The BRT corridors are assessed in two ways: design score and full score (Design + Operations). The performance of the Multan BRT was evaluated based on the scorecard on the following categories such as BRT basics, service planning, infrastructure, stations, communications, and access and integration. The required data for evaluation of the BRT Multan was collected by conducted observation surveys and interviews with officials of PMA. The detailed assessment of BRT Multan is given in Table 3. A deduction penalty is also imposed due to various inefficiencies of the system, and scores are subtracted accordingly.
The details given in Table 4 summarise the BRT system evaluation based on the BRT Standard Scorecard 2016 as specified by ITDP. The scores achieved by the BRTS Multan against each of the evaluated aspects are satisfactory. BRT Multan earned 79 points on a scale of 100 and fell in the range of 70–84 scores, specified as a silver category by the BRT Standard definition. The calculated BRT Multan scores are more than BRT Lahore and BRT Line Three Iran [31]. The other 21 scores which Multan BRT could not achieve are mostly related to the future extension of the services to multiple routes or expanding transport services to express and different types of services. The deduction scores for BRT Multan are shown in Table 4.
A summary of the overall scores achieved in each aspect is shown in Figure 6.
The deduction score awarded to the system is 0 as BRT Multan is performing well. The system maintains acceptable commercial speed, experiencing no evidence of overcrowding, transporting more than 1000 passengers per hour per direction during peak hours, and having less possibility of encroachment due to fencing along the corridor. It also possesses: better Kassel kerb design to minimise the gap between bus and platform at stations, well-maintained buses, busways, and other systems, maintaining minimum headway to accommodate ridership demand, increased headway during the off-peak time to cater for reduced ridership demand economically, collection of traffic safety data, and banning of all parallel public transport routes along BRT corridor. However, some aspects can be improved. Notably, providing multiple routes, express services, integrating bicycle-sharing, and employing environmentally friendly buses with low emissions in future years. Similarly, some features linked to the infrastructure require changes. For instance, providing passing lanes at stations, changing the distance between stations, and providing docking bays or sub-stops can be crucial to enhancing the current performance of BRT.

6. Conclusions

Based on user perception and the BRT scorecard method, this study analysed the extent to which the Multan BRT system caters to citizens’ mobility needs. The user perception method evaluates the system based on users’ expectations and the services offered by the system. The scorecard method follows a standard procedure to compare the provided facilities with the standard. The outcome of both these methods is to evaluate the system’s performance in meeting the mobility needs of the end-users. A well-planned, designed, and efficiently operated system will guarantee the user’s satisfaction and high scoring. User perception was obtained based on the data collected from 420 BRT users. The derived sample possessed varying characteristics concerning gender, education level, travel mode, the physical location or residence from BRT stations, etc. Notably, most respondents disclosed comfort, time, and money as the main reasons for choosing BRT as a travel mode. The reliability analysis revealed that most stations of BRT Multan are above the acceptable value (0.8 > α ≥ 0.7), with only six out of 21 stations categorised as unacceptable (α < 0.5). These stations are located in the old built-up area of Multan. Because of this, most respondents are not aware of the services provided by BRTS Multan. Endorsing some awareness programs in the city on the utilisation of BRTS and realising the importance of public transport to the people and our future generations can impact the construction and performance of the other BRT routes in the city.
Based on the scorecard method, BRT Multan was evaluated by considering the ITDP criteria. Multan BRT achieved 79 scores with 0 deduction scores and categorised as silver standard. The deficiencies in service planning, infrastructure stations, access, and integration were identified as critical barriers for citizens. Some of these aspects can be upgraded, i.e., providing multiple routes, express services, integrating bicycle-sharing, and employing environmentally friendly buses with low emissions in future years. On the other hand, some features linked to the infrastructural changes are not possible due to financial and time constraints.
In sum, the evaluation based on user perception and scorecard method shows that BRT Multan is performing well to improve the public transport image in the developing county. BRT Multan currently achieves the silver rank and falls just six scores shorter to reach the gold category, which can be achieved in future years by maintaining the current performance of the system and targeting the achievable aspects.
This study provides a basis to identify the porosity in the system to be tackled to satisfy the end-users. After having the user perception and scorecard table, stakeholders can consider the right course to improve the system performance to touch the upper category. Notably, the demand patterns and financial outcomes tend to adjust the BRT system. The recent pandemic has reduced demand due to social distancing and the reduction of people on board. Given the research findings, the following critical policy implications are recommended to further improve the citizens’ mobility with BRT, especially in the post-pandemic phase. The recommendations could also prove fruitful for the prospective BRT projects in Pakistan:
  • ITDP BRT criteria should be strictly followed in the construction of future BRT lines in Pakistan. Moreover, the existing BRT system should be evaluated against ITDP criteria, and required changes should be made to ensure performance (see Appendix A).
  • Active transport planning is crucial in attracting users to the BRT systems. Therefore, the future BRT lines should emphasise and plan the active transport aspects (such as walking infrastructure, bicycle facilities) while designing BRT.
  • A mass transit authority should be formed at the national level to ensure the standardisation and applicability of ITDP on all BRT projects across the country.
  • Measures should be taken to ensure that people maximise public transport usage and consider it their everyday travel mode.
  • The average daily ridership of BRT Multan is relatively low compared to the other implemented BRT cities in the country. Therefore, the best BRT route should be selected for attracting higher ridership before the execution of any BRT project by engaging the community representatives in the planning and designing stages.
  • BRT should have to be widely supported by other services such as demand-responsive transport (DRT) or shared mobility that can integrate the service and offer it for areas with weak demand. Hence, it is necessary to combine the different forms of mobility within digital MaaS platforms to facilitate the citizens’ mobility needs.
  • Lastly, it is also necessary to effectively consider DRT in the policymaking as the main service competitors are operating in mixed traffic on the same routes of the BRT, even before the pandemic. Thus, proper integration of such services with BRT could further enhance the citizens’ accessibility to the BRT stations, which will, in turn, increase the ridership.

Author Contributions

Conceptualisation, M.N., M.A. (Muhammad Azam) and M.A. (Muhammad Asim); methodology, M.N., and M.A. (Muhammad Azam); software, M.N., M.A.(Muhammad Azam), and M.A.A.-R.; validation, M.N., M.A. (Muhammad Asim), M.A.A.-R. and O.C.P.; formal analysis, M.N.; investigation, M.N., M.A. (Muhammad Asim), and M.A.A.-R.; resources, M.A.A.-R., and T.C.; data curation, M.N., and M.A. (Muhammad Asim); writing—original draft preparation, M.N.; writing—review and editing, M.N., M.A. (Muhammad Azam), M.A. (Muhammad Asim), M.A.A.-R., O.C.P., and T.C.; supervision, M.A. (Muhammad Asim); funding acquisition, T.C. All authors have read and agreed to the published version of the manuscript.

Funding

This research work was also partially funded by the MIUR (Ministry of Education, Universities, and Research [Italy]) through a project entitled WEAKI TRANSIT.

Institutional Review Board Statement

Not applicable.

Informed Consent Statement

Informed consent was obtained from all subjects involved in the study.

Data Availability Statement

The data presented in this study are available on request from the corresponding authors.

Acknowledgments

The authors are thankful to the Punjab Masstransit Authority for providing valuable information about Multan BRT. The authors acknowledge financial support from the MIUR (Ministry of Education, Universities and Research [Italy]) through a project entitled WEAKI TRANSIT: WEAK-demand areas Innovative TRANsport Shared services for Italian Towns (Project code: 20174ARRHT/CUP Code: J74I19000320008), financed with the PRIN 2017 (Research Projects of National Relevance) program. We authorise the MIUR to reproduce and distribute reprints for Governmental purposes, notwithstanding any copyright notations thereon. Any opinions, findings, and conclusions or recommendations expressed in this material are those of the authors and do not necessarily reflect the views of the MIUR.

Conflicts of Interest

The authors declare no conflict of interest.

Appendix A

  • Operational Date of BRT System in Multan: _______________________________
  • Dedicated Right of Way for BRT: ___________________ ft
  • No. of lanes: ________________
  • Number of operating Buses: _______________
  • Sitting capacity of each bus: _______________
  • Total capacity of each bus: _____________
  • Average speed of bus: ____________ kmh
  • Operating speed of bus: ____________ kmh
  • Maximum speed of bus: ____________ kmh
  • Average fleet age: ____________
  • Number of doors on bus: ___________
  • Location of doorways (Left or Right)
  • Vehicle fuel (Deisal/Petrol/CNG)
  • Level boarding (Yes/No)
  • Overtaking lane (Yes/No), If YES, length of overtaking lane: ____________ km
  • Off-board fare collection (Yes/No)
  • Peak hour frequency (No. of bus/hr): ____________
  • Off-peak hour frequency (No. of bus/hr): ____________
  • Average Trip Time (20/30/40/50/60 min)
  • Control center (Yes/No)
  • Passing lanes at stations (Yes/No), If YES, number of stations having passing lane: ___________
  • Stations set back from intersections: ___________ meter
  • Sliding doors at BRT stations (Yes/No)
  • Passenger information system on vehicle (Yes/No)
  • Passenger information system on station (Yes/No)
  • Integration with other public transport (Yes/No)
  • Pedestrian access (Yes/No)
  • Secure bicycle parking (Yes/No)
  • Bicycle lanes (Yes/No)
  • Wheelchair accessible (Yes/No)
  • Fare-collection method (Card/Ticket/Coin)
  • Dwell times at stops (20/30/40/50 Sec.)
  • Headway during a day (05/10/15/20 min)
  • Headway during peak hour (05/10/15/20 min)
  • On time performance system (effectiveness) mean how many buses are reached on time: __________
  • Operating cost per passenger trip (05/10/15/20 pkr)
  • Subsidy given per passenger (05/10/15/20 pkr)
  • Average fare/passenger per trip (05/10/15/20 pkr)
  • Number of locations where transfers can be made to other modes and transit operators: __________
  • Distance between vehicle failures: ____________
  • Total Employees working on BRT: ____________
  • Transportation operating employees: ____________
  • Administrative Employees: ____________
  • Weekday span of service: __________ minutes
  • Weekend span of service: __________ minutes
  • Average distance between stations: __________ meter
  • Transfer time of bus: ___________ sec
  • Maintenance cost of each bus: ___________ pkr
  • Number of bus shelters and stops: ___________
  • Average number of accidents: __________ per month
  • Average number of injuries: __________ per month
  • Average number of collisions: __________ per month
  • Average number of vehicle system failures: __________ per month
  • Average number of passenger complaints/Month related to safety: __________ per month
  • Average number of criminal incidents on-board transit and in stations: __________ per month
  • Total service hours provided versus total hours needed to meet transit demand: __________ hour
  • Average days per week that transit service is available: __________ days
  • Hours of service during weekdays: __________ hours
  • Hours of service during weekend: __________ hours
  • Frequency of delays for breakdowns/emergencies: ____________

References

  1. Al-Rashid, M.A.; Goh, H.C.; Harumain, Y.A.S.; Ali, Z.; Campisi, T.; Mahmood, T. Psychosocial barriers of public transport use and social exclusion among older adults: Empirical evidence from Lahore, Pakistan. Int. J. Environ. Res. Public Health 2021, 18, 185. [Google Scholar] [CrossRef] [PubMed]
  2. Shirwani, R.; Gulzar, S.; Asim, M.; Umair, M.; Al-Rashid, M.A. Control of vehicular emission using innovative energy solutions comprising of hydrogen for transportation sector in Pakistan: A case study of Lahore City. Int. J. Hydrogen Energy 2020, 45, 16287–16297. [Google Scholar] [CrossRef]
  3. Delbosc, A.; Currie, G. The spatial context of transport disadvantage, social exclusion and well-being. J. Transp. Geogr. 2011, 19, 1130–1137. [Google Scholar] [CrossRef]
  4. Venter, C.; Jennings, G.; Hidalgo, D.; Valderrama Pineda, A.F. The equity impacts of bus rapid transit: A review of the evidence and implications for sustainable transport. Int. J. Sustain. Transp. 2018, 12, 140–152. [Google Scholar] [CrossRef]
  5. Ma, L.; Kent, J.L.; Mulley, C. Transport disadvantage, social exclusion, and subjective well-being. J. Transp. Land Use 2018, 11, 31–47. [Google Scholar] [CrossRef] [Green Version]
  6. Currie, G.; Richardson, T.; Smyth, P.; Vella-Brodrick, D.; Hine, J.; Lucas, K.; Stanley, J.; Morris, J.; Kinnear, R.; Stanley, J. Investigating links between transport disadvantage, social exclusion and well-being in Melbourne—Preliminary results. Transp. Policy 2009, 16, 97–105. [Google Scholar] [CrossRef] [Green Version]
  7. Al-Rashid, M.A.; Goh, H.C.; Harumain, Y.A.S.; Ali, Z.; Campisi, T.; Mahmood, T. Psychosocial Factors of Public Transport Users and Social Inclusion Implications Among Older Women in Pakistan. J. Urban Plan. Dev. Forthcoming.
  8. Hickman, R.; Hall, P.; Banister, D. Planning more for sustainable mobility. J. Transp. Geogr. 2013, 33, 210–219. [Google Scholar] [CrossRef]
  9. Al-Rashid, M.A.; Nahiduzzaman, K.M.; Ahmed, S.; Campisi, T.; Akgün, N. Gender-Responsive Public Transportation in the Dammam Metropolitan Region, Saudi Arabia. Sustainability 2020, 12, 9068. [Google Scholar] [CrossRef]
  10. Harumain, Y.A.S.; Nordin, N.A.; Zaid, S.M.; Goh, H.C.; Woodcock, A.; Mcdonagh, D.; Al-Rashid, M.A.; Faiz, K. Understanding factors of using public transportation among women in Kuala Lumpur. J. Pengemb. Kota 2020, 8, 109–115. [Google Scholar] [CrossRef]
  11. Vermeiren, K.; Verachtert, E.; Kasaija, P.; Loopmans, M.; Poesen, J.; Van Rompaey, A. Who could benefit from a bus rapid transit system in cities from developing countries? A case study from Kampala, Uganda. J. Transp. Geogr. 2015, 47, 13–22. [Google Scholar] [CrossRef]
  12. Panchore, V.; Khushwaha, N. Performance evaluation of BRTS. IJSTE-Int. J. Sci. Technol. Eng. 2016, 2, 509–512. [Google Scholar]
  13. Institute for Transportation and Development Policy. The BRT Standard; Institute for Transportation and Development Policy: New York, NY, USA, 2016; pp. 1–40. [Google Scholar]
  14. Hinebaugh, D. Characteristics of Bus Rapid Transit for Decision-Making; National Bus Rapid Transit Institute, Center for Urban Transportation Research, University of South Florida: Tampa, FL, USA, 2009; pp. 1–412. [Google Scholar]
  15. Campisi, T.; Tesoriere, G.; Canale, A. The variability of Level of Service and Surrogate Safety Assessment of urban turbo-roundabout with BRT system. J. Multidiscip. Eng. Sci. Technol. 2018, 5, 8861–8869. [Google Scholar]
  16. Kiani Mavi, R.; Zarbakhshnia, N.; Khazraei, A. Bus rapid transit (BRT): A simulation and multi criteria decision making (MCDM) approach. Transp. Policy 2018, 72, 187–197. [Google Scholar] [CrossRef]
  17. Campisi, T.; Canale, A.; Tesoriere, G.; Renčelj, M. The newest public transport system applied to turbo roundabouts. In Proceedings of the Institution of Civil Engineers-Engineering Sustainability; Thomas Telford Ltd.: London, UK, 2020. [Google Scholar]
  18. Siedler, C.E. Can bus Rapid Transit be a Sustainable Means of Public Transport in Fast Growing Cities? Empirical Evidence in the Case of Oslo. Transp. Res. Procedia 2014, 1, 109–120. [Google Scholar] [CrossRef] [Green Version]
  19. A Guidebook for Developing a Transit Performance-Measurement System. Available online: https://www.researchgate.net/publication/301771208_A_Guidebook_for_Developing_a_Transit_Performance-Measurement_System (accessed on 25 June 2021).
  20. Bayle, R.; Mulley, C.; Tirachini, A. Identifying the Performance Parameters of Importance in the Design of Bus Rapid Transit: An Experimental Framework Using Microscopic Simulation; Institute of Transport and Logistic Studies (ITLS), University of Sydney: Sydney, Australia, 2012. [Google Scholar]
  21. dell’Olio, L.; Ibeas, A.; Cecin, P. The quality of service desired by public transport users. Transp. Policy 2011, 18, 217–227. [Google Scholar] [CrossRef]
  22. Eboli, L.; Mazzulla, G. A methodology for evaluating transit service quality based on subjective and objective measures from the passenger’s point of view. Transp. Policy 2011, 18, 172–181. [Google Scholar] [CrossRef]
  23. Alçura, G.A.; Kuşakcı, S.Ş.; Şimşek, G.G.; Gürsoy, M.; Tanrıverdi, S.C. Impact Score Technique for Analyzing the Service Quality of a High-Speed Rail System. Transp. Res. Rec. 2016, 2541, 64–72. [Google Scholar] [CrossRef]
  24. Barabino, B.; Deiana, E.; Tilocca, P. Urban Transport Management And Customer Perceived Quality: A Case Study In The Metropolitan Area Of Cagliari, Italy. Theor. Empir. Res. Urban Manag. 2011, 6, 19–32. [Google Scholar]
  25. Ladhari, R. A review of twenty years of SERVQUAL research. Int. J. Qual. Serv. Sci. 2009, 1, 172–198. [Google Scholar] [CrossRef]
  26. Barabino, B.; Di Francesco, M. Characterizing, measuring, and managing transit service quality. J. Adv. Transp. 2016, 50, 818–840. [Google Scholar] [CrossRef] [Green Version]
  27. Khalid, U.A.; Bachok, S.; Osman, M.M.; Ibrahim, M. User Perceptions of Rail Public Transport Services in Kuala Lumpur, Malaysia: KTM Komuter. Procedia Soc. Behav. Sci. 2014, 153, 566–573. [Google Scholar] [CrossRef] [Green Version]
  28. Evaluation of Indore BRT: Passengers’ Perception of Services and Improvement Opportunities. Available online: https://www.researchgate.net/profile/Dr-Netula/publication/321722917_Evaluation_of_Indore_BRT_Passengers%27_Perception_of_Services_and_Improvement_Opportunities/links/5a2e3d6d45851552ae7f1555/Evaluation-of-Indore-BRT-Passengers-Perception-of-Services-and-Improvement-Opportunities.pdf (accessed on 28 June 2021).
  29. Wan, D.; Kamga, C.; Liu, J.; Sugiura, A.; Beaton, E.B. Rider perception of a “light” Bus Rapid Transit system—The New York City Select Bus Service. Transp. Policy 2016, 49, 41–55. [Google Scholar] [CrossRef]
  30. Rathore, K.; Ali, K. Evaluation of Lahore Bus Rapid Transit System. Int. J. Manag. Sci. Bus. Res. 2015, 4, 138–148. [Google Scholar]
  31. Saidi, M.; Shiri, E.; Khalili, M. Evaluating Bus Rapid Transit (BRT) line three in Tehran with international standards and providing solutions to improve it. Urban Manag. 2015, 40, 89–104. [Google Scholar]
  32. Pakistan Bureau of Statistics. Provisional Summary Results of 6th Population and Housing Census; Pakistan Bureau of Statistics, Ministry of Statistics: Islamabad, Pakistan, 2017.
  33. Multan Development Authority. Available online: https://multan.punjab.gov.pk/mda_distt (accessed on 25 June 2021).
  34. Aziz, A.; Nawaz, M.S.; Nadeem, M.; Afzal, L. Examining suitability of the integrated public transport system: A case study of Lahore. Transp. Res. Part A Policy Pract. 2018, 117, 13–25. [Google Scholar] [CrossRef]
  35. Bonett, D.G.; Wright, T.A. Cronbach’s alpha reliability: Interval estimation, hypothesis testing, and sample size planning. J. Organ. Behav. 2015, 36, 3–15. [Google Scholar] [CrossRef]
  36. Tavakol, M.; Dennick, R. Making sense of Cronbach’s alpha. Int. J. Med. Educ. 2011, 53–55. [Google Scholar] [CrossRef]
  37. PMA. Punjab MassTransit Authority, Punjab. Available online: http://www.pma.punjab.gov.pk (accessed on 25 June 2021).
Figure 1. Location of the Study Area—BRT Multan.
Sustainability 13 07314 g001
Figure 2. Graphical representation of the research methodology.
Sustainability 13 07314 g002
Figure 3. Results of Cronbach’s Alpha for BRT Multan.
Sustainability 13 07314 g003
Figure 4. Multan BRT daily ridership from June 2017 to May 2018. Source: Punjab Masstransit Authority (PMA).
Sustainability 13 07314 g004
Figure 5. Mechanical faults of buses from June 2017 to May 2018. Source: Punjab Masstransit Authority (PMA).
Sustainability 13 07314 g005
Figure 6. Achieved and Maximum Scores for BRT Multan.
Sustainability 13 07314 g006
Table 1. General Characteristics of the Respondents.
Sr. NoCharacteristicsStatistics
1GenderMale (59.29%), Female (40.71%)
2Age (years)<18 (22.38%), 18–30 (55.48%), 31–45 (17.62%), >45 (4.52%)
3QualificationPrimary (10.71%), Middle (13.81%), High (17.38%), Intermediate (20.24%), Graduation (30.95%), Post-graduation (6.90%)
4ProfessionStudent (56.43%), Employed (21.90%), Businessman (11.67%), Labor (10.00%)
5Mode used to reach the nearest BRT stationBus/Wagon (31.67%), Rickshaws (26.19%), Motorcycle (23.10%), Car (15.71%), Walk (3.33%)
6Distance to access nearest BRT station (km)0.5–1 (43.81%), 1–5 (40.48%), 5–10 (8.57%), >10 (7.14%)
7Type of mode used before the introduction of BRT SystemBus/Wagon (31.67%), Rickshaws (37.14%), Motorcycle (22.38%), Car (7.62%), Walk (1.19%)
8Frequency of travel on BRT in a weekFirst Time (6.19%), Once in a week (3.33%), 2–3 Days (41.43%), 4–7 Days (49.05%)
9No. of stations, travel to reach destination1–5 (23.10%), 5–10 (48.33%), 10–15 (19.29%), 15–21 (9.29%)
10Origin of travellerHome (70.48%), Work (10.95%), Shopping Market (0.95%), Educational Institute (17.62%)
11Destination of travellerHome (13.81%), Work (28.33%), Shopping Market (3.10%), Educational Institute (54.76%)
12Mode of PaymentCash (45.24%), Metro Card (54.76%)
13Preference regarding BRT System due to which factorSchedule/Time (21.43%), Comfort (54.76%), Saves Money (20.95%), Congestion (2.86%)
Table 2. Issues with BRT utilisation.
No.VariablesSatisfiedBarriers to BRT Use
1Performance of escalatorsYesNo
2Spatial access and location of BRT stationsNoYes
3Ease of getting a ticketYesYes
4Condition of informatory signs provided at the stationsYesNo
5City-wide accessibilityNoYes
6Performance of informatory signsYesNo
7Platform level boardingYesYes
8Condition of seating facilities at the stationsYesNo
9Comfort and seating facilities in the Metro BusYesNo
10Parking facilities at the stationNoYes
11Metro Bus average speedNoYes
12The time between two consecutive busesYesYes
13Performance of BRT system during rush hoursYesYes
14Available operational hours of Metro BusYesNo
15Waiting time at the intersectionYesNo
16Barrier-free physical access to metro stationNoYes
17Facilities provided for specialised passengers at the metro stationYesNo
18Priority seating and space for specialised passengers within the busYesNo
Table 3. BRT System, Multan evaluation based on the BRT Standard Scorecard.
CategorySub-CategoryMax. ScoreAwarded ScoreRemarks/Description of Awarded Score
BRT BasicsDedicated Right-of-Way88BRTS Multan have dedicated right-of-way uses fences along the entire corridor and full enforcement with physical segregation
Busway Alignment88It has a fully exclusive right of way that is in the centre of a two-way road
Off-board Fare Collection88All stations of BRTS Multan have barrier-controlled, off-vehicle fare collection
Intersection Treatments77All turns are prohibited across the busway at BRTS Multan. Most portion of BRT is elevated (14 stations are elevated out of 21).
Platform-level Boarding77All buses are platform level; system-wide measures for reducing the gap in place
Service PlanningMultiple Routes40It has no multiple routes. Currently, it is operating at a single route
Express, Limited, and Local Services30BRTS Multan have no express services
Control Center33Full-service control centre monitors the locations of all buses with GPS & Real-time monitoring
Located in Top Ten Corridors22BRTS Multan corridor is one of the top ten demand corridors/connected routes
Demand Profile33BRTS Multan corridor includes the highest demand segment, which has a Tier 1 Corridor configuration
Hours of Operations22It has operated late-night and on weekend days. Timing hours are 6:15 am to 10:00 pm.
Multi-corridor Network22One corridor is in existing and operated since 2017. Other BRT lines are planned in Multan city
InfrastructurePassing Lanes at Stations30No availability of passing lanes at all BRTS Multan stations
Minimising Bus Emissions30All buses operated in MMBS are EURO II
Stations Set Back from Intersections33Fully exclusive busways with no intersections (In BRT Multan, 14 stations are elevated out of 21 stations)
Center Stations22All stations have centre platforms serving both directions of service
Pavement Quality22Pavement structure designed for 30-year life over an entire corridor of BRTS Multan
StationsDistances Between Stations20The BRTS Multan stations are spaced, on an average distance of 880 m
Safe and Comfortable Stations33All stations are at least 3 m wide on one side of the station
Number of Doors on Bus33All buses have three doors for passengers and one door exclusively for the driver
Docking Bays and Sub-stops10It has no docking bays and sub stops
Sliding Doors in BRT Stations11All stations have 12 sliding doors on both sides of the platform (6 doors on each side of the platform)
CommunicationsBranding33All buses, routes, and stations in the corridor follow a single unifying brand of entire BRTS Multan
Passenger Information22It has functional real-time and up to date passenger information at stations and on vehicles
Access and IntegrationUniversal Access33All stations, vehicles, and fare gates are fully accessible for wheelchairs
Integration with Other Public Transport33BRTS Multan is integrated with feeder bus service in the entire city. Fare and physical design integration at all stations of BRTS Multan
Pedestrian Access and Safety44All stations have good, safe pedestrian access and for a 500-m catchment area surrounding the entire corridor
Secure Bicycle Parking20No availability of bicycle parking observed at stations of BRTS Multan
Bicycle Lanes20It no bicycle lanes/infrastructure on or parallel to the entire route
Bicycle-sharing Integration10It has no bicycle-sharing integration
Total Scores10079SilverStandard BRT
Table 4. Deduction Scores for BRT Multan.
Operations DeductionsMax. ScoreAwarded ScoreRemarks/Description of Awarded Score
Commercial Speeds−100Average commercial speed of 45 kph (+/−10) at the elevated route and 50 kph (+/−10) at grade
Peak Passengers per Hour per Direction (pphpd) Below 1000−50Ridership is more than 1000 peek passengers per hour per direction (pphpd) of BRTS Multan
Lack of Enforcement of Right-of-Way−50No encroachment has observed on the right of way of BRTS Multan due to fence along the whole route
Significant Gap Between Bus Floor and Station Platform−50No Significant Gaps have been observed between the bus floor and station platform of BRTS Multan.
Overcrowding−50All stations of BRTS are not crowded, and the average passenger density for buses during the peak hour is not greater than five passengers per square meter
Poorly Maintained Busway, Buses, Stations, and Technology Systems−140All busway, buses, stations, and technology system are properly maintained by the technical staff of BRTS by Daewoo and Inbox company
Low Peak Frequency−30Headway during peak hour is about 3.25 min. Low peak frequency observed more than eight buses per hours
Low Off-peak Frequency−20Headway during an off-peak hour is about 5–8 min. Low off-peak frequency observed more than four buses per hours
Permitting Unsafe Bicycle Use−20It has operated on a separated route with physical segregation
Lack of Traffic Safety Data−20Safety data of BRT route collected by BRTS staff in Multan
Buses Running Parallel to BRT Corridor−60All public and private passengers vehicles are banned on the BRT route in Multan
Bus Bunching−40The distance between buses becomes not highly uneven
Total Deduction−630No deduction penalty
Publisher’s Note: MDPI stays neutral with regard to jurisdictional claims in published maps and institutional affiliations.

