
Methodological Proposal for Recognition Systems in Sustainable Freight Transport


1
Production Engineering Program, Federal Center of Technological Education Celso Suckow da Fonseca CEFET/RJ, Rio de Janeiro 999074, Brazil
2
Transport Engineering Program COPPE/UFRJ, Federal University of Rio de Janeiro, Rio de Janeiro 999074, Brazil
3
Production Engineering Program COPPE/UFRJ, Federal University of Rio de Janeiro, Rio de Janeiro 999074, Brazil
*
Author to whom correspondence should be addressed.
Sustainability 2021, 13(13), 7511; https://0-doi-org.brum.beds.ac.uk/10.3390/su13137511
Submission received: 29 May 2021
/
Revised: 21 June 2021
/
Accepted: 22 June 2021
/
Published: 5 July 2021
(This article belongs to the Collection Sustainable Freight Transportation System)
Abstract
:Establishing a recognition system for sustainable freight transport is a process of change that requires the commitment of those involved and application of good practices. The pressures from consumers and competitors do not allow greater engagement with economic, social, and environmental aspects, and the maintenance stages require a long-term effort to obtain credibility, because the participation of external members of society in the evaluation contributes to reduce the influences and uncertainties of the recognition criterion. In light of the difficulties of establishing a green supply chain, we propose a method with multiple approaches with an emphasis on fuzzy logic. The purpose is to reduce the indecision of judgment, to debug the qualitative variables and to reduce interference from competitors. The procedure was applied to six companies that have carbon reduction programs, but we found that firms with a core business in transport had greater success in the transition to low carbon operations than contractors or shippers. The certification levels allowed visual contact between consumers and the company, making it possible to monitor sustainability actions in freight transportation operations and the competitiveness to achieve higher labeling levels.
1. Introduction
The main recent change in supply chains is the absorption of the premises of sustainable freight transport systems by companies, which will be essential for the maintenance of activities from extraction to the delivery of the product to customers in B2B or B2C. The challenge is the transfer of materials, in the appropriate quantity and quality, with excellent service among the different modes of transport, with less impact on the environment [1,2]. Companies are in the process of change due mainly to external pressures of society for products and services that have less environmental impact throughout the stages of production, consumption, and disposal [3,4,5], and in process of greening [6,7,8].
The transport sector is responsible for 24% of the world’s energy-related CO2 emissions [9], with a high concentration of pollution in urban areas, impacting air quality, with serious effects on health and human ecosystems [10]. Moreover, freight transport in logistics operations accounts for 80% of greenhouse gas (GHG) emissions and more than 90% of the impact on air, land, water, biodiversity, and geological resources [11]. In Brazil, freight transport is responsible for 50% of GHG emissions in transport, and the use of primary energy fuel annually amounts to 204 MtCO2e [12]. Traffic air pollution is associated with several health problems, such as obesity and diabetes, being partly responsible for low productivity and social problems [13,14,15]. These problems cause the need to develop skills for anticipating events in order to assess the risks related to the non-application of good sustainability practices, ensuring the formulation of proactive ideas in the preparation of strategies and optimal allocation of resources.
The integration of company, society and government happens with the voluntary development of standards and actions for the formulation of labels and certifications, with the objective of informing consumers of the commitment of entities to the environment. This involves engagement of all stakeholders in the development of environmental standards applied to products and services [16,17,18]. A good approach is to self-evaluate environmental criteria, because in the long term, with an efficient communication channel, everyone involved will observe sustainability aspects as criteria for product choice [19,20,21]. Transformation requires effort to develop testing protocols, strategic review, and performance verification of management to reduce GHG emissions from freight transport.
The perspective of sustainability requires multiple approaches and criteria in decisions to reduce the uncertainties of results [22,23]. The development of a recognition system (RS) is based on a holistic and non-interventionist view of business activities. The recognition experiment described here was carried out from a three-dimensional perspective of the aspect of sustainability, with emphasis on fuzzy logic as an evaluation criterion.
The objective of this work is to describe the application of a methodological model that fills gaps in RS with the use of the triple bottom line, to reduce the differences of the responses of experts as external members, combined with long-term follow-up with the participation of internal members related to laws and regulations, as well as to analyze the effort of companies to neutralize carbon emissions, recognizing there are several paths to a good result [24].
2. Evaluation of Sustainable Freight Transport
The idea of sustainable freight transport is motivated by the shortage of resources, increasing levels of pollution, global warming, and difficulty of waste disposal [25,26], and the desire to increase competitiveness and economic development [27,28,29,30]. However, there is resistance to the implementation of better environmental habits, because of the increase in costs in the short term. Regarding the degree of importance in decision-making, managers use price and reliability as the most important variables in relation to sustainability [31]. Increased productivity reduces the marginal cost of production, making prices more competitive through the application of green and lean practices [32]. In the case of synchronized scale production, optimized systems reduce lead time costs while at the same time improving the process flow, level of service, environmental quality, employee morale, and commitment of stakeholders [33,34]. The aspects of sustainability have become important tools for competitiveness, mainly the more efficient use of energy for physical distribution of goods, reduction of the number of trips and technological change in motorization. However, the stages of maintaining sustainability criteria are rarely practiced, since companies concentrate efforts on obtaining credibility and brand exposure, based on coercive, mimetic, and normative forces.
There is asymmetry in the diagnosis of the information necessary to obtain good practices. However, rigid and linear processes exclude small companies that do not have the scale gain of large companies from the standardization and execution of complex activities [6,35]. Therefore, the learning process should be simple and cohesive, so that all involved have similar knowledge to classify actions according to the appropriate evidence in advance.
RS is a means of attesting sustainability and balanced standards regarding economic, social, and environmental aspects [20]. It is able to reduce tradeoff in actions, disseminating the environmental gains of the process to society. However, the choice of experts influences decision-making [30,36,37,38]. The expert system that uses fuzzy logic principles has an advantage over closed systems, since they stray from the concept of absolute truth to partial truth [39], more suitable for settings with multiple truths, decisions, and results. Fuzzy logic for the construction of a methodological process in RS for sustainable freight transport aims to reduce distortions of the judgment of experts [30,38], reduce indecision [36], debug qualitative measures to deal with preferential language in a hierarchical structure [40], and emphasize the independent evaluation of qualification [38].
The continuous exchange of information between the internal and external environment is important for improvement of the evaluation model. The findings in [4] highlighted the internalization of practices and the importance of certification standards in the market, based on the perception that some institutions suffer influences from industry, casting doubt on the degree of commitment, since decisions face exogenous forces of competitors [41,42,43].
3. Methodology
The evaluation process for RS is based on the elements of the PDCA cycle (plan, do, check, act), used in ISO 14,001 certification: environmental policy, planning, implementation and operations, verification and correction, and management review [44]. The components were applied in the evaluation of economic, social, and environmental aspects, which were measured through information from a specific questionnaire (Q), scored on a five-point Likert scale for each aspect of sustainability.
Evaluation Score of Sustainable Freight Transport
The freight transport was evaluated according to the sustainability aspects, with emphasis on the flow of information between the internal and external environment. Since the recognition process requires the management of large amounts of information, fuzzy logic was more appropriate to assess the result, with the purpose of mitigating human errors [36], identifying and weighting the main variables [1], and verifying and internalizing good practices [4].
The Mamdani approach has a high computational cost, which can prevent the use of multiple response data inference models in cost-sensitive applications or processes [45]. However, instead of treating each question as an independent set, we chose to treat each aspect of sustainability as a set, forming three input variables in the inference process. In the evaluation of carriers and shippers, the average responses of the experts and auditors for each aspect of sustainability were used as input variables to evaluate the parameters of transport. The survey among experts was conducted with the participation of 24 transport managers, two inventory managers, and five researchers (Appendix A). The choice of resources was important to avoid compromising the reliability of the result due to external influences and pressures [3,4,41,46].
The classical variables formed by the pi questions are transformed to a set of “linguistic terms of a linguistic variable” (pi ⊆ U), using a µpi pertinence function µpi: U → [0,1]. Therefore, the sets µwi = 1, 2, ∆, n in U are obtained by the fuzzification processes with µw (pi) representing the degree to which the element pi belongs to the fuzzy set µ (w). The formation of a single term formed by the set of questions of each aspect was necessary to reduce the cost of processing the data. Table 1 classifies the experts by position (p) and level (l), assigning weights. Equation (1) presents the degree of importance of the experts (GIEi) used by [47].
The result of the GIE (Appendix B) is the score of each expert E, used as a vector in the multiplication of the survey matrix S. The qualitative factors were provided by the external participants ei [48], associated with the qi questions for each aspect of sustainability. Vi is the average product of the S∘E matrices, and the results are the entry variables of the experts, demonstrated in Equation (2). Both inputs feed Ui = (u1, u2, ∆, ui) to obtain the output variables Wi = (w1, w2, ∆, wi), defined in the range [0, 10], characterizing the membership function in μi: UxW → [0, 1], presented in Equation (3).
The result attributes to the membership function the evaluation of the balance of linguistic terms. The term “no importance” is a decreasing function (df). As presented in Equation (4), the terms “little importance”, “important”, and “very important” are triangular functions (trf) in Equation (5), and the term “extremely important” is an increasing function (if) in Equation (6). The score of the W recognition system is classified into five categories: excellent, very good, good, regular, and insufficient. Since the assessment requirements have the same objective, the universe of discourse has the same weight (wi) for all aspects. The input blocks were designated as average estimators, to allow the application of data as a fuzzy singleton set.
The advantage of treating each aspect of sustainability as a fuzzy set was the reduction of linguistic terms to determine the rules of inference [30,36,37,40,49]. Thus, it was possible to maximize all combinations with as few as possible. The organization was divided into three blocks, in which the conditional statements If–Is–Then structured the rules of interaction for the linguistic variables for each aspect of sustainability, classified as follows:
- [If], <0.3 = I, [Is] insufficient;
- [If], ≥0.3 <0.5 = R, [Is] regular;
- [If], ≥0.5 <0.7 = G, [Is] good;
- [If], ≥0.7 <0.9 = VG, [Is] very good; and
- [If], ≥0.9 = E, [Is] excellent.
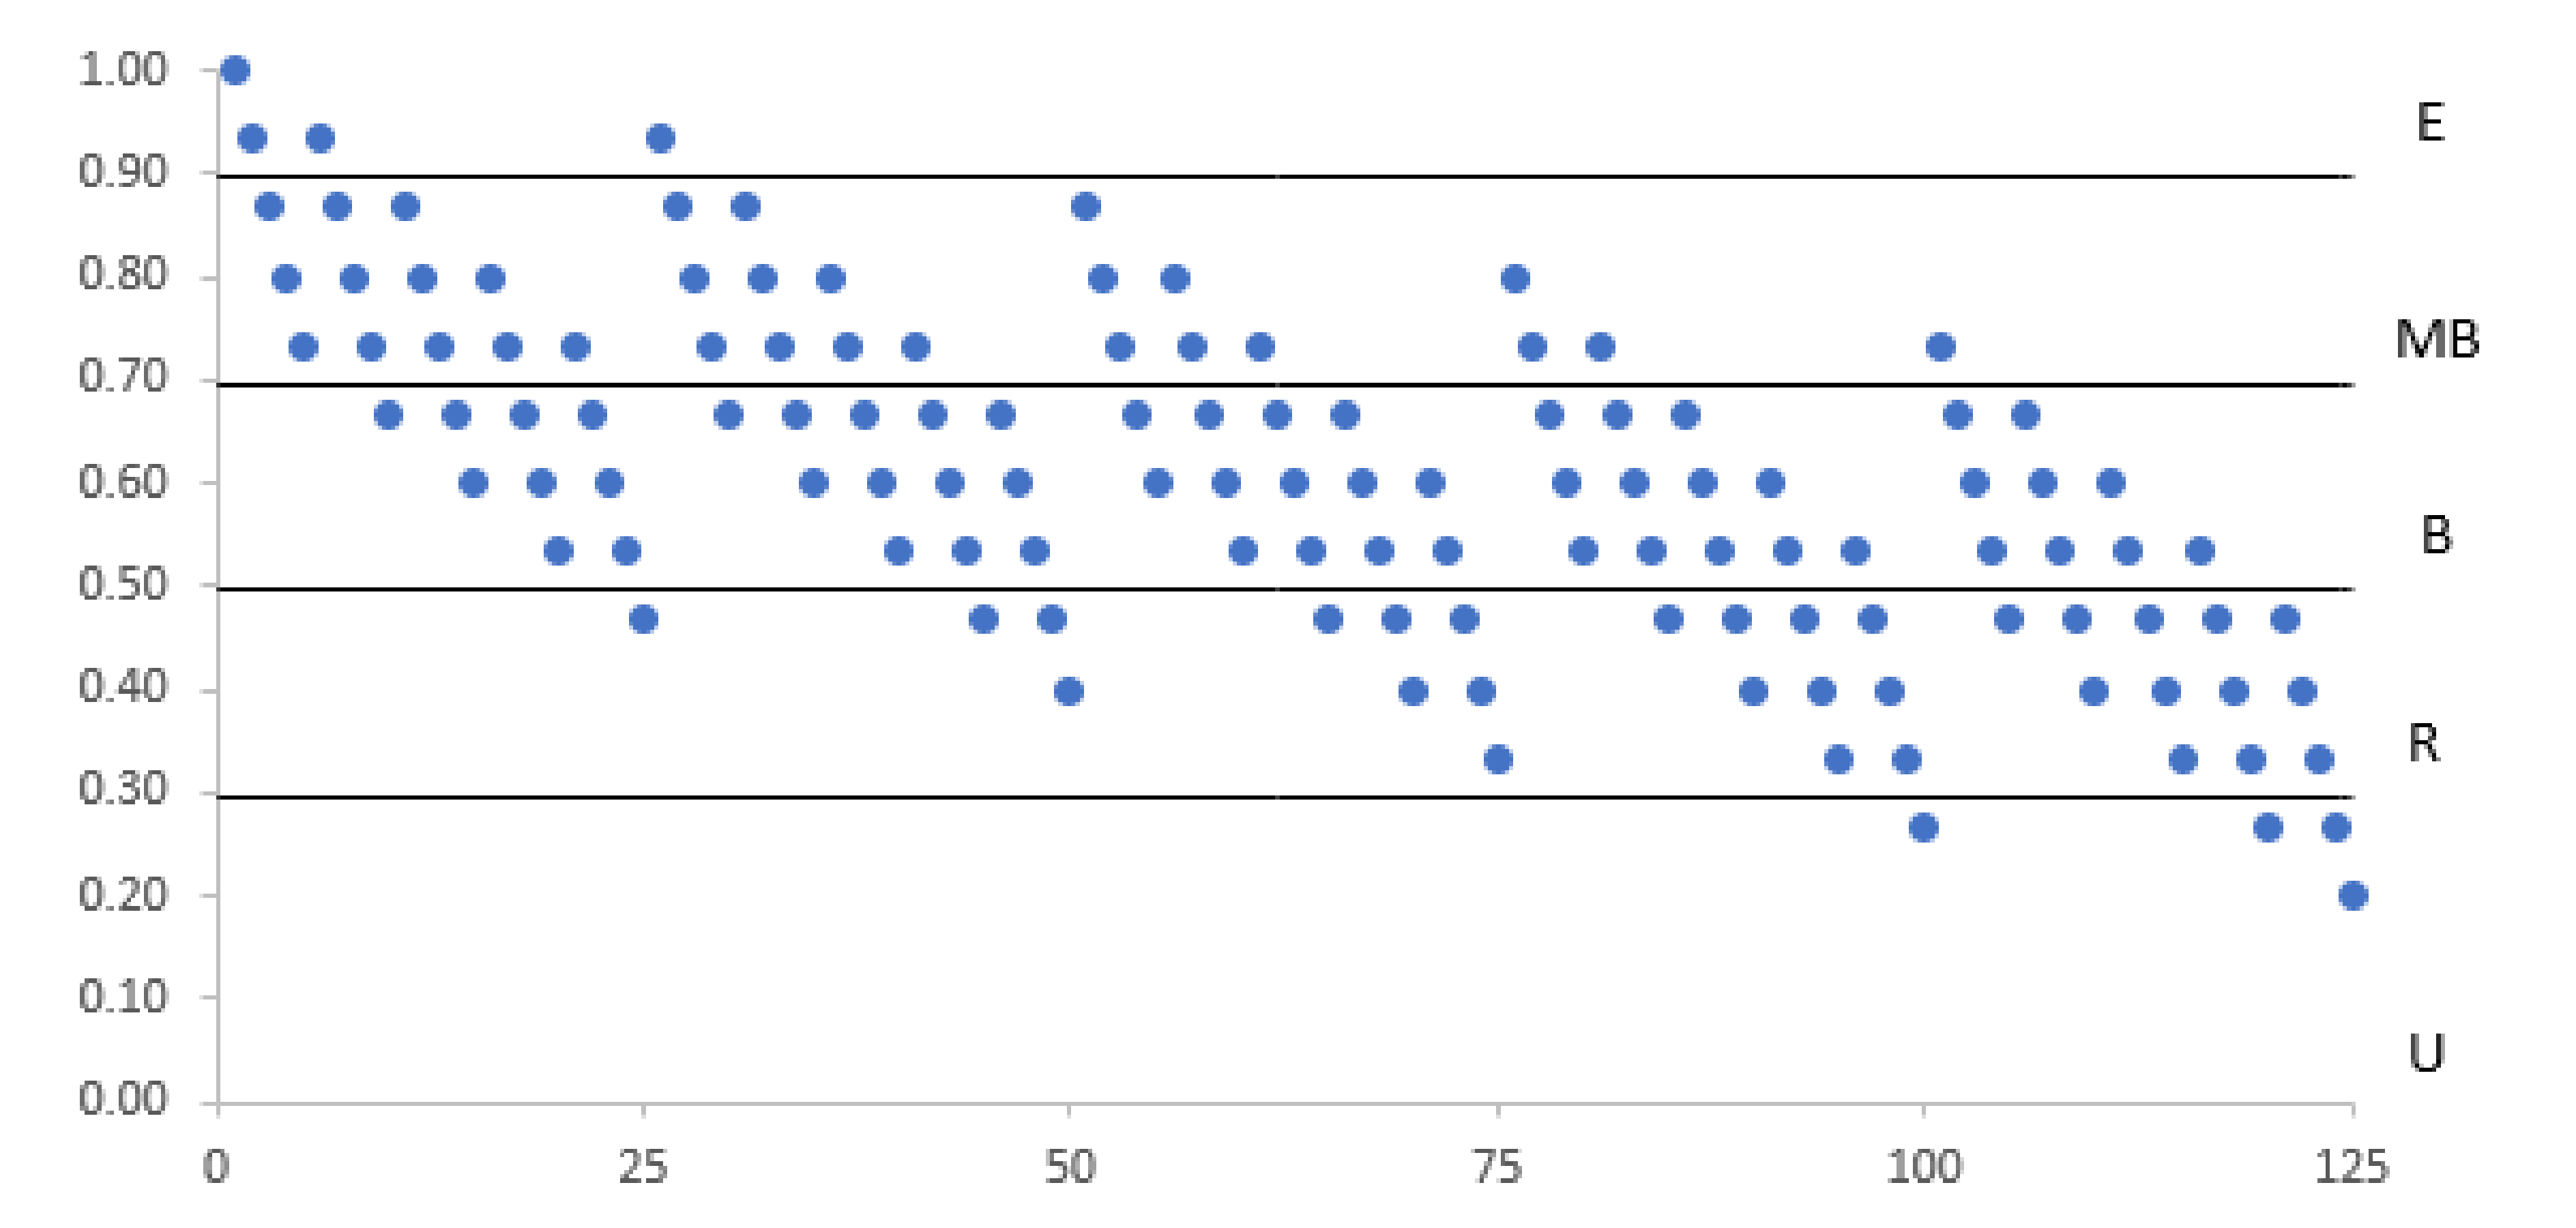
The average among the economic, social, and environmental aspects is the result of the output variables [Then] in each rule. Figure 1 demonstrates the distribution of inference rules for output variables Wi. This procedure occurred linearly as a proposal to balance sustainability aspects, in which the values were ranked by intensity in the interval [0, 1].
In the inference process, operations were carried out for all λi rules through Equation (7), while the output values were fuzzy variables in Equation (8). The output μi(w) is the sum of each μi’(w) result, as presented in Equation (9).
The center of gravity method was used for defuzzification. This value was used as the minimum score for a satisfactory rating (µ-cut). The findings in [50,51] demonstrated a good method for determining the midpoints. Equation (10) presents the transport dimension parameters. To obtain a favorable result, the output variables of the evaluation of sustainable transport (EST) and evaluation of experts (α-cut) for each aspect of sustainability were compared. The EST of auditors must be greater than or equal to the α-cut value of the experts, EST ≥ α-cut, in both cases applying the same questionnaire.
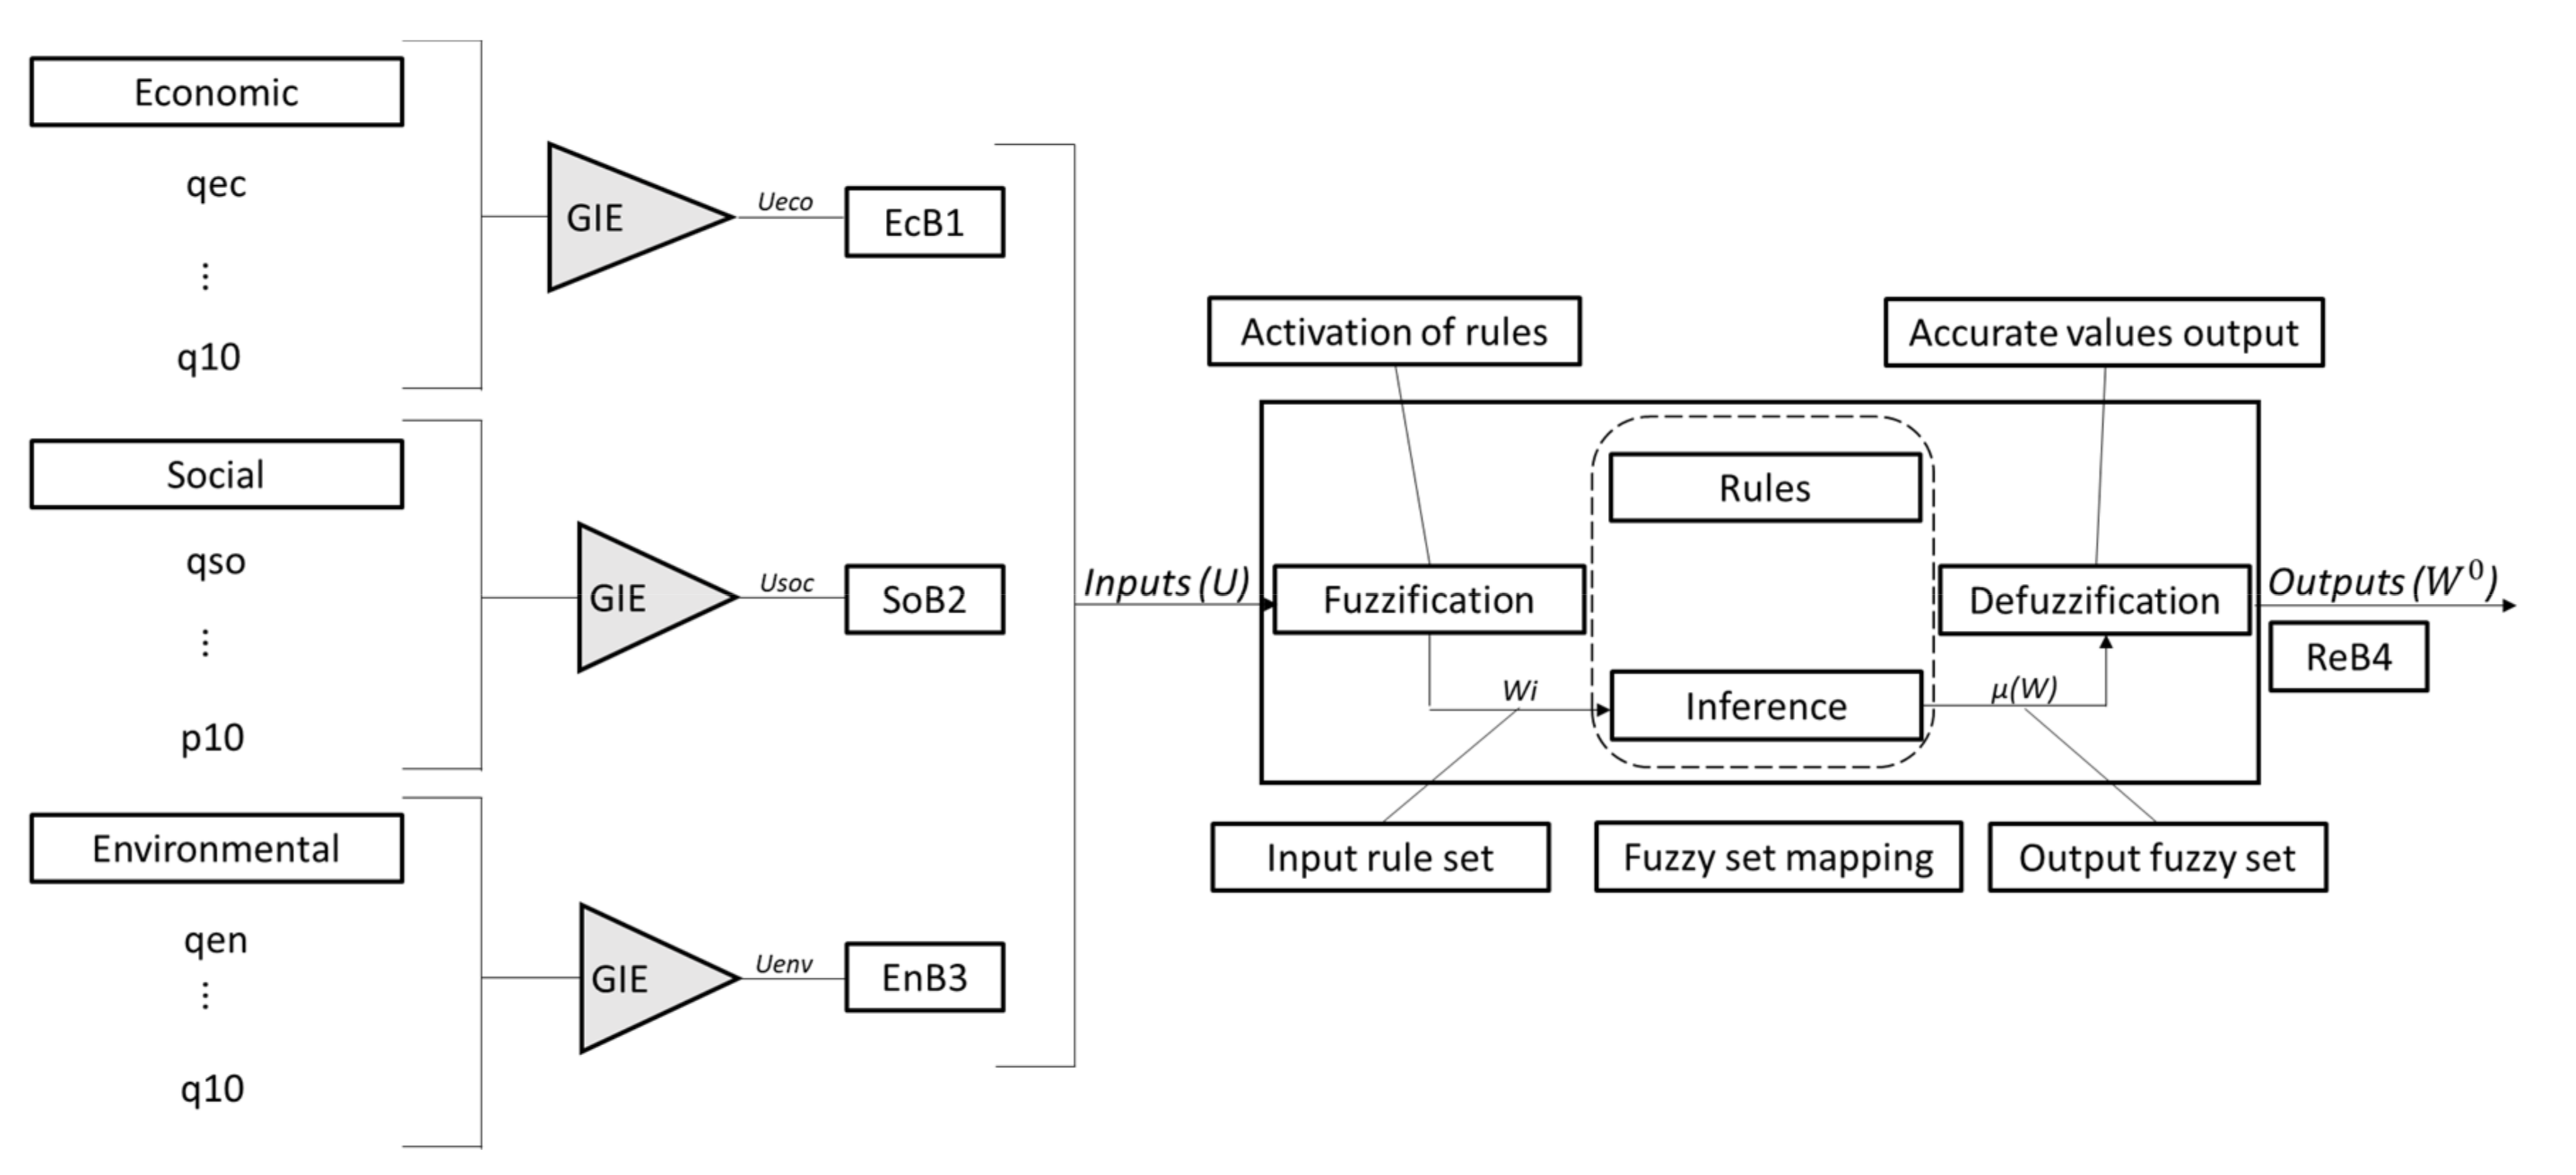
Figure 2 presents the fuzzy architecture to develop the evaluation of sustainability in transport. The alternative method allowed a reduction from 530 to 53, where the changes were composed of three blocks for inference, distributed in 125 rules. EcB1 represents the input variables of the economic aspect, SoB2 denotes the social aspect, and EnB3 the environmental aspect. ReB4 is the result of the defuzzification process in crisp values.
Decision-making is the result of the logical process of the fuzzy set system [52], where the knowledge base is formed by a set of linguistic rules that present the conclusions defined by the If-Then relationship [53]. The crisp value of the defuzzification process is an accurate result of the specialists’ possibilities for acceptance in sustainable transport.
4. Application and Evaluation
To apply the RS methodological process, six companies were selected in the following areas: beverages (road), airline (air), oil and gas (pipeline), fuel distribution (shipper), mining (rail), and bulk transport (waterway). All evaluated companies have a program to reduce emissions of gases and waste materials and/or eco-driving training.
Results and Discussion
The questionnaire applied to the experts obtained as output variables WECO = 3.96, WSOC = 3.77, and WENV = 3.89, for an α-cut of 6.27. This result showed the degree of membership or compliance with at least 68% of the requirements for RS approval, demonstrated in Figure 3. The survey included the participation of six members from the railway sector, five from the pipeline sector, five from the roadway sector, four from the airline sector, four from the waterway sector, two retail companies, and five researchers. Cronbach’s alpha was 0.929, showing high correlation and intensity of the results, demonstrating the alignment regarding the importance of sustainability in transport. Figure 4 presents the comparison of EST with α-cut per transport activity.
EST4 (fuel distributor—shipper) performed lower than α-cut, being classified as unsatisfactory, since the degree of membership requires a rating of at least regular. The others presented satisfactory results, ranging from very good to excellent. EST1 (beverages—road) had a strong position with very good rating but presented low to excellent possibilities. The company EST2 (airline—air) reached a high level of demand, with a strong tendency towards excellence. EST3 (oil and gas—pipeline) presented a strong rating (very good), without presenting a growth trend. EST5 (mining company—rail) had a tendency towards excellence, but still with strong participation in the very good rating. EST6 (bulk transport—waterway) presented a consolidated position in the very good rating, with the beginning of a trend towards excellence. The evaluation was satisfactory because independent of the economic sector, the companies demonstrated that they could apply the triple bottom line method to transport activities.
The fuzzy logic allows companies to be evaluated, visualizing the possibilities of evolution of the procedures performed. The purpose of the data diagnosis is to observe the transition of change among the elements of the universe of discourse, in which the comparison of periods demonstrates a concern with the improvement of the suggested good practices. The degree of membership function indicates the possibilities of satisfying the minimum requirements for approval in the transport dimension. An α-cut above 6.27 is a requirement of the experts. This calculation proceeds with the need to analyze the aspects of sustainability in a single function. Although the positive result of one aspect may skew the negative result of others, there is still a need for management to carry out the procedures of the three aspects. To achieve the requirements of sustainable transport, it is necessary to develop the economic, social, and environmental aspects together instead of separately.
According to [31], the price variable has strong influence in decision-making. If companies do not invest in social and environmental activities relevant to their business, they will rarely obtain certification. This is due to the interaction of the data in a single evaluation score. The approval of the on-site procedures by the auditors allowed a balance to be found between external demands and the minimum internal requirements for certification.
Table 2 presents the consolidated data classified in quartiles, with a minimum score of 6.27 for certification. The first was classified as bronze with a score between 6.27 and 7.20; the second, silver, between 7.21 and 8.14; the third, gold, between 8.15 and 9.07; and the fourth, platinum, between 9.08 and 10.
C2 and C5 were ranked as gold, reflecting the consolidation of the proper application of good practices. C1 and C6 were classified as silver, in the development phase of the procedures. C3 was classified as bronze, in the early stages of change. C4 was not adequate in the transport dimension since it obtained unsatisfactory scores for recognition. None of the companies were eligible for platinum since the auditors did not find procedures for the prevention of accidents or contamination of the biosphere by vehicles.
C4 was identified as a shipper engaged in the retail fuel distribution, which holds a large share in the Brazilian market. The evaluation of its sustainable transport activities did not obtain sufficient scores for classification. The results showed difficulties in managing the vehicle fleet. In general, companies prefer to outsource this service, concentrating their activities on the core business due to the complexity of cargo handling activities requiring a lot of effort in resource management [54,55,56,57]. C4 has a zero-carbon program for all company activities, with carbon credits as the main reason, but its transport activities did not perform well. There was an increase of 18.34% in CO2 emissions, 1.2% in water consumption, and 7.21% in solid waste.
The companies C2 and C5 belong to the airline and ore transport sectors, respectively. Both obtained the gold rating. C2, through its fuel efficiency program, was able to reduce the consumption of aviation kerosene per ton-kilometer flown by 1.2%, resulting in a reduction of 298,184 tons of CO2 emissions. About 83% of the waste generated was recycled; the rest was incinerated. C5 has open rail cars protected by tarps to prevent spillage of cargo, although the auditors identified problems with ore dust pollution in the community near the warehouse and in the sea. The company has a program to replace diesel with electric vehicles for the purpose of reducing the company’s carbon emissions by 33% over the next 10 years. In the first phase, 50 electric autonomous trucks with the capacity to haul 240 tons were purchased, where weight and speed are controlled by artificial intelligence, through a system to minimize emissions, to reduce CO2 emissions by 1500 tons. The next phase of the project will be the electrification of part of the 2000-km stretch of the railway. As the terminals are being integrated without the need for cargo transshipment, the transfer process will take place by switching the rail cars to different locomotives.
Companies C1 and C6 belong to the beverage and waterway sectors, respectively. Both obtained the silver rating. C1 developed a program of clean transport that reused 1.8 million liters for vehicle washing, and 50% of the waste lubricating oils were transformed into alternative fuel, reducing emissions by 141,000 tons of CO2. The efficiency in mobile energy consumption was 10.47%, reduced from 83.25 to 74.53 km/GJ. C6 is responsible for carrying a large volume of goods over long distances, which increases energy efficiency, allowing less CO2 emissions per ton. The replacement by larger-capacity trucks and the replanning of routes, as well as the redirection of part of the load to rail, waterways, and pipelines, allowed the reduction of 174 million liters of fuel or emissions of 464,000 tons of CO2.
Company C3 obtained a bronze rating. It is engaged in the transport of fuels through pipelines, largely underground, which causes low environmental damage, allowing the reforestation of damaged areas. Sustainability actions allowed the reduction of 108 million liters of fuel and 286,000 tons of CO2. The result was achieved in the implementation of pipelines at airports, consuming 30% less fuel to supply aircraft, as well as the redirection at the national level of transport by tank trucks to the pipelines, involving about 9.2 million cubic meters of fuel.
The results demonstrated the importance of evaluation with a focus on aspects of sustainability in transport. Community pressure is not limited solely to production. Since emissions from the supply chain negatively affect the quality of life, the procedure will increase competitiveness among them and signal a hierarchy of companies that have the best programs for sustainable transport.
5. Conclusions and Recommendations
The interest in the development of sustainable practices in freight transport has been due to external pressures and the large participation of transport in carbon emissions and air pollutants. The application of good practices in sustainability obtained positive effects on transport operations. The participation of external experts avoided distortions in the decisions to invest in one aspect to the detriment of another. The α-cut as a single score for the approval of the recognition system, provided by specialists, strengthened the development of improvements in all aspects of sustainability, since the achievement of a positive result required the improvement of transport operations. The inclusion of external sustainability experts in the evaluation process reduced the pressure of competitors, being considered feedback for companies to change the organizational design to the real needs of the community.
The importance of this work was to develop an application process considering the economic, social, and environmental aspects. The tradeoff evidenced between the economic and environmental changes did not allow a wide-ranging discussion of social issues observed in transport activities. The balance in the use of external and internal forces in the evaluation allowed companies to better satisfy the aspiration of consumers by solving problems in freight transport operations.
The result of the application of the recognition system evaluation process was satisfactory. The data demonstrated a greater balance in the distribution of information and amplitude with the use of the triple bottom line, strengthening the companies in the transition to green transport. Of the six companies analyzed, five obtained the recognition of sustainable transport. Those with core business in freight transport showed greater engagement for organizational changes because the competitiveness and strong pressure from customers are accelerating the transition to low carbon transport. The shipper from the fuel retail sector did not obtain recognition, but transport activity was not its core business, so it had difficulty in applying good practices in sustainable transport and scored below the minimum required by the experts.
The results suggest for future studies the development of procedures to identify barriers that hinder the monitoring of companies’ efforts to reduce carbon emissions, and how this transition process affects carriers and shippers in different ways.
Author Contributions
Conceptualization, M.d.A.D. and L.G.M.; supervision, M.d.A.D.; formal analysis, methodology, and writing—original draft, R.R.d.F. All authors have read and agreed to the published version of the manuscript.
Funding
This research received no external funding.
Institutional Review Board Statement
Not applicable.
Informed Consent Statement
Not applicable.
Data Availability Statement
Not applicable.
Conflicts of Interest
The authors declare no conflict of interest.
Appendix A. Responses on a Five-Point Likert Scale of Experts (Five More Intense and One Less Intense)
| Aspects | Questions to Experts | Responds from Experts | ||||||||||||||||||||||||||||||
|---|---|---|---|---|---|---|---|---|---|---|---|---|---|---|---|---|---|---|---|---|---|---|---|---|---|---|---|---|---|---|---|---|
| 1 | 2 | 3 | 4 | 5 | 6 | 7 | 8 | 9 | 10 | 11 | 12 | 13 | 14 | 15 | 16 | 17 | 18 | 19 | 20 | 21 | 22 | 23 | 24 | 25 | 26 | 27 | 28 | 29 | 30 | 31 | ||
| Economic | 1. Acquisition cost (investment in fixed capital goods) | 3 | 3 | 4 | 5 | 4 | 3 | 4 | 3 | 5 | 5 | 4 | 5 | 5 | 5 | 3 | 5 | 5 | 4 | 4 | 4 | 4 | 5 | 3 | 4 | 5 | 4 | 5 | 4 | 5 | 4 | 5 |
| 2. Building cost (cost of investment in terminals, yards, and others) | 4 | 3 | 3 | 4 | 4 | 3 | 4 | 4 | 5 | 4 | 4 | 5 | 5 | 5 | 4 | 4 | 5 | 3 | 4 | 4 | 4 | 5 | 5 | 4 | 5 | 4 | 2 | 2 | 4 | 4 | 5 | |
| 3. Cost of equipment, maintenance, and material (tires, parts) | 4 | 4 | 4 | 4 | 3 | 3 | 5 | 3 | 5 | 4 | 5 | 5 | 5 | 5 | 5 | 5 | 4 | 4 | 5 | 4 | 3 | 5 | 5 | 5 | 5 | 3 | 5 | 3 | 5 | 5 | 5 | |
| 4. Personnel cost (salaries and charges) | 4 | 3 | 5 | 4 | 4 | 4 | 5 | 3 | 5 | 4 | 4 | 5 | 5 | 5 | 4 | 3 | 4 | 4 | 4 | 5 | 4 | 5 | 5 | 5 | 5 | 4 | 3 | 2 | 4 | 3 | 5 | |
| 5. Cost of fuel, lubricants, and energy | 5 | 5 | 3 | 5 | 4 | 3 | 5 | 4 | 5 | 5 | 5 | 5 | 5 | 5 | 3 | 5 | 5 | 4 | 4 | 5 | 3 | 5 | 5 | 5 | 3 | 4 | 4 | 1 | 5 | 4 | 4 | |
| 6. Operating cost (water, electricity, and other fees) | 4 | 5 | 2 | 5 | 2 | 2 | 5 | 2 | 5 | 4 | 5 | 5 | 3 | 5 | 3 | 1 | 5 | 3 | 4 | 2 | 3 | 4 | 3 | 3 | 4 | 3 | 3 | 1 | 4 | 4 | 3 | |
| 7. Financial balance between the economic, social, and environmental aspects | 5 | 2 | 5 | 4 | 4 | 5 | 4 | 5 | 5 | 4 | 5 | 5 | 3 | 5 | 5 | 4 | 5 | 4 | 5 | 3 | 4 | 4 | 5 | 5 | 4 | 4 | 3 | 2 | 4 | 4 | 5 | |
| 8. Cost of capital (depreciation, equipment, opportunity cost of capital) | 3 | 2 | 5 | 4 | 3 | 3 | 4 | 3 | 5 | 4 | 4 | 5 | 3 | 5 | 5 | 4 | 3 | 3 | 5 | 4 | 4 | 4 | 3 | 4 | 5 | 3 | 3 | 4 | 3 | 3 | 4 | |
| 9. Expenses with damages (fines, accidents, losses, and others) | 5 | 5 | 2 | 5 | 2 | 2 | 3 | 2 | 5 | 4 | 4 | 4 | 2 | 4 | 2 | 4 | 3 | 3 | 5 | 2 | 3 | 4 | 4 | 5 | 4 | 4 | 2 | 2 | 3 | 2 | 3 | |
| 10. Impact of logistics costs | 4 | 5 | 4 | 4 | 1 | 3 | 4 | 4 | 5 | 4 | 4 | 4 | 5 | 4 | 5 | 5 | 5 | 4 | 5 | 3 | 3 | 4 | 4 | 4 | 4 | 3 | 3 | 5 | 4 | 4 | 5 | |
| Social | 1. Accessibility of public transport | 4 | 4 | 4 | 4 | 2 | 4 | 4 | 3 | 4 | 4 | 4 | 3 | 2 | 5 | 4 | 4 | 3 | 3 | 5 | 4 | 4 | 3 | 1 | 5 | 4 | 4 | 4 | 1 | 5 | 4 | 5 |
| 2. Accessibility of bike racks | 4 | 3 | 2 | 2 | 1 | 4 | 3 | 2 | 5 | 4 | 4 | 1 | 2 | 3 | 2 | 2 | 3 | 2 | 5 | 3 | 4 | 3 | 1 | 3 | 4 | 3 | 1 | 1 | 4 | 3 | 4 | |
| 3. Suitable place for disposal of materials, including recyclables | 5 | 5 | 5 | 3 | 2 | 2 | 3 | 3 | 5 | 4 | 3 | 3 | 5 | 5 | 5 | 4 | 4 | 2 | 5 | 4 | 5 | 3 | 2 | 5 | 4 | 5 | 5 | 5 | 4 | 4 | 5 | |
| 4. Integration and coexistence in the work environment | 5 | 5 | 5 | 3 | 2 | 4 | 3 | 4 | 5 | 3 | 4 | 4 | 5 | 5 | 5 | 3 | 3 | 3 | 5 | 4 | 5 | 4 | 3 | 5 | 4 | 4 | 5 | 4 | 4 | 4 | 5 | |
| 5. Community integration program | 5 | 5 | 5 | 3 | 1 | 4 | 3 | 3 | 5 | 3 | 4 | 3 | 5 | 5 | 5 | 4 | 3 | 3 | 5 | 3 | 5 | 3 | 4 | 5 | 2 | 4 | 3 | 5 | 4 | 3 | 5 | |
| 6. Reducing the impact of buildings’ life cycle | 1 | 5 | 3 | 4 | 3 | 2 | 3 | 2 | 5 | 3 | 4 | 3 | 3 | 4 | 3 | 1 | 4 | 3 | 5 | 3 | 4 | 3 | 1 | 3 | 3 | 3 | 3 | 2 | 3 | 3 | 4 | |
| 7. Health plan and safety training | 5 | 5 | 5 | 4 | 4 | 2 | 3 | 3 | 5 | 3 | 2 | 3 | 5 | 5 | 5 | 4 | 5 | 3 | 5 | 4 | 4 | 5 | 4 | 5 | 3 | 4 | 5 | 5 | 4 | 4 | 3 | |
| 8. Compensation and social security program | 5 | 5 | 3 | 4 | 3 | 3 | 3 | 3 | 5 | 3 | 4 | 3 | 5 | 5 | 3 | 3 | 3 | 4 | 5 | 4 | 4 | 4 | 4 | 5 | 3 | 4 | 5 | 5 | 5 | 5 | 3 | |
| 9. Development of leadership, friendship, gender, and race diversity | 5 | 5 | 5 | 4 | 3 | 3 | 3 | 4 | 5 | 3 | 5 | 3 | 5 | 5 | 3 | 5 | 4 | 2 | 5 | 4 | 4 | 4 | 5 | 5 | 3 | 5 | 4 | 5 | 5 | 4 | 5 | |
| 10. Training in compliance policies and procedures | 5 | 5 | 5 | 5 | 3 | 4 | 3 | 2 | 5 | 4 | 5 | 3 | 5 | 5 | 5 | 5 | 3 | 2 | 5 | 5 | 4 | 4 | 4 | 5 | 4 | 5 | 5 | 5 | 5 | 3 | 4 | |
| Environmental | 1. Energy efficiency (electricity, fuel, and others) | 5 | 4 | 5 | 4 | 2 | 4 | 3 | 3 | 5 | 3 | 5 | 3 | 5 | 5 | 5 | 5 | 4 | 5 | 5 | 4 | 5 | 5 | 4 | 5 | 4 | 5 | 4 | 2 | 5 | 4 | 5 |
| 2. Greenhouse gas (GHG) reduction program | 4 | 3 | 5 | 3 | 1 | 3 | 3 | 2 | 5 | 3 | 5 | 3 | 3 | 5 | 4 | 2 | 2 | 3 | 5 | 5 | 5 | 5 | 3 | 5 | 4 | 4 | 5 | 4 | 5 | 4 | 4 | |
| 3. Use of consumables in transport | 4 | 4 | 4 | 5 | 1 | 3 | 3 | 3 | 5 | 4 | 5 | 3 | 5 | 5 | 5 | 2 | 2 | 3 | 5 | 4 | 5 | 5 | 3 | 5 | 4 | 5 | 5 | 4 | 5 | 4 | 4 | |
| 4. Control of air pollutants | 4 | 4 | 5 | 2 | 1 | 4 | 3 | 2 | 5 | 4 | 5 | 3 | 3 | 4 | 5 | 3 | 3 | 4 | 5 | 4 | 5 | 5 | 2 | 5 | 4 | 4 | 5 | 4 | 5 | 4 | 5 | |
| 5. Conscientious water consumption | 4 | 4 | 4 | 4 | 3 | 3 | 3 | 3 | 5 | 4 | 5 | 3 | 3 | 5 | 5 | 3 | 2 | 3 | 5 | 3 | 4 | 5 | 4 | 5 | 4 | 3 | 5 | 4 | 5 | 3 | 5 | |
| 6. Control of liquid and solid effluents | 5 | 5 | 3 | 5 | 2 | 4 | 3 | 3 | 5 | 4 | 5 | 3 | 4 | 5 | 5 | 5 | 4 | 4 | 5 | 4 | 4 | 5 | 5 | 5 | 4 | 5 | 5 | 5 | 4 | 5 | 5 | |
| 7. Control of noise generation | 2 | 5 | 3 | 5 | 2 | 4 | 3 | 2 | 5 | 4 | 5 | 3 | 4 | 5 | 5 | 3 | 5 | 4 | 5 | 4 | 4 | 4 | 2 | 5 | 4 | 3 | 5 | 4 | 5 | 5 | 4 | |
| 8. Procedure to reduce particulate matter (PM) | 3 | 4 | 5 | 4 | 2 | 3 | 3 | 2 | 5 | 3 | 5 | 3 | 3 | 5 | 5 | 2 | 4 | 3 | 5 | 4 | 4 | 4 | 2 | 5 | 4 | 3 | 5 | 1 | 5 | 5 | 4 | |
| 9. Training (eco-driving and others) | 5 | 5 | 5 | 5 | 2 | 4 | 3 | 2 | 5 | 4 | 5 | 3 | 4 | 5 | 3 | 3 | 2 | 2 | 5 | 5 | 5 | 3 | 1 | 4 | 4 | 4 | 4 | 1 | 4 | 4 | 5 | |
| 10. Awareness of biotic interference | 5 | 5 | 5 | 4 | 3 | 2 | 3 | 2 | 5 | 3 | 5 | 3 | 3 | 5 | 4 | 2 | 2 | 2 | 5 | 4 | 5 | 5 | 1 | 5 | 5 | 5 | 4 | 5 | 4 | 4 | 4 | |
Appendix B. Rating of Experts by Position and Level
| Experts | Position in the Company or Experience | Level | ∑ | GIEi |
| 1 | 5 | 3 | 8 | 0.040201 |
| 2 | 1 | 3 | 4 | 0.020101 |
| 3 | 5 | 3 | 8 | 0.040201 |
| 4 | 3 | 2 | 5 | 0.025126 |
| 5 | 5 | 5 | 10 | 0.050251 |
| 6 | 4 | 4 | 8 | 0.040201 |
| 7 | 5 | 5 | 10 | 0.050251 |
| 8 | 3 | 5 | 8 | 0.040201 |
| 9 | 1 | 2 | 3 | 0.015075 |
| 10 | 3 | 3 | 6 | 0.030151 |
| 11 | 4 | 5 | 9 | 0.045226 |
| 12 | 1 | 2 | 3 | 0.015075 |
| 13 | 5 | 4 | 9 | 0.045226 |
| 14 | 4 | 3 | 7 | 0.035176 |
| 15 | 5 | 2 | 7 | 0.035176 |
| 16 | 3 | 3 | 6 | 0.030151 |
| 17 | 1 | 4 | 5 | 0.025126 |
| 18 | 3 | 3 | 6 | 0.030151 |
| 19 | 4 | 3 | 7 | 0.035176 |
| 20 | 4 | 3 | 7 | 0.035176 |
| 21 | 1 | 2 | 3 | 0.015075 |
| 22 | 1 | 2 | 3 | 0.015075 |
| 23 | 3 | 3 | 6 | 0.030151 |
| 24 | 3 | 3 | 6 | 0.030151 |
| 25 | 4 | 2 | 6 | 0.030151 |
| 26 | 3 | 3 | 6 | 0.030151 |
| 27 | 2 | 3 | 5 | 0.025126 |
| 28 | 3 | 2 | 5 | 0.025126 |
| 29 | 5 | 4 | 9 | 0.045226 |
| 30 | 3 | 4 | 7 | 0.035176 |
| 31 | 3 | 4 | 7 | 0.035176 |
| Total | 199 | 1 |
References
- Shankar, R.; Choudhary, D.; Jharkharia, S. An integrated risk assessment model: A case of sustainable freight transportation systems. Transp. Res. Part D 2018, 63, 662–676. [Google Scholar] [CrossRef]
- Stank, T.P.; Goldsby, T.J. A framework for transportation decision making in an integrated supply chain. Supply Chain Manag. Int. J. 2000, 5, 71–78. [Google Scholar] [CrossRef]
- Griffiths, K.; Boyle, C.; Henning, T.F.P. Beyond the Certification Badge—How Infrastructure Sustainability Rating Tools Impact on Individual, Organizational, and Industry Practice. Sustainability 2018, 10, 1038. [Google Scholar] [CrossRef] [Green Version]
- Chappin, M.M.H.; Cambre, B.; Vermeulen, P.M.A.; Lozano, R. Internalizing sustainable practices: A configurational ap-proach on sustainable forest management of the Dutch wood trade and timber industry. J. Clean. Prod. 2015, 107, 760–774. [Google Scholar] [CrossRef]
- Rex, E.; Baumann, H. Beyond ecolabels: What green marketing can learn from conventional marketing. J. Clean. Prod. 2007, 15, 567–576. [Google Scholar] [CrossRef] [Green Version]
- Crosson, C. Shades of Green: Modifying Sustainability Rating Systems for Transit Center Functionality. Transp. Res. Rec. J. Transp. Res. Board 2017, 2638, 88–96. [Google Scholar] [CrossRef]
- Wiengarten, F.; Pagell, M.; Fynes, B. ISO 14000 certification and investments in environmental supply chain management practices: Identifying differences in motivation and adoption levels between Western European and North American companies. J. Clean. Prod. 2013, 56, 18–28. [Google Scholar] [CrossRef]
- Anderson, L.; Chase, L.; Kestenbaum, D.; Mastrangelo, C. Ecolabels for Passenger Transportation: Understanding Motorcoach Company Receptiveness to a Pilot Green Certification Program. Int. J. Sustain. Transp. 2013, 7, 125–142. [Google Scholar] [CrossRef]
- International Energy Agency (IEA). Energy Technology Perspectives 2020; IEA: Paris, France, 2020. [Google Scholar]
- Ibarra-Espinosa, S.; Ynoue, R.Y.; Ropkins, K.; Zhang, X.; de Freitas, E.D. High spatial and temporal resolution vehicular emissions in south-east Brazil with traffic data from real-time GPS and travel demand models. Atmospheric Environ. 2020, 222, 117136. [Google Scholar] [CrossRef]
- Bové, A.; Swartz, S. Starting at the Source: Sustainability in Supply Chains; McKinsey & Company: Los Angeles, CA, USA, 2016. [Google Scholar]
- Ferreira, A.L.; Tsai, D.S.; Silva, F.B.; Cremer, M.S.; Soares, M.Y. Emissões dos Setores de Energia, Processos Industriais e Uso de Produtos—SEEG; Instituto de Energia e Meio Ambiente—IEMA: Sao Paulo, Brazil, 2017. [Google Scholar]
- De la Torre, R.; Corlu, C.; Faulin, J.; Onggo, B.; Juan, A. Simulation, Optimization, and Machine Learning in Sustainable Transportation Systems: Models and Applications. Sustainability 2021, 13, 1551. [Google Scholar] [CrossRef]
- Cartenì, A.; Cascetta, F.; Campana, S. Underground and ground-level particulate matter concentrations in an Italian metro system. Atmos. Environ. 2015, 101, 328–337. [Google Scholar] [CrossRef]
- Martins, V.; Moreno, T.; Mendes l Konstantinos, E.; Diapouli, E.; Alves Minguillón, M.C. Factors controlling air quality in different European subway systems. Environ. Res. 2016, 146, 35–46. [Google Scholar] [CrossRef] [PubMed] [Green Version]
- Leiringer, R. Sustainable Construction through Industry Self-Regulation: The Development and Role of Building Environmental Assessment Methods in Achieving Green Building. Sustainability 2020, 12, 8853. [Google Scholar] [CrossRef]
- Gallastegui, I.G. The use of eco-labels: A review of the literature. Eur. Environ. 2002, 12, 316–331. [Google Scholar] [CrossRef]
- Hale, M. Ecolabelling and cleaner production: Principles, problems, education and training in relation to the adoption of environmentally sound production processes. J. Clean. Prod. 1996, 4, 85–95. [Google Scholar] [CrossRef]
- Walker, T.R. Green Marine: An environmental program to establish sustainability in marine transportation. Mar. Pollut. Bull. 2016, 105, 199–207. [Google Scholar] [CrossRef]
- Zarghami, E.; Fatourehchi, D.; Karamloo, M. Establishing a region-based rating system for multi-family residential buildings in Iran: A holistic approach to sustainability. Sustain. Cities Soc. 2019, 50, 101631. [Google Scholar] [CrossRef]
- Anderson, L.; Mastrangelo, C.; Chase, L.; Kestenbaum, D.; Kolodinsky, J. Eco-labeling motorcoach operators in the North American travel tour industry: Analyzing the role of tour operators. J. Sustain. Tour. 2013, 21, 750–764. [Google Scholar] [CrossRef]
- Smits, A.; Drabe, V.; Herstatt, C. Beyond motives to adopt: Implementation configurations and implementation extensiveness of a voluntary sustainability standard. J. Clean. Prod. 2020, 251, 119541. [Google Scholar] [CrossRef]
- Jeon, C.M.; Amekudzi, A.A.; Guensler, R.L. Evaluating Plan Alternatives for Transportation System Sustainability: Atlanta Metropolitan Region. Int. J. Sustain. Transp. 2010, 4, 227–247. [Google Scholar] [CrossRef]
- Zhang, W.; Wang, W.; Wang, S. Environmental performance evaluation of implementing EMS (ISO 14001) in the coating industry: Case study of a Shanghai coating firm. J. Clean. Prod. 2014, 64, 205–217. [Google Scholar] [CrossRef]
- Seuring, S.; Muller, M. From a literature review to a conceptual framework for sustainable supply chain management. J. Clean. Prod. 2008, 16, 1699–1710. [Google Scholar] [CrossRef]
- McKinnon, A. Green logistics: The carbon agenda. LogForum 2010, 6, 1–9. [Google Scholar]
- Beske, P. Dynamic capabilities and sustainable supply chain management. Int. J. Phys. Distrib. Logist. Manag. 2012, 42, 372–387. [Google Scholar] [CrossRef]
- Amin, S.H.; Zhang, G. Closed-loop supply chain network configuration by a multi-objective mathematical model. Int. J. Bus. Perform. Supply Chain Model. 2014, 6, 1. [Google Scholar] [CrossRef]
- Alzaman, C. Green supply chain modelling: Literature review. Int. J. Bus. Perform. Supply Chain Model. 2014, 6, 16–39. [Google Scholar] [CrossRef]
- Ma, L.; Wang, L.; Skibniewski, M.J.; Gajda, W. An eco-innovative framework development for sustainable consumption and production in the construction industry. Technol. Econ. Dev. Econ. 2019, 25, 774–801. [Google Scholar] [CrossRef]
- Meulen SJVan der Kindt, M.R.J. Duurzame Logistiek: Met Welke Verladerseisen Worden Logistieke Dienstverleners Geconfronteerd; ING: Amsterdam, The Netherlands, 2010. [Google Scholar]
- Govindan, K.; Azevedo, S.G.; Carvalho, H.; Machado, V. Impact of supply chain management practices on sustainability. J. Clean. Prod. 2014, 85, 212–225. [Google Scholar] [CrossRef]
- Vinodh, S. Assessment of sustainability using multi-grade fuzzy approach. Clean Technol. Environ. Policy 2011, 13, 509–515. [Google Scholar] [CrossRef]
- Fliedner, G. Sustainability: A new lean principle. In Proceedings of the 39th Annual Meeting of the Decision Sciences Institute, Baltimore, MD, USA, 22–25 November 2008; pp. 3321–3326. [Google Scholar]
- Sansalvadora, M.E.; Brotons, J.M. Valuation of the option of abandoning ISO 9001 certification: An empirical study in Spain. Total Qual. Manag. 2014, 26, 1255–1268. [Google Scholar] [CrossRef]
- Islam, S.; Tseng, M.-L.; Karia, N.; Lee, C.-H. Assessing green supply chain practices in Bangladesh using fuzzy importance and performance approach. Resour. Conserv. Recycl. 2018, 131, 134–145. [Google Scholar] [CrossRef]
- Goyal, S.; Routroy, S.; Singhal, A. Analyzing environment sustainability enablers using fuzzy DEMATEL for an Indian steel manufacturing company. J. Eng. Des. Technol. 2019, 17, 300–329. [Google Scholar] [CrossRef]
- Petrova, A.K. Methods and Algorithms of Decision Making Support in the Process of Experts’ Qualification Evaluation for the Completion of Centers of Professional Certification. In Proceedings of the 2017 IEEE II International Conference on Control in Technical Systems (CTS), St. Petersburg, Russia, 25–27 October 2017. [Google Scholar]
- Zadeh, L. Fuzzy sets. Inf. Control. 1965, 8, 338–353. [Google Scholar] [CrossRef] [Green Version]
- Tseng, M.; Tan, K.; Chiu, A.S.F. Identifying the competitive determinants of firms’ green supplychain capabilities under uncertainty. Clean Techn. Environ. Policy 2015, 18, 1247–1262. [Google Scholar] [CrossRef]
- MacGregor, F.; Ramasar, V.; Nicholas, K.A. Problems with Firm-Led Voluntary Sustainability Schemes: The Case of Direct Trade Coffee. Sustainability 2017, 9, 651. [Google Scholar] [CrossRef] [Green Version]
- Kostova, T.; Roth, K. Adoption of an organizational practice by subsidiaries of multinational corporations: Institutional and relational effects. Acad. Manag. J. 2002, 45, 215–233. [Google Scholar] [CrossRef]
- Kraatz, M.S.; Block, E.S. Organizational implications of institutional pluralism. In The Sage Handbook of Organizational Institutionalism; Greenwood, R., Oliver, C., Sahlin, K., Suddaby, R., Eds.; Sage: London, UK, 2008; pp. 243–275. [Google Scholar]
- Nishitani, K. An empirical study of the initial adoption of ISO 14,001 in Japanese manufacturing firms. Ecol. Econ. 2009, 68, 669–679. [Google Scholar] [CrossRef]
- Wu, D. Approaches for Reducing the Computational Cost of Interval Type-2 Fuzzy Logic Systems: Overview and Comparisons. IEEE Trans. Fuzzy Syst. 2012, 21, 80–99. [Google Scholar] [CrossRef]
- Samarakoon, S.M.; Ratnayake, R.M. Minimization of Risk Assessments’ Variability in Technology Qualification Processes. J. Offshore Mech. Arctic Eng. 2017, 139, 021401. [Google Scholar] [CrossRef]
- Grecco, C.H.S.; Vidal, M.C.; Carvalho, P.V.R. Using fuzzy set theory to model resilience in safe-critical organizations. In Proceedings of the 4th International Conference on Applied Human Factors and Ergonomics—AHFE 2012, San Francisco, CA, USA, 21–25 July 2012. [Google Scholar]
- Wang, J.; Sun, Y. The application of multi-level fuzzy comprehensive evaluation method in technical and economic evaluation of distribution network. In Proceedings of the 2010 International Conference on Management and Service Science, Wuhan, China, 24–26 August 2010; pp. 1–4. [Google Scholar]
- Brotons, J.M.; Sansalvador, M.E. A fuzzy model for the valuation of quality management system. Kybernetes 2017, 46, 157–171. [Google Scholar] [CrossRef]
- Yuan, X.-H.; Liu, Z.-L.; Lee, E.S. Center-of-gravity fuzzy systems based on normal fuzzy implications. Comput. Math. Appl. 2011, 61, 2879–2898. [Google Scholar] [CrossRef] [Green Version]
- Li, H. Probability representations of fuzzy systems. Sci. China Ser. F Inf. Sci. 2006, 49, 339–363. [Google Scholar] [CrossRef]
- Nolasco, D.H.S. Arquitetura Fuzzy Hierárquica com Defuzzificação Adicional de Camadas e Aplicações ao Diagnóstico de Qualidade da Energia Elétrica. Ph.D. Thesis, Universidade Federal do Rio Grande do Norte, Natal, Brazil, 2019. [Google Scholar]
- Hong, T.-P.; Lee, C.-Y. Induction of fuzzy rules and membership functions from training examples. Fuzzy Sets Syst. 1996, 84, 33–47. [Google Scholar] [CrossRef]
- Pfohl, H.C.; Wagner, S.; Ries, A.; Berbner, U.; Witte, H. 4th Party Logistics—Chancen und Herausforderungen; Darmstadt Technical University: Darmstadt, Germany, 2014. [Google Scholar]
- Bourlakis, C.; Bourlakis, M. Information technology safeguards, logistics asset specificity and fourth-party logistics network creation in the food retail chain. J. Bus. Ind. Mark. 2005, 20, 88–98. [Google Scholar] [CrossRef]
- Hosie, P.; Sundarakani, B.; Tan, A.W.K.; Koźlak, A. Determinants of fifth party logistics (5PL): Service providers for supply chain management. Int. J. Logist. Syst. Manag. 2012, 13, 287. [Google Scholar] [CrossRef]
- Gattorna, J. Strategic Supply Chain Alignment: Best Practice in Supply Chain Management; Gower Publishing Ltd.: Aldershot, UK, 1998. [Google Scholar]
Figure 1.
Dispersion of inference rules for output variables: ≥0.9 = excellent; ≥0.7, <0.9 = very good; ≥0.5, <0.7 = good; ≥0.3, <0.5 = regular; and <0.3 = insufficient. The linearity of the data represents the balance of the output variables µi(w).
Figure 1.
Dispersion of inference rules for output variables: ≥0.9 = excellent; ≥0.7, <0.9 = very good; ≥0.5, <0.7 = good; ≥0.3, <0.5 = regular; and <0.3 = insufficient. The linearity of the data represents the balance of the output variables µi(w).

Figure 2.
Fuzzy network architecture. qec = questions from the economic group, qso = questions from the social group, qen = questions from the environmental group, GIE = degree of importance of the expert, EcB = economic block, SoB = social block, EnB = environmental block, ReB = result block, w = variables in the fuzzification process, µ(w) = fuzzified variables, w0 = crisp value.

Figure 3.
Fuzzy set results.

Figure 4.
Comparison of the result of the transport dimension between α-cut, assigned by the experts, and the EST companies, assigned by the auditors. µI = insufficient, µR = regular, µG = good, µVG = very good, and µE = excellent.
Figure 4.
Comparison of the result of the transport dimension between α-cut, assigned by the experts, and the EST companies, assigned by the auditors. µI = insufficient, µR = regular, µG = good, µVG = very good, and µE = excellent.


Table 1.
Expert weights by position and level.
| Position in the Company or Experience (p) | Weights |
| Director or researcher with more than 15 years of experience | 5 |
| Manager or researcher with 10 to 15 years of experience | 4 |
| Coordinator, supervisor, or researcher with five to nine years of experience | 3 |
| Analyst or researcher with two to four years of experience | 2 |
| Junior operative or researcher | 1 |
| Level (l) | Weights |
| Doctorate | 5 |
| Master’s degree | 4 |
| Other postgraduate certification | 3 |
| Bachelor’s degree of equivalent | 2 |
| No college degree | 1 |
Table 2.
Rating of recognition system.
| Company (C) | Average Sustainability Aspects (Max. of 5) | EST | Rating | ||
|---|---|---|---|---|---|
| Economic | Social | Environmental | |||
| C1 | 4.4 | 3.6 | 4.1 | 7.36 | Silver |
| C2 | 4.8 | 4.7 | 4.9 | 9.05 | Gold |
| C3 | 3.9 | 4.0 | 4.6 | 7.00 | Bronze |
| C4 | 3.6 | 2.7 | 3.3 | 4.58 | Unsatisfactory |
| C5 | 4.4 | 4.6 | 4.9 | 8.54 | Gold |
| C6 | 4.4 | 4.3 | 4.5 | 8.14 | Silver |
Note: the EST rating is divided into bronze (between 6.27 and 7.20), silver (between 7.21 and 8.14), gold (between 8.15 and 9.07), and platinum (between 9.08 and 10).
Publisher’s Note: MDPI stays neutral with regard to jurisdictional claims in published maps and institutional affiliations. |
© 2021 by the authors. Licensee MDPI, Basel, Switzerland. This article is an open access article distributed under the terms and conditions of the Creative Commons Attribution (CC BY) license (https://creativecommons.org/licenses/by/4.0/).
Share and Cite
MDPI and ACS Style
Freitas, R.R.d.; D’Agosto, M.d.A.; Marujo, L.G. Methodological Proposal for Recognition Systems in Sustainable Freight Transport. Sustainability 2021, 13, 7511. https://0-doi-org.brum.beds.ac.uk/10.3390/su13137511
AMA Style
Freitas RRd, D’Agosto MdA, Marujo LG. Methodological Proposal for Recognition Systems in Sustainable Freight Transport. Sustainability. 2021; 13(13):7511. https://0-doi-org.brum.beds.ac.uk/10.3390/su13137511
Chicago/Turabian StyleFreitas, Rodrigo Rodrigues de, Márcio de Almeida D’Agosto, and Lino Guimarães Marujo. 2021. "Methodological Proposal for Recognition Systems in Sustainable Freight Transport" Sustainability 13, no. 13: 7511. https://0-doi-org.brum.beds.ac.uk/10.3390/su13137511
Note that from the first issue of 2016, this journal uses article numbers instead of page numbers. See further details here.