
Empowering a Sustainable City Using Self-Assessment of Environmental Performance on EcoCitOpia Platform


1
Research Unit for Energy, Economic and Ecological Management, Science and Technology Research Institute, Chiang Mai University, Chiang Mai 50200, Thailand
2
The Joint Graduate School of Energy and Environment (JGSEE), King Mongkut’s University of Technology Thonburi, Bangkok 10140, Thailand
3
Center of Excellence on Energy Technology and Environment, PERDO, Ministry of Higher Education, Science, Research and Innovation, Bangkok 10140, Thailand
4
Department of Industrial Engineering, Faculty of Engineering, Chiang Mai University, Chiang Mai 50200, Thailand
5
Excellence Center in Logistics and Supply Chain Management, Chiang Mai University, Chiang Mai 50200, Thailand
*
Author to whom correspondence should be addressed.
Sustainability 2021, 13(14), 7743; https://0-doi-org.brum.beds.ac.uk/10.3390/su13147743
Submission received: 15 June 2021
/
Revised: 6 July 2021
/
Accepted: 7 July 2021
/
Published: 12 July 2021
(This article belongs to the Special Issue Reviews and Perspectives on Smart and Sustainable Metropolitan and Regional Cities)
Abstract
:In Thailand, many municipalities lack the information to guide decision-making for improving environmental performance. They need tools to systematize the collection and analysis of data, and then to self-assess environmental performance to increase efficiency in environmental management toward a sustainable city. The aim of this study is to develop a platform for self-assessment of an environmental performance index. Nonthaburi municipality, Hat Yai municipality, and Yasothon municipality were selected to study the work context for six indicators, viz., energy, greenhouse gas, water, air, waste, and green area, which were important environmental problems. The development of an online system called “EcoCitOpia” divides municipality assessment into four parts: data collection, database creation, data analysis, and data display. The municipality can use the system for the assessment of environmental performance and the creation of a separate database based on indicators. The system can analyze the results and display them in the form of radar graphs, line graphs, and tables for use in public communication that will lead to cooperation in solving environmental problems at the policy level for urban development to meet the Sustainable Development Goals.
1. Introduction
The current environment crisis, whether it is climate change, lack of production resources, waste crisis, lack of clean water, and air pollution, affects the world population in terms of living and health. The impacts are not limited to one country but affect the whole world. One of the causes of the current environmental crisis is the relentless economic growth as a result of the exponential increase in the world population. The United Nations stated that by 2050, 68% of the earth’s population is projected to be urban, which is about 14% more than in 2018 [1], leading to the increasing demand for resources while the remaining resources are on the verge of disappearing. In addition, our world has been using natural resources but, ultimately, there is a limit on economic growth that depends on the natural costs of the world. Today, cities are responsible for over 78% of the global energy consumption and over 60% of greenhouse gas (GHG) emissions, but less is known about how they drive resource use and sustainability impacts [2]. Therefore, global community cooperation in driving each country to set goals for sustainable urban development is widely discussed nowadays. Thailand is one of the countries responding to the need for sustainable development; this can be seen from the 20-Year National Strategy (2018–2037) [3], the main master plan for national development and the Sustainable Development Goals (SDGs) [4]. This has led to the development of plans, requirements, and regulations, including guidelines for all sectors in order to proceed in the same direction.
Sustainable development is the long-term development plan to fulfill the next generation’s needs through planning today. It is a notable notion worldwide, especially in developing and emerging countries [5]. A sustainable city is a city that is designed taking into consideration environmental impacts, inhabited by people dedicated to minimization of required inputs of energy, water, and food, and waste outputs of heat, air pollution, CO2, methane, and water pollution [6]. The environmental indicators have become a fundamental tool in environmental assessment at detailed local, regional, and national levels [7]. They are cost-effective and powerful tools for tracking environmental progress and measuring environmental performance [8]. Various indicators have been used to create a “sustainable city” index by some institutions in Thailand and other countries. Most of the monitoring tools are based on a set of indicators, with the intention to assess the performance of local governments, identify actions for sustainable urban development, and review the challenges facing sustainable urban development. The use of indicators to emphasize the relevance of environmental data has many advantages [9]. The set of indicators on which the tools base their evaluation usually encompasses between 10 and 30 indicators. These can be either qualitative or quantitative and are inspired or derived from a number of sources [10]. For example, the Urban Ecosystem Europe (UEE) tool is the result of collaboration between DEXIA, an international banking group, and Ambiente Italia, a research consultancy and creator of the tool [6,10]. The UEE assessment is based on a questionnaire comprising 25 indicators [6,10]. European Green City Index (EGCI) is an indicator developed by The Economist Intelligence Unit (EIU) in collaboration with Siemens. The study indicators are divided into eight categories consisting of CO2, energy, buildings, transport, waste and land use, water, air quality, and environmental governance [11,12,13,14,15]. In Thailand, the Office of Natural Resources and Environmental Policy and Planning (ONEP) proposed the implementation frameworks of the eco-city development of the indicators under the project to drive development, according to the concept of an eco-city model for sustainable urban and rural environmental management. The project defined eighteen indicators for evaluating the eco-city.
In this age of information, sustainable urban development will involve a lot of data and a variety of data formats. Previously, the data were of a certain form and were sourced only from the system within the department; but nowadays, data sources come from many different organizations and forms, including social media, which are becoming increasingly more important, with new data generated every millisecond. The current volume of data and information collected, stored, shared, and used in urban agglomerations is almost unlimited [16]. Therefore, the most important part of city management at the present time is information; the executive decisions should be based on reliable information. Currently, however, according to the municipal administration of Thailand, sufficient qualitative and quantitative data have not been collected for use in environmental management. Most municipalities collect environmental data qualitatively rather than quantitatively; therefore, troubleshooting or development may not be able to measure performance properly. For this reason, three issues were raised that led to this study. First, the leaders make environmental management decisions by using the information or the thoughts of one person. In fact, this choice is based on the fact that key strategic decisions on sustainability-related issues are mostly made on an upper management level [17]; second, in the age when information is vital to environmental management, how many municipalities are using the information to resolve the problem; and last, if the municipality does not have information now, how can they manage the environment effectively?
In Thailand, the municipality is an organization responsible for various functional contexts. The data are stored separately by the department in the form of hard or soft copy. In terms of operation, this often causes data problems such as lost data, missing data, retrospective data collection taking a long time, and no information management system supporting the use on demand. With a systematic storage database, users can share work-related information without duplication of information and avoid data conflicts, including data that are accurate, reliable and with a standardized collection system. It is important to develop the data to be appropriate and consistent with the municipality’s use. Part of the problem that arises is that the ministries, departments, or offices have duplicated data requests or duplicated assessing of the municipality operational efficiency. This may cause the municipality to gather the same data several times, and if there are new indicators, there may be problems such as having no data for reporting or assessing. Based on the municipality’s obligations, the data are used in two forms of assessment: (1) a mandatory assessment based on the obligations, such as a local performance assessment (LPA) with the Department of Local Administration (DLA) [18], and (2) a voluntary assessment of the project participation, such as carbon footprint assessment of the organization with the Thailand Greenhouse Gas Management Organization (TGO).
The challenge of this study is when the municipality is an organization that must be assessed with environmental indicators. Many indicators share the same data set but are displayed in different units. The current reality in gathering the municipal data is to collect on demand, and sometimes the work is repetitive, which wastes time to gather the same data while using reports from different departments. Therefore, creating a municipal information management system with a data platform can support both the organization’s internal and external data and create a central data storage system that can be used in the formulation of policies, plans, and activities for urban development and assessment of the efficiency of the municipality’s environmental performance.
According to the municipality’s mission, it is important to use information or analysis results to communicate with the public in order to achieve understanding, awareness, warning, and prevention, resulting in cooperation driven by the same goal. If every municipality in Thailand has an established database, a national database can be created that will be greatly useful in the development of the country. Therefore, the objective of this study was to study a platform for a self-assessment environmental performance index called EcoCitOpia. The platform is a tool to determine a city’s progress toward sustainability and to indicate how the decision maker can improve the state of sustainability in municipalities.
2. Materials and Methods
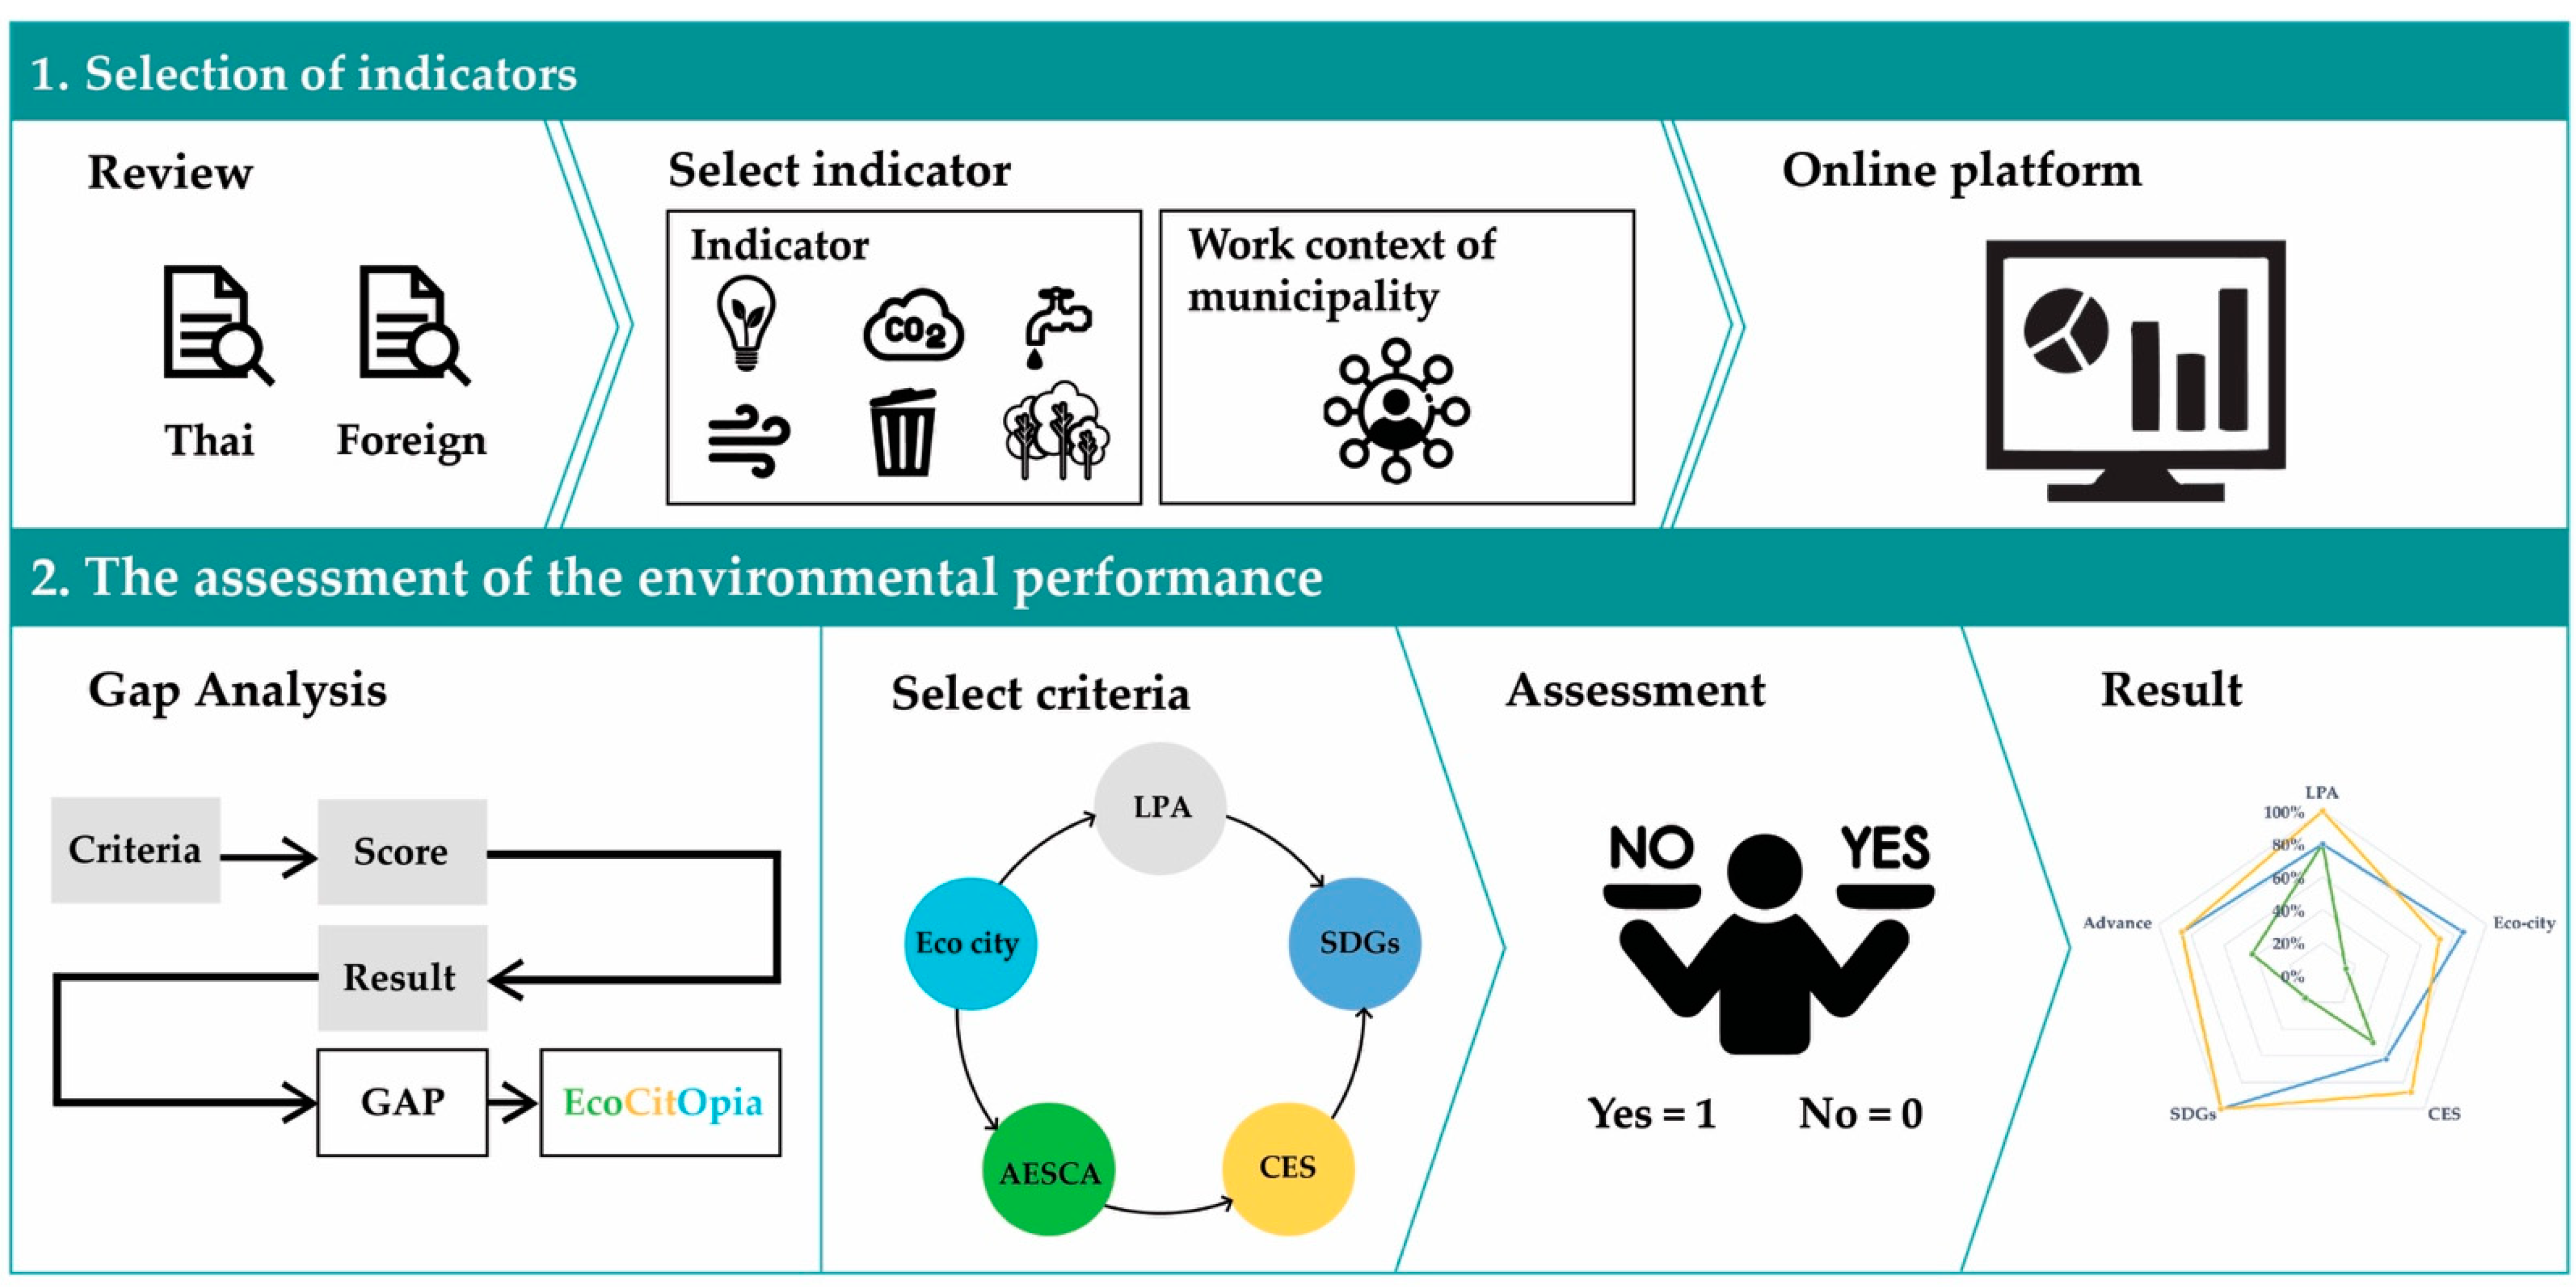
The municipal environmental performance assessment allows the municipality to measure its own performance. Moreover, the development of the environmental data collection platform will enable municipalities to manage the information more efficiently. Therefore, the efficiency assessment and data collection platform needs to be flexible and suitable for the municipal work system in Thailand, since the aim is to develop a city based on accurate and reliable information. If the municipality has good information on the management, it may be beneficial in many areas, such as cost-effective budgeting, increasing the productivity of employees in the organization, being able to measuring before and after performance, and providing information for decision-making. The concept of this study is presented in Figure 1.
2.1. Study Municipality
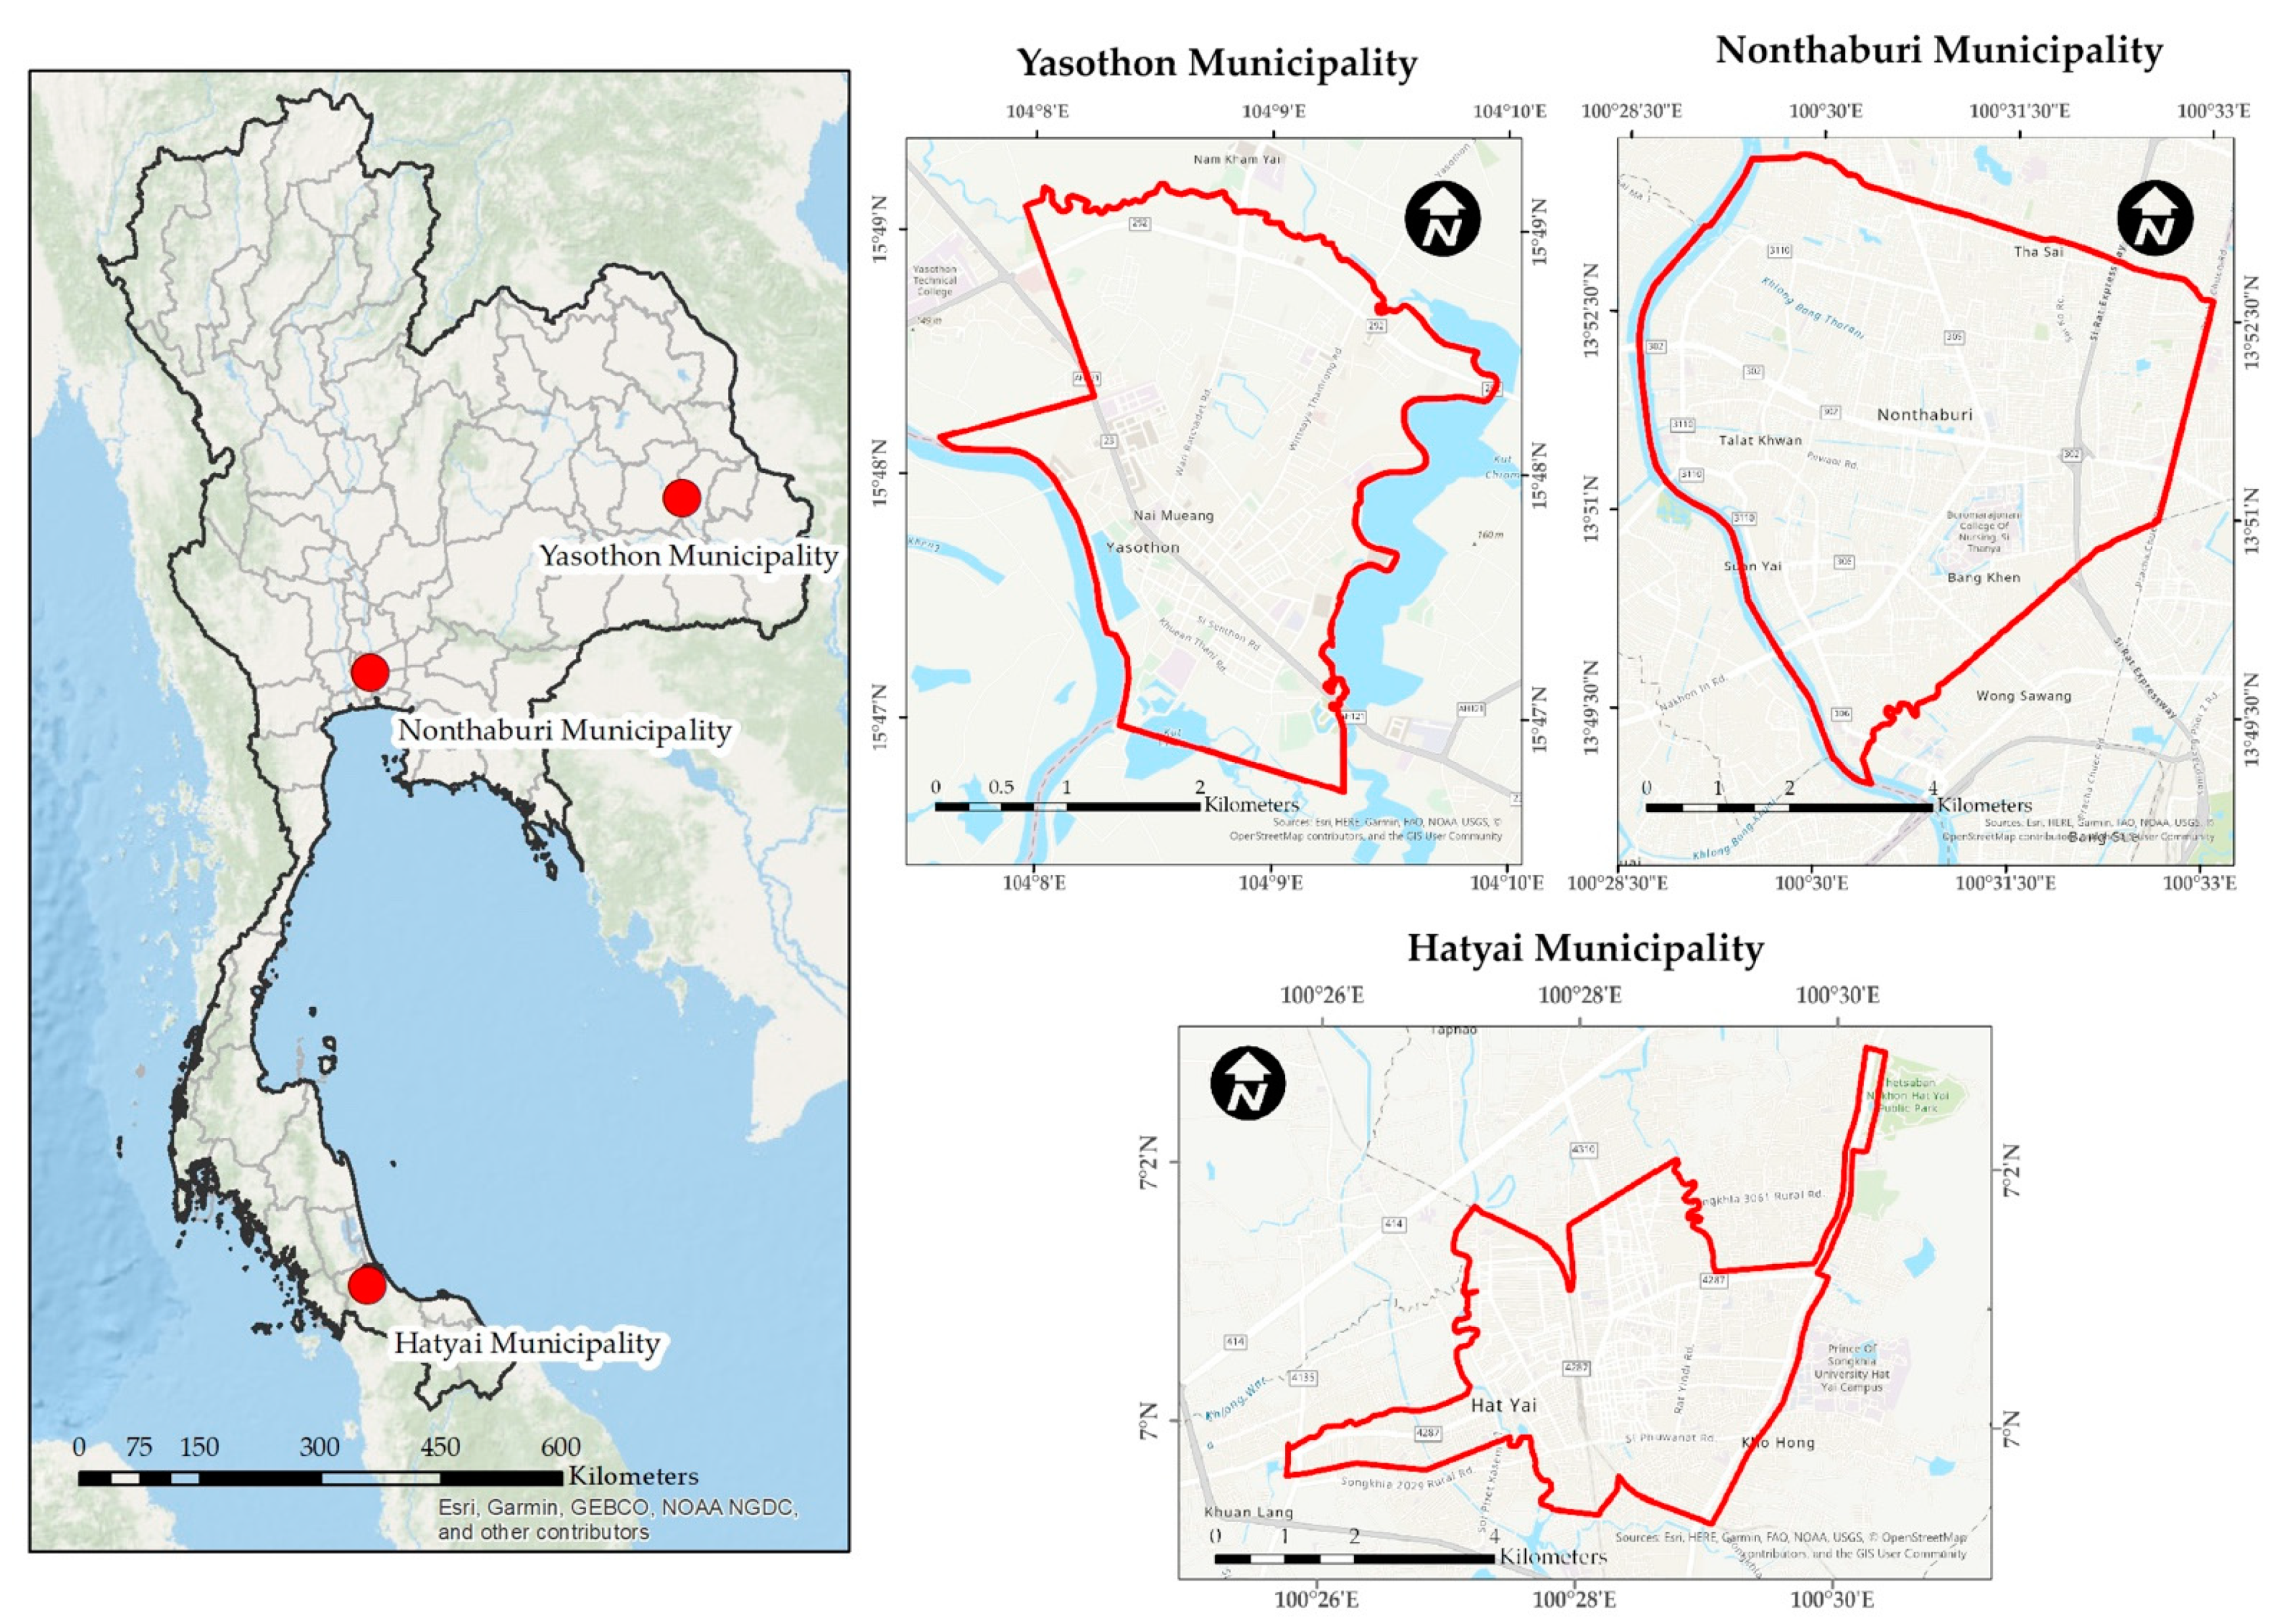
In this study, a few municipalities were selected to study the municipal work system, and to develop a performance evaluation model and a data collection platform that can be applied to all municipalities in Thailand. The selected municipalities were chosen from those that volunteered to participate, because the data collection must be authorized by the mayor and the team set for providing information. Currently, Thailand has a total of 7850 municipalities [19], but in this study, three municipalities with different topographies, policies, and working processes were selected, as shown in Figure 2: Nonthaburi municipality, Hat Yai municipality, and Yasothon municipality.
Nonthaburi is a large municipality located in the district of Mueang Nonthaburi, Nonthaburi Province. There are over 250,000 people within the municipality, making it the most populous municipality in Thailand because it is located in a suburb that has a border with Bangkok and is part of the Bangkok metropolitan region. It has an administrative boundary of 38.9 square kilometers [20]. There are four important aspects of operating policies for sustainable urban development on the environment: (1) solid waste management, (2) sewage management, (3) wastewater management, and (4) environmental quality monitoring with the goal to promote and support the environment, health and safety of the community by acting regarding the safety, occupational health, and environment for a sustainable and balanced development. The important environmental problems are (1) the solid waste management problem, because the amount of solid waste tends to be higher; (2) problems in wastewater management, where the quality of water in the municipality’s canal and river are currently deteriorated, and (3) air pollution management problems where the amount of dust particles is up to 2.5 microns, which is higher than the standard in winter. Nonthaburi is a municipality that is ready for information requests and personnel. There are both public and private departments to provide information such as electricity consumption data from the Metropolitan Electricity Authority, water usage data from the Metropolitan Waterworks Authority, and data on the amount of solid waste from the Nonthaburi Provincial Administrative Organization.
Hat Yai, regarded as the largest city in the south, is a municipality located in Hat Yai district, Songkhla province. It is an important economic, commercial, and transportation center of the south and is the third most populous municipality in Thailand, after Nonthaburi and Pakkred municipalities. With an administrative area of 21 square kilometers covering the entire Hat Yai sub-district area, it has a population of more than 150,000 people [21]. There is an action plan called “Green City” for 2017–2027 proposing (1) a garden city aiming to explore, maintain, and develop green spaces; (2) a city of waste minimization focusing on solid waste management, wastewater management, and air pollution management; (3) a city of energy efficiency consisting of energy for transport by supporting monorail construction, promoting the use of bicycles, and, on the electric power side, promoting the use of renewable energy and increasing energy efficiency use; (4) a city with sustainable consumption and tourism by encouraging households to implement the sufficiency economy guideline and establishing the environmental division; and (5) a city with flood resilience. In terms of environmental problems, these include (1) the amount of solid waste that tends to be higher, (2) at least 20% of wastewater that has not been treated in the treatment system because the collection system is clogged and the wastewater smuggling of many establishments affects water quality in the canals, (3) air quality that was found to exceed the standard, caused by the denser traffic within the city, (4) urban green areas and relaxation areas which are inadequate for the population.
At present, Hat Yai has an ongoing environment policy. Therefore, it is well prepared in terms of executives, teams, and information, including having a good understanding of how to utilize the environmental database, since it is a municipality that focuses on measuring performance through project participation. Hat Yai is also aware of the limitations of data storage in traditional working models, being a municipality with a clear goal to become a city with environmental operations under sustainable urban development guidelines.
Yasothon is a municipality in Mueang Yasothon District, Yasothon Province, with an area of 9.7 square kilometers, covering the entire Nai-Mueang sub-district, and with a population of more than 20,000 people [22]. A sustainable urban development policy and plan were established in the development strategy and approach to Yasothon city development outlined in the 4-Year Local Development Plan (2018–2021). It has been implemented through projects such as the carbon footprint project in Yasothon, the beautiful front yard project, the garbage bank project, the green road project, the global warming problem-solving project, and the green office project. The most important environmental problems are related to solid waste management, energy management in the road transport sector that primarily uses fossil fuels, the public transportation system that does not cover the administrative area, and the use of electric power that has increased.
For Yasothon, there is environmental action and the results are measured through participation in activities such as Thai municipalities caring for global warming, and the ASEAN awards for sustainable environment cities. The executives and staff are also well prepared and experienced in establishing an environmental database and recognizing problems in gathering the data; the comments and suggestions from work can be excellently applied for developing online databases to carry out this research.
Therefore, all three municipalities have the potential of executive, personnel, and cooperation from data owners. The experience of these three municipalities can be transformed into establishing an online database that is suitable and flexible to use, and there are concrete benefits for the municipality in the management of the information of the city. It can also be a municipality model that will establish the best practice for other municipalities to learn from.
2.2. Selection of Indicators
Sustainability indicators are increasingly recognized as a useful tool to provide policy information in support of the environment [23]. Thus, several approaches have been developed to assess environmental performance based on indicators. For example, the UEE tool, which is based on a questionnaire comprising 25 indicators [6]; the EGCI comprising 17 quantitative indicators; the European Green Capital Award (EGCA) with a set of 12 environmental indicators [6,14]; the Sustainable Cities Index (SCI) exploring the three demands of People, Planet and Profit to develop an indicative ranking of 50 of the world’s leading cities [24]; the Sustainable Development Goals (SDGs), which are a set of 17 goals designed to lead global development [25]; the ASEAN Environmentally Sustainable City Award (AESCA) program focused on indicators for clean air, clean land, and clean water [26]; the environmentally sustainable city assessment (ESC) guide developed for urban development according to the livable city [27]; and the Eco-city indicator for sustainable development assessment consisting of 18 indicators [28].
The selection of indicators depends on the characteristics of the area under study [29]. The indicators should fulfill the following criteria: (1) they have either a direct or an indirect linkage to city development; (2) they can manifest the diverse facets of sustainability performance; and (3) the raw data for the indicator system is accessible and measurable [30].
Therefore, the selection of indicators in this study consisted of three steps. The first step was the review of the environmental indicators of both Thai and foreign assessment criteria to group the indicators and categorize the types of data that need to be collected for use in assessing the results of each indicator, as shown in Table 1. Table 1 gives a review of the nine criteria that were included in this study. For each included criterion, the report and methodological background documents that were found on the website were studied. For the next step, the indicators were selected by cluster analysis. This is a popular technique in unsupervised learning, where the objective is to group the studied data in different clusters according to the similarity of data characteristics [31]. The indicator must be classified as a data type and the data must be associated with the contextual work of the municipality to establish which department is the owner of the data, and what the format is for collecting the data. The last step was the study of the quantitative data that need to be analyzed in order to measure results in each of the indicators compared to each evaluation criterion and consider sources of the data that are accessible for collection. However, the focus of the selection of indicators in this study was data acquisition, which was the data that the municipality had already collected or was able to collect according to the work context.
According to the study of environmental indicators, the same and different indicators were available depending on the principle of each criterion. In this regard, if the criteria were related to municipal operations, each assessment criterion could be classified in order to classify the groups of indicators, such as greenhouse gas, energy, water and sanitation, solid waste, air quality, transportation, green space, and land use. The results from the sub-criteria in the assessment to group the indicators showed the details of the measurement results of each criterion. This made it possible to separate the types of data in terms of quantities that needed to be collected for the calculation of the indicator index, including classifying the sources of information. The criteria used in this study were LPA, Eco-city, sustainable environmental cities, and SDGs, which were related to municipalities based on their obligations.
2.3. The Assassessment of the Environmental Performance
Environmental performance assessment started from reviewing the criteria for assessing environmental performance both in Thailand and abroad that were relevant to the operation of the municipality in order to learn the details, such as assessment form, criteria used in the assessment, scoring criteria, and the demonstration of the result. The results of the review were based on the principle of gap analysis to analyze the existing evaluation criteria, whether not the environmental dimensions linked to the working context of the municipality should be considered. The goal of the performance assessment was to let the municipality know its own working status and raise awareness of the importance of developing an environmental database with relevance, completeness, consistency, accuracy, and transparency.
2.4. The EcoCitOpia Platform
The development covered performance assessment, establishing a database, data analysis, and demonstrating the result to be utilized, which the system design considered to be the type of user, such as the user group, each group pattern of entry, and the level of access to the user’s information, as well as the security of the information. In this study, we developed an online platform by considering the connections to existing data storage formats that were already in the municipal works, and achieving a modification of the traditional data storage format used for paper or computer data storage. This process involved changing to a new form of data storage by storing in online databases to order to fix data loss problems or difficulty in searching for data when there was a need. The details of each part are as follows.
2.4.1. The Collection of the Data
The study found that primary data and secondary data used in the evaluation of environmental information were either from within the organization or outside the organization, so the data collection model concept was a flexible online platform compatible with municipal data collection formats, which may have different follow-up data collection formats. The information collected should be comprehensive for use in various dimensions, such as the management of the city, the measurement of results of projects or activities, and the use of information for funding requests from the different funding sources. Therefore, data types, analysis method, and the method of each selected indicator result demonstration were examined in establishing an online storage platform
2.4.2. Database
The data collected through the online platforms were stored in a separate database of each indicator to facilitate the use or analysis of the data. The data stored in the database were stored according to the calendar year, separately by month.
2.4.3. Data Analysis
Most indicator data were queried in terms of ratio, percentage, increase or decrease value. Therefore, the data analysis model utilized a format that could be used to create equations, ratios, and percentages.
2.4.4. The Demonstration of the Result for Utilization
Currently, in the age of information, the focus is to utilize information. In this study, the result demonstration model supported municipal uses such as radar graphs, was easy to understand, and could be summarized in a single image, such as a linear graph for viewing data trends useful in policy management to visualize the trends of the tracked data and to show the results in the form of a table.
3. Results
3.1. Environmental Indicators
The results of classifying the categories of environment indicators are shown in Table 2. These indicators allowed assessing the environmental performance of municipalities in six categories: Greenhouse gases, Energy, Water, Air quality, Waste, and Green area, which were analyzed in the criteria in both Thailand and abroad. The municipalities can effectively collect data according to their work context to be utilized in the city’s environmental management.
However, when studying the details of indicators in each category, it was found that even though they were the same indicators, they had different descriptions of the data used to measure the results. For example, for the indicators of air quality, LPA was measured as the amount of activity that the municipality undertakes to manage the air quality, while the Eco-city considered the number of days in one year with pollutants in the air that exceeded the standard. According to the foreign criteria, EGCI tracked air quality measurements of nitrogen dioxide (NO2), ozone (O3), and sulfur dioxide (SO2) in micrograms per cubic meter compared to the European standard. The EGCA criteria considered particulate matter size up to 2.5 and 10 microns (PM2.5/PM10) and nitrogen dioxide (NO2). Therefore, a data acquisition platform needed to be flexible for municipalities to use in assessing environmental performance according the indicators of each criterion. Table 3 lists the categories and indicators of the data to be collected that were relevant to a data acquisition platform.
3.2. The Environmental Performance
The results from gap analysis showed that municipal work had various criteria to measure results in environmental dimensions, either in the form of duty criteria, such as the LPA, where municipalities were assessed annually, or the criteria that were based on voluntary actions to challenge the municipality’s performance, such as the sustainable environmental city assessment or the ASEAN Environmentally Sustainable City Award. At present, the evaluation criteria have started to use more quantitative measurements, and this makes it difficult for municipalities to gather information to be used in measuring results. Therefore, the study found that, currently, there is a lack of performance assessment criteria for municipalities that let the municipality know what their state of operations is at the moment, when compared to each of the criteria. It should also be a simple form of assessment that does not require a large amount of data to be assessed. This study used “Yes or No” questions to assess the performance of each indicator. The six criteria used to reference were LPA, CES, AESCA, SDGs and Advance. The Advance criterion was set specifically for this study, which assessed the municipality data collection continuously and classified the data according to the sources. The basis of this study was to evaluate the efficacy of quantitative data for evaluation in Advance, such as using data for various simulations or predicting trends. The scoring method ‘Yes’ was equal to 1 point, ‘No’ was equal to 0 points. The answers were calculated and shown in the percentage of answers compared to total answers. The score criteria used in assessing performance are shown in the Table 4.
3.3. Self-Assessment Environmental Performance Index on EcoCitOpia Platform
The EcoCitOpia platform is an online form available at “http://www.ecocitopia.org (accessed on 19 April 2021)”. A working system is shown in Figure 3. As a result of the study of the three model municipalities, it was adapted to be a flexible platform suitable for municipalities of Thailand. The EcoCitOpia platform divides a system into two parts: the first part is the environmental performance assessment beginning with the municipalities answering questions on each of the indicators to assess the score. The system processes the answers and compares them with the criteria from Table 4 to show the results of the performance assessment for each of the indicators. The results of the municipal assessment can be utilized in municipal work and the information can be released to the public, aiming to create cooperation in solving environmental problems. When the municipalities know their state of work, ‘Yes’ means to continue and make it better, but ‘No’ means it should be improved to ‘Yes’, which would allow municipalities to develop procedures to make their work more efficient.
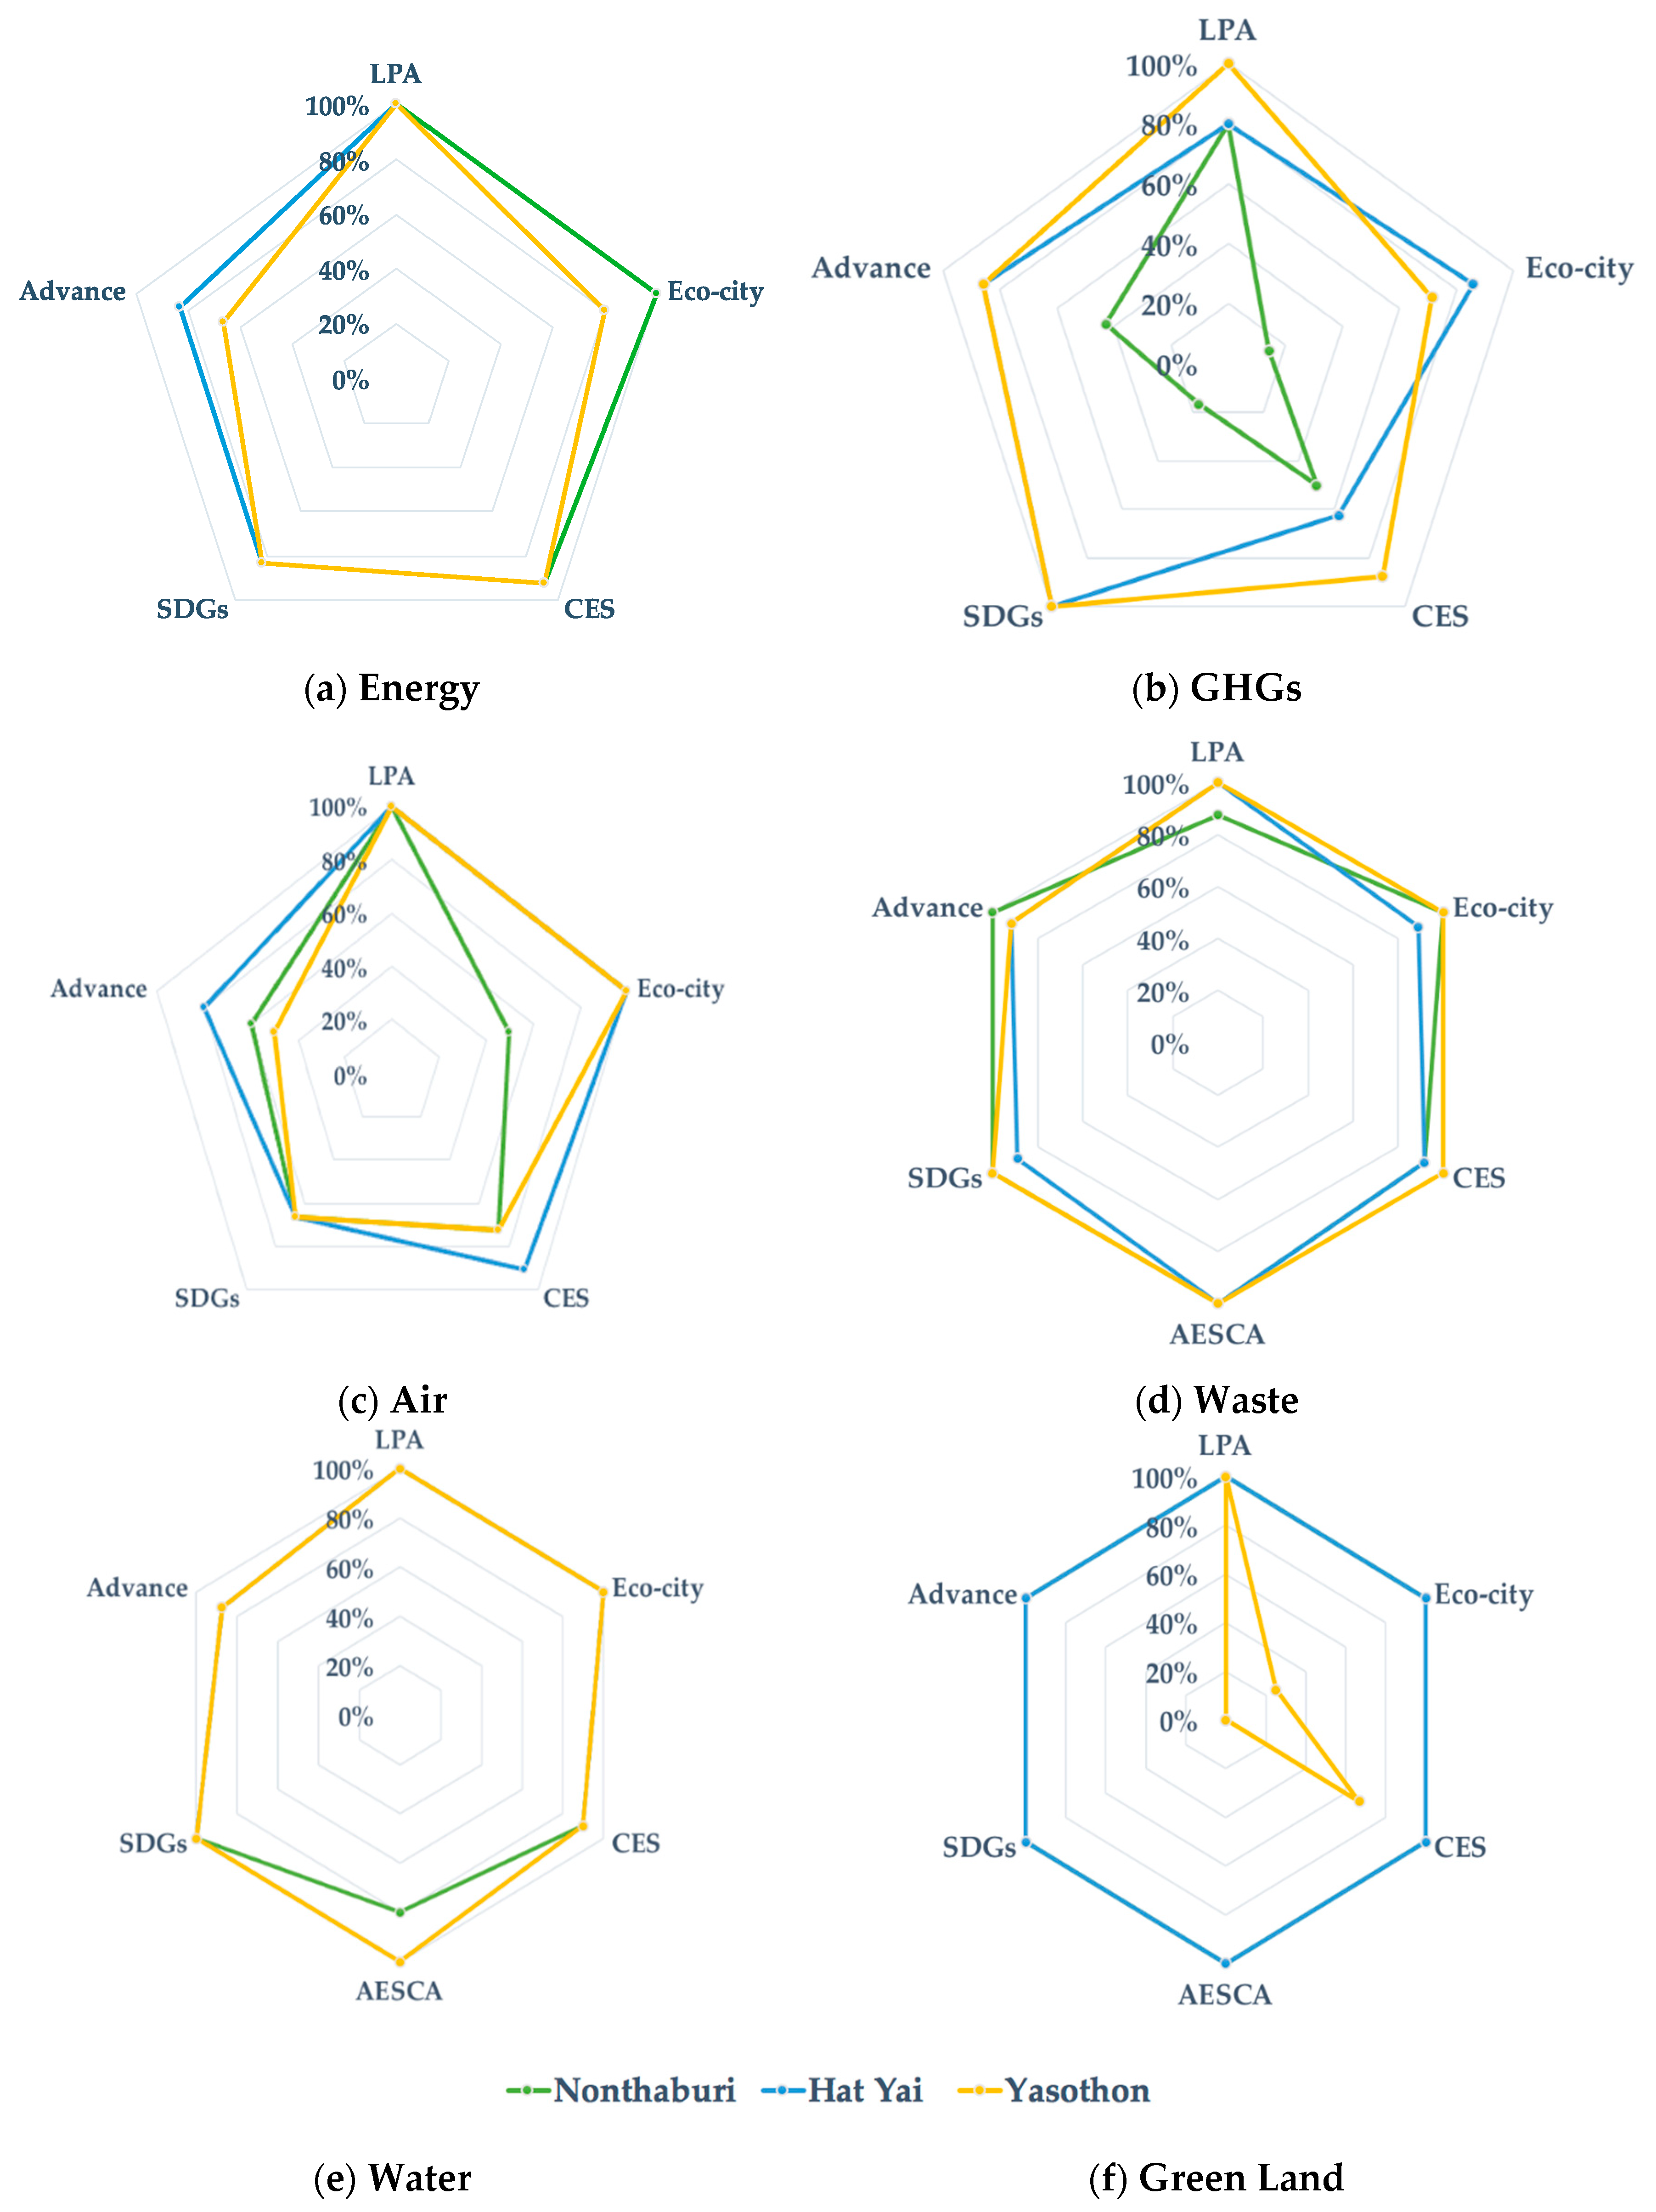
Figure 4 shows the results of the performance assessment compared to the assessment criteria of the three municipalities for each of the indicators in the base year 2019. LPA, which is a fundamental criterion that all municipalities in Thailand must assess annually, is based on the assessment results in terms of energy, water, air and green space, and the three municipalities had an operational performance equal to 100%. Other criteria, assessed by the municipalities voluntarily, found that the reference performance in each of the three municipalities had a value greater than 50%. However, if the results were taken separately for each indicator, they would have the lowest GHG performance compared to Hat Yai and Nonthaburi, except for LPA, with an 80% rating equal to Hat Yai. The air problem was a major one for Hat Yai, especially for PM2.5. As a result, Hat Yai is equipped with real time monitoring and measurement sensors, causing it to have a more operational performance than the other two municipalities.
In terms of the waste indicator, Yasothon was the municipality with the best performance with an assessment of 100% in all criteria, except for Advance, which was 91.67%, because they did not have plans to gather waste data based on their sources of waste such as residential, commercial business, and industrial sources. As for the water indicators, Hat Yai and Yasothon had the same performance assessments across all criteria; Nonthaburi had the same performance assessments as Hat Yai and Yasothon, except for AESCA, which was 80%, less than the other two for which the assessment results were 100%. The Hat Yai and Nonthaburi green space indicators had an operational performance of 100% across all evaluation criteria. For Yasothon, the assessment results were the least because it collected fewer data on green spaces, resulting in it having less performance than the other two municipalities.
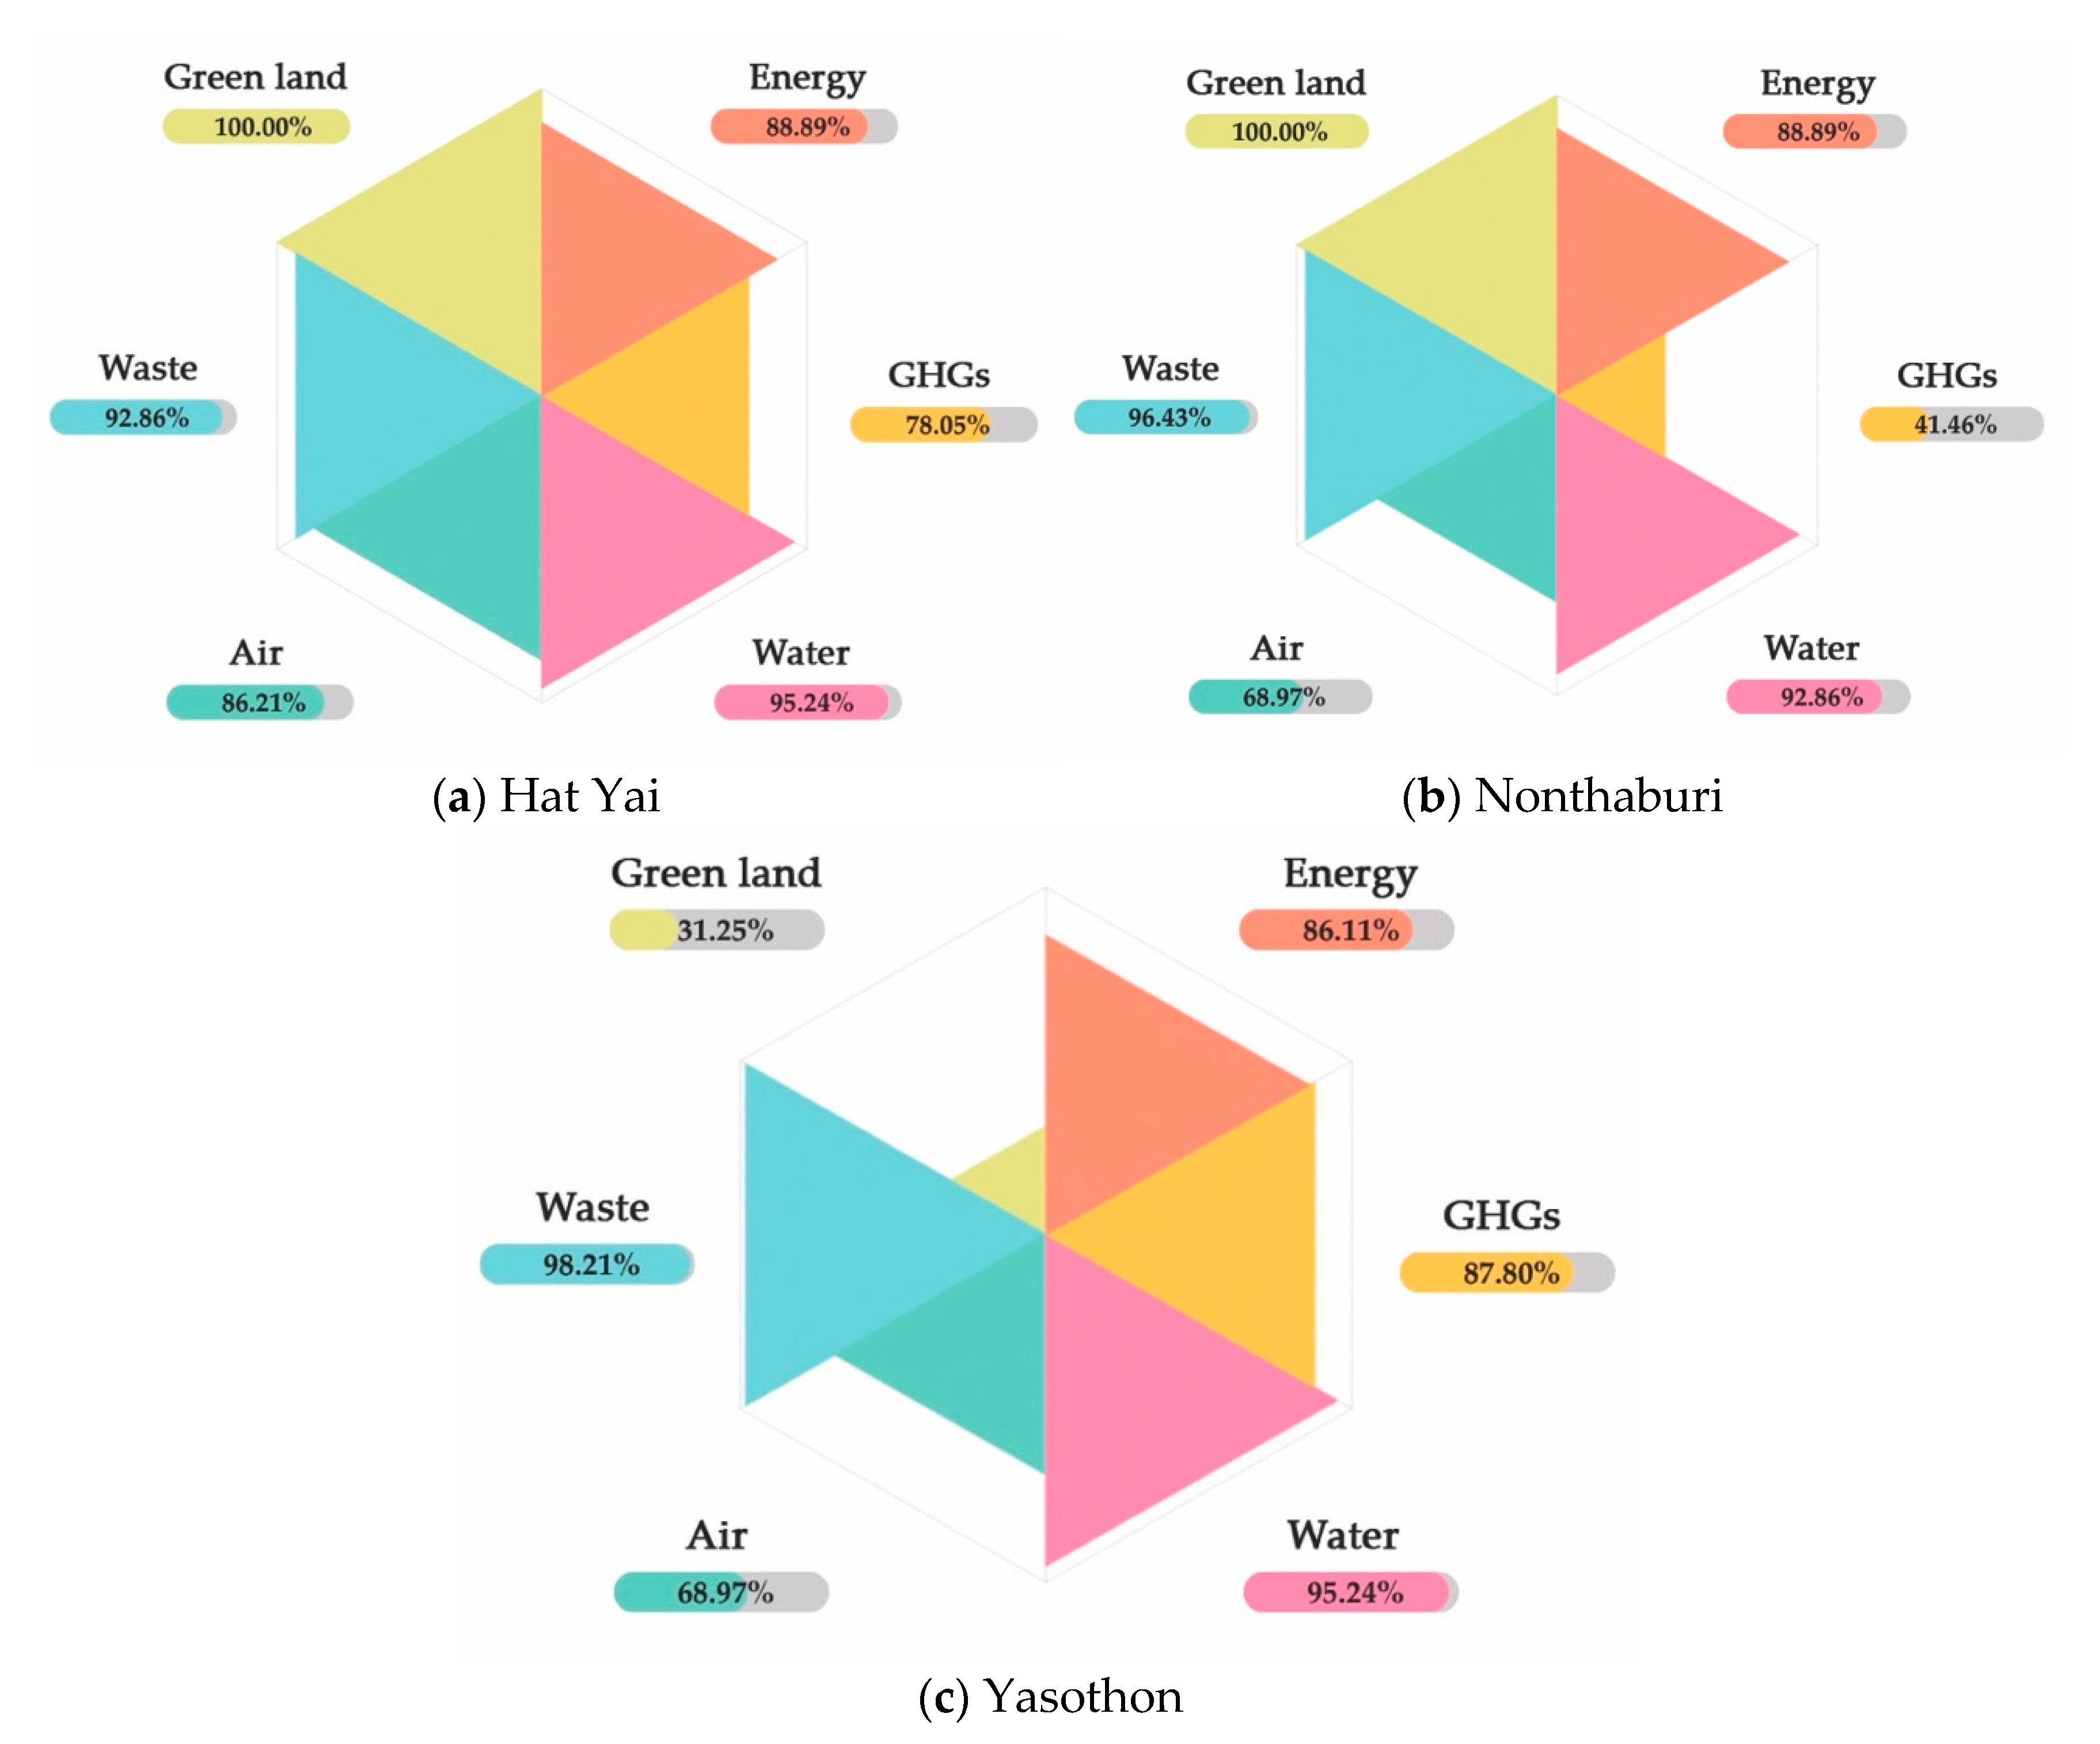
Considering the overall performance assessment shown in Figure 5, it was found that the three municipalities had policies and operations that emphasized the environment continuously in accordance with their own context and duties. The municipality with the best performance was Hat Yai. The result of Nonthaburi’s greenhouse gas assessment was 41.46%, less than Yasothon and Nonthaburi, which were 87.80 and 78.05%, respectively. Nonthaburi started its greenhouse gas action policy in 2017, while Hat Yai and Yasothon have been operating since 2012 and 2013, respectively, so its readiness in policies, setting goals, and operating activities to reduce greenhouse gas emissions, including the preparation of the greenhouse gas database, was only one year old.
As for the air indicators, Hat Yai had the highest score at 86.21%, while Nonthaburi and Yasothon were equal at 68.97%. The green area score was the lowest at 31.25% for Yasothon, as it had less operational performance than the other two because there was no continuous database to be used effectively in a policy or plan.
The results of the assessment of performance from this study helped the municipalities to know their current state of performance, which could lead to consistent policies and plans and increase their operational efficiency in every indicator. This may lead to improvements in the municipality’s procedures to be more efficient, and it reflects the importance of establishing a quantitative environmental database that can measure the performance.
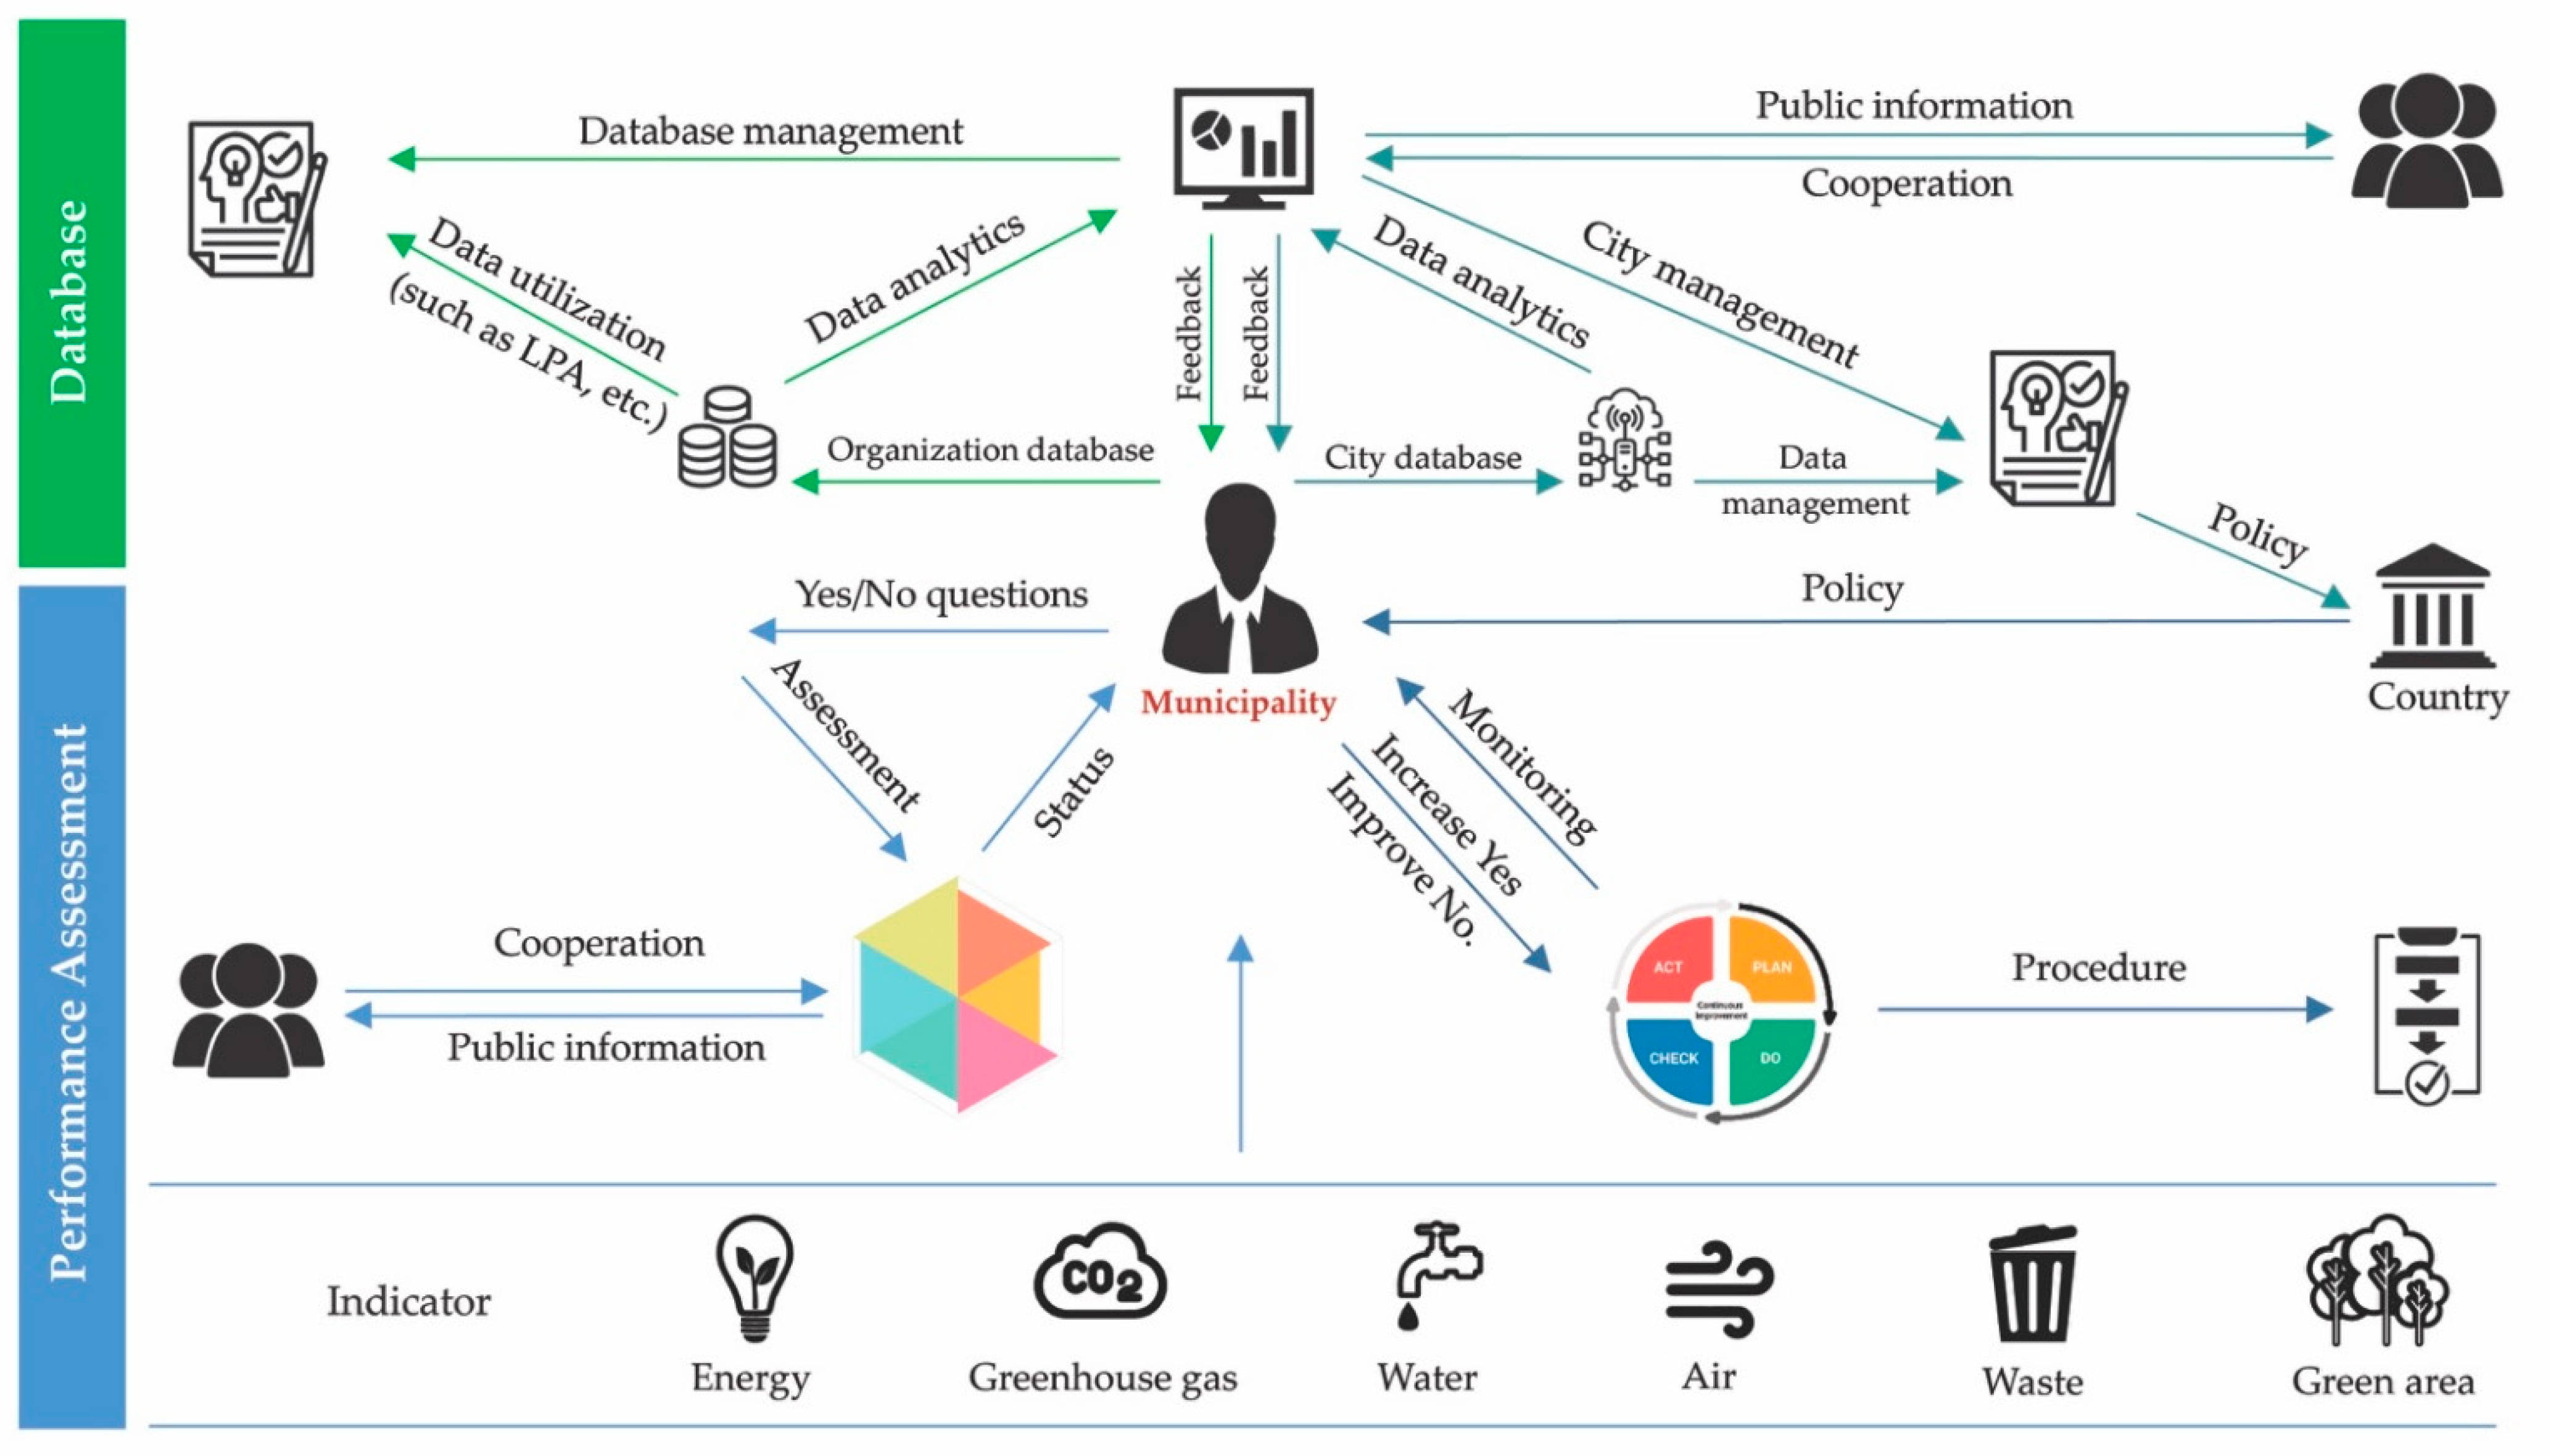
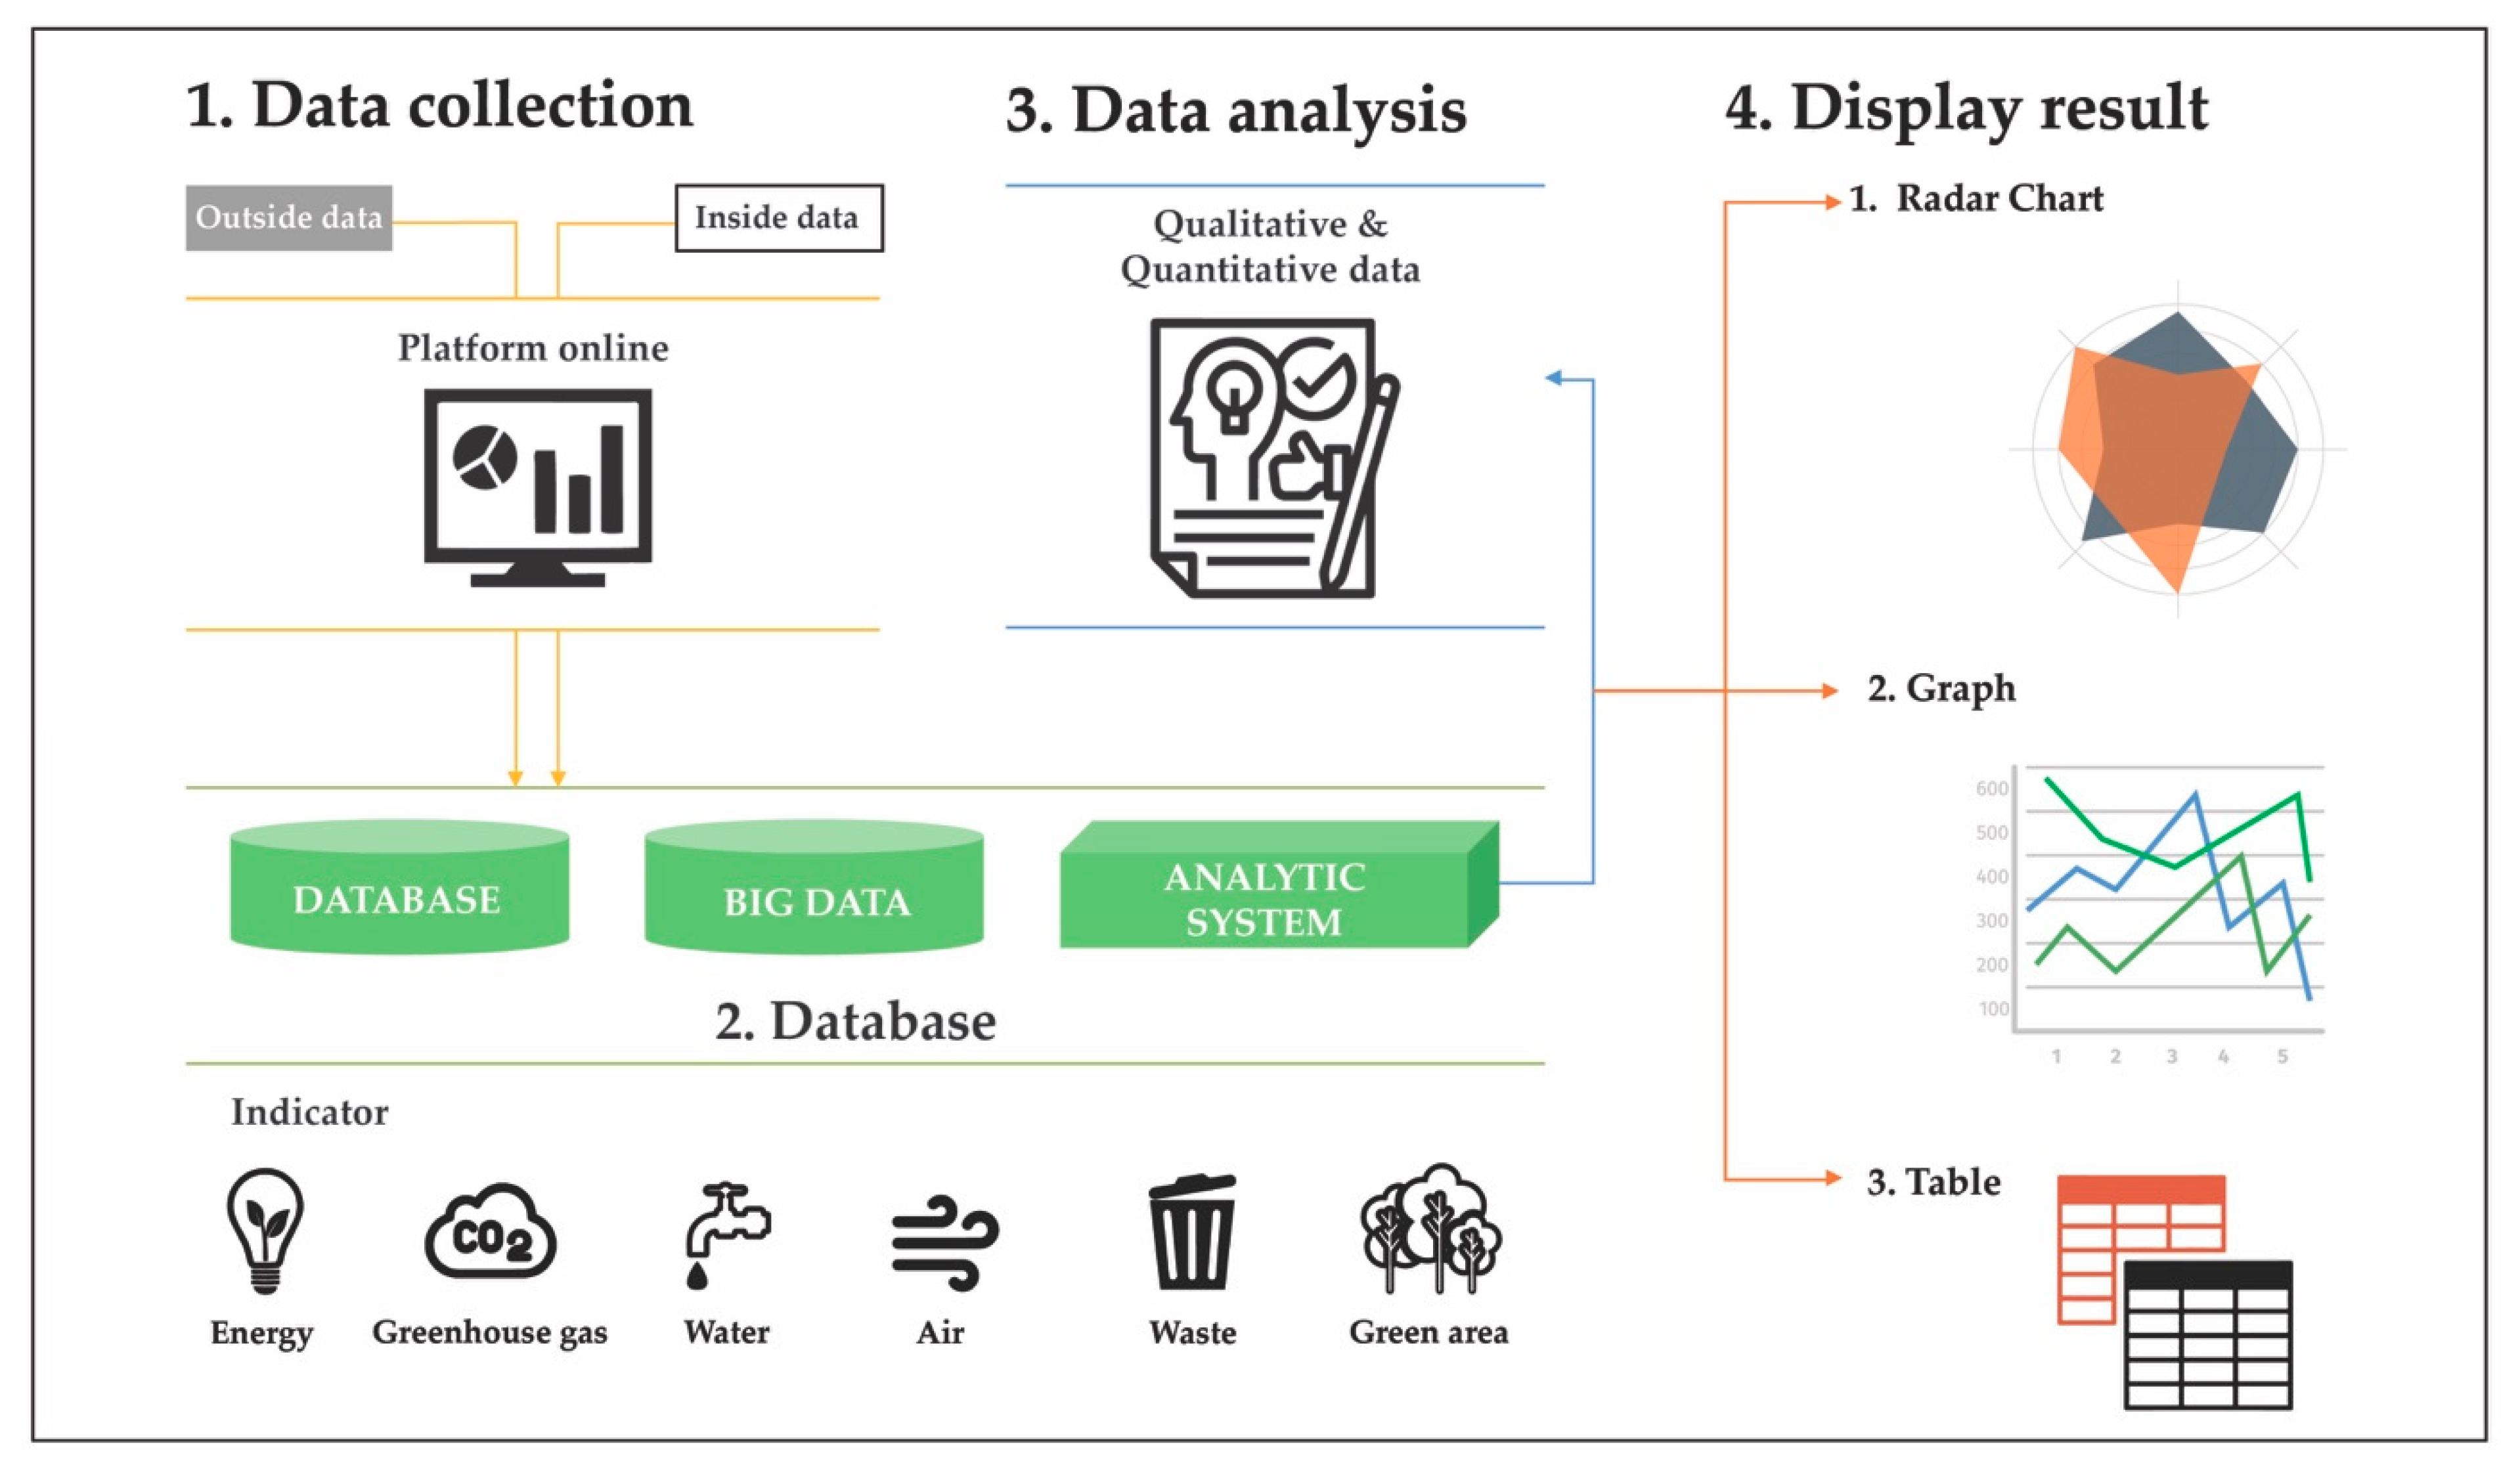
For creating a database, data were divided into organizational level and city level. The organizational-level data were intended for the municipalities to use to manage data within the organization. The city-level data were intended for use in policy-level data management for further development of the city. The working system shown in Figure 6 was divided into four parts. The first part was the data collection platform, which included two parts: the first was the basic municipal information, such as population, number of households, and the municipal administrative area, and the second part to collect data on each indicator, such as the consumption of electricity, water consumption, and amount of waste. The data were stored in a database classified by indicators, to be used for data analysis such as the rate of electricity consumption per capita or the rate of water consumption per capita. The data obtained from the analysis can be displayed in the form of a line graph and a table, separated by yearly data.
4. Discussion
Environmental databases can be used to solve environmental problems if the municipalities have the information available according to the situation. The information should be updated and have quality in both data collection and verification before it can be used for policy planning, work plans, and action plans in various activities that will be limited by people, budget, and duration. Good information allows the municipalities to make precise decisions about the operation, including the use of information to request budget funds for the development of the city in the work plan. The key to all these is having available information. In the past, municipalities had several environmental operations based on their work context, mostly qualitative measures. However, they may not have been able to collect quantitative data that could lead to numerical measurements.
Starting from the energy indicator, electric consumption data from the database allows the city to know the overall electricity consumption trends and classifications such as housing, and small, medium, and large commercial businesses. If cities aim to reduce electricity consumption, they may focus on increasing energy efficiency by using various technologies and increasing the use of renewable energy. For greenhouse gas, the emissions database provides the municipality with the knowledge of significant sources of greenhouse gas emissions to define the policies, work plans, or activities that can be used to reduce the amount of greenhouse gas emissions appropriately. In terms of water, the management of wastewater is mainly focused on. However, when assessing the environmental performance, it is concerned with water for consumption, including not only the water supply system but also the natural water sources. Therefore, having a comprehensive database will enable the city to manage all dimensions of water problems. On the air side, tracking air quality data at different points in the city can be used for public communication. This includes knowing activities or sources that cause air quality problems, which will enable the city to monitor and resolve them promptly. For Hat Yai and Nonthaburi municipalities, which have problems with PM2.5, continuous measurement data are used in planning action guidelines to prepare for the crisis that will occur each year. Whether or not it is a form of alarm to the public, if the sector information is known, there may be the creation of safe zones in office buildings, schools, and various sectors.
The waste indicator is one that all municipalities are continually monitoring, but the previous problem was that the information was scattered and the data reporting in each section did not match. The database from this study allows the municipalities to verify their own waste data to be accurate, usable, referenced, and corresponding. As a result of the activities that the municipalities operate, if the data are collected continuously, they can be used to measure results. For indicators of green spaces, most municipalities only have information on the areas that are in the municipalities, such as parks, roads, and road islands, but do not have information on the privately owned areas that can be used for management. Therefore, establishing a comprehensive database by applying modern technology such as GIS to help collect data can assist municipalities to increase the work performance.
5. Conclusions
Local government organizations at the municipal level are essential for driving urban development in order to support a policy in accordance with the concept of sustainable urban development. It is important to develop a balance between economic, social, and environmental aspects. In this study, emphasis is placed on the dimensions of the environment and the working context of the municipality with the aim of the municipality to be able to manage the environment well. Nowadays, however, most municipalities are inefficient in collecting environmental data; therefore, solutions to environmental problems sometimes lack information to make decisions. Although the municipalities have a wide variety of local characteristics and limitations, tools or approaches are needed to develop an efficient storage system in a flexible online platform. In the past, the format for storing data would be paper-based or on computers that may have a data loss problem, including scattered information that will be searched only when needed. As a result, the management of the previous system may not use the information efficiently.
Therefore, this study aimed to (1) study a model for assessing the environmental performance in accordance with the context and duty of municipalities, which is a simple assessment system, and (2) create a platform to establish an environmental database for municipalities to benefit from information management for sustainable urban development. Pilot municipalities with different city characteristics were selected to study the environmental dimensions according to the context and duties of the municipalities, current data collection models, current environmental databases, to be compared with the reference criteria that summarize the information that will be used to create the platform, whether it is a data type, data collection process, source of information, data analysis or the form of utilization. The platform will enable municipalities to collect data easily, conveniently, quickly, and flexibly. Environmental data are usually collected from internal and external sources of the municipality because the municipality is the center of information that relates to all sectors, including government, business, commercial, and the public sector. Therefore, the developed online platform can import data to be stored in a separate database sorted by indicators. This information can be used by municipalities for analysis or processing in decision-making or work.
Good or effective operations must be based on having good information that can be used in the environmental management of a city in the age of information. Currently, there are various criteria to measure the environmental performance of municipalities, whether Thai or foreign, so the development of the Self-Assessment Environmental Performance Index on EcoCitOpia platform will be a tool to improve the efficiency of information management that will benefit the drive for sustainable urban development in the future. However, experience also shows significant lags between the demand for environmental indicators, the related conceptual work, and the actual capacity for mobilizing and validating underlying data. In the field of environmental statistics, differences among countries may be considerable, and there may be a need to establish reliable and internationally comparable data that calls for continuous monitoring, analysis, treatment, and checking.
Author Contributions
Conceptualization, R.K. and S.S.; methodology, R.K. and S.S.; resources, R.K.; data curation, R.K.; writing—original draft preparation, R.K.; writing—review and editing, S.H.G.; visualization, R.K.; supervision, S.S. All authors have read and agreed to the published version of the manuscript.
Funding
This research received no external funding.
Institutional Review Board Statement
Not applicable.
Informed Consent Statement
Not applicable.
Data Availability Statement
Not applicable.
Acknowledgments
This study was supported by Thailand Science Research and Innovation (TSRI), Excellence Center in Logistics and Supply Chain Management (E-LSCM), Faculty of Engineering, Chiang Mai University, and the Research Unit for Energy Economic & Ecological Management, Science and Technology Research Institute, Chiang Mai University.
Conflicts of Interest
The authors declare no conflict of interest.
References
- Klumbytė, E.; Bliūdžius, R.; Medineckienė, M.; Fokaides, P.A. An MCDM Model for Sustainable Decision-Making in Municipal Residential Buildings Facilities Management. Sustainability 2021, 13, 2820. [Google Scholar] [CrossRef]
- Harris, S.; Weinzettel, J.; Levin, G. Implications of Low Carbon City Sustainability Strategies for 2050. Sustainability 2020, 12, 5417. [Google Scholar] [CrossRef]
- National Strategy Secretariat Office. National Strategy 2018–2037 (Summary). 2018. Available online: https://www.bic.moe.go.th/images/stories/pdf/National_Strategy_Summary.pdf (accessed on 25 March 2021).
- UNDP. Sustainable Development Goals (SDGs). Available online: https://www.th.undp.org/content/thailand/en/home/sustainable-development-goals.html (accessed on 25 March 2021).
- Abbas, H.S.M.; Xu, X.; Sun, C.; Ullah, A.; Nabi, G.; Gillani, S.; Raza, M.A.A. Sustainable Use of Energy Resources, Regulatory Quality, and Foreign Direct Investment in Controlling GHGs Emissions among Selected Asian Economies. Sustainability 2021, 13, 1123. [Google Scholar] [CrossRef]
- Pace, R.; Churkina, G.; Rivera, M. How green is a “Green City”? A Review of Existing Indicators and Approaches. 2016. Available online: http://0-doi-org.brum.beds.ac.uk/10.2312/iass.2016.035 (accessed on 25 March 2021).
- Jackson, L.E.; Kurtz, J.C.; Fisher, W.S. Evaluation Guidelines for Ecological Indicators; Report, No. EPA/620/ R-99/005. Environmental Protection Agency: Washington, DC, USA, 2000. [Google Scholar]
- Organisation for Economic Cooperationand Development (OECD). Environmental Indicators: Towards Sustainable Development; OECD: Paris, France, 2001; Available online: https://www.oecd.org/site/worldforum/33703867.pdf (accessed on 27 March 2021).
- Rodrigo-Ilarri, J.; Romero, C.P.; Rodrigo-Clavero, M.-E. Land Use/Land Cover Assessment over Time Using a New Weighted Environmental Index (WEI) Based on an Object-Oriented Model and GIS Data. Sustainability 2020, 12, 10234. [Google Scholar] [CrossRef]
- Joas, M. Informed Cities: Making Research Work for Local Sustainability; Routledge: Abingdon, Oxon, UK, 2014. [Google Scholar]
- Economist Intelligence Unit. European Green City Index. Assessing the Environmental Impact of Europe’s Major Cities. 2009. Available online: http://sg.siemens.com/city_of_the_future/_docs/greencityindex_report_en.pdf (accessed on 27 March 2021).
- Economist Intelligence Unit (EIU). The Green City Index. A Summary of the Green City Index Research Series. 2012. Available online: https://www.siemens.com/entry/cc/features/greencityindex_international/all/en/pdf/gci_report_summary.pdf (accessed on 26 March 2021).
- Economist Intelligence Unit (EIU). Asian Green City Index Green City Index. Assessing the Environmental Performance of Asia’s Major Cities. 2012. Available online: http://sg.siemens.com/city_of_the_future/_docs/Asian-Green-City-Index.pdf (accessed on 26 March 2021).
- Gong, W.; Lyu, H. Sustainable City Indexing: Towards the Creation of an Assessment Framework for Inclusive and Sustainable Citation Urban-Industrial Development. 2017. Available online: https://www.unido.org/sites/default/files/files/2018-02/BRIDGE%20for%20Cities_Issue%20Paper_2.pdf (accessed on 26 March 2021).
- European Commission. Indicators for Sustainable Cities. 2015. Available online: https://ec.europa.eu/environment/integration/research/newsalert/pdf/indicators_for_sustainable_cities_IR12_en.pdf (accessed on 26 March 2021).
- Kourtit, K.; Nijkamp, P. Big data dashboards as smart decision support tools for i-cities—An experiment on stockholm. Land Use Policy 2018, 71, 24–35. [Google Scholar] [CrossRef]
- Angelakoglou, K.; Gaidajis, G. A Conceptual Framework to Evaluate the Environmental Sustainability Performance of Mining Industrial Facilities. Sustainability 2020, 12, 2135. [Google Scholar] [CrossRef] [Green Version]
- Department of Local Administration. Local Performance Assessment: LPA. 2020. Available online: http://www.dla.go.th/upload/ebook/column/2020/5/2292_6137.pdf (accessed on 7 April 2021). (In Thai)
- Department of Local Administration. Summary of Information of Local Government Organizations of Thailand. Available online: http://www.dla.go.th/work/abt/summarize.jsp (accessed on 29 March 2021). (In Thai)
- Nonthaburi. Available online: https://en.wikipedia.org/wiki/Nonthaburi (accessed on 29 March 2021).
- Hat Yai. Available online: https://en.wikipedia.org/wiki/Hat_Yai (accessed on 29 March 2021).
- Yasothon. Available online: https://en.wikipedia.org/wiki/Yasothon (accessed on 29 March 2021).
- Perchinunno, P.; Cazzolle, M. A clustering approach for classifying universities in a world sustainability ranking. Environ. Impact Assess. Rev. 2020, 85, 106471. [Google Scholar] [CrossRef]
- Arcadis, Sustainable Cities Index 2015: Balancing the Economic, Social and Environmental Needs of the World’s Leading Cities. Available online: https://s3.amazonaws.com/arcadis-whitepaper/arcadis-sustainable-cities-index-report.pdf (accessed on 1 April 2021).
- UN Statistical Commission. Report of the Inter-Agency and Expert Group on Sustainable Development Goal Indicators. 2016. Available online: https://unstats.un.org/unsd/statcom/47th-session/documents/2016-2-IAEG-SDGs-Rev1-E.pdf (accessed on 4 April 2021).
- Association of Southeast Asian Nations. ASEAN Award. 2016. Available online: https://environment.asean.org/awgesc/#:~:text=ASEAN%20Environmentally%20Sustainble%20City%20(ESC)%20Award&text=The%20ESC%20Award%20aims%20to,clean%2C%20green%2C%20and%20liveable (accessed on 4 April 2021).
- The Sustainable City Assessment of Department of Environmental Quality Promotion. Sustainable City Assessment Guide. 2013. Available online: https://datacenter.deqp.go.th/service-portal/green-city/municipal-livable-system/download/manual/ (accessed on 7 April 2021). (In Thai)
- Office of Natural Resources and Environmental Policy and Planning. The Project to Drive the Development of the Eco-City Concept for Sustainable Management of the Environment, City and Community. 2019. Available online: https://www.dmcr.go.th/detailLib/4733 (accessed on 7 April 2021). (In Thai)
- Hiremath, R.B.; Balachandra, P.; Kumar, B.; Bansode, S.S.; Murali, J. Indicator-based urban sustainability—A review. Energy Sustain. Dev. 2013, 17, 555–563. [Google Scholar] [CrossRef]
- Chen, Y.; Zhang, D. Evaluation and driving factors of city sustainability in Northeast China: An analysis based on interaction among multiple indicators. Sustain. Cities Soc. 2021, 67, 102721. [Google Scholar] [CrossRef]
- Mitra, D.; Chu, Y.; Cetin, K. Cluster analysis of occupancy schedules in residential buildings in the United States. Energy Build. 2021, 236, 110791. [Google Scholar] [CrossRef]
Figure 1.
Concepts for the selection of indicators and assessment of environmental performance.

Figure 2.
The three municipalities in this study.

Figure 3.
The operating system of EcoCitOpia platform.

Figure 4.
Results of all 6 indicators of environmental performance assessment for the 3 municipalities.
Figure 4.
Results of all 6 indicators of environmental performance assessment for the 3 municipalities.

Figure 5.
The results of the environmental performance assessment of 3 municipalities.

Figure 6.
The database system for the EcoCitOpia platform.


Table 1.
Review of environmental indicators of the nine criteria included in this study.
| Criteria | Initiator | Spatial Scope | Indicator | Index Score | Result |
|---|---|---|---|---|---|
| 1. UEE [6] | Ambiente Italia | Europe/32 | Air quality, Acoustic environment, Water, Energy, Waste, Transport, Green areas and land use, Building, CO2, Health, Equity, Education, Participation | 0–100 | Spider-web diagram |
| 2. EGCI [6,14] | EIU | Europe/30 | CO2, Energy, Building, Transport, Water, Waste and land use, Air quality | 0–10 | Spider-web diagram |
| 3. EGCA [6,14] | European Commission | Europe | Climate change, Local transport, Green urban areas, Nature and biodiversity, Air quality, Quality of acoustic environment, Waste, Water, Wastewater, Eco-innovation, Energy, Environmental management | 0–100 | Spider-web diagram |
| 4. SCI [25] | Arcadis | World | Green spaces, Energy, Air pollution, Greenhouse gas emissions, Waste management, Drinking water | 0–100 | Spider-web diagram |
| 5. SDGs (6, 7, 11, 12, 13, 16) [26,27] | United Nations | World | Water, Wastewater, Energy, Building, Transport, Air quality, Waste, Green areas and land use, Education, Equity, Safety, Health, Participation | 0–100 | Spider-web diagram |
| 6. AESCA [28] | ASEAN | ASEAN | Clean air, Clean land, and Clean water | 0–100 | N/A |
| 7. LPA (Section 4) [29] | DLA | Thailand | CO2, Water, Waste, Air, Energy, Green areas | 0, 1, 3, 5 | N/A |
| 8. ESC [30] | DEQP | Thailand | Water, Air, Energy, Wastewater, Waste, Green areas | 0, 1, 3, 5 | N/A |
| 9. Eco-City [31] | ONEP | Thailand | Water, Energy, Wastewater, Waste, Air, Green areas | 0, 1, 3, 5 | N/A |
Table 2.
The result of classifying categories of environment indicators for municipalities.
| Criteria | Category 1 | |||||
|---|---|---|---|---|---|---|
| C | E | WSS | SW | AQ | GL | |
| LPA | ✓ | ✓ | ✓ | ✓ | ✓ | ✓ |
| ESC | ✓ | ✓ | ✓ | ✓ | ✓ | ✓ |
| AESCA | ✓ | ✓ | ✓ | ✓ | ||
| Eco-city | ✓ | ✓ | ✓ | ✓ | ✓ | ✓ |
| SDGs | ✓ | ✓ | ✓ | ✓ | ||
1 C = Greenhouse gases, E = Energy, WSS = Water supply and sanitation, SW = Solid waste, A = Air quality, GL = Green area and land use.
Table 3.
List of categories and indicators.
| Category | Indicator | Description |
|---|---|---|
| Energy | Electricity consumption | Total annual electricity consumption, in kilowatt-hour (kWh) per capita. |
| CO2 | CO2 emissions | Total annual greenhouse gas emissions, in tonnes per capita. |
| Water | Water consumption | Total annual water consumption, in cubic meters (m3) per capita. |
| Wastewater treatment | Percentage of households connected to the sewage system. | |
| Wastewater management efficiency | Percentage of the total annual amount of wastewater entering the treatment system. | |
| Wastewater treatment system efficiency | Quality of treated wastewater in milligram per liter (mg/L). | |
| Waste | Municipal waste production | Total annual municipal waste collected, in kilogram (kg) per capita. |
| Municipal waste recycling | Percentage of municipal waste recycled. | |
| Air | Air quality | Annual daily mean of CO, NO2, O3, SO2, Pb, PM10, and PM2.5 emissions in microgram per cubic meters (μg/m3). |
| Green area | Green area | Green area, in square meters per capita. |
Table 4.
Scoring criteria for assessing performance in each of the indicators.
| Indicators | Score | Total | |||||
|---|---|---|---|---|---|---|---|
| LPA | Eco-city | CES | AESCA | SDGs | Advance | ||
| Energy | 6 | 5 | 13 | - | 6 | 6 | 36 |
| CO2 | 5 | 7 | 16 | - | 6 | 7 | 41 |
| Waste | 8 | 9 | 12 | 6 | 9 | 12 | 56 |
| Water | 7 | 6 | 10 | 5 | 6 | 8 | 42 |
| Air | 3 | 2 | 11 | - | 3 | 10 | 29 |
| Green space | 2 | 4 | 3 | 2 | 3 | 2 | 16 |
Publisher’s Note: MDPI stays neutral with regard to jurisdictional claims in published maps and institutional affiliations. |
© 2021 by the authors. Licensee MDPI, Basel, Switzerland. This article is an open access article distributed under the terms and conditions of the Creative Commons Attribution (CC BY) license (https://creativecommons.org/licenses/by/4.0/).
Share and Cite
MDPI and ACS Style
Kongboon, R.; Gheewala, S.H.; Sampattagul, S. Empowering a Sustainable City Using Self-Assessment of Environmental Performance on EcoCitOpia Platform. Sustainability 2021, 13, 7743. https://0-doi-org.brum.beds.ac.uk/10.3390/su13147743
AMA Style
Kongboon R, Gheewala SH, Sampattagul S. Empowering a Sustainable City Using Self-Assessment of Environmental Performance on EcoCitOpia Platform. Sustainability. 2021; 13(14):7743. https://0-doi-org.brum.beds.ac.uk/10.3390/su13147743
Chicago/Turabian StyleKongboon, Ratchayuda, Shabbir H. Gheewala, and Sate Sampattagul. 2021. "Empowering a Sustainable City Using Self-Assessment of Environmental Performance on EcoCitOpia Platform" Sustainability 13, no. 14: 7743. https://0-doi-org.brum.beds.ac.uk/10.3390/su13147743
Note that from the first issue of 2016, this journal uses article numbers instead of page numbers. See further details here.