
Prioritization and Analysis of Watershed: A Study Applied to Municipal Solid Waste

 ,
,
Abstract
:1. Introduction
2. Materials and Methods
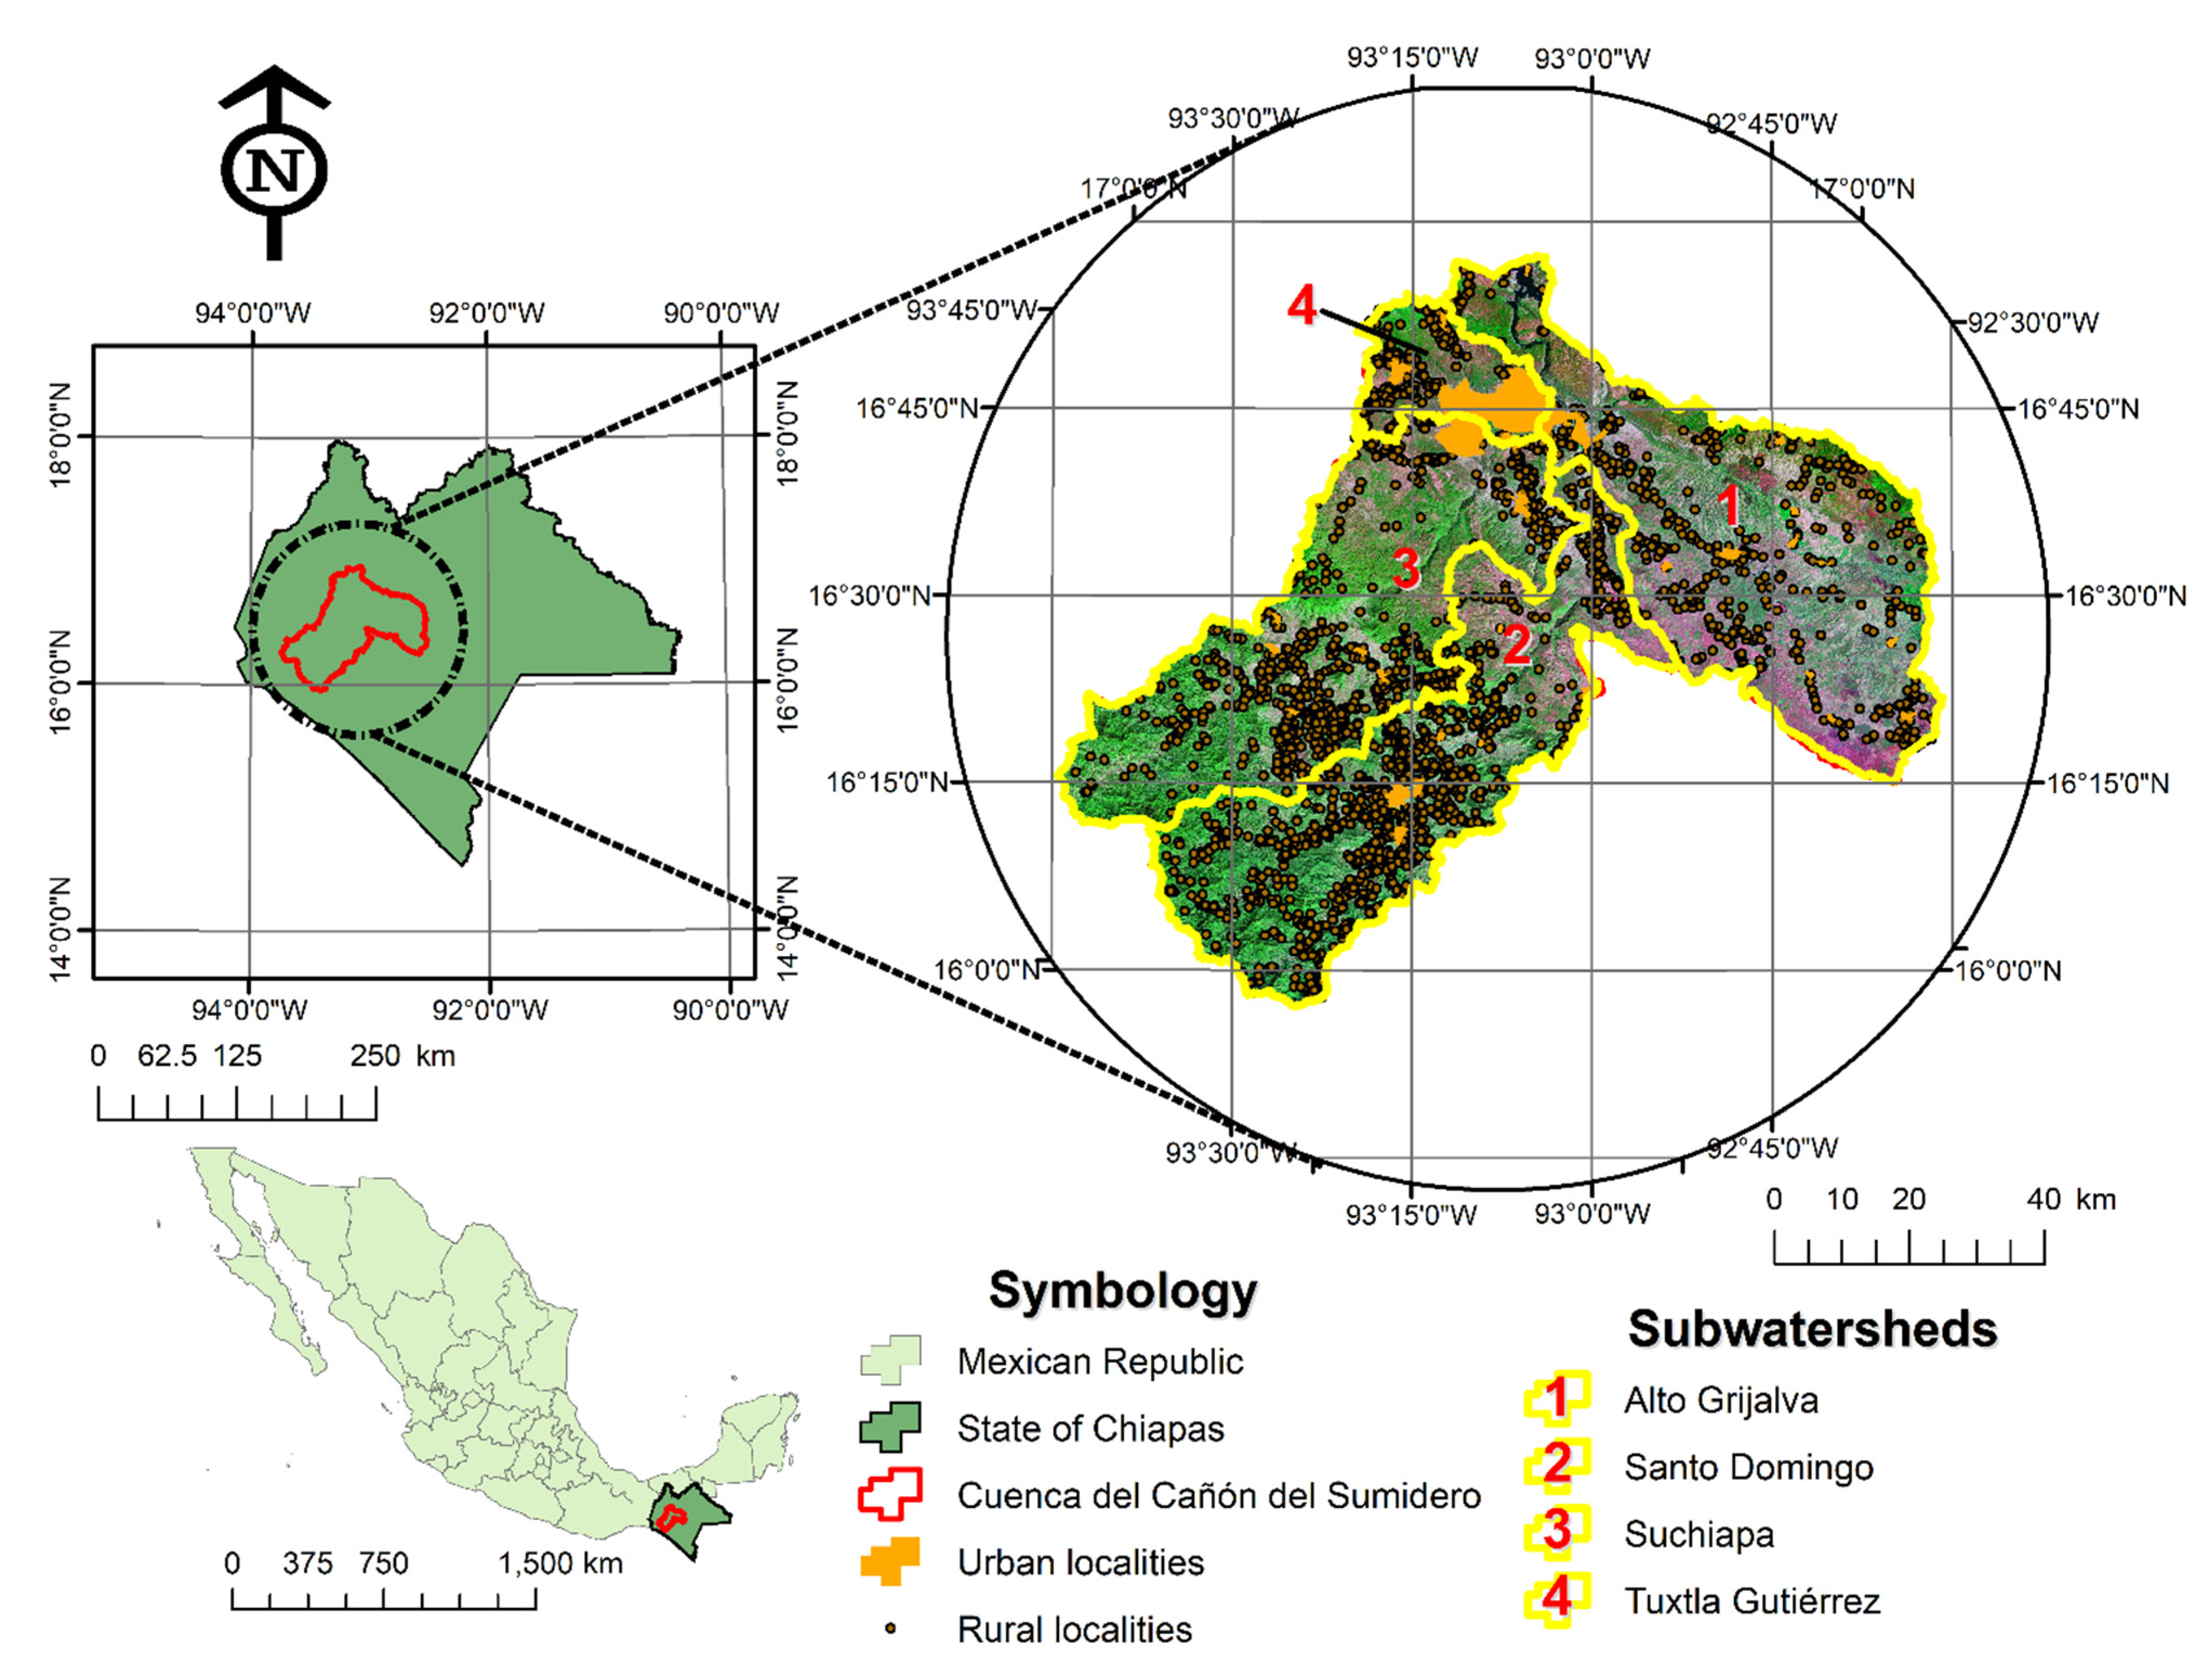
2.1. Description of the Study Area
2.2. Description of the Prioritization Index
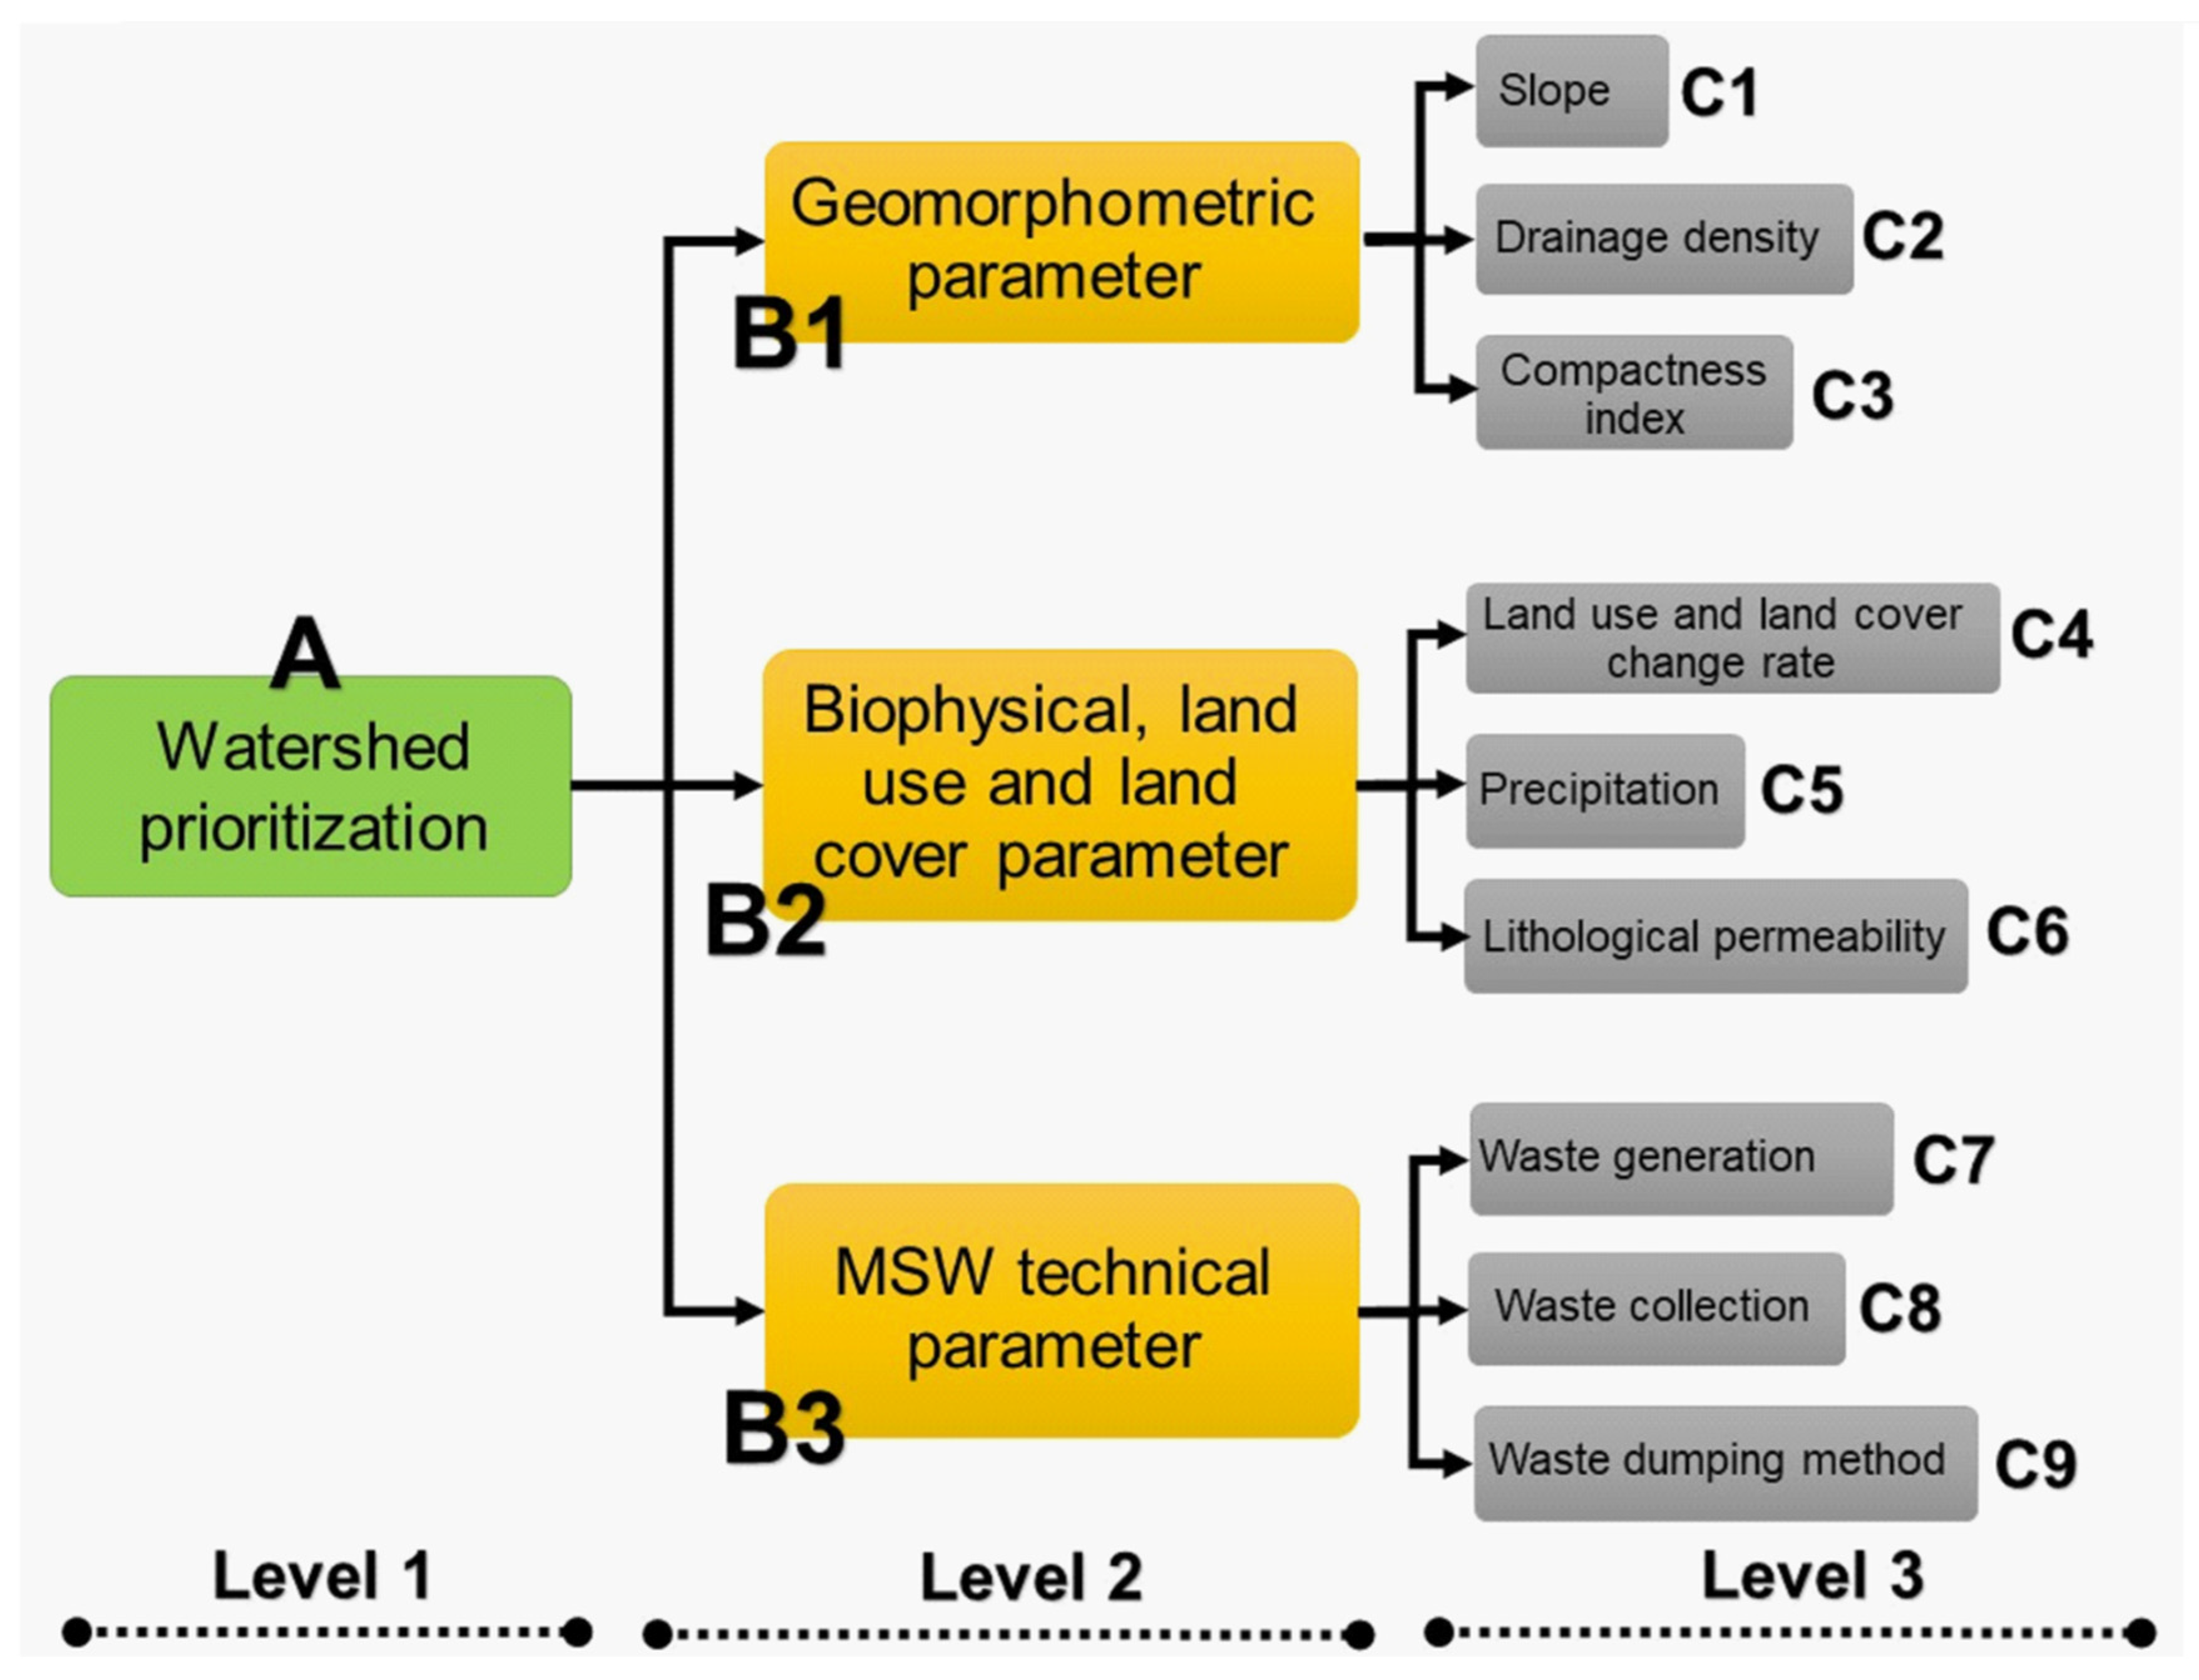
2.3. Construction of the Prioritization Index
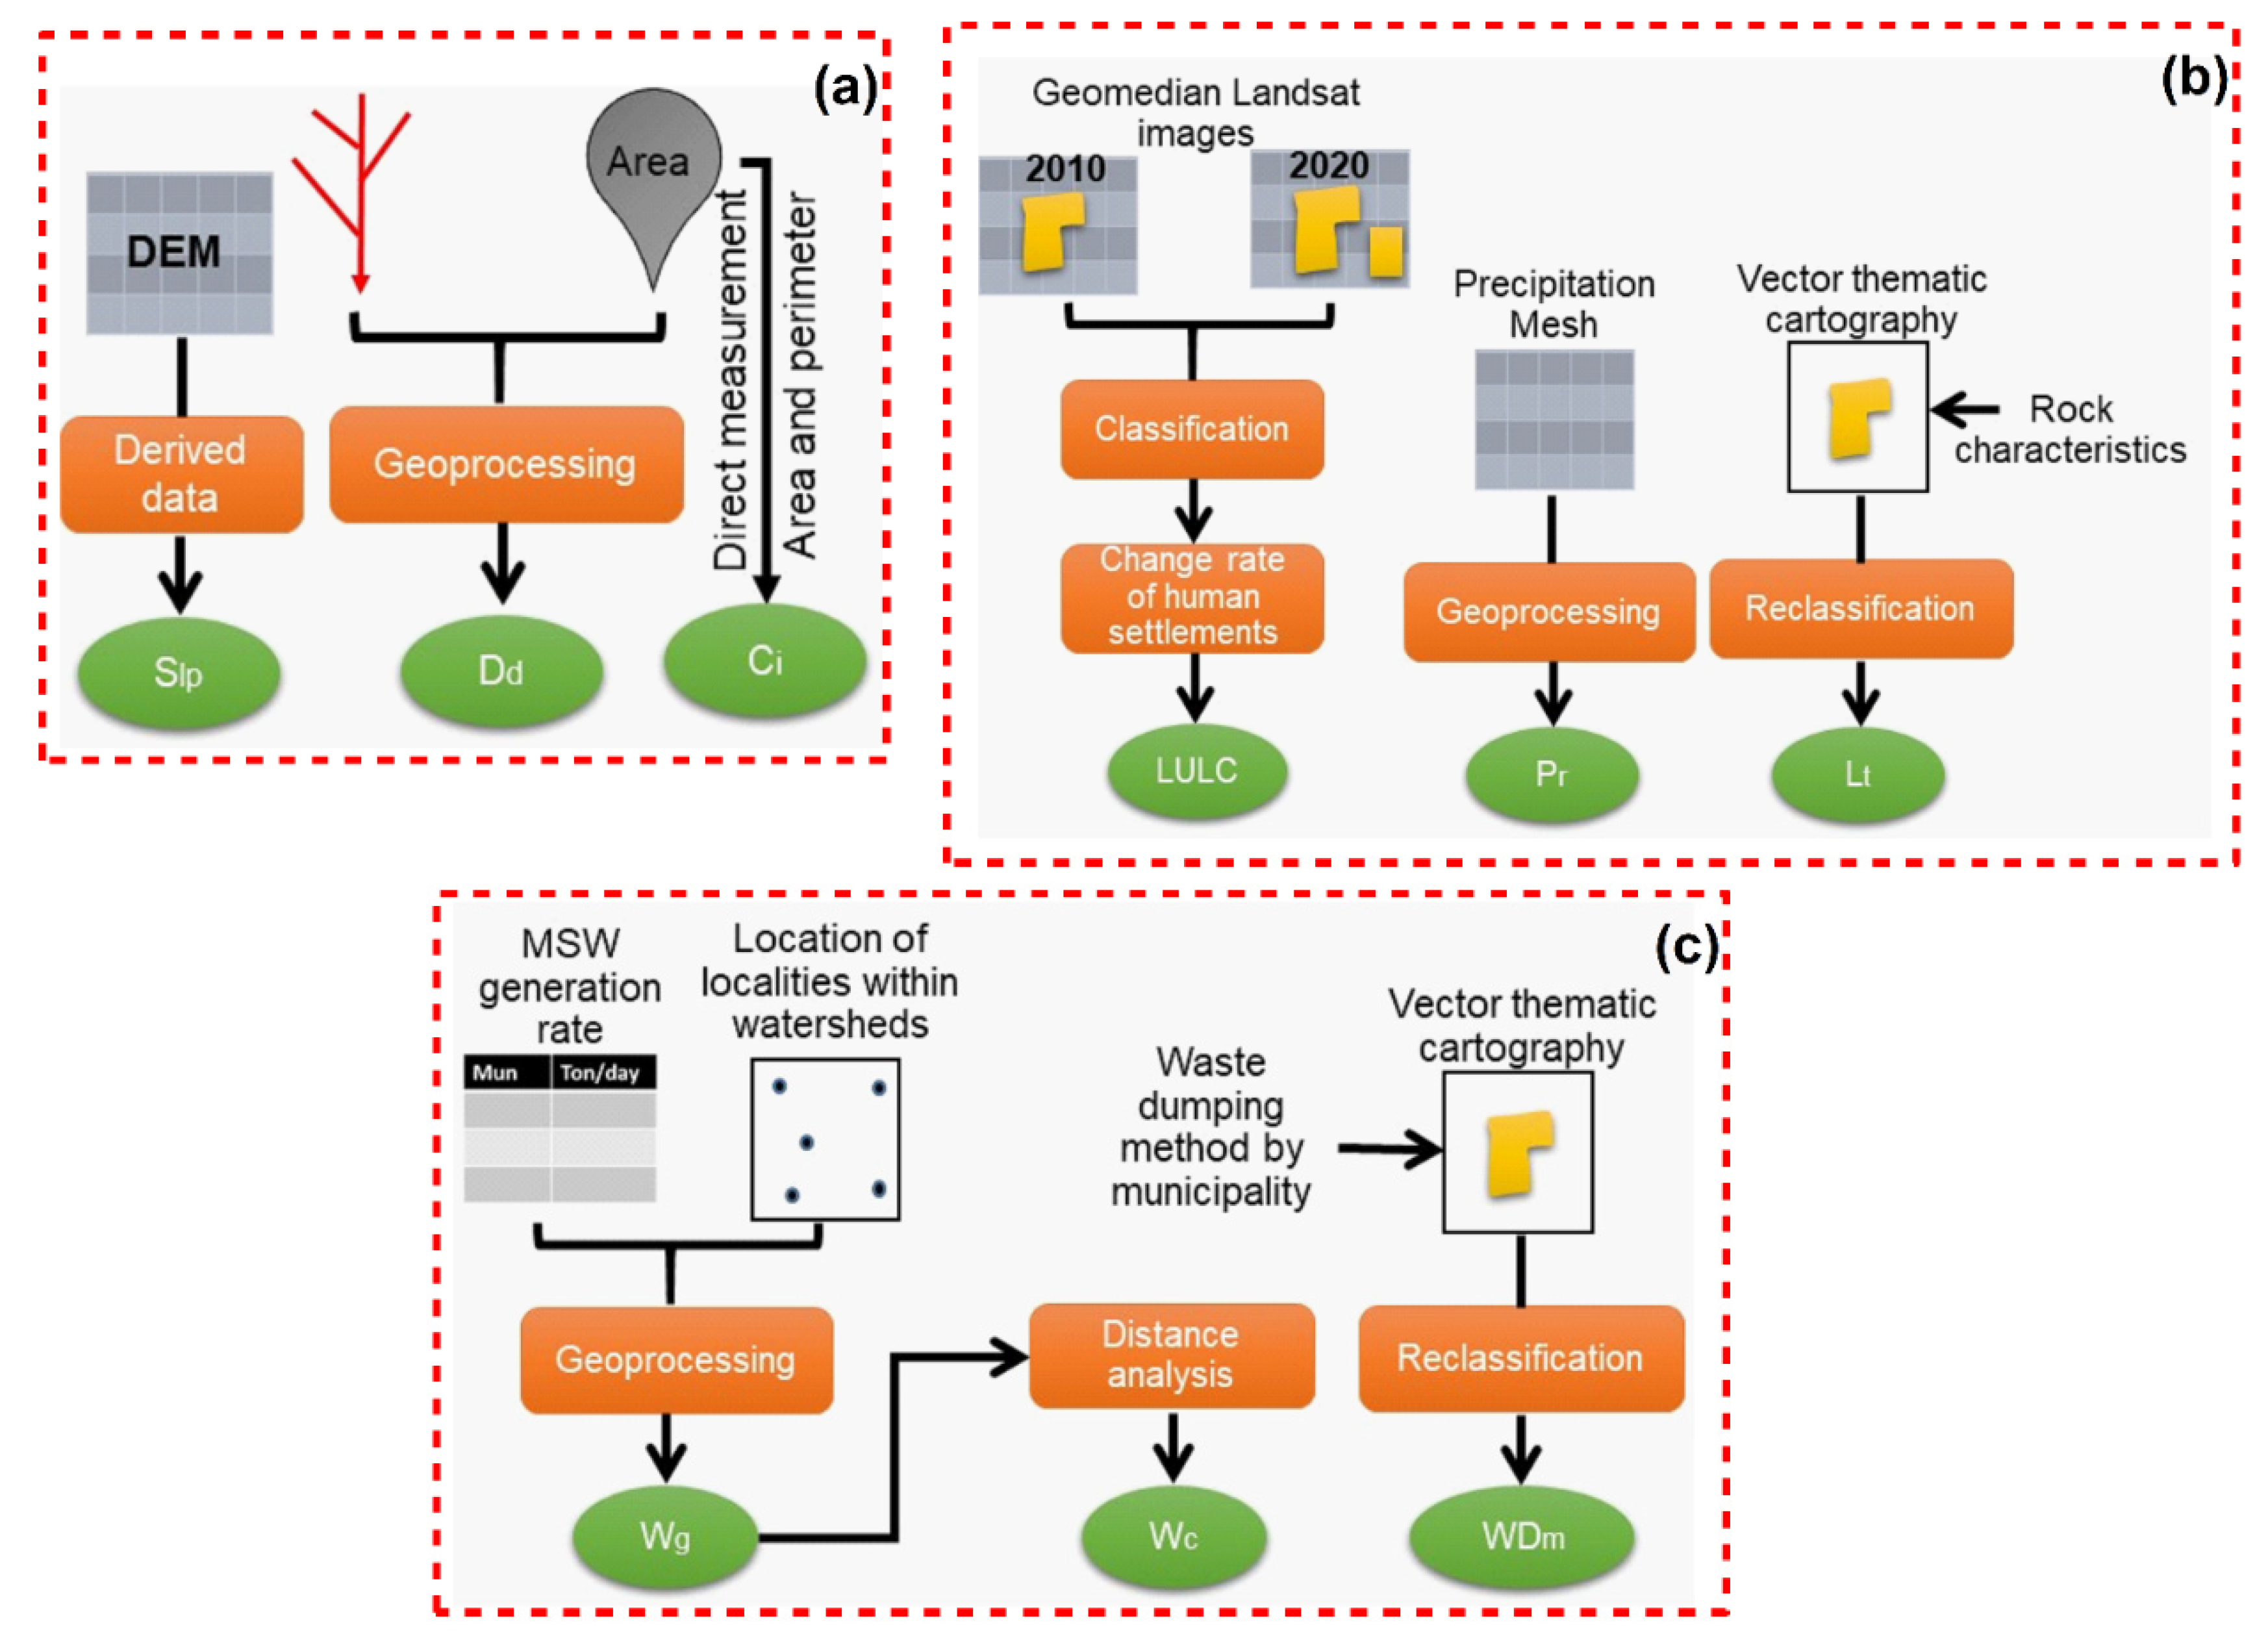
2.4. Techniques and Data Used to Build the Variables
3. Results and Discussion
3.1. Comments about Parameter and Variable Weights
3.2. General Analysis of the CCS Watershed
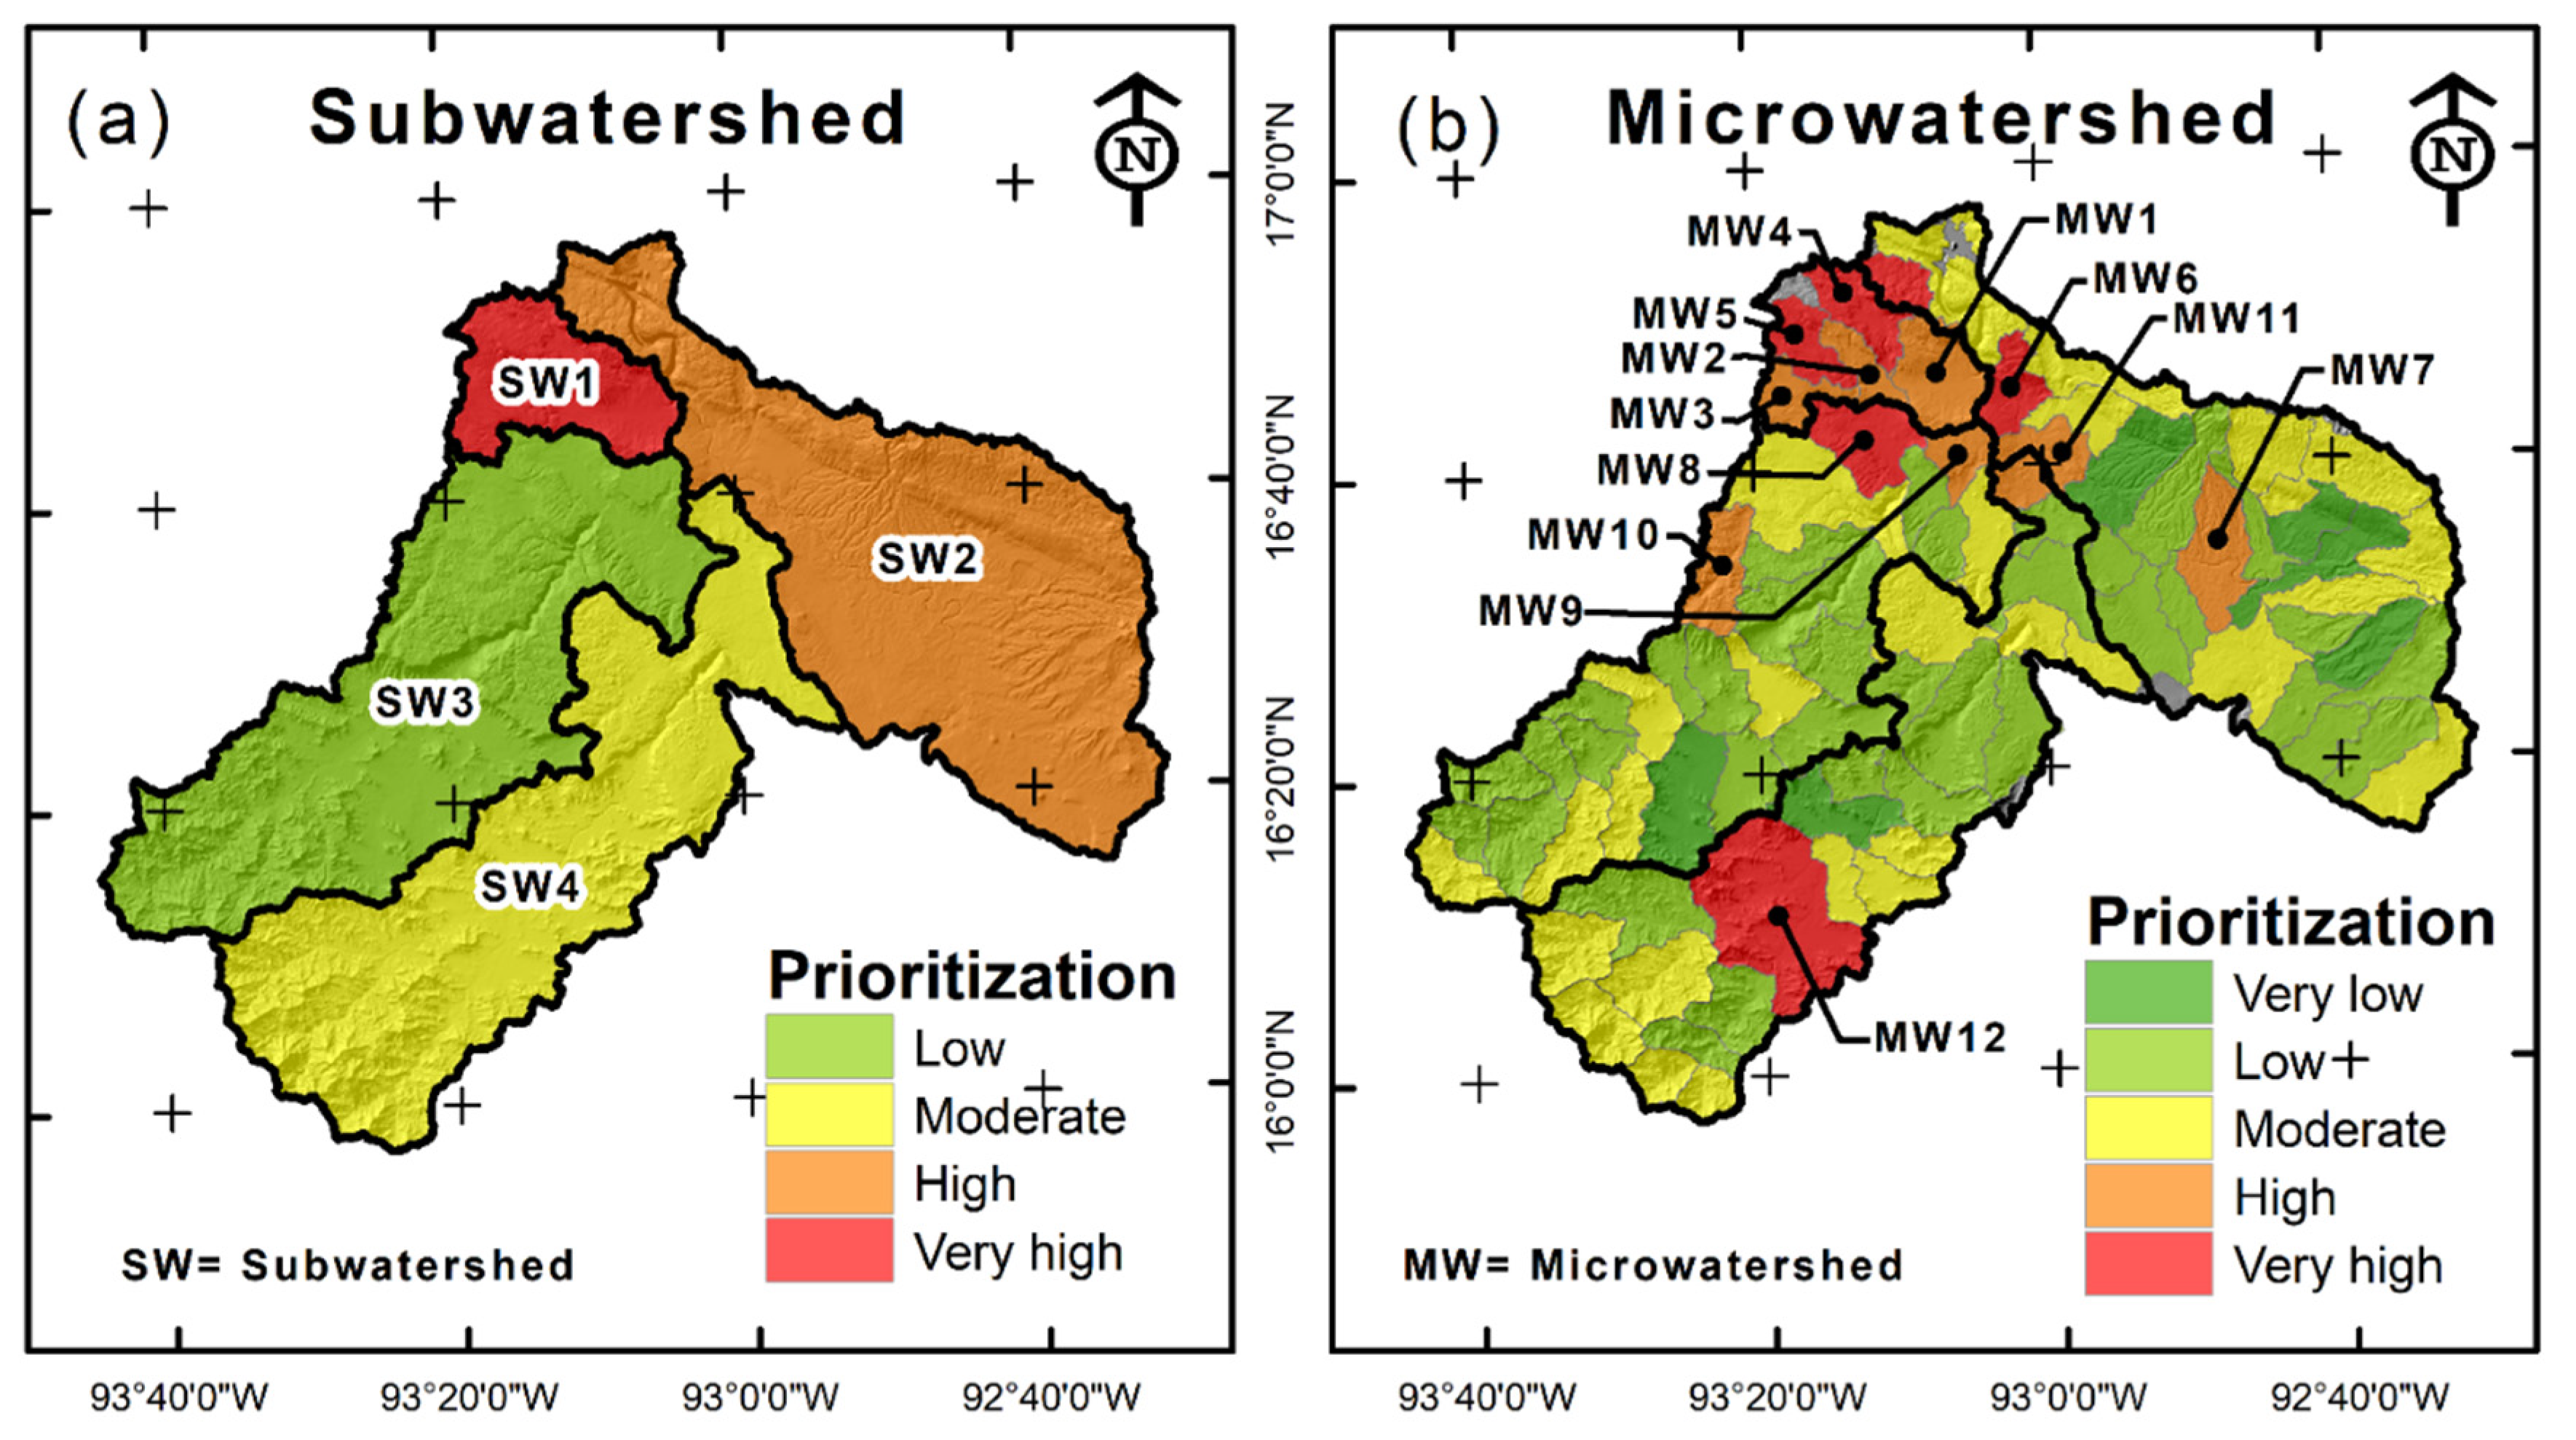
3.3. Detailed Analysis in Subwatersheds and Microwatersheds
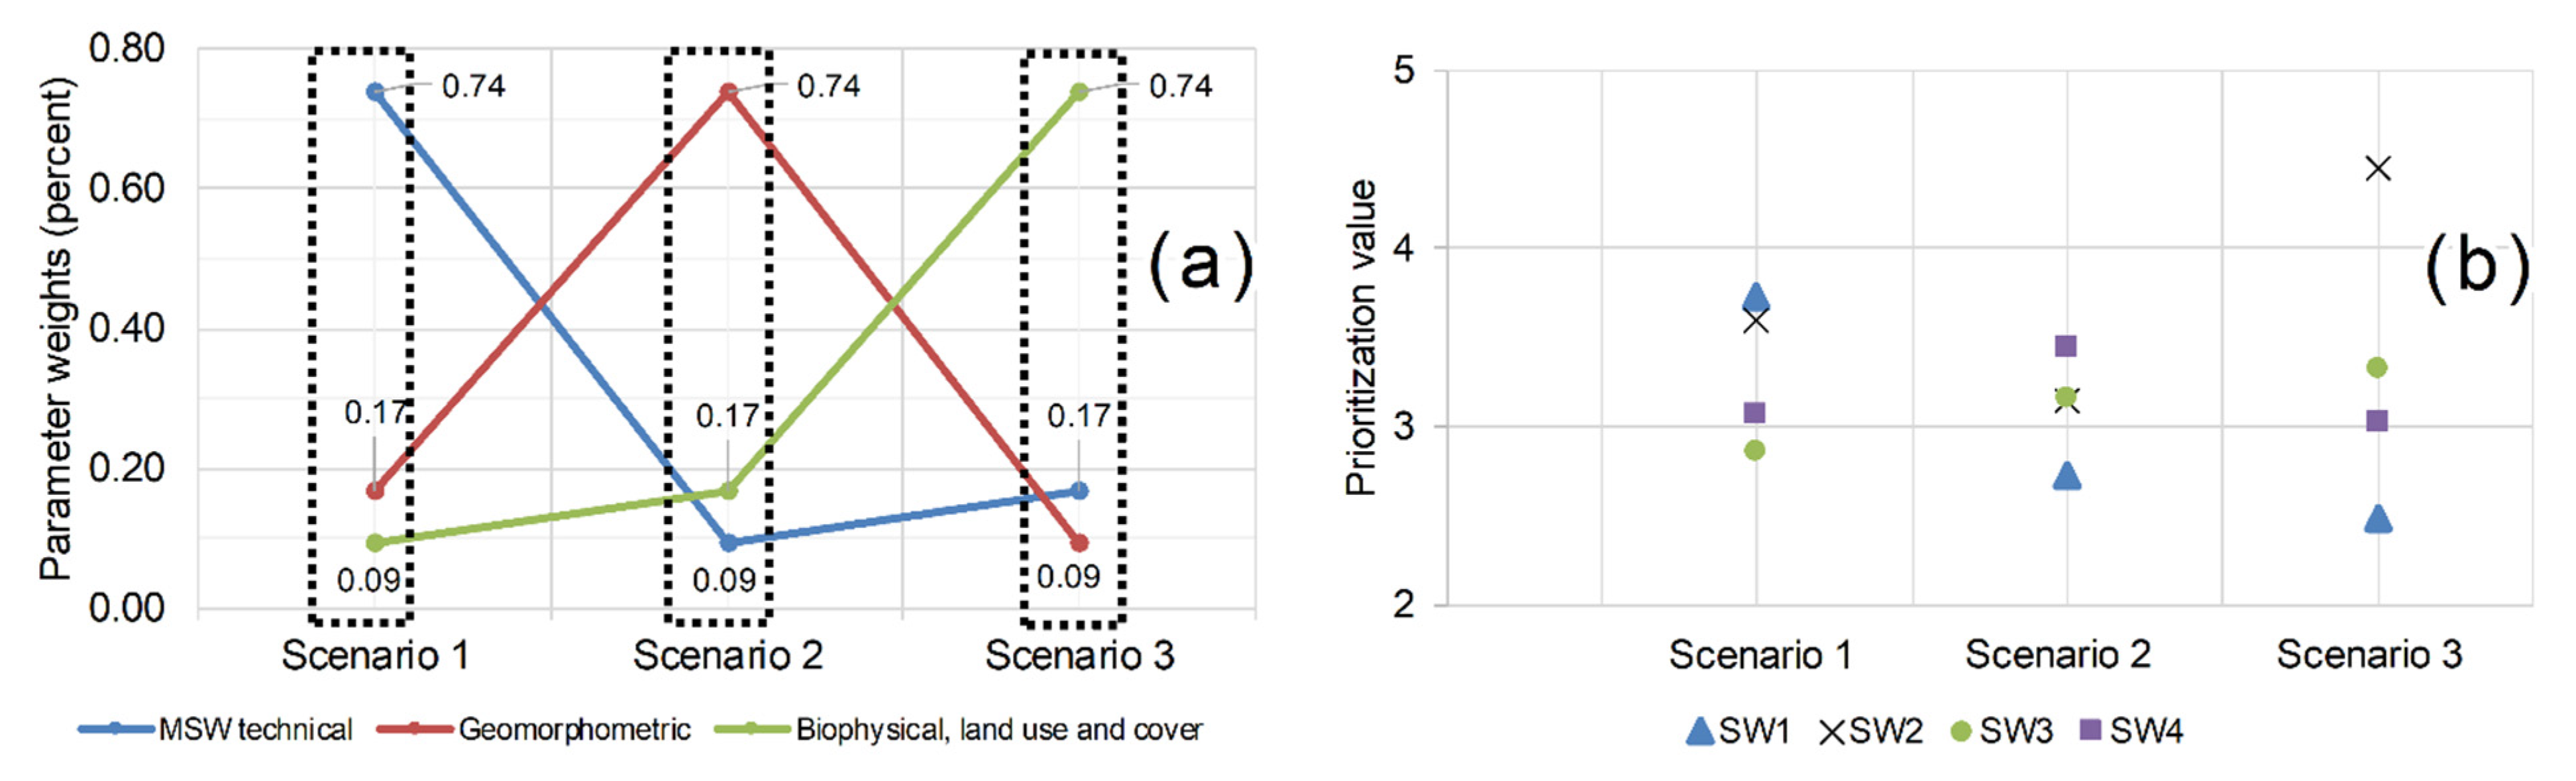
3.4. Sensitivity Analysis
3.5. Policies within the CCS
4. Conclusions
Author Contributions
Funding
Institutional Review Board Statement
Informed Consent Statement
Data Availability Statement
Acknowledgments
Conflicts of Interest
References
- Cotler, H.; Garrido, A.; Mondragón, R.; Díaz, A. Delimitación de Cuencas Hidrográficas de México, a Escala 1:250,000; INEGI-INE-CONAGUA: México, 2007; p. 35. [Google Scholar]
- Edwards, P.; Williard, K.; Schoonover, J. Fundamentals of Watershed Hydrology. J. Contemp. Water Res. Educ. 2015, 154, 3–20. [Google Scholar] [CrossRef]
- Dourojeanni, A.; Jouravlev, A.; Chávez, G. Gestión del agua a nivel de cuencas: Teoría y práctica; Naciones Unidas-División de Recursos Naturales e Infraestructura—Comisión Económica para América Latina y el Caribe (CEPAL): Santiago de Chile, Chile, 2002; p. 83. [Google Scholar]
- USEPA. Watershed Approach Framework; EPA 840-S-96-001; Office of Water (4501F) U.S. EPA: Washington, DC, USA, 1996. [Google Scholar]
- Wang, G.; Mang, S.; Cai, H.; Liu, S.; Zhang, Z.; Wang, L.; Innes, J. Integrated watershed management: Evolution, development and emerging trends. J. For. Res. 2016, 27, 967–994. [Google Scholar] [CrossRef] [Green Version]
- Wang, X. Integrating water-quality management and land-use planning in a watershed context. J. Environ. Manag. 2001, 61, 25–36. [Google Scholar] [CrossRef]
- Welde, K. Identification and prioritization of subwatersheds for land and water management in Tekeze dam watershed, Northern Ethiopia. Int. Soil Water Conserv. Res. 2016, 4, 30–38. [Google Scholar] [CrossRef] [Green Version]
- Wolancho, K. Evaluating watershed management activities of campaign work in Southern nations, nationalities and peoples’ regional state of Ethiopia. Environ. Syst. Res. 2015, 4, 1–13. [Google Scholar] [CrossRef] [Green Version]
- Lin, C.; Chen, T.; Lin, C. Risk models for assessing the derived disasters caused by watershed landslides using environmental indicators. Geomat. Nat. Hazards Risk 2020, 11, 318–334. [Google Scholar] [CrossRef] [Green Version]
- Malekian, A.; Azarnivand, A. Application of Integrated Shannon’s Entropy and VIKOR Techniques in Prioritization of Flood Risk in the Shemshak Watershed, Iran. Water Resour. Manag. 2015, 30, 409–425. [Google Scholar] [CrossRef]
- Pourghasemi, H.; Gayen, A.; Edalat, M.; Zarafshar, M. Is multi-hazard mapping effective in assessing natural hazards and integrated watershed management? Geosci. Front. 2020, 11, 1203–1217. [Google Scholar] [CrossRef]
- Yulianto, F.; Prasasti, I.; Pasaribu, J.; Fitriana, H.; Zylshal; Haryani, N.; Sofan, P. The dynamics of land use/land cover change modeling and their implication for the flood damage assessment in the Tondano watershed, North Sulawesi, Indonesia. Model. Earth Syst. Environ. 2016, 2, 1–20. [Google Scholar] [CrossRef]
- Jabbar, F.; Grote, K.; Tucker, R. A novel approach for assessing watershed susceptibility using weighted overlay and analytical hierarchy process (AHP) methodology: A case study in Eagle Creek Watershed, USA. Environ. Sci. Pollut. Res. 2019, 26, 31981–31997. [Google Scholar] [CrossRef] [Green Version]
- Peacock, B.; Hikuroa, D.; Morgan, T. Watershed-scale prioritization of habitat restoration sites for non-point source pollution management. Ecol. Eng. 2012, 42, 174–182. [Google Scholar] [CrossRef]
- Templar, H.; Dila, D.; Bootsma, M.; Corsi, S.; McLellan, S. Quantification of human-associated fecal indicators reveal sewage from urban watersheds as a source of pollution to Lake Michigan. Water Res. 2016, 100, 556–567. [Google Scholar] [CrossRef] [PubMed]
- Torres, B.; González, G.; Rustrían, E.; Houbron, E. Enfoque de cuenca para la identificación de fuentes de contaminación y evaluación de la calidad de un río, Veracruz, México. Rev. Int. Contam. Ambient. 2013, 29, 135–146. [Google Scholar]
- Zhao, X.; Dai, J.; Wang, J. GIS-based evaluation and spatial distribution characteristics of land degradation in Bijiang watershed. SpringerPlus 2013, 2, 1–8. [Google Scholar] [CrossRef] [PubMed] [Green Version]
- Araiza, J.; Chávez, J.; Moreno, J.; Rojas, M. Municipal Solid Waste Management in a Municipality of Chiapas, Mexico. Soc. Sci. 2017, 6, 133–140. [Google Scholar] [CrossRef] [Green Version]
- da Silva Alcântara Fratta, K.; de Campos Leite Toneli, J.; Colato Antonio, G. Diagnosis of the management of solid urban waste of the municipalities of ABC Paulista of Brasil through the application of sustainability indicators. Waste Manag. 2019, 85, 11–17. [Google Scholar] [CrossRef] [PubMed]
- Korai, M.; Ali, M.; Lei, C.; Mahar, R.; Yue, D. Comparison of MSW management practices in Pakistan and China. J. Mater. Cycles Waste 2020, 22, 443–453. [Google Scholar] [CrossRef]
- Pujara, Y.; Pathak, P.; Sharma, A.; Govani, J. Review on Indian Municipal Solid Waste Management practices for reduction of environmental impacts to achieve sustainable development goals. J. Environ. Manag. 2019, 248, 109238. [Google Scholar] [CrossRef] [PubMed]
- Araiza, J.; Chávez, J.; Moreno, J. Cuantificación de residuos sólidos urbanos generados en la cabecera municipal de Berriozábal, Chiapas. Rev. Int. Contam. Ambient. 2017, 33, 691–699. [Google Scholar] [CrossRef] [Green Version]
- Ugwu, C.; Ozoegwu, C.; Ozor, P. Solid waste quantification and characterization in university of Nigeria, Nsukka campus, and recommendations for sustainable management. Heliyon 2020, 6, e04255. [Google Scholar] [CrossRef]
- Araiza, J.; Nájera, H.; Gutiérrez, R.; Rojas, M. Emplacement of solid waste management infrastructure for the Frailesca region, Chiapas, México, using GIS tools. Egypt. J. Remote Sens. Space Sci. 2018, 21, 391–399. [Google Scholar] [CrossRef]
- Vu, H.; Ng, K.; Fallah, B.; Richter, A.; Kabir, G. Interactions of residential waste composition and collection truck compartment design on GIS route optimization. Waste Manag. 2020, 102, 613–623. [Google Scholar] [CrossRef] [PubMed]
- Betanzo, E.; Torres, M.; Romero, J.; Obregón, S. Evaluación de rutas de recolección de residuos sólidos urbanos con apoyo de dispositivos de rastreo satelital: Análisis e implicaciones. Rev. Int. Contam. Ambient. 2016, 32, 323–337. [Google Scholar] [CrossRef] [Green Version]
- Ağacsapan, B.; Cabuk, S. Determination of suitable waste transfer station areas for sustainable territories: Eskisehir case. Sustain. Cities Soc. 2020, 52, 101829. [Google Scholar] [CrossRef]
- Silpa, K.; Yao, L.; Bhada-Tata, P.; Van Woerden, F. Urban Development. In What a Waste 2.0: A Global Snapshot of Solid Waste Management to 2050; World Bank: Washington, DC, USA, 2018; p. 272. [Google Scholar]
- Javed, A.; Khanday, M.; Ahmed, R. Prioritization of Sub-watersheds based on Morphometric and Land Use Analysis using Remote Sensing and GIS Techniques. J. Indian Soc. Remote Sens. 2009, 37, 261–274. [Google Scholar] [CrossRef]
- Adinarayana, J.; Krishna, N.; Rao, G. An Integrated Approach for Prioritisation of Watersheds. J. Environ. Manag. 1995, 44, 375–384. [Google Scholar] [CrossRef]
- Olguín, J.; Pineda, R. Importancia de la priorización hidrológica en la toma de decisiones de manejo en la subcuenca del Río Ayuquila, Jalisco, México. Digit. Cienc. UAQRO 2010, 3, 42–51. [Google Scholar]
- Gaspari, F.; Rodriguez, A.; Senisterra, G.; Denegri, G.; Delgado, M.; Besteiro, S. Morphometric characterization of the upper watershed of the Sauce Grande river, Buenos Aires, Argentina. AUGM DOMUS Buenos Aires Argent. 2012, 45, 4143–4158. [Google Scholar]
- Badar, B.; Romshoo, S.; Khan, M. Integrating biophysical and socioeconomic information for prioritizing watersheds in a Kashmir Himalayan lake: A remote sensing and GIS approach. Environ. Monit. Assess. 2013, 185, 6419–6445. [Google Scholar] [CrossRef] [PubMed]
- Javed, A.; Khanday, M.; Rais, S. Watershed Prioritization Using Morphometric and Land Use/Land Cover Parameters: A Remote Sensing and GIS Based Approach. J. Geol. Soc. India 2011, 78, 63–75. [Google Scholar] [CrossRef]
- Puno, G.; Puno, R. Watershed conservation prioritization using geomorphometric and land use-land cover parameters. Glob. J. Environ. Sci. Manag. 2019, 5, 279–294. [Google Scholar] [CrossRef]
- Rahmati, O.; Haghizadeh, A.; Stefanidis, S. Assessing the Accuracy of GIS-Based Analytical Hierarchy Process for Watershed Prioritization; Gorganrood River Basin, Iran. Water Resour. Manag. 2016, 30, 1131–1150. [Google Scholar] [CrossRef]
- Singh, N.; Singh, K. Geomorphological analysis and prioritization of sub-watersheds using Snyder’s synthetic unit hydrograph method. Appl. Water Sci. 2014, 7, 275–283. [Google Scholar] [CrossRef] [Green Version]
- CONAGUA. Plan de Manejo Integral de la Cuenca del Cañón del Sumidero, Chiapas, México; CONAGUA-Gobierno del estado de Chiapas: Chiapas, Mexico, 2009; p. 88. [Google Scholar]
- Gis Geek. Descarga de Datos Geográficos México. Available online: http://sig-geek.blogspot.com/2016/02/descarga-de-datos-geograficos-mexico.html (accessed on 23 January 2021).
- CONABIO—Sistema Nacional de Información sobre Biodiversidad—Portal de Geoinformación. Available online: http://www.conabio.gob.mx/informacion/gis/ (accessed on 10 June 2020).
- CONANP. Estudio Previo Justificativo para Modificar el Decreto del Área Natural Protegida Parque Nacional Cañón del Sumidero; Comisión Nacional de Área Naturales Protegidas: Chiapas, Mexico, 2012; p. 102. [Google Scholar]
- Castañón, J.; Abraján, P. Análisis de la calidad del agua superficial del río Sabinal, Tuxtla Gutiérrez, Chiapas, México. Lacandonia Rev. Ciencias UNICACH 2009, 3, 67–77. [Google Scholar]
- Ecobiosfera. Estudio de Calidad del Agua en el Parque Nacional Cañón del Sumidero y su Zona de Influencia; Ecobiosfera El Triunfo: Chiapas, Mexico, 2009; p. 40. [Google Scholar]
- Araiza, J.; Cram, S.; Ruiz, N.; Oropeza, O.; Fernández, M.; Rojas, M. GIS-based approach to zoning the risk associated with municipal solid waste management: Application to regional scale. Environ. Monit. Assess. 2021, 1–20. [Google Scholar] [CrossRef]
- López, A. Impacto Ambiental Causado por Residuos Sólidos en el río Grijalva, Parque Nacional Cañón del Sumidero, Chiapas. Master’s Thesis, Universidad Nacional Autónoma de México, Ciudad de México, Mexico, 2015. [Google Scholar]
- Araiza, J. Modelado Espacial del Riesgo Sanitario-Ecológico, Derivado del mal Manejo de los Residuos Sólidos Urbanos, en los Municipios de la Cuenca del Cañón del Sumidero, Chiapas. Ph.D. Thesis, Universidad Nacional Autónoma de México, Ciudad de México, Mexico, 2019. [Google Scholar]
- Horton, R. Drainage-basin characteristics. Eos Trans. Am. Geophys. Union 1932, 13, 350–361. [Google Scholar] [CrossRef]
- Gravelius, H. Flusskunde; Goschen Verlagshandlug: Berlin, Germany, 1914; p. 176. [Google Scholar]
- CONABIO—Monitoreo de la Cobertura de Suelo. Available online: https://www.biodiversidad.gob.mx/monitoreo/cobertura-suelo (accessed on 10 June 2020).
- SEMARNAT. Guía Para la Gestión Integral de los Residuos Sólidos Municipales; SEMARNAT: Mexico City, Mexico, 2001; p. 200. [Google Scholar]
- Saaty, T.L. The Analytic Hierarchy Process; McGraw-Hill: New York, NY, USA, 1980. [Google Scholar]
- Malczewski, J.; Rinner, C. Multicriteria Decision Analysis in Geographic Information Science; Springer: New York, NY, USA, 2015. [Google Scholar]
- CEIEG—Geoweb 3.0 Chiapas—Base de datos—Capas Temáticas. Available online: http://map.ceieg.chiapas.gob.mx/geoweb/ (accessed on 23 January 2021).
- INEGI—Continuo de Elevaciones Mexicano (CEM). Available online: https://www.inegi.org.mx/app/geo2/elevacionesmex/ (accessed on 10 June 2019).
- INEGI—Geomediana Landsat. Available online: https://www.inegi.org.mx/investigacion/geomediana/#Descargas (accessed on 21 January 2021).
- UNAM—Repositorio Institucional—Centro de Ciencias de la Atmosfera-Precipitación Acumulada Mensual Promedio (1902–2015). Available online: http://ri.atmosfera.unam.mx:8586/geonetwork/srv/spa/catalog.search#/metadata/8375be92-5d32-4221-a8bf-8c1c1e8e21ff (accessed on 15 January 2021).
- Araiza, J.; Rojas, M.; Aguilar, R. Forecast generation model of municipal solid waste using multiple linear regression. Global J. Environ. Sci. Manag. 2020, 6, 1–14. [Google Scholar] [CrossRef]
- CONAGUA—Simulador de Flujos de Agua de Cuencas Hidrográficas. Available online: http://antares.inegi.org.mx/analisis/red_hidro/siatl/ (accessed on 15 January 2021).
- INEGI—Censo de Población y Vivienda 2020. Available online: https://www.inegi.org.mx/programas/ccpv/2020/ (accessed on 1 November 2020).
- Butt, T.; Javadi, A.; Nunns, M.; Beal, C. Development of a conceptual framework of holistic risk assessment—Landfill as a particular type of contaminated land. Sci. Total Environ. 2016, 569, 815–829. [Google Scholar] [CrossRef] [Green Version]
- Jiménez, L.; Reynoso, R.; Velásquez, E. Evaluación de la integridad biótica del Río Sabinal, basado en el análisis de la comunidad de peces. In Agricultura Sostenible—Agrotecnia, Socio Economía, Impacto Ambiental, Enfoque Territorial; Galdámez, J., Guevara, F., Soto, L., López, J., Vázquez, M., Eds.; Universidad Autónoma de Chiapas-Sociedad Mexicana de Agricultura Sostenible-Instituto de Recursos Naturales-Colegio de Postgraduados, Tuxtla Gutiérrez: Chiapas, Mexico, 2009; Volume 6, pp. 719–727. [Google Scholar]
- SEMARNAT. Norma Oficial Mexicana NOM-083-SEMARNAT-2003—Especificaciones de Protección Ambiental para la Selección del sitio, Diseño, Construcción, Operación, Monitoreo, Clausura y obras Complementarias de un Sitio de Disposición Final de Residuos Sólidos Urbanos y de Manejo Especial. Diario Oficial de la Federación. 2004. Available online: https://www.profepa.gob.mx/innovaportal/file/1306/1/nom-083-semarnat-2003.pdf (accessed on 20 July 2021).
- DOF. Ley de Aguas Nacionales. Nueva Ley publicada en el Diario Oficial de la Federación el 1º de diciembre de 1992 con Última Reforma Publicada. 2020. Available online: http://www.diputados.gob.mx/LeyesBiblio/pdf/16_060120.pdf (accessed on 20 July 2021).
- CONAGUA. Guía Para la Constitución de Organismos Operadores Intermunicipales de Agua Potable, Drenaje, Alcantarillado, Tratamiento y Disposición de Aguas Residuales; CONAGUA-SEMARNAT-IMTA: Ciudad de México, Mexico, 2015; p. 78. [Google Scholar]
- ONYSC. Intermunicipal Cooperation and Consolidations: Exploring Opportunities for Savings and Improved Services Delivery; Office of the New York State Comptroller: Albany, NY, USA, 2003. [Google Scholar]
- Rodríguez, E.; Tuirán, R. La cooperación intermunicipal en México: Barreras e incentivos en la probabilidad de cooperar. Gestión y Política Pública 2006, 15, 393–409. [Google Scholar]
- Kolsut, B. Inter-municipal cooperation in waste management: The case of Poland. Quaestiones Geographicae 2016, 35, 91–104. [Google Scholar] [CrossRef] [Green Version]


| Numerical Value | Verbal Judgment |
|---|---|
| 1 | Equally important |
| 2 | Slightly more important |
| 3 | Moderately more important |
| 4 | Moderately to strongly more important |
| 5 | Strongly more important |
| 6 | Strongly to very strongly more important |
| 7 | Very strongly more important |
| 8 | Very strongly to extremely more important |
| 9 | Extremely more important |
| Level 1 | Level 2 1 | Weight | Level 3 2 | Weight |
|---|---|---|---|---|
| A | B1 | 0.17 | C1 | 0.45 |
| C2 | 0.48 | |||
| C3 | 0.07 | |||
| B2 | 0.09 | C4 | 0.79 | |
| C5 | 0.13 | |||
| C6 | 0.08 | |||
| B3 | 0.74 | C7 | 0.68 | |
| C8 | 0.20 | |||
| C9 | 0.12 |
| Variable | Levels/Classes | Nv 1 | |
|---|---|---|---|
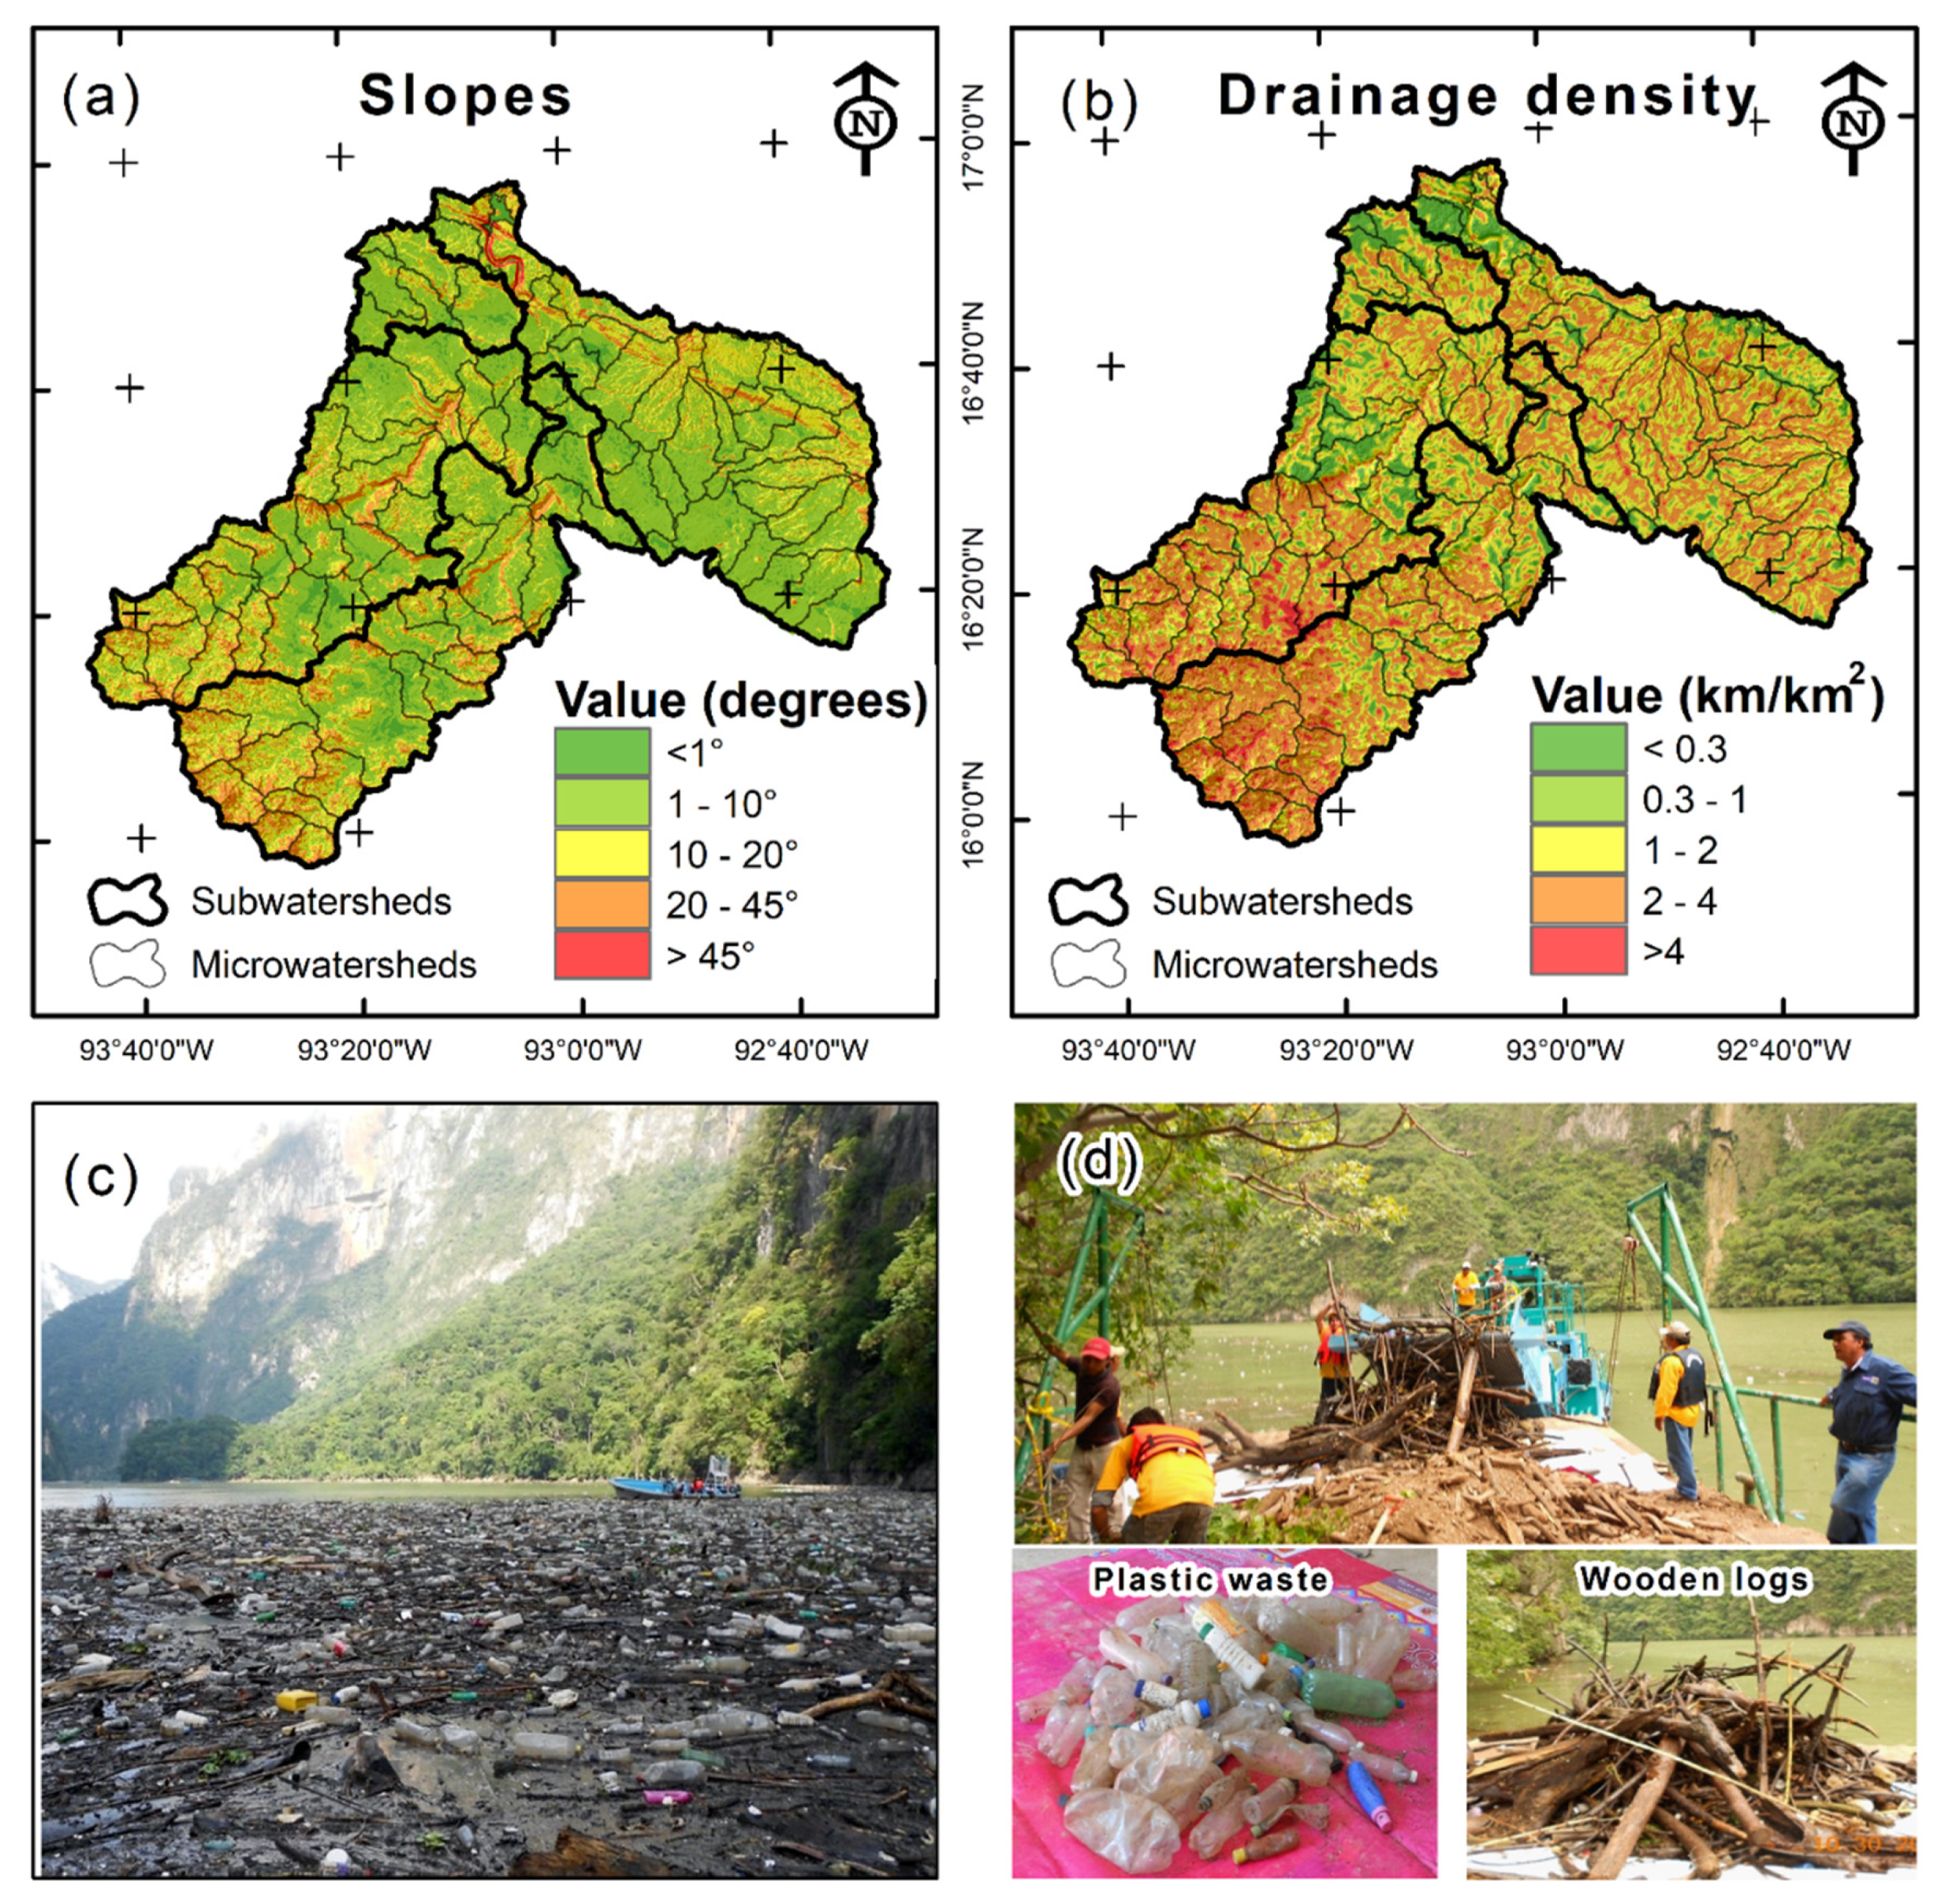
| C1 | Slope | <1° | 1 |
| 1–10° | 2 | ||
| 10–20° | 3 | ||
| 20–45° | 4 | ||
| >45° | 5 | ||
| C2 | Drainage density | <0.3 km/km2 | 1 |
| 0.3–1 km/km2 | 2 | ||
| 1–2 km/km2 | 3 | ||
| 2–4 km/km2 | 4 | ||
| > 4 km/km2 | 5 | ||
| C3 | Compactness index | Kc = 1.00–1.25 | 1 |
| Kc = 1.25–1.50 | 3 | ||
| Kc = 1.50–1.75 | 5 | ||
| C4 | Land use and land cover change rate | 0.00–1.00% | 1 |
| 1.00–2.00% | 2 | ||
| 2.00–3.00% | 3 | ||
| 3.00–4.00% | 4 | ||
| 4.00–5.00% | 5 | ||
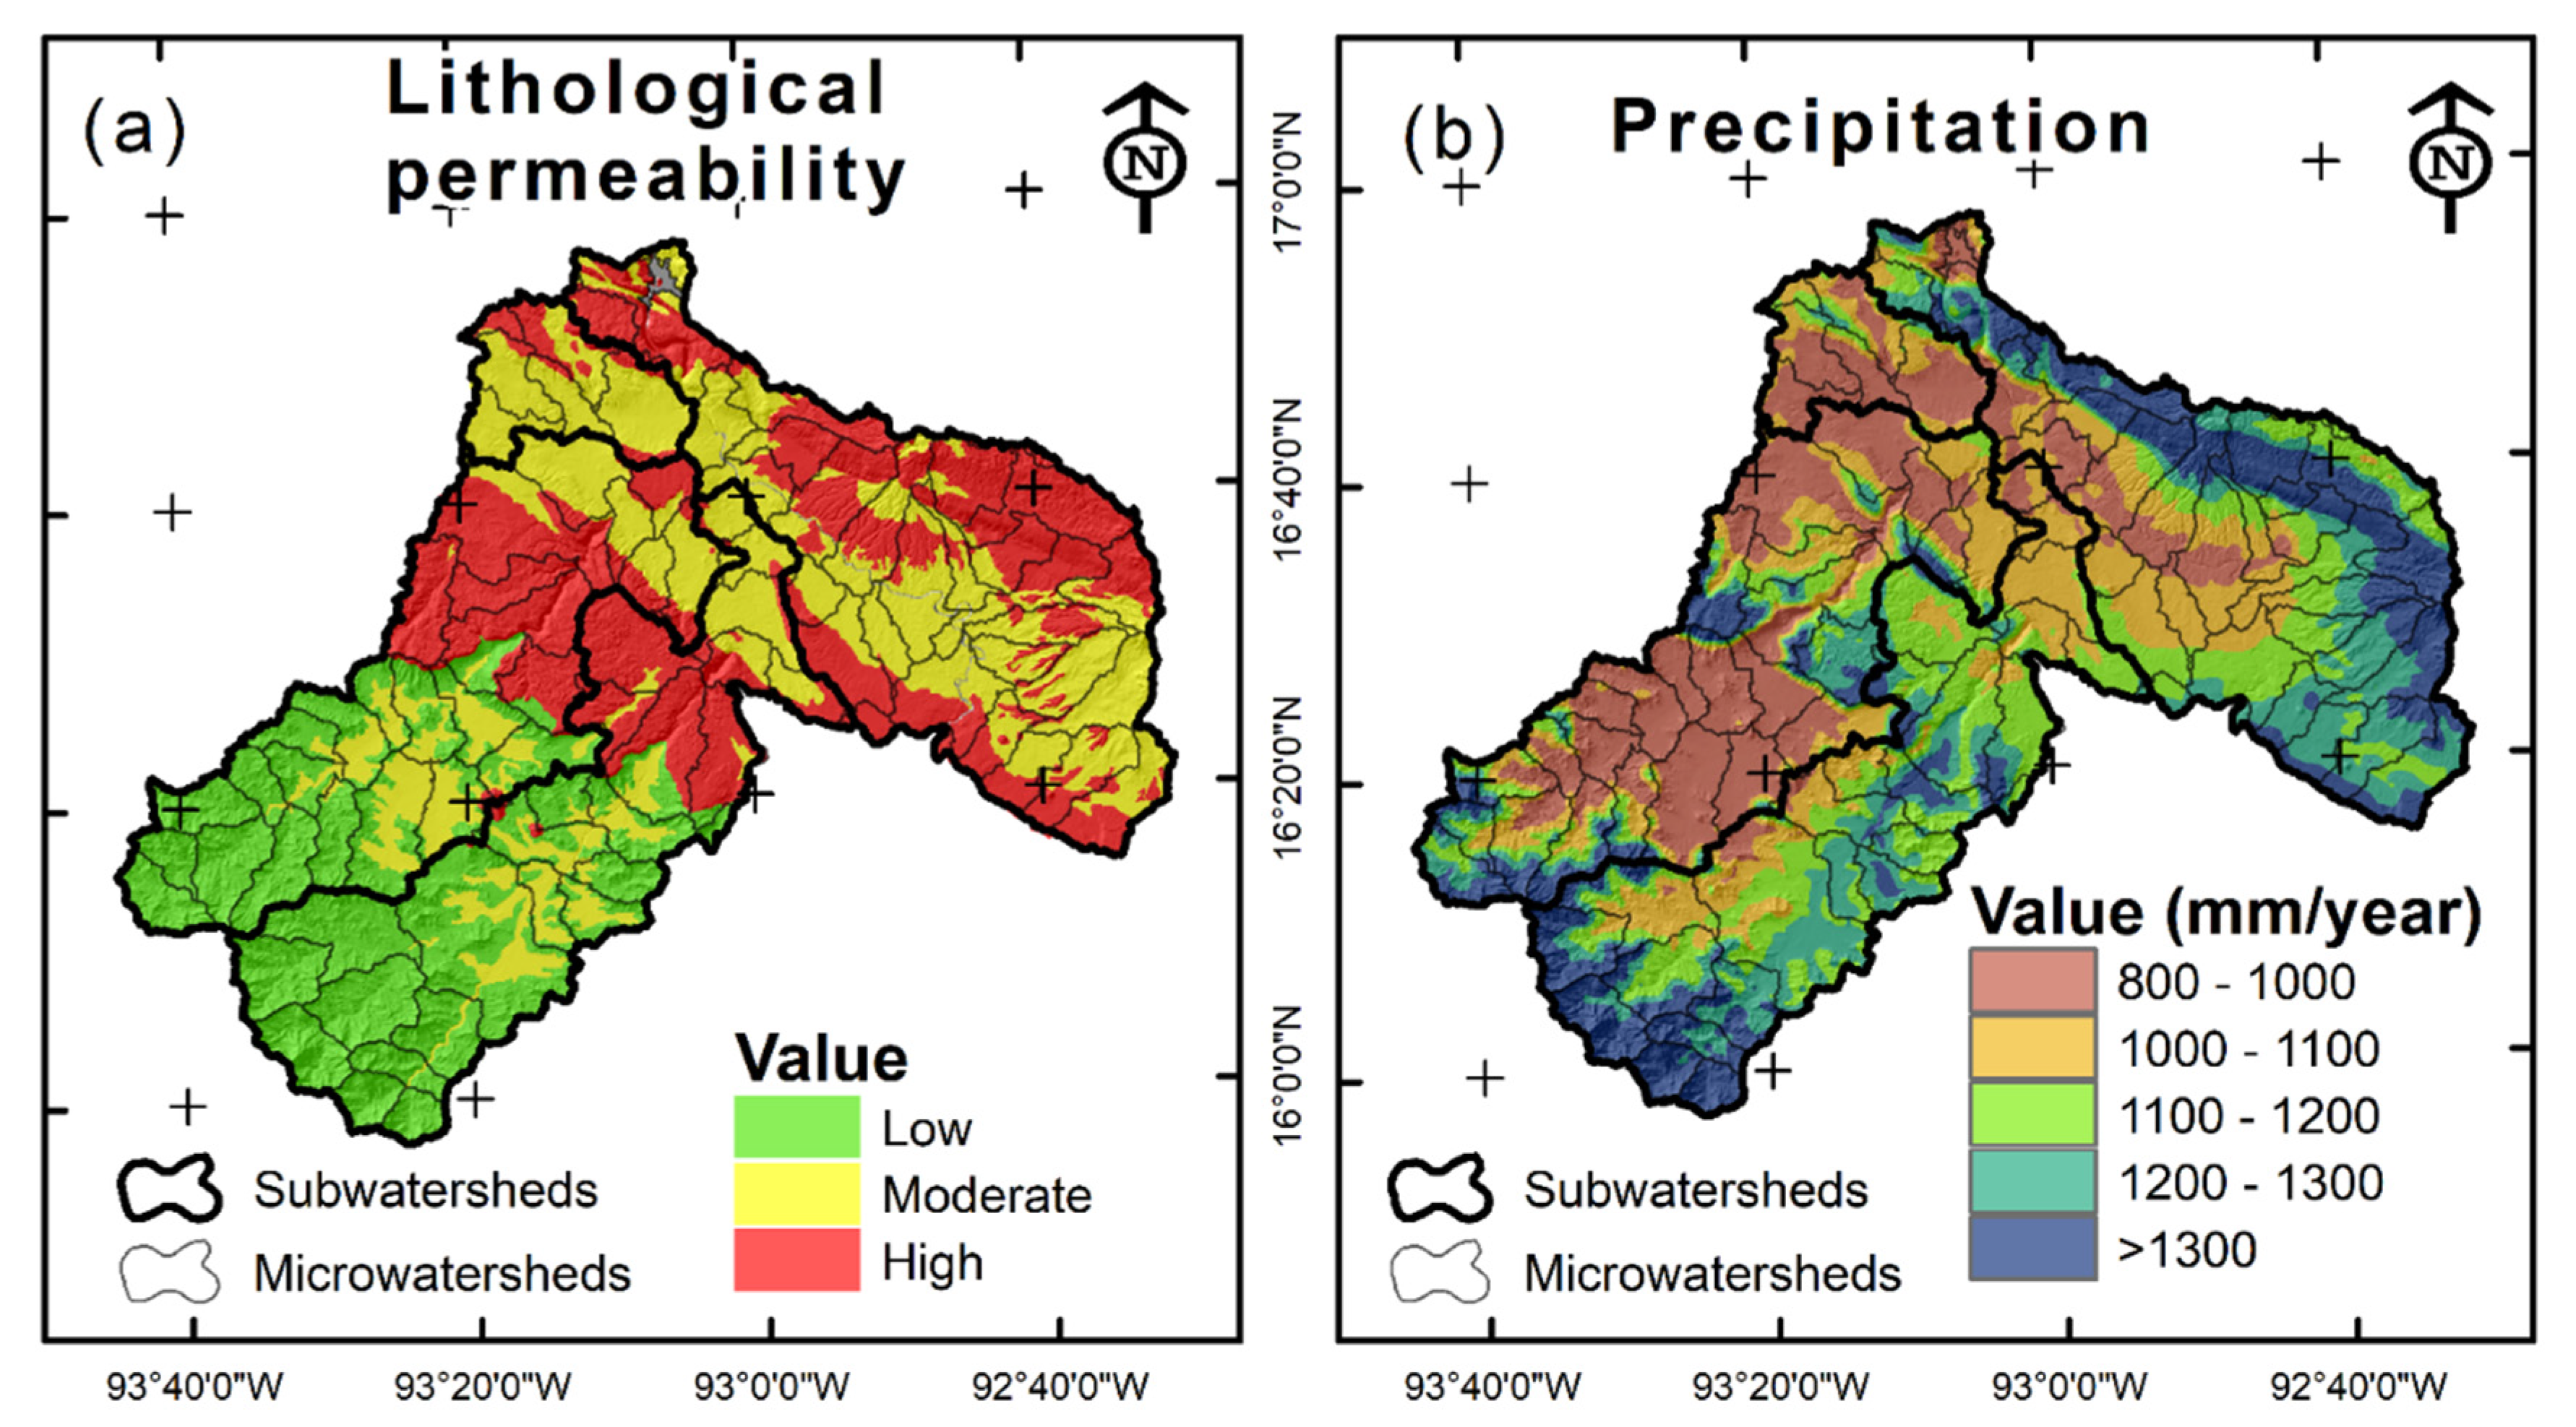
| C5 | Precipitation | 800–1000 mm/year | 1 |
| 1000–1100 mm/year | 2 | ||
| 1100–1200 mm/year | 3 | ||
| 1200–1300 mm/year | 4 | ||
| >1300 mm/year | 5 | ||
| C6 | Lithological permeability | Low level | 1 |
| Medium level | 3 | ||
| High level | 5 | ||
| C7 2 | Waste generation | < 50 Tons/day | 1 |
| 50–100 Tons/day | 2 | ||
| 100–200 Tons/day | 3 | ||
| 200–500 Tons/day | 4 | ||
| >500 Tons/day | 5 | ||
| C8 | Waste collection | High waste collection coverage: >80% | 1 |
| Medium waste collection coverage: >60% | 3 | ||
| Low waste collection coverage: <25% | 5 | ||
| C9 | Waste dumping method | Sanitary Landfill | 1 |
| Controlled site | 3 | ||
| Open dump | 5 | ||
| Watersheds | Dd (km/km2) | Slp (Degrees) | Ci 1 | LU/LC Change Rate (%) | Pr (mm/Year) | Lt 2 | Wg (Tons/Day) | Wc 2 | WDm 2 |
|---|---|---|---|---|---|---|---|---|---|
| SW1 | 1.25 | 7.13 | 1.66 | 1.63 | 1015.93 | Mostly medium level | 799.05 | Mostly high level | Mostly in open dumpsite |
| SW2 | 1.72 | 9.04 | 1.81 | 4.00 | 1203.51 | Mostly high level | 156.52 | Mostly low level | Mostly in open dumpsite |
| SW3 | 1.88 | 10.71 | 2.04 | 3.56 | 1066.40 | Mostly low level | 78.25 | Mostly low level | Mostly in controlled site |
| SW4 | 2.14 | 11.50 | 2.31 | 2.93 | 1200.80 | Mostly low level | 93.18 | Mostly low level | Mostly in open dumpsite |
| MW1 | 1.54 | 7.82 | 1.41 | 0.78 | 1026.62 | Mostly medium level | 679.51 | Mostly high level | Mostly in sanitary landfill |
| MW2 | 1.47 | 6.81 | 1.89 | 2.07 | 973.04 | Mostly medium level | 93.10 | Mostly high level | Mostly in sanitary landfill |
| MW3 | 1.30 | 5.03 | 1.80 | 8.60 | 979.93 | Mostly medium level | 10.45 | Mostly medium level | Mostly in open dumpsite |
| MW4 | 0.96 | 8.67 | 1.70 | 3.79 | 1092.17 | Mostly high level | 25.13 | Mostly medium level | Mostly in open dumpsite |
| MW5 | 1.21 | 5.42 | 1.68 | 3.34 | 1012.15 | Mostly medium level | 31.92 | Mostly low level | Mostly in open dumpsite |
| MW6 | 1.80 | 10.25 | 1.51 | 3.21 | 1075.16 | Mostly medium level | 64.68 | Mostly high level | Mostly in open dumpsite |
| MW7 | 1.94 | 7.28 | 1.55 | 3.37 | 1056.98 | Mostly medium level | 11.59 | Mostly medium level | Mostly in open dumpsite |
| MW8 | 1.77 | 6.80 | 1.48 | 5.23 | 977.75 | Mostly medium level | 55.90 | Mostly high level | Mostly in sanitary landfill |
| MW9 | 1.48 | 4.74 | 1.49 | 4.05 | 1063.07 | Mostly high level | 15.64 | Mostly low level | Mostly in sanitary landfill |
| MW10 | 1.03 | 11.61 | 1.65 | 2.43 | 1228.62 | Mostly high level | 5.70 | Mostly low level | Mostly in open dumpsite |
| MW11 | 1.66 | 5.63 | 1.47 | 3.06 | 1003.09 | Mostly medium level | 24.87 | Mostly high level | Mostly in open dumpsite |
| MW12 | 2.33 | 9.32 | 1.41 | 2.12 | 1141.99 | Mostly low level | 36.77 | Mostly medium level | Mostly in open dumpsite |
| Microwatersheds | Municipal Seat | km of Channels within the Municipal Seat |
|---|---|---|
| MW1 | Tuxtla Gutiérrez | 115.91 |
| MW2 | Tuxtla Gutiérrez | 29.90 |
| MW5 | Berriozábal | 13.08 |
| MW6 | Chiapa de Corzo | 36.61 |
| MW8 | Tuxtla Gutiérrez | 59.44 |
Publisher’s Note: MDPI stays neutral with regard to jurisdictional claims in published maps and institutional affiliations. |
© 2021 by the authors. Licensee MDPI, Basel, Switzerland. This article is an open access article distributed under the terms and conditions of the Creative Commons Attribution (CC BY) license (https://creativecommons.org/licenses/by/4.0/).
Share and Cite
Araiza-Aguilar, J.A.; Rojas-Valencia, M.N.; Nájera-Aguilar, H.A.; Gutiérrez-Hernández, R.F.; Martínez-Salinas, R.I.; García-Lara, C.M. Prioritization and Analysis of Watershed: A Study Applied to Municipal Solid Waste. Sustainability 2021, 13, 8152. https://0-doi-org.brum.beds.ac.uk/10.3390/su13158152
Araiza-Aguilar JA, Rojas-Valencia MN, Nájera-Aguilar HA, Gutiérrez-Hernández RF, Martínez-Salinas RI, García-Lara CM. Prioritization and Analysis of Watershed: A Study Applied to Municipal Solid Waste. Sustainability. 2021; 13(15):8152. https://0-doi-org.brum.beds.ac.uk/10.3390/su13158152
Chicago/Turabian StyleAraiza-Aguilar, Juan Antonio, María Neftalí Rojas-Valencia, Hugo Alejandro Nájera-Aguilar, Rubén Fernando Gutiérrez-Hernández, Rebeca Isabel Martínez-Salinas, and Carlos Manuel García-Lara. 2021. "Prioritization and Analysis of Watershed: A Study Applied to Municipal Solid Waste" Sustainability 13, no. 15: 8152. https://0-doi-org.brum.beds.ac.uk/10.3390/su13158152