
The Influence of Potential Infection on the Relationship between Temperature and Confirmed Cases of COVID-19 in China


1
School of Computer and Computing Science, Zhejiang University City College, Hangzhou 310015, China
2
School of Economics, Hangzhou Normal University, Hangzhou 311121, China
*
Author to whom correspondence should be addressed.
Sustainability 2021, 13(15), 8504; https://0-doi-org.brum.beds.ac.uk/10.3390/su13158504
Submission received: 31 May 2021
/
Revised: 25 July 2021
/
Accepted: 27 July 2021
/
Published: 29 July 2021
(This article belongs to the Special Issue Entrepreneurship and Sustainable Firms and Economies)
Abstract
:Considering the impact of the number of potential new coronavirus infections in each city, this paper explores the relationship between temperature and cumulative confirmed cases of COVID-19 in mainland China through the non-parametric method. In this paper, the floating population of each city in Wuhan is taken as a proxy variable for the number of potential new coronavirus infections. Firstly, to use the non-parametric method correctly, the symmetric Gauss kernel and asymmetric Gamma kernel are applied to estimate the density of cumulative confirmed cases of COVID-19 in China. The result confirms that the Gamma kernel provides a more reasonable density estimation of bounded data than the Gauss kernel. Then, through the non-parametric method based on the Gamma kernel estimation, this paper finds a positive relationship between Wuhan’s mobile population and cumulative confirmed cases, while the relationship between temperature and cumulative confirmed cases is inconclusive in China when the impact of the number of potential new coronavirus infections in each city is considered. Compared with the weather, the potentially infected population plays a more critical role in spreading the virus. Therefore, the role of prevention and control measures is more important than weather factors. Even in summer, we should also pay attention to the prevention and control of the epidemic.
1. Introduction
A typical pneumonia caused by a new coronavirus, called COVID-19, broke out in Wuhan, Hubei Province, China on 31 December 2019. Cases have been spread to other cities in China and in foreign countries, which has turned into a pandemic outbreak. As of 13 May 2020, China had 84,458 cumulative confirmed cases, and 4,250,812 cases were diagnosed worldwide. The new coronavirus has caused a social shutdown, which has led to the decline of industries other than a few, such as the gaming and eSports industries, and online education [1,2,3]. What is more depressing is that the new coronavirus may accompany humans for a long time [4]. The epidemic situation of COVID-19 caused severe pressure on the long-term accumulation of global innovation, hindering the innovation ability of enterprises, which is an important factor for the sustainable development of the country [5,6,7]. Therefore, in order to better formulate the relevant epidemic prevention measures and recover the economic development of various countries as soon as possible, subjects such as the rate of an epidemic, transition methods, prevention methods, remaining time of the virus in the environment, and the effects of environmental factors on virus infection rate must be paid more attention to [8,9,10].
Previous studies have shown that meteorological variables can affect the transmission and survival of coronaviruses. For example, Pirouz et al. [8] used the data of Iran, Italy, Germany, Spain, and the United States to conclude that there is a certain negative correlation between daily average temperature and the prevalence of the coronavirus. Preliminary evidence from Bannister et al. [11] shows that in the global reported cases before 29 February 2020, the incidence rate of higher temperatures is associated with a lower incidence of COVID-19. In addition, one result obtained by Mofijur et al. [12] in Dhaka, Bangladesh, was that the average temperature was significantly associated with new COVID-19 cases. Prata et al. [13] indicated that temperatures had a negative linear relationship with the number of confirmed cases in Brazil. Conversely, some studies have found no significant relationship between the temperature and the transmission of COVID-19 [14,15]. Hence, there is still no clear evidence of the negative correlation between environmental variables and transmission. One of the most important reasons for unclear conclusions could be that these previous studies did not consider the impact of the number of potential infections, which would be the most critical factor in the transmission of COVID-19. In addition, most previous studies used traditional models, which were too simple to deal with complex nonlinear models, and environmental factors often have unknown nonlinear effects [16,17]. Currently, a non-parametric approach, commonly known as the kernel method, is used to describe the association between variables. For example, Fan et al. [18] applied the kernel method to compare the PM2.5 density estimates between summer and winter, rush and non-rush hours, respectively. Unlike the parameter method, which can only obtain the mean information of variables, one important benefit of using the kernel method is that one can comprehensively analyze the relationship between variables by comparing the distribution of variables to better and more robustly describe the relationship between variables. Another benefit of using the kernel method is that we can visually explore the relationships between variables.
Although there is relevant literature on the relationship between temperature and confirmed cases in China [19,20], the literature does not consider the impact of the number of potential infections, which would be the most critical factor in the transmission of COVID-19. Hence, considering the impact of the number of potential new coronavirus infections in each city, this study aimed to explore the relationship between temperature and cumulative confirmed cases of COVID-19 in China with a kernel method to improve our knowledge of the spread of the virus. In this paper, the floating population of each city in Wuhan refers to the floating population in Wuhan that originates from other cities in China and is taken as the proxy variable for the number of potential new coronavirus infections. Since Wuhan was the first city to break out of a new coronavirus in China and the time of its outbreak is approaching China’s Lunar New Year, Wuhan’s floating population has been returning to their hometown for the Chinese New Year. Moreover, since the prevention measures of the Chinese government are very timely, after Wuhan was locked down on 23 January 2020, the population between cities in the whole country basically stopped flowing. Therefore, the floating population of Wuhan in each city can be regarded as a proxy variable of the potential infection number of the city. Specifically, based on the non-parametric method, this paper explores the relationship between temperature and cumulative confirmed cases of COVID-19 in mainland China. Firstly, since the non-parametric method needs to identify the density estimation of data correctly, we compared symmetric kernel and asymmetric gamma kernel density estimations of the cumulative confirmed cases and found that the asymmetric gamma kernel fits the data better. Next, by applying an asymmetric gamma kernel, this paper estimates the probability density of cumulative confirmed cases every 14 days from 24 January to 20 March 2020. The results show that measures such as Wuhan’s lockdown and other cities’ strict epidemics prevention are effective. Then, based on the Copula model, the multivariate density of temperature and cumulative confirmed cases are estimated. By comparing the benchmark multivariate density, the preliminary results show a certain correlation between the cumulative number of confirmed cases and the urban temperature in China. Finally, this paper compares the density estimations of cumulative confirmed cases of COVID-19 between the cities with low and high mobile population from Wuhan, and cities with low and high temperatures. The results show that Wuhan’s mobile population is positively related to cumulative confirmed cases of COVID-19, while the relationship between temperature and the number of cumulative confirmed cases is inconclusive in mainland China when the impact of the number of potential new coronavirus infections in each city is considered.
2. Nonparametric Density Estimation
Let be a random sample from a probability distribution with an unknown probability density function .
2.1. Symmetric and Asymmetric Kernel Density Estimators
For any , where is the unbounded support, the conventional or fixed bandwidth symmetric kernel estimator of unknown is as follows:
where is a kernel function and is the bandwidth. A kernel function with a symmetric density satisfies the following:
The Gauss kernel is the most used symmetric kernel, which is expressed as:
When the unknown density has support on , the gamma kernel estimator, one of the asymmetric kernel density estimations, is given by the following:
where:
Remark.
Standard fixed bandwidth symmetric kernel-type density estimators are known to encounter boundary problems for positive random variables with a large probability mass close to zero. It is shown that, in such settings, alternatives to asymmetric gamma kernel estimators are superior for the following reasons [24,25]:
- The gamma kernel estimator is non-negative and free of boundary bias;
- The shape of the gamma kernel function changes with the position of sample points, and then the smoothness of each estimation point is adjusted naturally.
Moreover, the farther the points of estimation move away from the boundary, the more the estimator’s variance decreases. It leads to an advantage in situations of naturally unbalanced scattered design points, in particular for densities with sparse areas.
2.2. Selection of Bandwidth
This paper calculates the bandwidth of the symmetric kernel density estimation of Equation (1) based on the least squares cross-validation method [18], which is given by:
where ,.
The bandwidth of gamma density estimation is obtained by minimizing the following:
2.3. Semiparametric Multivariate Density Estimation
For the joint probability density kernel estimation of the temperature and the number of cumulative confirmed cases, the semi-parametric multivariate density estimation for positive data is used here [26]. Let be a random sample from a probability distribution with an unknown probability density function .
From Sklar (1959), it is well-known that the distribution function of a vector can be expressed via a copula [27,28,29,30,31]:
Derivate the two sides of (5), we can obtain:
The Gumbel–Hougaard copula is used here:
where .The estimate of (6) is given by the following estimation steps [23]:
- (1)
- with is the sample Kendall’s tau.
- (2)
- The distribution function of and are estimated by the empirical distribution.
- (3)
- , adopt (1) (2) kernel estimation method.
3. Empirical Findings
Daily data of cumulative confirmed cases of COVID-19 in mainland Chinese cities is gathered from the website (https://lab.isaaclin.cn/nCoV/, accessed on 5 January 2020) from 23 January to 20 March 2020. represents the cumulative confirmed cases in the i-th city.
3.1. Density Estimation of Cumulative Confirmed Cases
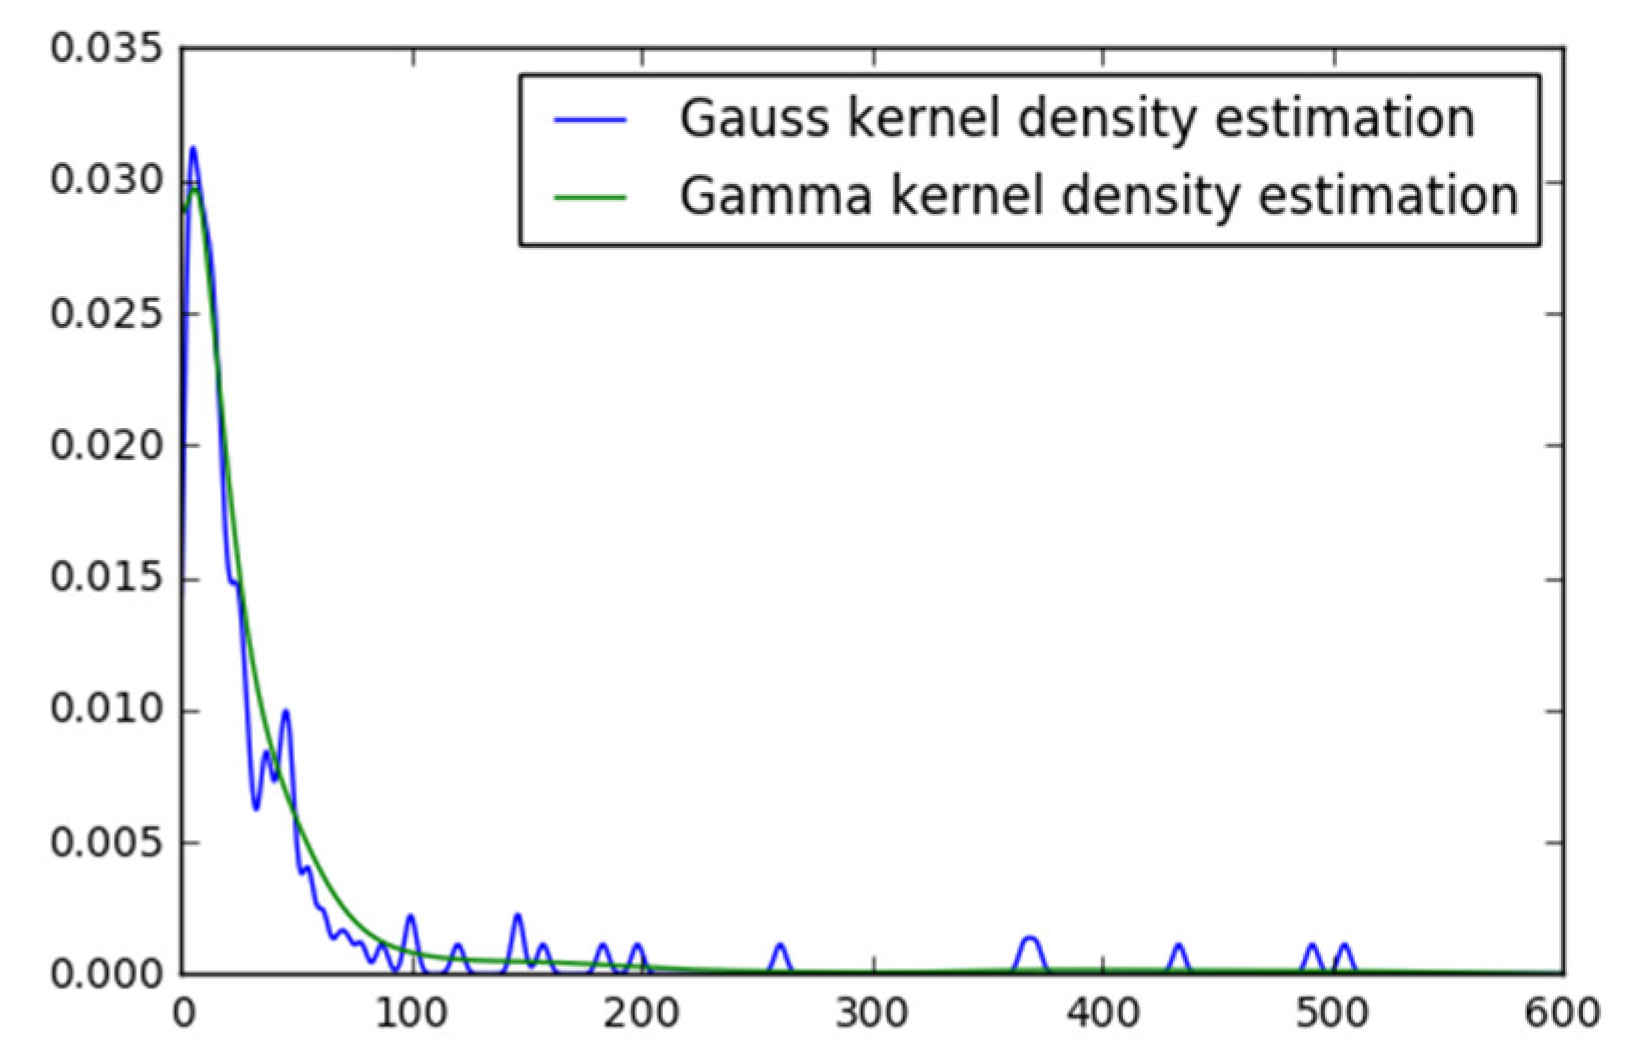
The Gauss kernel and gamma kernel density of COVID-19’s cumulative confirmed cases in mainland China on 20 March 2020 are firstly investigated. As shown in Figure 1, the density curve of the Gauss kernel is rather wiggly up-and-down, and it is an unexcepted density curve in reality. Meanwhile, the Gauss kernel leads to an underestimated estimation because it gives weight to the negative value, while the cumulative confirmed cases are non-negative. It indicates that the fixed bandwidth symmetric kernel is not applicable to sparse data.
While the gamma kernel density estimator is non-negative and can change with the position of sample points, the smoothness of each estimation point is adjusted naturally. From Figure 1, the gamma density estimators show a large probability mass close to zero. Meanwhile, we can observe that the condition of the shoulder is satisfied here, which means that the gamma kernel estimator is boundary-problem-free [25,31].
To sum up, the gamma kernel can generate a positive and a reasonably smooth density, while a free boundary problem for the cumulative confirmed cases. Therefore, all the following analyses proceed with the gamma kernel density estimation.
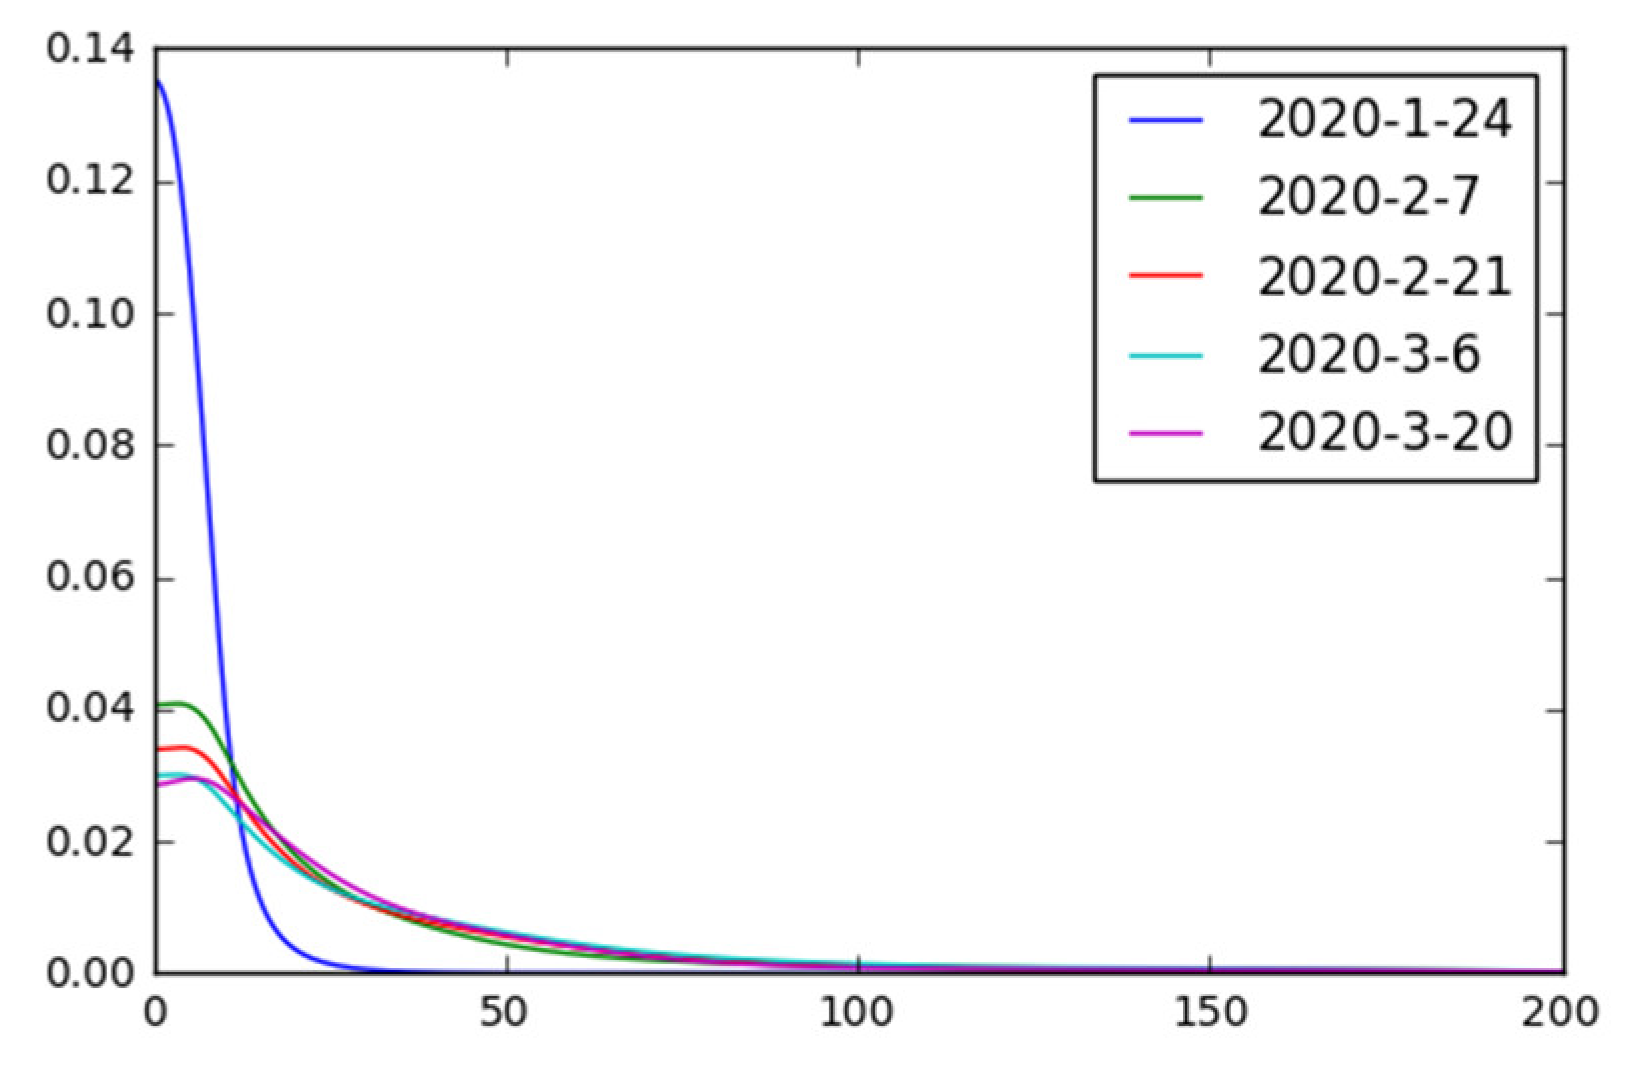
The gamma kernel estimations of the cumulative confirmed cases for every 14-day interval since 24 January 2020 are displayed in Figure 2. The result shows that the density curve of the cumulative confirmed cases on 7 February 2020 is higher than that on 24 January 2020, on the support [11, +∞). That is, the amount of cumulative confirmed cases increases quickly in the first 14-day interval. Then, it is gradually reduced in the following several 14-day intervals by taking severe measures such as Wuhan’s lockdown. Governments at all levels investigate the suspected cases and their contact population, especially the population from the “epidemic area”, Hubei, villages, and communities that are in lockdown. That is, the measures are sufficient to control the spread of COVID-19.
3.2. Relationship of Wuhan’s Mobile Population and Cumulative Confirmed Cases
With the coming of the Spring Festival (25 January 2020), many migrant workers return to their hometowns from Wuhan [32]. The mobile population is a potential carrier for virus transmission. Hence, this paper explores the correlation between Wuhan’s migrants and the cumulative confirmed cases by comparing the density between cities with different scales of the mobile population from Wuhan. According to the standard defined by Fan et al. [32], we divide the sample into two sub-groups, the cities with a large mobile population from Wuhan (LMG) and the cities with a small mobile population from Wuhan (SMG).
As the cumulative confirmed cases in mainland China are relatively stable, we only investigated the density curve of cumulative confirmed cases on 20 March 2020. The result is displayed in Figure 3. It shows that the density of LMG is significantly higher than that of SMG over the support [20, +∞), which indicates that Wuhan’s mobile population was positively correlated with the cumulative confirmed cases of COVID-19. That is, it is necessary for other regions to take on 14-days-isolation-and-observation measures on personnel from Hubei, especially from Wuhan.
3.3. Preliminary Relationship of Temperature and Cumulative Confirmed Cases Based on Multivariate Density
Temperature, one of the critical environmental factors, is a non-negligible factor influencing the coronavirus’s behavior [8]. We need to estimate the probability density of city-level temperatures accurately.
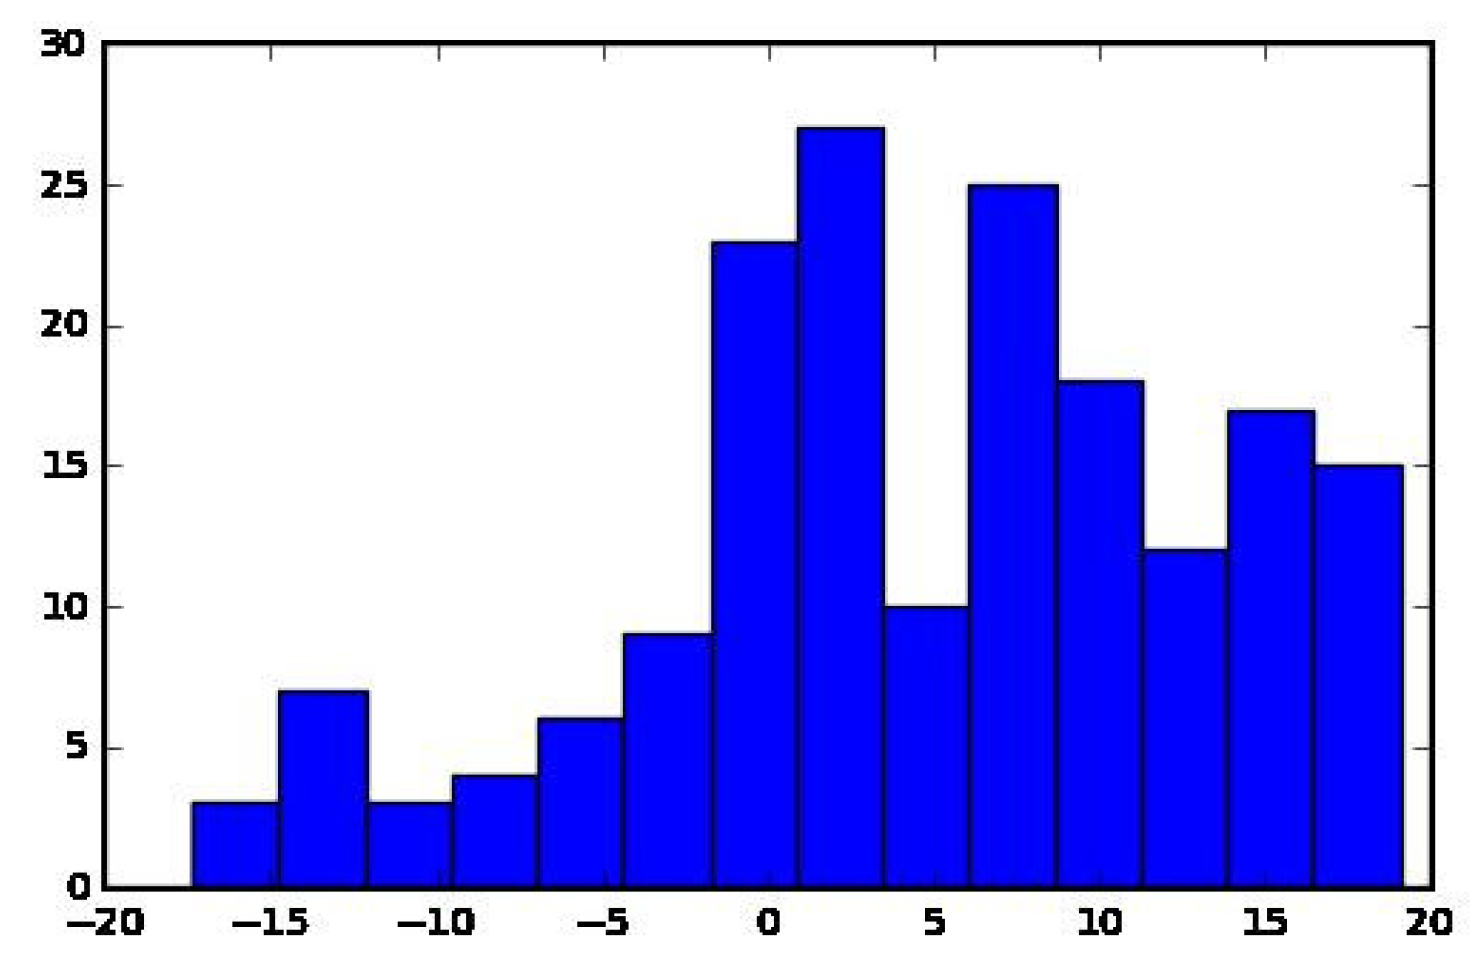
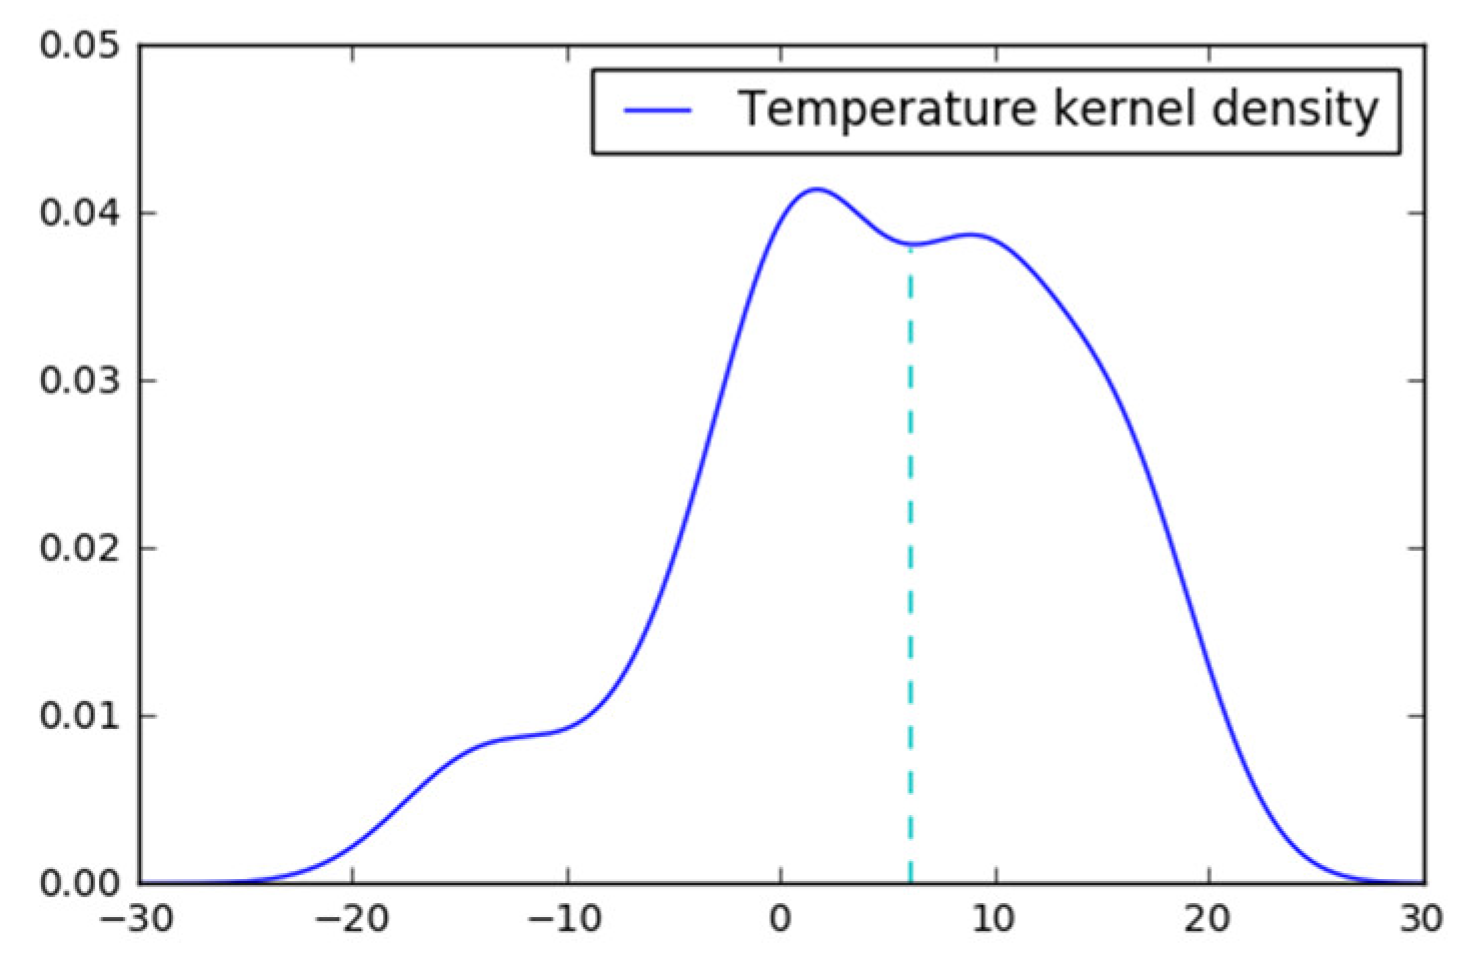
As shown in Figure 4, there is a north–south difference in city-level air temperature in China. If the probability density of temperature in Chinese cities is estimated by a parameter model, this difference cannot be reflected. Moreover, the temperature can be regarded as “unbounded” data, so it is suitable to use the traditional symmetric kernel to estimate its probability density (Figure 5).
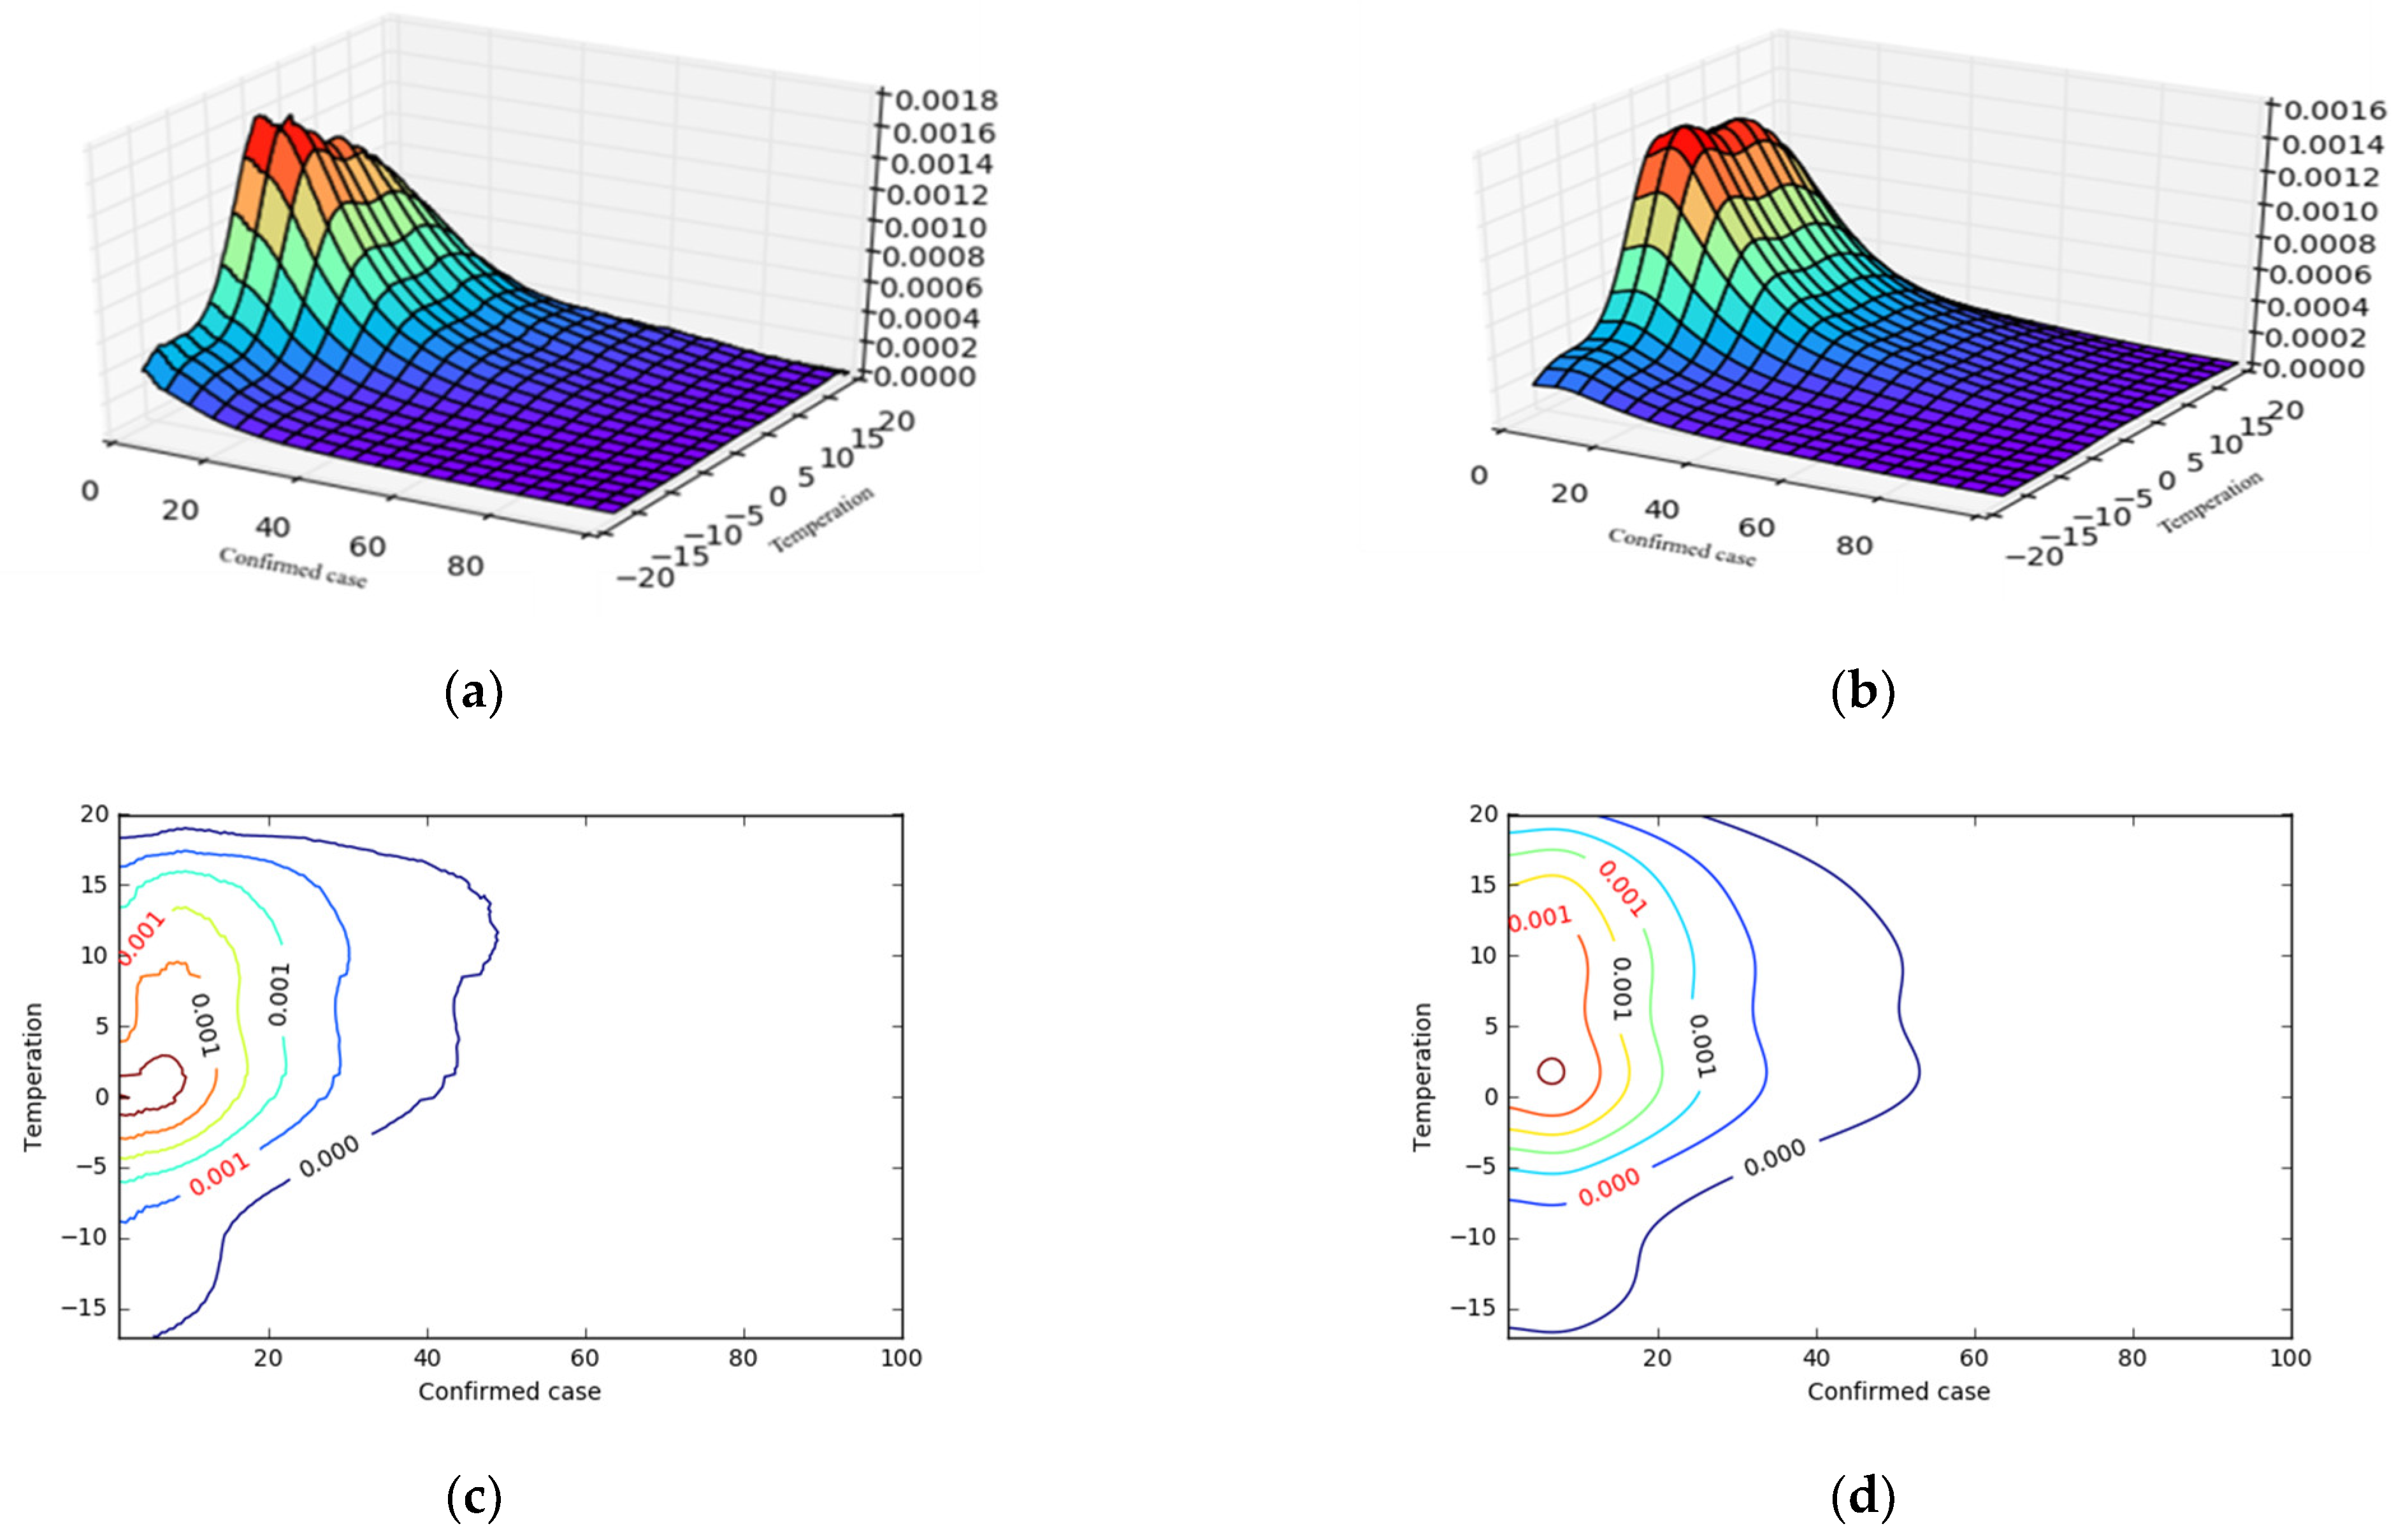
Based on formula (6), we estimate the multivariate density of temperature and the cumulative number of confirmed cases. The kernel density of temperature is estimated by Gaussian kernel density, and the kernel density of cumulative confirmed cases is estimated by the Gamma kernel density. The benchmark multivariate kernel density is estimated assuming f(x,y) = f(x)f(y) means that is independent of . If the multivariate density of temperature and cumulative confirmed cases is different from its benchmark, then we initially consider that these two factors are related.
3.4. Relationship of Temperature and Cumulative Confirmed Cases
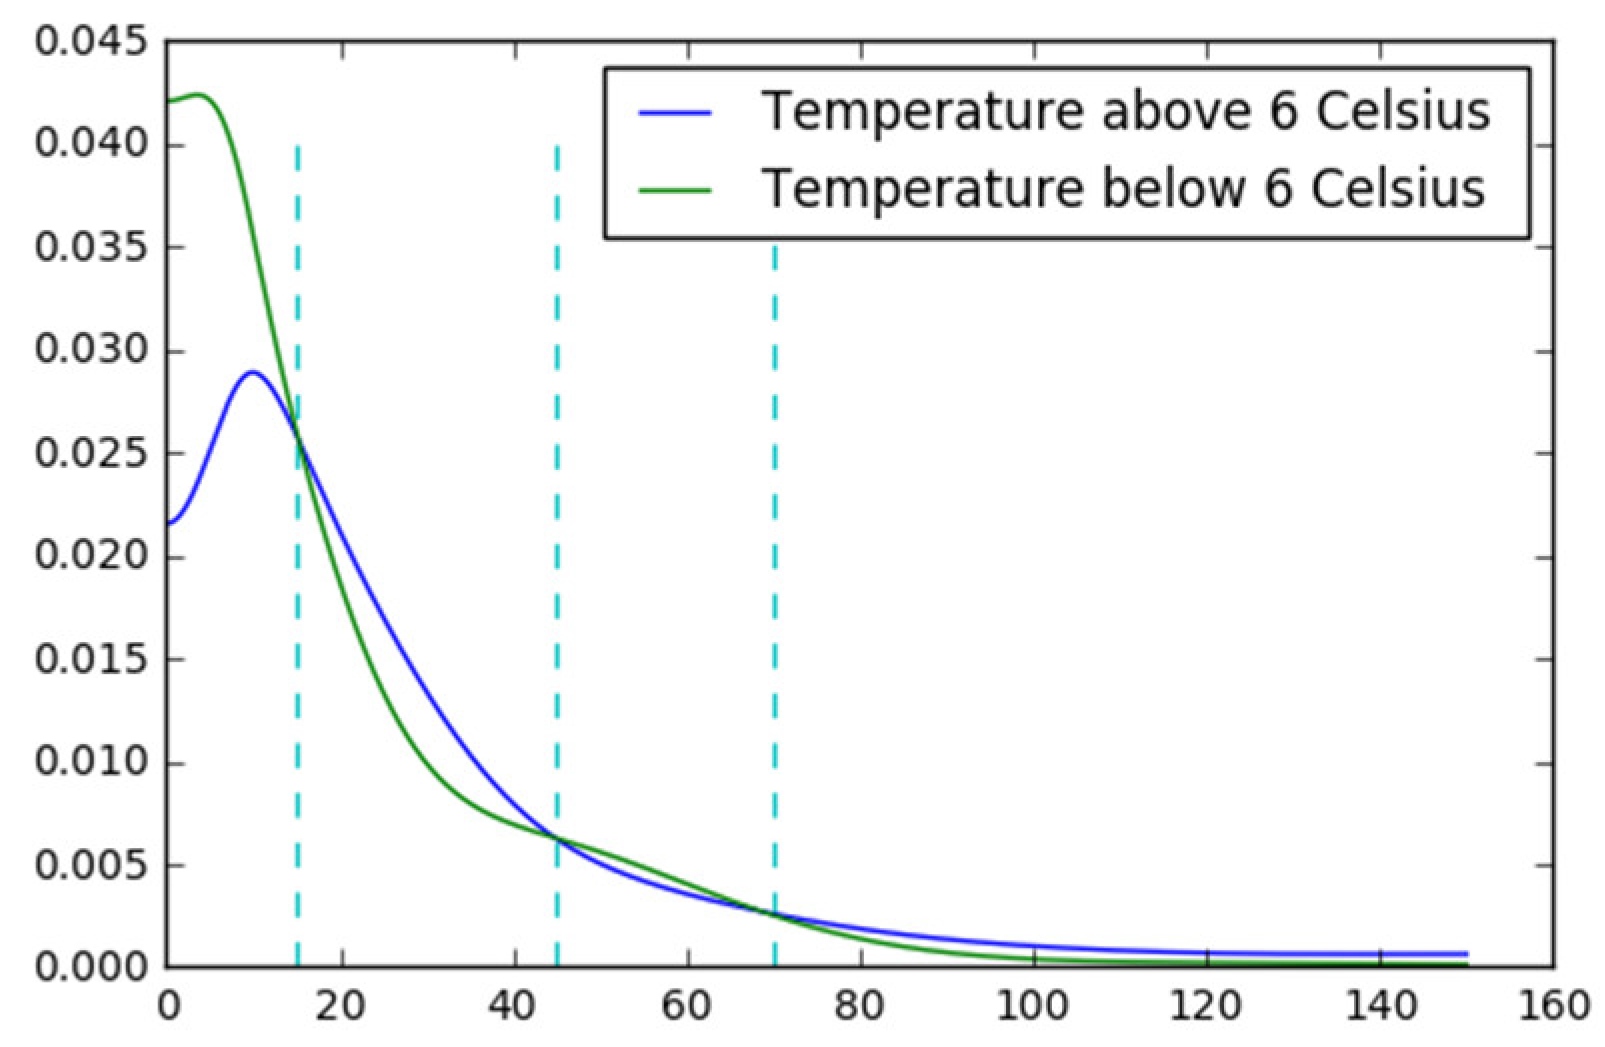
To investigate the relationship between the temperature and the amount of COVID-19’s cumulative confirmed cases in China, we divided the sample into two sub-groups according to the temperature. The city is classified into the high-temperature group (HTG) if its temperature is equal or higher than 6 °C; otherwise, it is classified into the low-temperature group (LTG). The kernel curve (seen in Figure 5) of daily average temperatures in January and February 2020 of 179 cities in Mainland China has two kurtoses, where T = 6 °C is the middle of the two kurtoses. Hence, we take it as the standard.
The kernel densities of the two sub-groups are shown in Figure 7. The results show that the density of the cumulative confirmed cases of HTG is relatively higher than that of LTG in the support [15, +∞]—(45,70). It indicates a positive relationship between the temperature and cumulative confirmed cases, which is contrary to the results of Pirouz et al. [8]. A possible explanation is that cities with higher temperatures are almost all coastal cities, and most of these cities are economically developed regions, where they have higher population mobility.
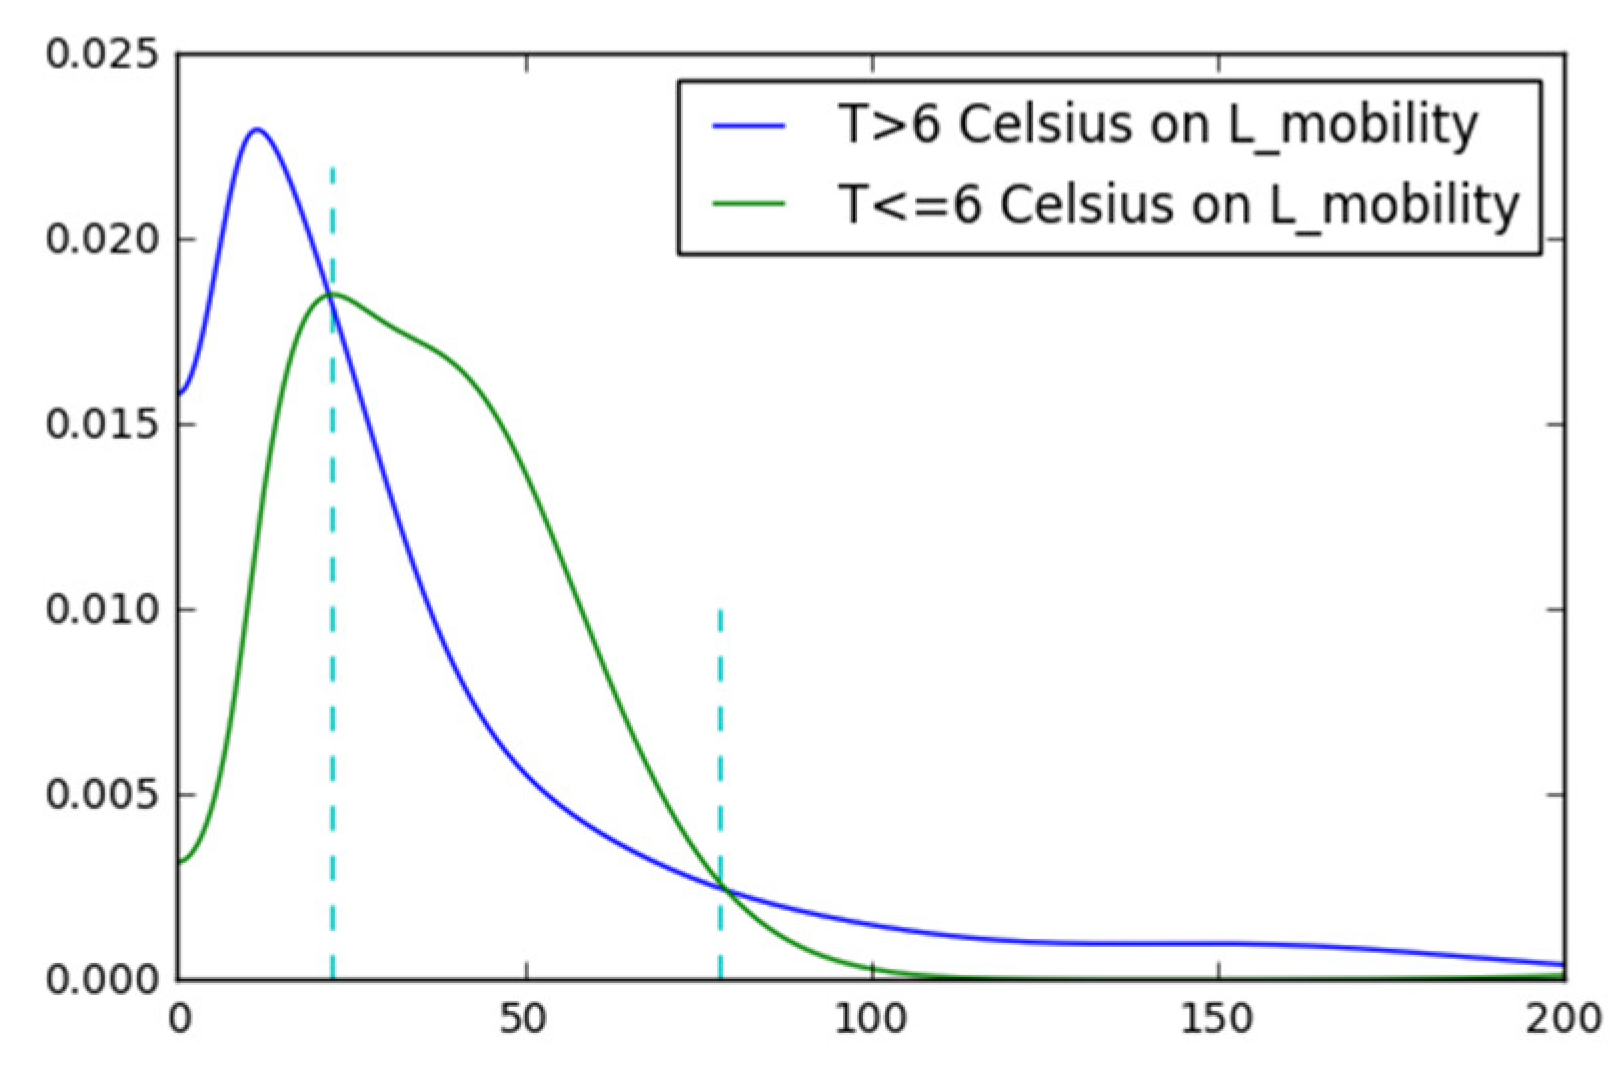
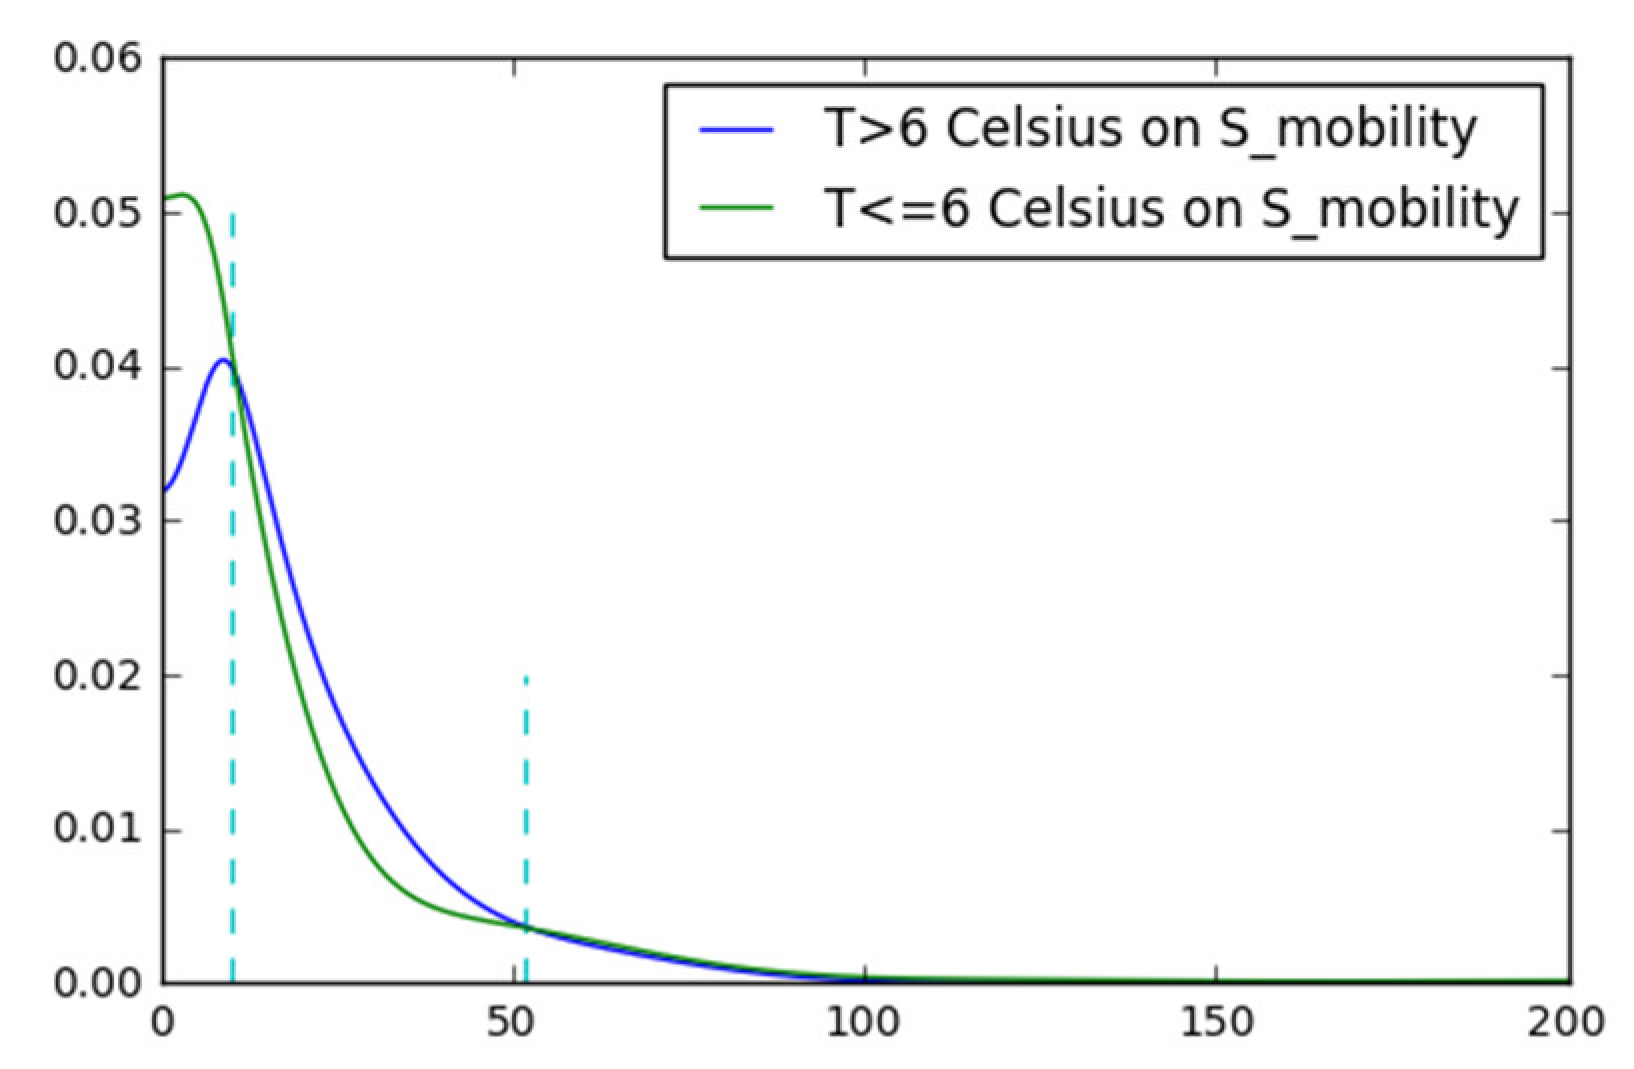
To prove the assertion, the relationship between temperature and cumulative confirmed cases is investigated by controlling population mobility. Figure 8 and Figure 9 display the kernel densities of HTG and LTG within LMG and SMG, respectively. Within LMG, the negative correlation of temperature and cumulative confirmed cases exists in the support (22, 78), while it turns out to be positively correlated in the support (78, +∞). Within SMG, a weak positive correlation between temperature and cumulative confirmed cases exists. Hence, the relationship between temperature and cumulative confirmed cases is inconclusive. Other factors such as population density may be ignored, which should be further studied in future research.
4. Conclusions
Considering the impact of the number of potential new coronavirus infections in each city, this paper explores the relationship between temperature and cumulative confirmed cases of COVID-19 in mainland China through the non-parametric method. In this paper, the floating population of each city in Wuhan is taken as a proxy variable for the number of potentially infected people. In order to use the non-parametric method correctly, this paper applies a symmetric kernel and an asymmetric gamma kernel to estimate the probability density of cumulative confirmed cases of COVID-19 in mainland China. The results show that the asymmetric Gamma kernel provides a more reasonable fit for COVID-19’s cumulative confirmed cases.
By comparing the densities of COVID-19’s cumulative confirmed cases between LMG and SMG, and HTG and LTG, we find that Wuhan’s mobile population is positively related to cumulative confirmed cases. Moreover, the preliminary result shows a certain correlation between the cumulative number of confirmed cases and the urban temperature in China based on the Copulas method. However, the relationship between temperature and cumulative confirmed cases is inconclusive when the impact of the number of potential new coronavirus infections in each city is considered. Compared with the temperature, the potentially infected population plays a more important role in spreading the virus. Therefore, the role of prevention and control measures is more important than weather factors. Even in summer, we should also pay attention to the prevention and control of the epidemic.
Our results do not show a wide range of temperatures and their effects because if we expand the data, for example, into the summer period, we cannot reasonably obtain the proxy variables for the number of potential infections. Our next study goal is to figure out how to find a proxy variable for the number of potentially infected people in the general setting or in a high-temperature metropolis.
Author Contributions
Conceptualization, W.L. and Q.H.; methodology, W.L.; software, W.L.; formal analysis, W.L.; data curation, W.L.; writing—original draft preparation, Q.H.; writing—review and editing, Q.H. All authors have read and agreed to the published version of the manuscript.
Funding
This research received no external funding.
Institutional Review Board Statement
Not applicable.
Informed Consent Statement
Not applicable.
Conflicts of Interest
The authors declare no conflict of interest.
References
- Batool, M.; Ghulam, H.; Hayat, M.A.; Naeem, M.Z.; Ejaz, A.; Imran, Z.A.; Spulbar, C.; Birau, R.; Gorun, T.H. How COVID-19 has shaken the sharing economy? An analysis using Google trends data. Econ. Res. Ekon. Istraživanja 2020, 34, 1–13. [Google Scholar] [CrossRef]
- López-Cabarcos, M.Á.; Ribeiro-Soriano, D.; Piñeiro-Chousa, J. All that glitters is not gold. The rise of gaming in the COVID-19 pandemic. J. Innov. Knowl. 2020, 5, 289–296. [Google Scholar] [CrossRef]
- Xie, X.; Zang, Z.; Ponzoa, J.M. The information impact of network media, the psychological reaction to the COVID-19 pandemic, and online knowledge acquisition: Evidence from Chinese college students. J. Innov. Knowl. 2020, 5, 297–305. [Google Scholar] [CrossRef]
- Kissler, S.M.; Tedijanto, C.; Goldstein, E.; Grad, Y.H.; Lipsitch, M. Projecting the transmission dynamics of SARS-CoV-2 through the postpandemic period. Science 2020, 368, 860–868. [Google Scholar] [CrossRef] [PubMed]
- Cornell University; INSEAD; WIPO. Global Innovation Index 2020. Available online: https://www.wipo.int/global_innovation_index/en/2020/ (accessed on 10 February 2020).
- Saunila, M. Innovation capability in SMEs: A systematic review of the literature. J. Innov. Knowl. 2020, 5, 260–265. [Google Scholar] [CrossRef]
- Ryan, J.C.; Daly, T.M. Barriers to innovation and knowledge generation: The challenges of conducting business and social research in an emerging country context. J. Innov. Knowl. 2019, 4, 47–54. [Google Scholar] [CrossRef]
- Pirouz, B.; Golmohammadi, A.; Masouleh, H.S.; Violini, G.; Pirouz, B. Relationship be-tween Average Daily Temperature and Average Cumulative Daily Rate of Confirmed Cases of COVID-19. medRxiv 2020. [Google Scholar] [CrossRef] [Green Version]
- Hu, Z.; Ge, Q.; Li, S.; Xiong, M. Artificial Intelligence Forecasting of Covid-19 in China. IJEE 2020, 6, 71–94. [Google Scholar] [CrossRef]
- Li, Q.; Guan, X.; Wu, P.; Wang, X.; Zhou, L.; Tong, Y.; Ren, R.; Leung, K.S.M.; Lau, E.H.Y.; Wong, J.Y.; et al. Early Transmission Dynamics in Wuhan, China, of Novel Coronavirus-Infected Pneumonia. N. Engl. J. Med. 2020, 382, 1199–1207. [Google Scholar] [CrossRef]
- Bannister-Tyrrell, M.; Meyer, A.; Faverjon, C.; Cameron, A. Preliminary evidence that higher temperatures are associated with lower incidence of COVID-19, for cases reported global-ly up to 29th February 2020. medRxiv 2020. [Google Scholar] [CrossRef]
- Mofijur, M.; Fattah, I.R.; Islam, A.S.; Uddin, M.; Rahman, S.A.; Chowdhury, M.; Alam, A.; Uddin, A. Relationship between Weather Variables and New Daily COVID-19 Cases in Dhaka, Bangladesh. Sustainability 2020, 12, 8319. [Google Scholar] [CrossRef]
- Prata, D.N.; Rodrigues, W.; Bermejo, P.H. Temperature significantly changes COVID-19 transmission in (sub)tropical cities of Brazil. Sci. Total Environ. 2020, 729, 138862. [Google Scholar] [CrossRef]
- Xie, J.; Zhu, Y. Association between ambient temperature and COVID-19 infection in 122 cities from China. Sci. Total Environ. 2020, 724, 138201. [Google Scholar] [CrossRef]
- Alanazi, F.A. The spread of covid-19 at hot-temperature places with different curfew situa-tions using copula models. arXiv 2021, arXiv:2102.10265. [Google Scholar]
- Xu, B.; Lin, W.; Taqi, S.A. The impact of wind and non-wind factors on PM2.5 levels. Technol. Forecast. Soc. Chang. 2020, 154, 119960. [Google Scholar] [CrossRef]
- Zhang, J.L.; Liu, F. The Effects of Weather on Human Health. In Proceedings of the 11th National Conference on Atmospheric Environment, Jinan, China, 10 January 2004; pp. 471–477. [Google Scholar]
- Fan, Y.; Hou, L.; Yan, K.X. On the density estimation of air pollution in Beijing. Econ. Lett. 2018, 163, 110–113. [Google Scholar] [CrossRef]
- Shi, P.; Dong, Y.; Yan, H.; Zhao, C.; Li, X.; Liu, W.; He, M.; Tang, S.; Xi, S. Impact of temperature on the dynamics of the COVID-19 outbreak in China. Sci. Total Environ. 2020, 728, 138890. [Google Scholar] [CrossRef]
- Wang, Q.; Zhao, Y.; Zhang, Y.; Qiu, J.; Li, J.; Yan, N.; Li, N.; Zhang, J.; Tian, D.; Sha, X.; et al. Could the ambient higher temperature decrease the transmissibility of COVID-19 in China? Environ. Res. 2021, 193, 110576. [Google Scholar] [CrossRef]
- Li, Q.; Racine, J.S. Nonparametric Econometrics: Theory and Practice, 1st ed.; Princeton University Press: Princeton, NJ, USA, 2007. [Google Scholar]
- Peleckien, V.; Peleckis, K.; Dudzeviiūt, G.; Peleckis, K.K. The relationship between insur-ance and economic growth: Evidence from the European Union countries. Ekon. Istraživanja Econ. Res. 2019, 32, 1138–1151. [Google Scholar] [CrossRef] [Green Version]
- Lin, M.; Xu, W.; Lin, Z.; Chen, R. Determine OWA operator weights using kernel density estimation. Econ. Res. Ekon. Istraživanja 2020, 33, 1441–1464. [Google Scholar] [CrossRef]
- Chen, S.X. Probability Density Function Estimation Using Gamma Kernels. Ann. Inst. Stat. Math. 2000, 52, 471–480. [Google Scholar] [CrossRef]
- Malec, P.; Schienle, M. Nonparametric kernel density estimation near the boundary. Comput. Stat. Data Anal. 2014, 72, 57–76. [Google Scholar] [CrossRef] [Green Version]
- Bouezmarni, T.; Rombouts, J. Semiparametric multivariate density estimation for positive data using copulas. Comput. Stat. Data Anal. 2009, 53, 2040–2054. [Google Scholar] [CrossRef] [Green Version]
- Liu, J.; Wang, M.; Sriboonchitta, S. Examining the Interdependence between the Exchange Rates of China and ASEAN Countries: A Canonical Vine Copula Approach. Sustainability 2019, 11, 5487. [Google Scholar] [CrossRef] [Green Version]
- Gródek-Szostak, Z.; Malik, G.; Kajrunajtys, D.; Szeląg-Sikora, A.; Sikora, J.; Kuboń, M.; Niemiec, M.; Kapusta-Duch, J. Modeling the Dependency between Extreme Prices of Selected Agricultural Products on the Derivatives Market Using the Linkage Function. Sustainability 2019, 11, 4144. [Google Scholar] [CrossRef] [Green Version]
- Szetela, B.; Mentel, G.; Brożyna, J. Modelling European sovereign default probabilities with copulas. Ekon. Istraživanja Econ. Res. 2019, 32, 1716–1726. [Google Scholar] [CrossRef] [Green Version]
- Jiang, Y. Dynamics in the co-movement of economic growth and stock return: Comparison between the United States and China. Ekon. Istraživanja Econ. Res. 2019, 32, 1965–1976. [Google Scholar] [CrossRef] [Green Version]
- Zhang, S. A note on the performance of the gamma kernel estimators at the boundary. Stat. Probab. Lett. 2010, 80, 548–557. [Google Scholar] [CrossRef]
- Fan, C.; Liu, L.; Guo, W.; Yang, A.; Ye, C.; Jilili, M.; Ren, M.; Xu, P.; Long, H.; Wang, Y. Prediction of Epidemic Spread of the 2019 Novel Coronavirus Driven by Spring Festival Transportation in China: A Population-Based Study. Int. J. Environ. Res. Public Health 2020, 17, 1679. [Google Scholar] [CrossRef] [Green Version]
Figure 1.
Gauss vs. Gamma COVID-19 density estimates, 20 March 2020 in mainland of China. Note: = 2.5, = 4.89.
Figure 1.
Gauss vs. Gamma COVID-19 density estimates, 20 March 2020 in mainland of China. Note: = 2.5, = 4.89.

Figure 2.
COVID-19 density estimates from 24 January 2020 to 20 March 2020 in mainland of China. Note: = 4.89 is applied to all of the density estimations for simplicity.
Figure 2.
COVID-19 density estimates from 24 January 2020 to 20 March 2020 in mainland of China. Note: = 4.89 is applied to all of the density estimations for simplicity.

Figure 3.
The density of COVID-19’s cumulative confirmed cases of LMG and SMG.

Figure 4.
Histogram of city-level average temperature in China from January 2020 to February 2020.

Figure 5.
The kernel density of city-level average temperature in China from January 2020 to February 2020. Note: = 3.42.
Figure 5.
The kernel density of city-level average temperature in China from January 2020 to February 2020. Note: = 3.42.

Figure 6.
(a) The multivariate density of the number of cumulative confirmed cases by 20 March 2020 and the average temperature of January to February. (b) Benchmark multivariate kernel density estimation which assumes f(x,y) = f(x)f(y). Note 1: = 3.42, = 4.89, 0.1584, 1.188. Note 2: (c) is the contour of (a). Similarly, (d) is the contour of (b).

Figure 7.
The kernel density of COVID-19’s cumulative confirmed cases of HTG and LTG.

Figure 8.
The kernel density of COVID-19’s cumulative confirmed cases of HTG and LTG within LMG.

Figure 9.
The kernel density of COVID-19’s cumulative confirmed cases of HTG and LTG within SMG.

Publisher’s Note: MDPI stays neutral with regard to jurisdictional claims in published maps and institutional affiliations. |
© 2021 by the authors. Licensee MDPI, Basel, Switzerland. This article is an open access article distributed under the terms and conditions of the Creative Commons Attribution (CC BY) license (https://creativecommons.org/licenses/by/4.0/).
Share and Cite
MDPI and ACS Style
Lin, W.; He, Q. The Influence of Potential Infection on the Relationship between Temperature and Confirmed Cases of COVID-19 in China. Sustainability 2021, 13, 8504. https://0-doi-org.brum.beds.ac.uk/10.3390/su13158504
AMA Style
Lin W, He Q. The Influence of Potential Infection on the Relationship between Temperature and Confirmed Cases of COVID-19 in China. Sustainability. 2021; 13(15):8504. https://0-doi-org.brum.beds.ac.uk/10.3390/su13158504
Chicago/Turabian StyleLin, Weiran, and Qiuqin He. 2021. "The Influence of Potential Infection on the Relationship between Temperature and Confirmed Cases of COVID-19 in China" Sustainability 13, no. 15: 8504. https://0-doi-org.brum.beds.ac.uk/10.3390/su13158504
Note that from the first issue of 2016, this journal uses article numbers instead of page numbers. See further details here.