Article

Effect of the Milking Frequency on the Concentrations of Ammonia and Greenhouse Gases within an Open Dairy Barn in Hot Climate Conditions

by
Provvidenza Rita D’Urso
and
Claudia Arcidiacono
*
Department of Agriculture, Food and Environment, Building and Land Engineering Section, University of Catania, Via Santa Sofia 100, 95123 Catania, Italy
*
Author to whom correspondence should be addressed.
Sustainability 2021, 13(16), 9235; https://0-doi-org.brum.beds.ac.uk/10.3390/su13169235
Submission received: 14 July 2021 / Revised: 11 August 2021 / Accepted: 12 August 2021 / Published: 17 August 2021

Abstract

:
Knowledge of how different management strategies affect gas production from livestock buildings can be helpful for emission predicting purposes and for defining mitigation strategies. The objective of this study was to statistically assess whether and how measured concentrations of ammonia (NH3), methane (CH4) and carbon dioxide (CO2) were influenced by milking frequency. Concentrations of gases were measured continuously by using infrared photoacoustic spectroscopy in the breeding environment of an open dairy barn located in Sicily in hot climate conditions. Data were acquired by specific in-field experiments carried out in 2016 and 2018, when milking sessions occurred twice a day (2MSs) and three times a day (3MSs), respectively. The number of the milking cows was 64 in both 2MSs and 3MSs. The results showed that concentrations of NH3, CH4 and CO2 were statistically influenced by the number of milking sessions. From 2MSs to 3MSs, NH3 concentrations were enhanced (p < 0.001) due to the higher cow’s activity. Conversely, gas concentrations of CH4 and CO2 were lower for 3MSs compared to those for 2MSs due to the effect of the different feeding frequency. Overall, the milking frequency influenced barn management and cow behaviour by modifying the level of gas concentrations in the barn environment.

1. Introduction

Gaseous emissions from the dairy livestock sector have been one of the main sources of environmental pollution [1]. One harmful greenhouse gas produced by ruminants is methane (CH4), which contributes to global warming. In 2019, the European Union contributed to the CH4 emissions from enteric fermentation and manure management with an implied emission factor of 130 and 20.8 kg/head/year, respectively [2]. Besides CH4, emission of ammonia (NH3) is a crucial topic, because NH3 is responsible for acidification of soil and water, as well as for the formation of secondary particulate matter [3]. Since the demand for dairy products is expected to increase due to the population’s growth, the intensification of milk production will require a greater attention for fulfilling the reduction of gaseous emissions. Moreover, the heat stress risk in European dairy cattle due to global warming is likely to influence emissions, increasing NH3 and CH4 by approximately 16 Gg and 0.1 Gg per year, respectively, by the end of the century [4].
Mitigation strategies have been proposed at the farm scale [5] in order to reduce the environmental impact of milk production from dairy cows, including: housing system type [6]; different floor type and manure handling systems [7,8]; application of urease inhibitors [9]; application of processing residues in the coffee industry on manure [10]; combinations of techniques (e.g., floor system and cleaning, floor system and manure acidification) [11], and increased production efficiency at an animal level though genetics, feeding management and nutrition [12,13,14,15,16].
Currently, in the literature, the environmental impact of milking frequency on the reduction of gas emissions has not yet been thoroughly investigated. The main available studies are mainly focused on the effect of milking frequency on the animal, and few are related to environmental issues. In detail, the effect of milking frequency has been found to be dependent on milk production, composition and milk quality [17,18,19]. The management choice of changing from two to three milkings proved to increase milk yield by up to 20% [18], though the economic advantages due to the additional milk yield obtained are not always ensured. In fact, different studies in the literature also assessed the economic aspects related to the increase of milking frequencies [19,20,21,22].
The environmental impacts due to the introduction of the third milking were estimated through a Life Cycle Assessment (LCA) by Bacenetti et al. [23] in a conventional intensive dairy farm. This solution allowed for a reduction of acidification and eutrophication potential, as well as the global warming potential. However, the applied LCA from a cradle-to-farm gate perspective estimated emissions of ammonia, methane and nitrous oxide from equations available in the literature, i.e., the study did not include the measurement of gas concentrations in the barn environment.
The measurement of gas concentrations has a relevant role in the estimation of gaseous emissions as it was reported in the VERA protocol [24]. A number of studies have investigated the variability of gas concentrations due to environmental parameters [25] and sampling locations in the barn [26]. The animal activities related to the cow movement were studied by Ngwabie et al. [27]. They assessed the effect of animal activity on gas emissions in an automatic milking system, however the influence on gas concentrations was not analysed. In a recent study by D’Urso et al. [28], it was found that there was a significant influence of cow behaviour and barn management on gas concentrations, whereas different milking frequencies were not evaluated.
Based on the analysed literature in the field, it can be observed that there is a lack in the investigation on the daily variability of gas concentrations due to a different number of milking sessions. In detail, gas concentrations at different milking frequencies have not been measured yet in the barn environment, and the effect of the different management practices due to the additional milking has not yet been analysed. Moreover, no data are available for such management strategies in the hot summer Mediterranean climate. Filling these research gaps could be useful to improve the environmental sustainability at the barn scale based on a specific management that would produce lower gas concentrations in the breeding environment.
Therefore, this paper aims to provide knowledge on gas concentrations at different milking frequencies in a dairy housing system in Sicily during summer. The research hypothesis regarded the connection between milking frequency and gas concentrations in the barn environment. Therefore, the research objective was to statistically assess whether and how measured concentrations were influenced by the milking frequency deriving from the cow’s routine due to different barn management.
The specific objectives of this study were as follows: (i) to assess whether the introduction of an additional milking session could reduce gas concentrations; (ii) to evaluate the influence of a different cow’s behaviour (i.e., activity and lying) on gas concentrations; (iii) to study the daily trend of gas concentrations at different milking frequencies.

2. Materials and Methods

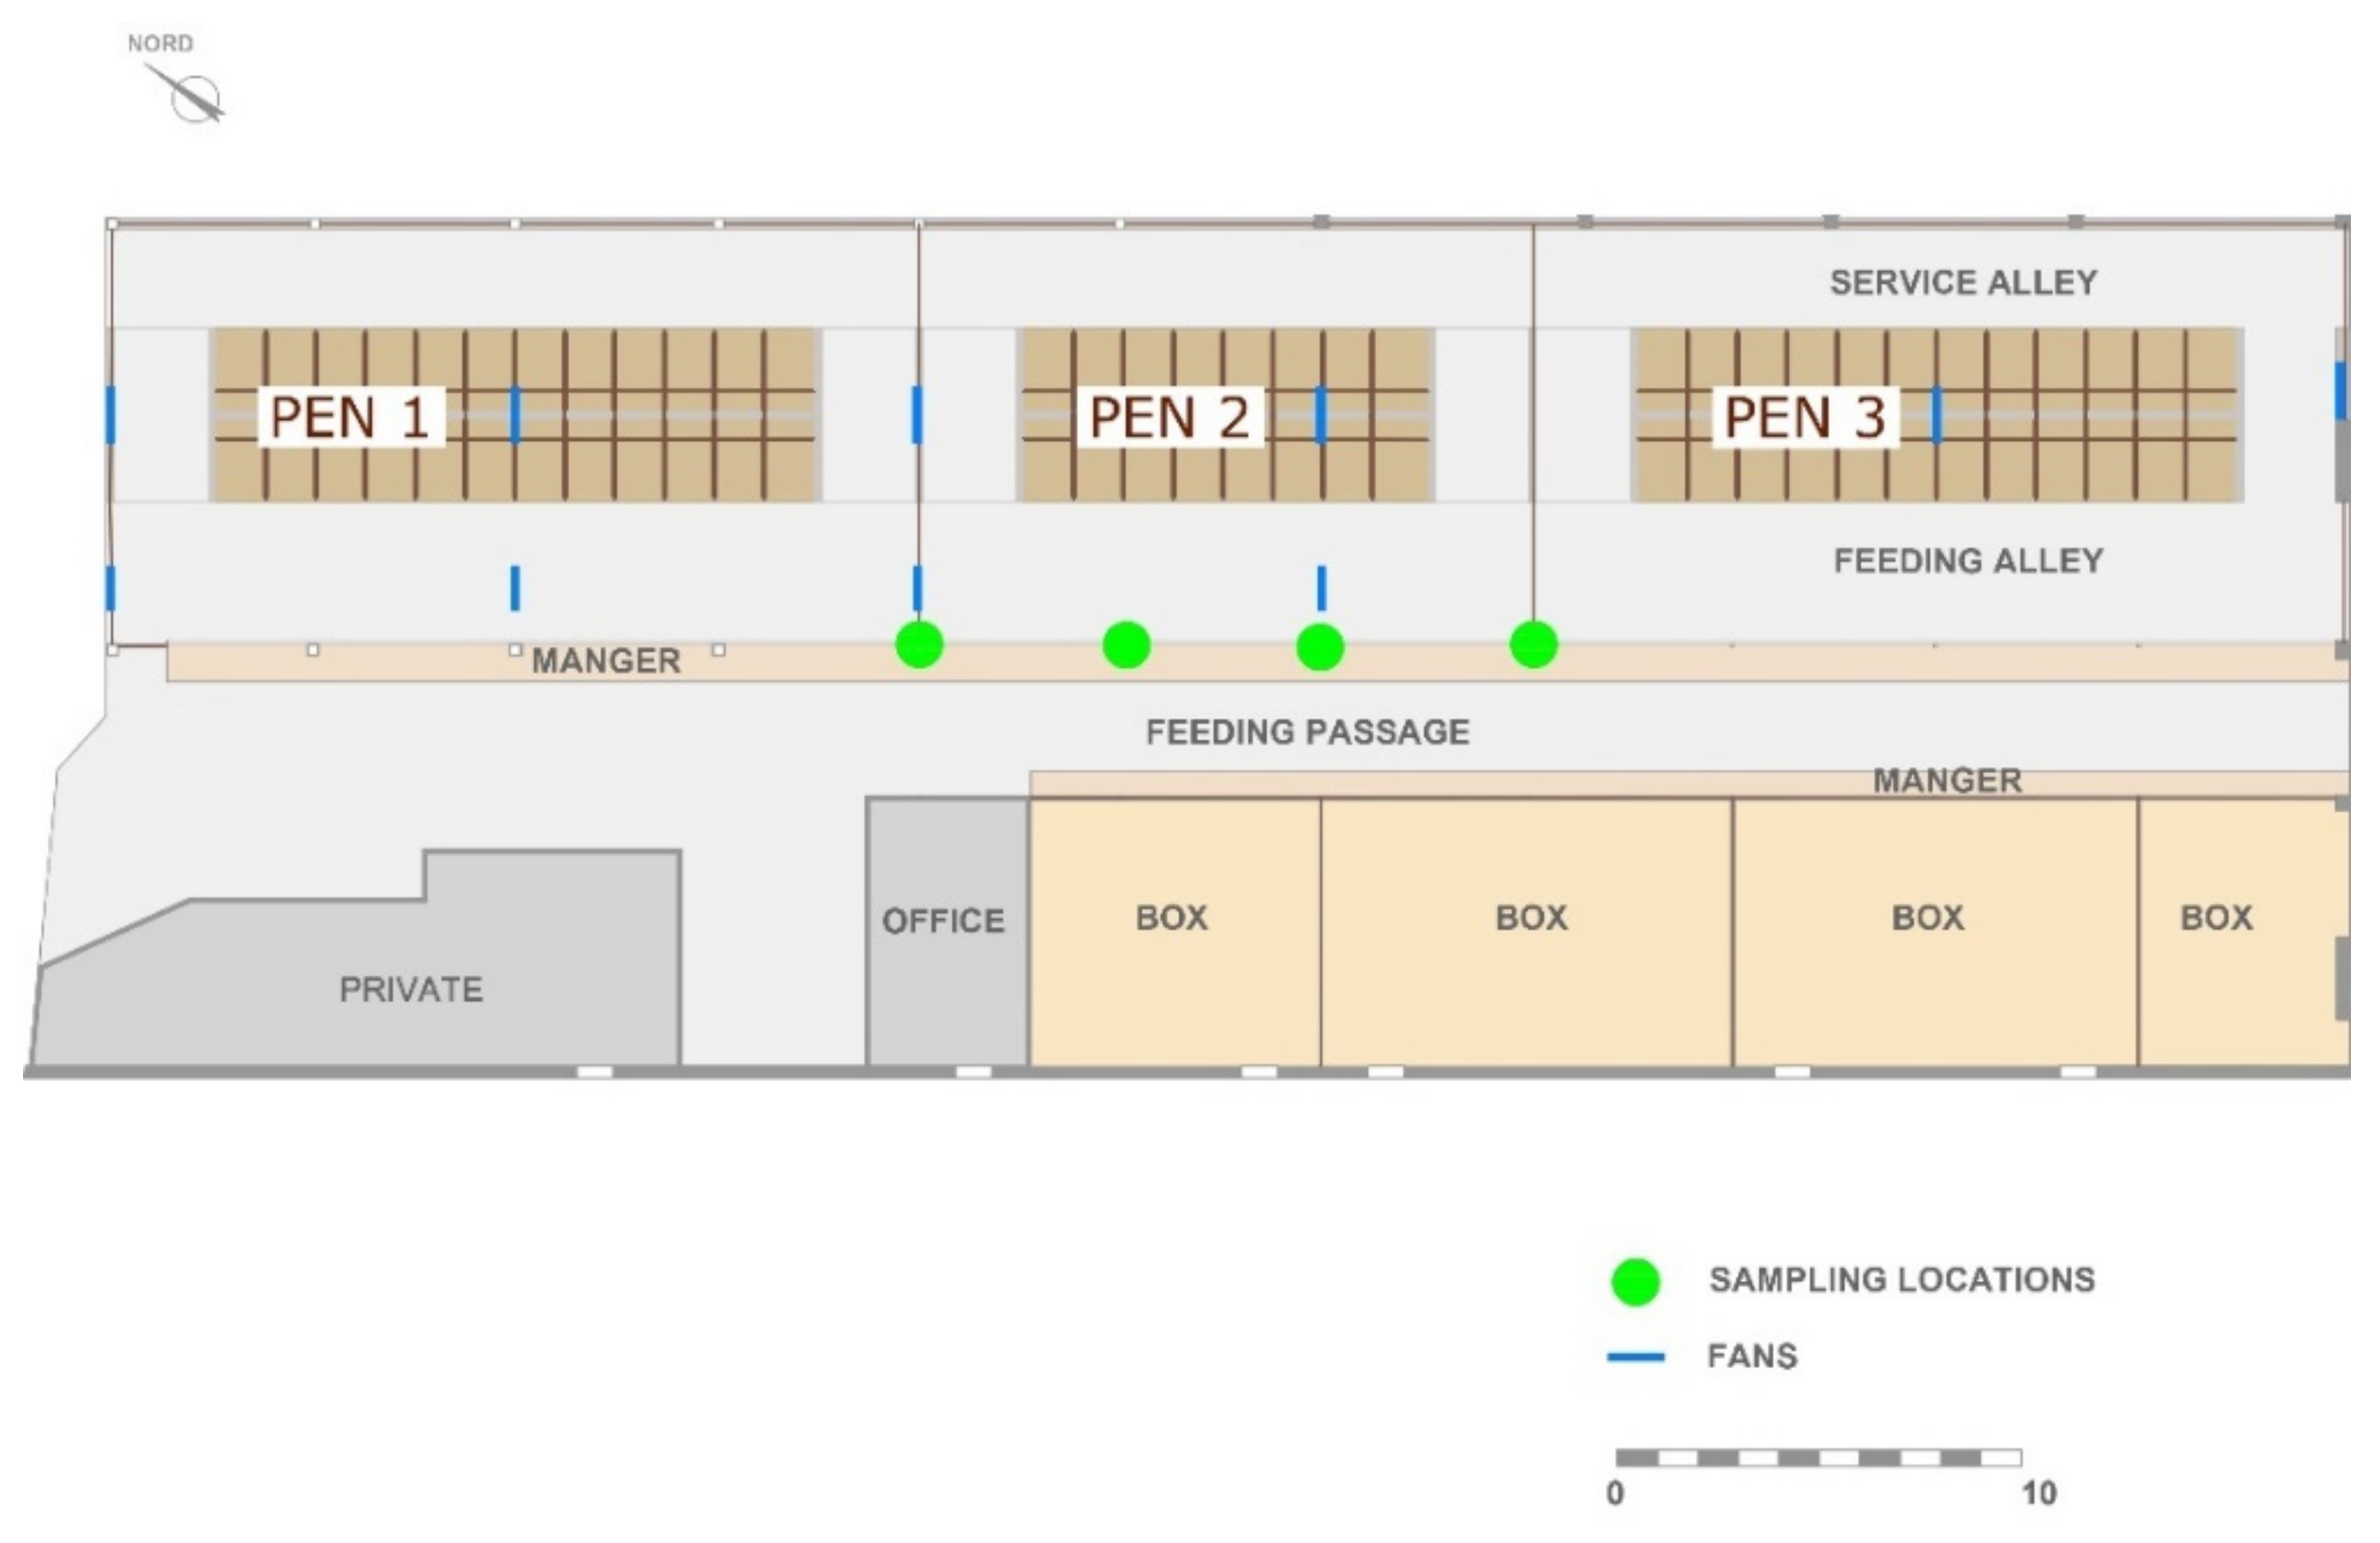
2.1. Experimental Site

Measurements were carried out in a cubicle free-stall dairy barn located in Pettineo/Pozzilli (37°01′ N, 14°32′ E) in Sicily (Italy), at an altitude of 234 m above sea level. This area is classified as belonging to the hot summer Mediterranean climate (Csa in Köppen classification) where climate is characterised by temperatures above 22 °C in the warmest month, and precipitation values lower than 30 mm in the driest month in summer. Due to the hot climatic conditions, the dairy facility was composed of a building with three sides (i.e., the SE, NE, and NW sides) characterised by the absence of the perimeter walls, whereas the SW side was enclosed by a continuous wall with small openings. The dimensions of the barn were 55.50 m length and 20.80 m width. The roof was symmetrical with a central ridge vent, whilst the ridge height was 7 m and the eave height was 4 m.
In the barn, there were 64 head-to-head cubicles, organised into three pens on a solid concrete floor. Each pen was composed of a resting area, a feeding area, and a service alley (Figure 1). The cubicles were arranged into two rows, and they were made of concrete kerbs covered with sand. In order to mitigate the effect of the hot climate conditions, the barn was equipped with a fogging system with fans in the resting area, and a sprinkler system with fans in the feeding alley.

2.2. Periods of Data Collection and Barn Management

Measurements were carried out during two different periods: 15–21 June 2016 and 19–25 June 2018, with climatic conditions representative of a hot summer Mediterranean climate, classified as Csa in the Köppen classification. Meteorological data (i.e., temperature, wind speed and direction) were provided by the Sicilian Agro-meteorological Information Service (SIAS) and acquired by the nearby weather station located in Acate. The two periods were different for the number of milking sessions (MSs) with a different barn management: MSs occurred twice a day in 2016 and three times a day in 2018. Sixty-four Friesian cows were housed in the barn in both 2MSs and 3MSs. Milking was carried out in a nearby building north of the barn. During the MSs, cows were moved to in the milking parlour in three groups, one for each pen. The barn was cleaned once a day by a tractor with a scraper after the first MS in both 2016 and 2018. Specifically, cows were moved away from the area of the pen that cleaning was taking place. After the cleaning, the feeding ratio, composed of a mixed ratio with concentrate, was delivered. Figure 2 shows the cows’ routine during the two different periods. In 2016, milking was carried out twice a day, whereas in 2018 it was increased to three times a day. Feed was delivered after the cleaning of the barn in both 2016 and 2018. During the day, the feed was moved closer to the manger before the first and the second MS in 2016, and before the first, the second and the third MSs in 2018.
The cooling systems in the feeding alley and in the resting area were manually switched off during the MSs and the cleaning. Conversely, the sprinkler system in the feeding alley was always turned on during each MS. Fans in the feeding alley and resting area were automatically switched on when the indoor temperature exceeded 20.9 °C and 22 °C, respectively, whereas the sprinklers were operated when the indoor temperature was greater than 28 °C. Based on the outcome of the previous studies [28] carried out in the same periods, the central hours of the day were characterised by higher air velocities along the barn axis compared to other hours of the day.

2.3. Measurements of Gas Concentrations

Concentrations of NH3, CH4 and CO2 were continuously measured by a photoacoustic spectroscope analyser (INNOVA). The instrument consisted of a Multigas Monitor mod 1412i and a multipoint sampler 1409/12 (Lumasense Technology A/S, Denmark). The measurement principle is an application of the photoacoustic effect as it was reported in other studies [29,30]. The INNOVA had 12 inlet channels and an air-filter was attached to the end of each sampling tube of each to keep the sampler clean of dust or particles. In order to reduce the adsorption of samples, the sampler system was made of AISI-316 stainless steel and PTFE (poly-tetrafluoroethylene) tubing. The detection thresholds of the optical filters were 0.2 ppm for NH3, 0.4 ppm for CH4, and 1.5 ppm for CO2.
Four sampling locations (SLs), located in the central area of the barn, measured gas concentrations at 0.20 from the floor. Based on previous outcomes [28], the SLs installed at the perimeter and corner locations in the barn were not considered in this study. In fact, it was found that gas concentrations at those locations were much lower and uneven than gas concentrations at the centre of the barn. Gas concentrations were continuously acquired, and hourly mean values were used for data analyses.

2.4. Statistical Analyses

For data analyses, the software Microsoft® Excel and Minitab were used. Statistical analyses were carried out to assess the influence cow behaviour on gas concentrations. In the first analysis, a one-way analysis of variance (ANOVA) was applied to two groups of NH3, CH4 and CO2 gas concentrations recorded during 2MSs and 3MSs, respectively. Moreover, the one-way ANOVA was applied to the climatic parameters (i.e., temperature and wind speed) for the same groups. The level of significance was defined by a p value of 0.05. For each period (i.e., 2MS, 3MS), a one-way ANOVA was applied to different groups of cow behaviours, i.e., activity and lying, influenced by the cows’ routine. In detail, the first group (activity) includes those activities where cows are in standing position, walking and feeding whereas the second group (lying) was composed of gas concentrations recorded when cows spent time in the cubicles at resting, ruminating, or sleeping.
For each significant test, the Tukey post hoc test was applied to identify differences between groups at p < 0.05.

3. Results

3.1. Influencing Parameters on Gas Concentrations

The results of the one-way ANOVA (Table 1) showed that gas concentrations were significantly influenced by the number of MSs. In detail, when barn management was based on 3MSs, NH3 concentrations were significantly higher (p < 0.001) than those when barn management was based on 2MSs. Conversely, gas concentrations of CH4 and CO2 were significantly lower at 3MSs (with p < 0.001 and p < 0.02, respectively). Although wind direction was the same in both 2MSs and 3MSs, the statistical analyses carried out on temperature and wind velocity showed a significant difference (p < 0.001) in the two periods. The mean values of temperature and wind velocity were 25.1 °C and 1.78 ms−1 for 2MSs and 21.8 °C and 1.08 ms−1 for 3MSs, respectively. In detail, the mean values of temperature and wind velocity were significantly higher during 2MSs compared those in 3MSs.
The influence of cow behaviour for each different barn management (i.e., 2MSs, 3MSs) is described in Table 2. The one-way ANOVA showed that gas concentrations were related to cows’ behaviour. A significant difference with p < 0.001 occurred for NH3, CH4 and CO2 when MSs were 2 and for CH4 and CO2 when MSs were 3. In detail, the level of gas concentrations in the barn during cow activity was always higher than those during lying. In 3MSs the results of the one-way ANOVA for NH3 showed that p value was above 0.05 and there was no significant difference between gas concentrations during lying and activity.
However, this latter p value was near the limit of 0.05 (level of significance for ANOVA). Therefore, a deeper analysis was carried out to investigate the NH3 concentrations during the different hours of the day associated to cow’s routine. The results of the one-way analyses showed that there was a significant difference between groups of gas concentrations at different hours of the day for both 2MSs (p < 0.001) and 3MSs (p < 0.001). Based on the results showed in Table 3, in 2MSs the highest values of gas concentrations occurred about one hour after the end of the MSs (e.g., between 7–8 a.m. and 6–7 p.m.), whereas the lowest values of gas concentrations occurred in the central hours between about 11 a.m. and 4 p.m. In 3MSs, the highest values of gas concentrations were recorded during the first and the third milking, whereas during the second milking lower gas concentrations were detected.

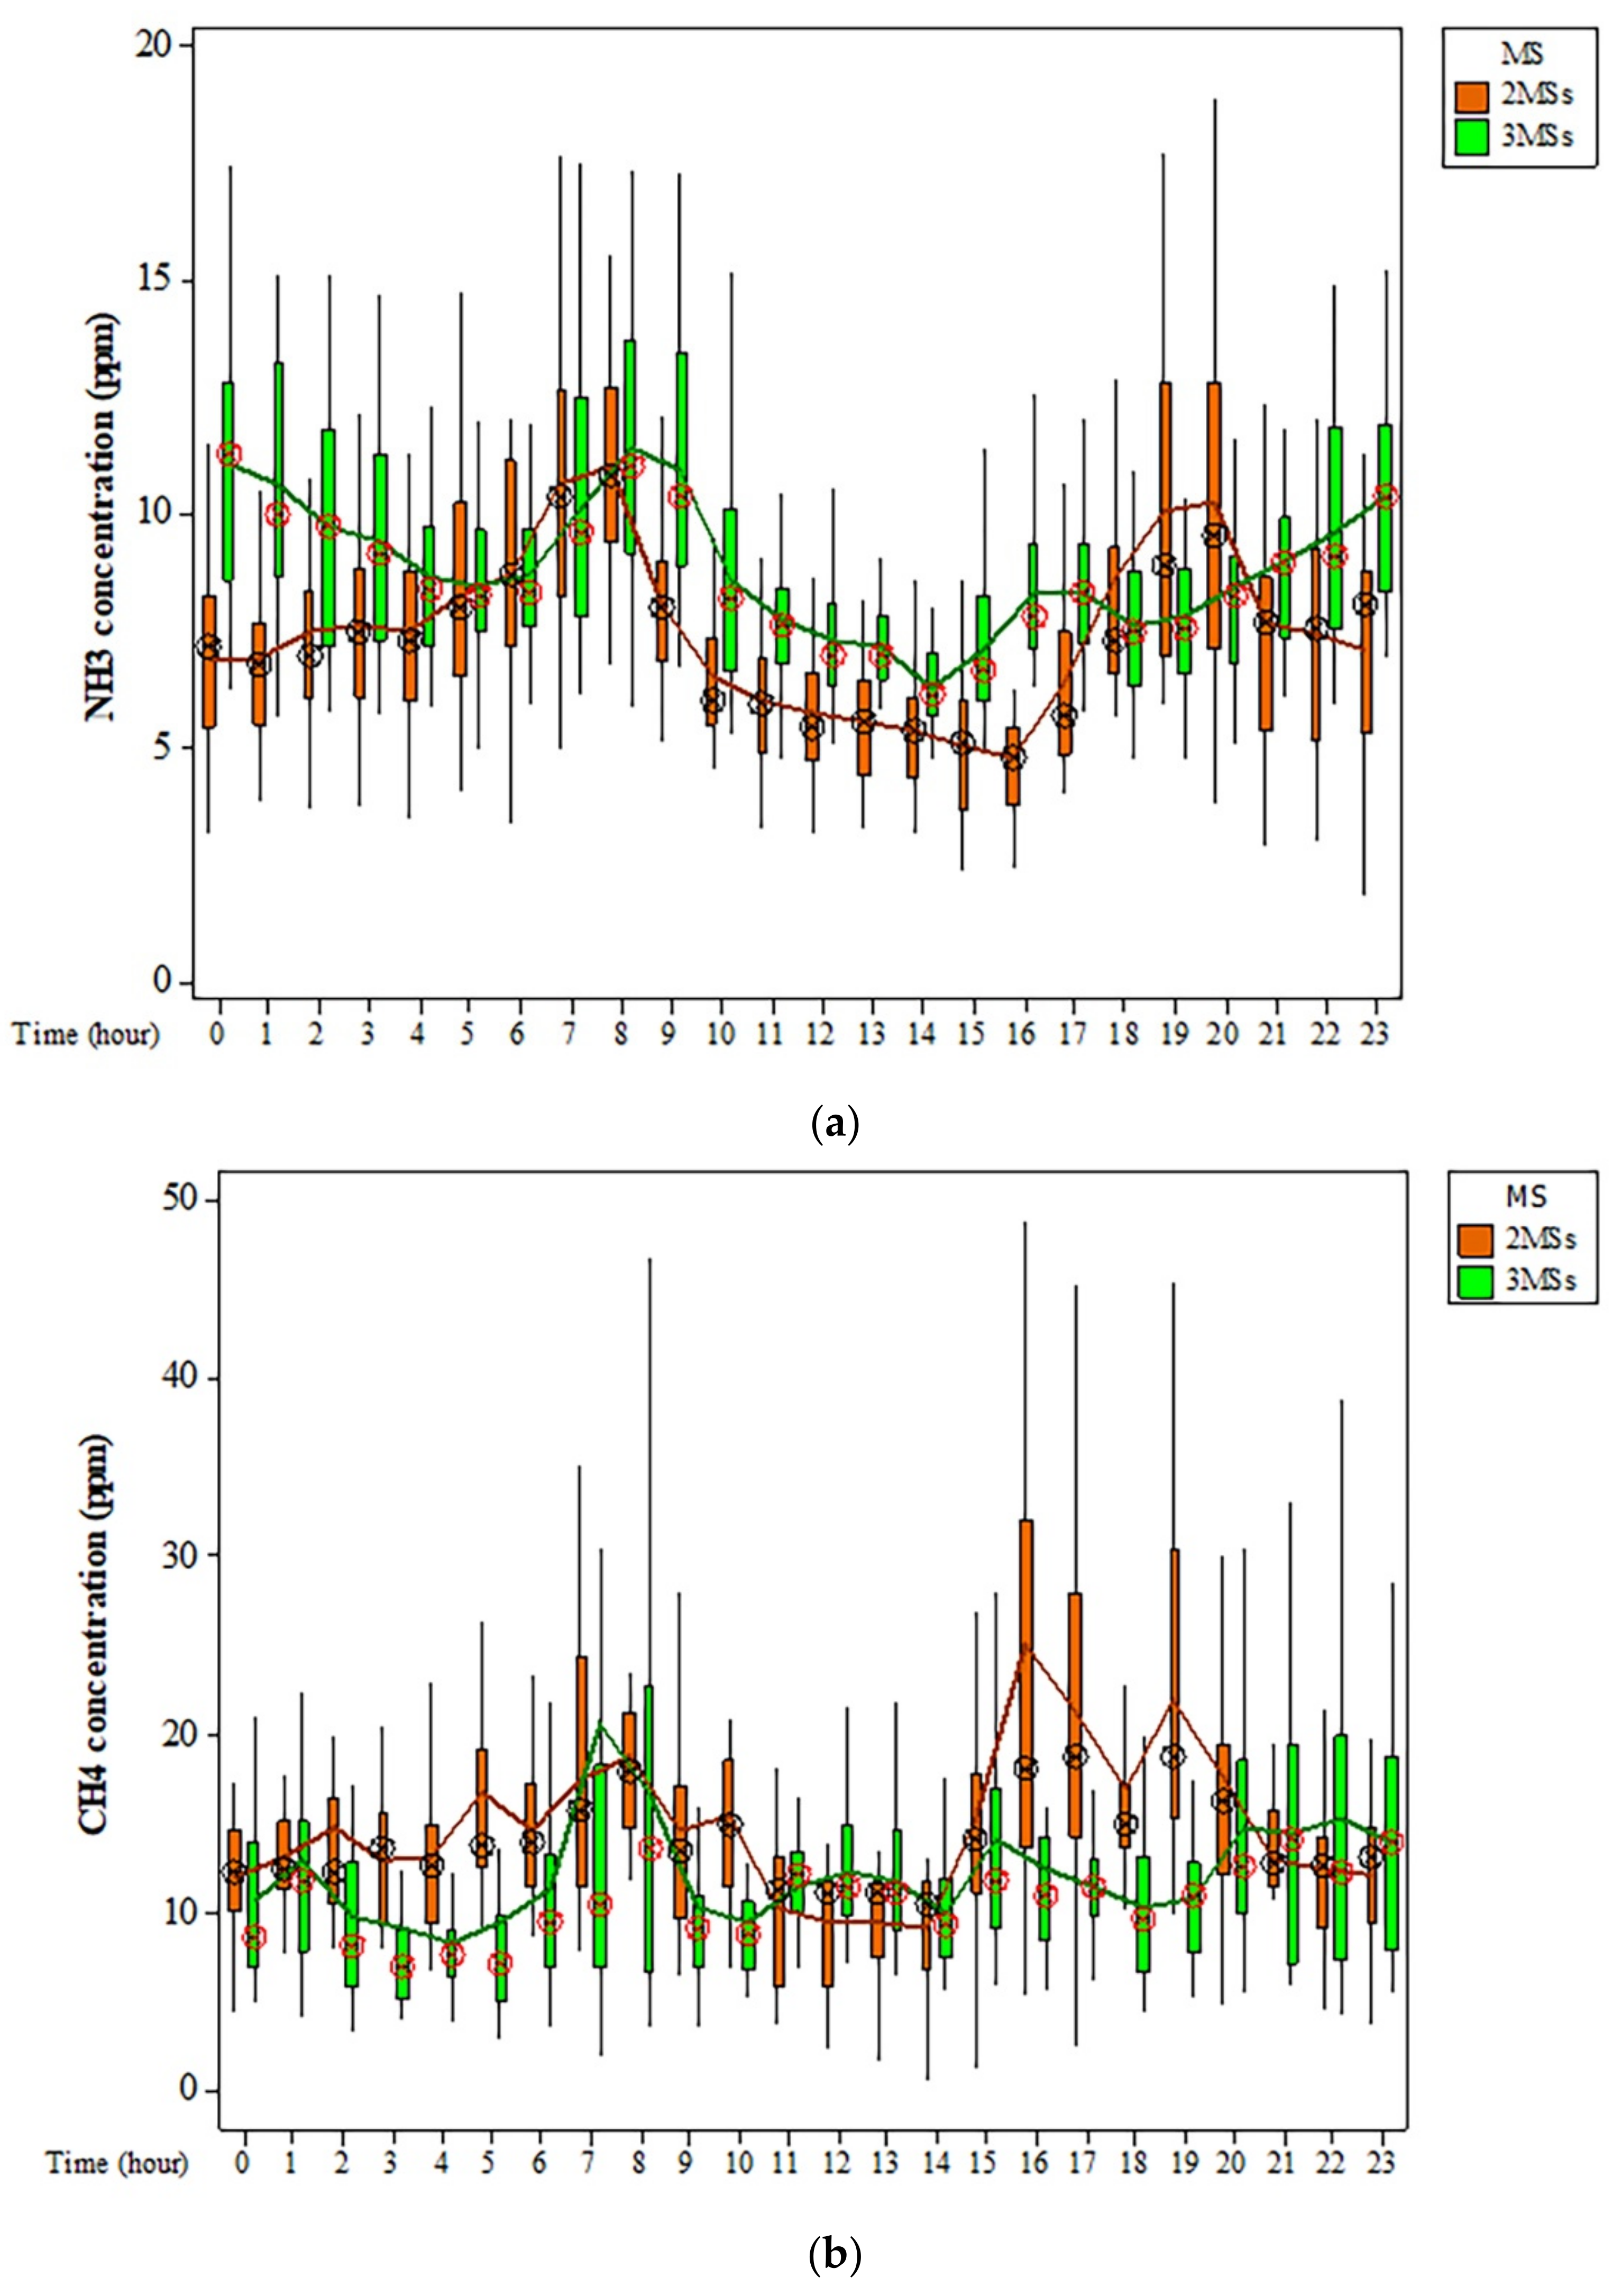
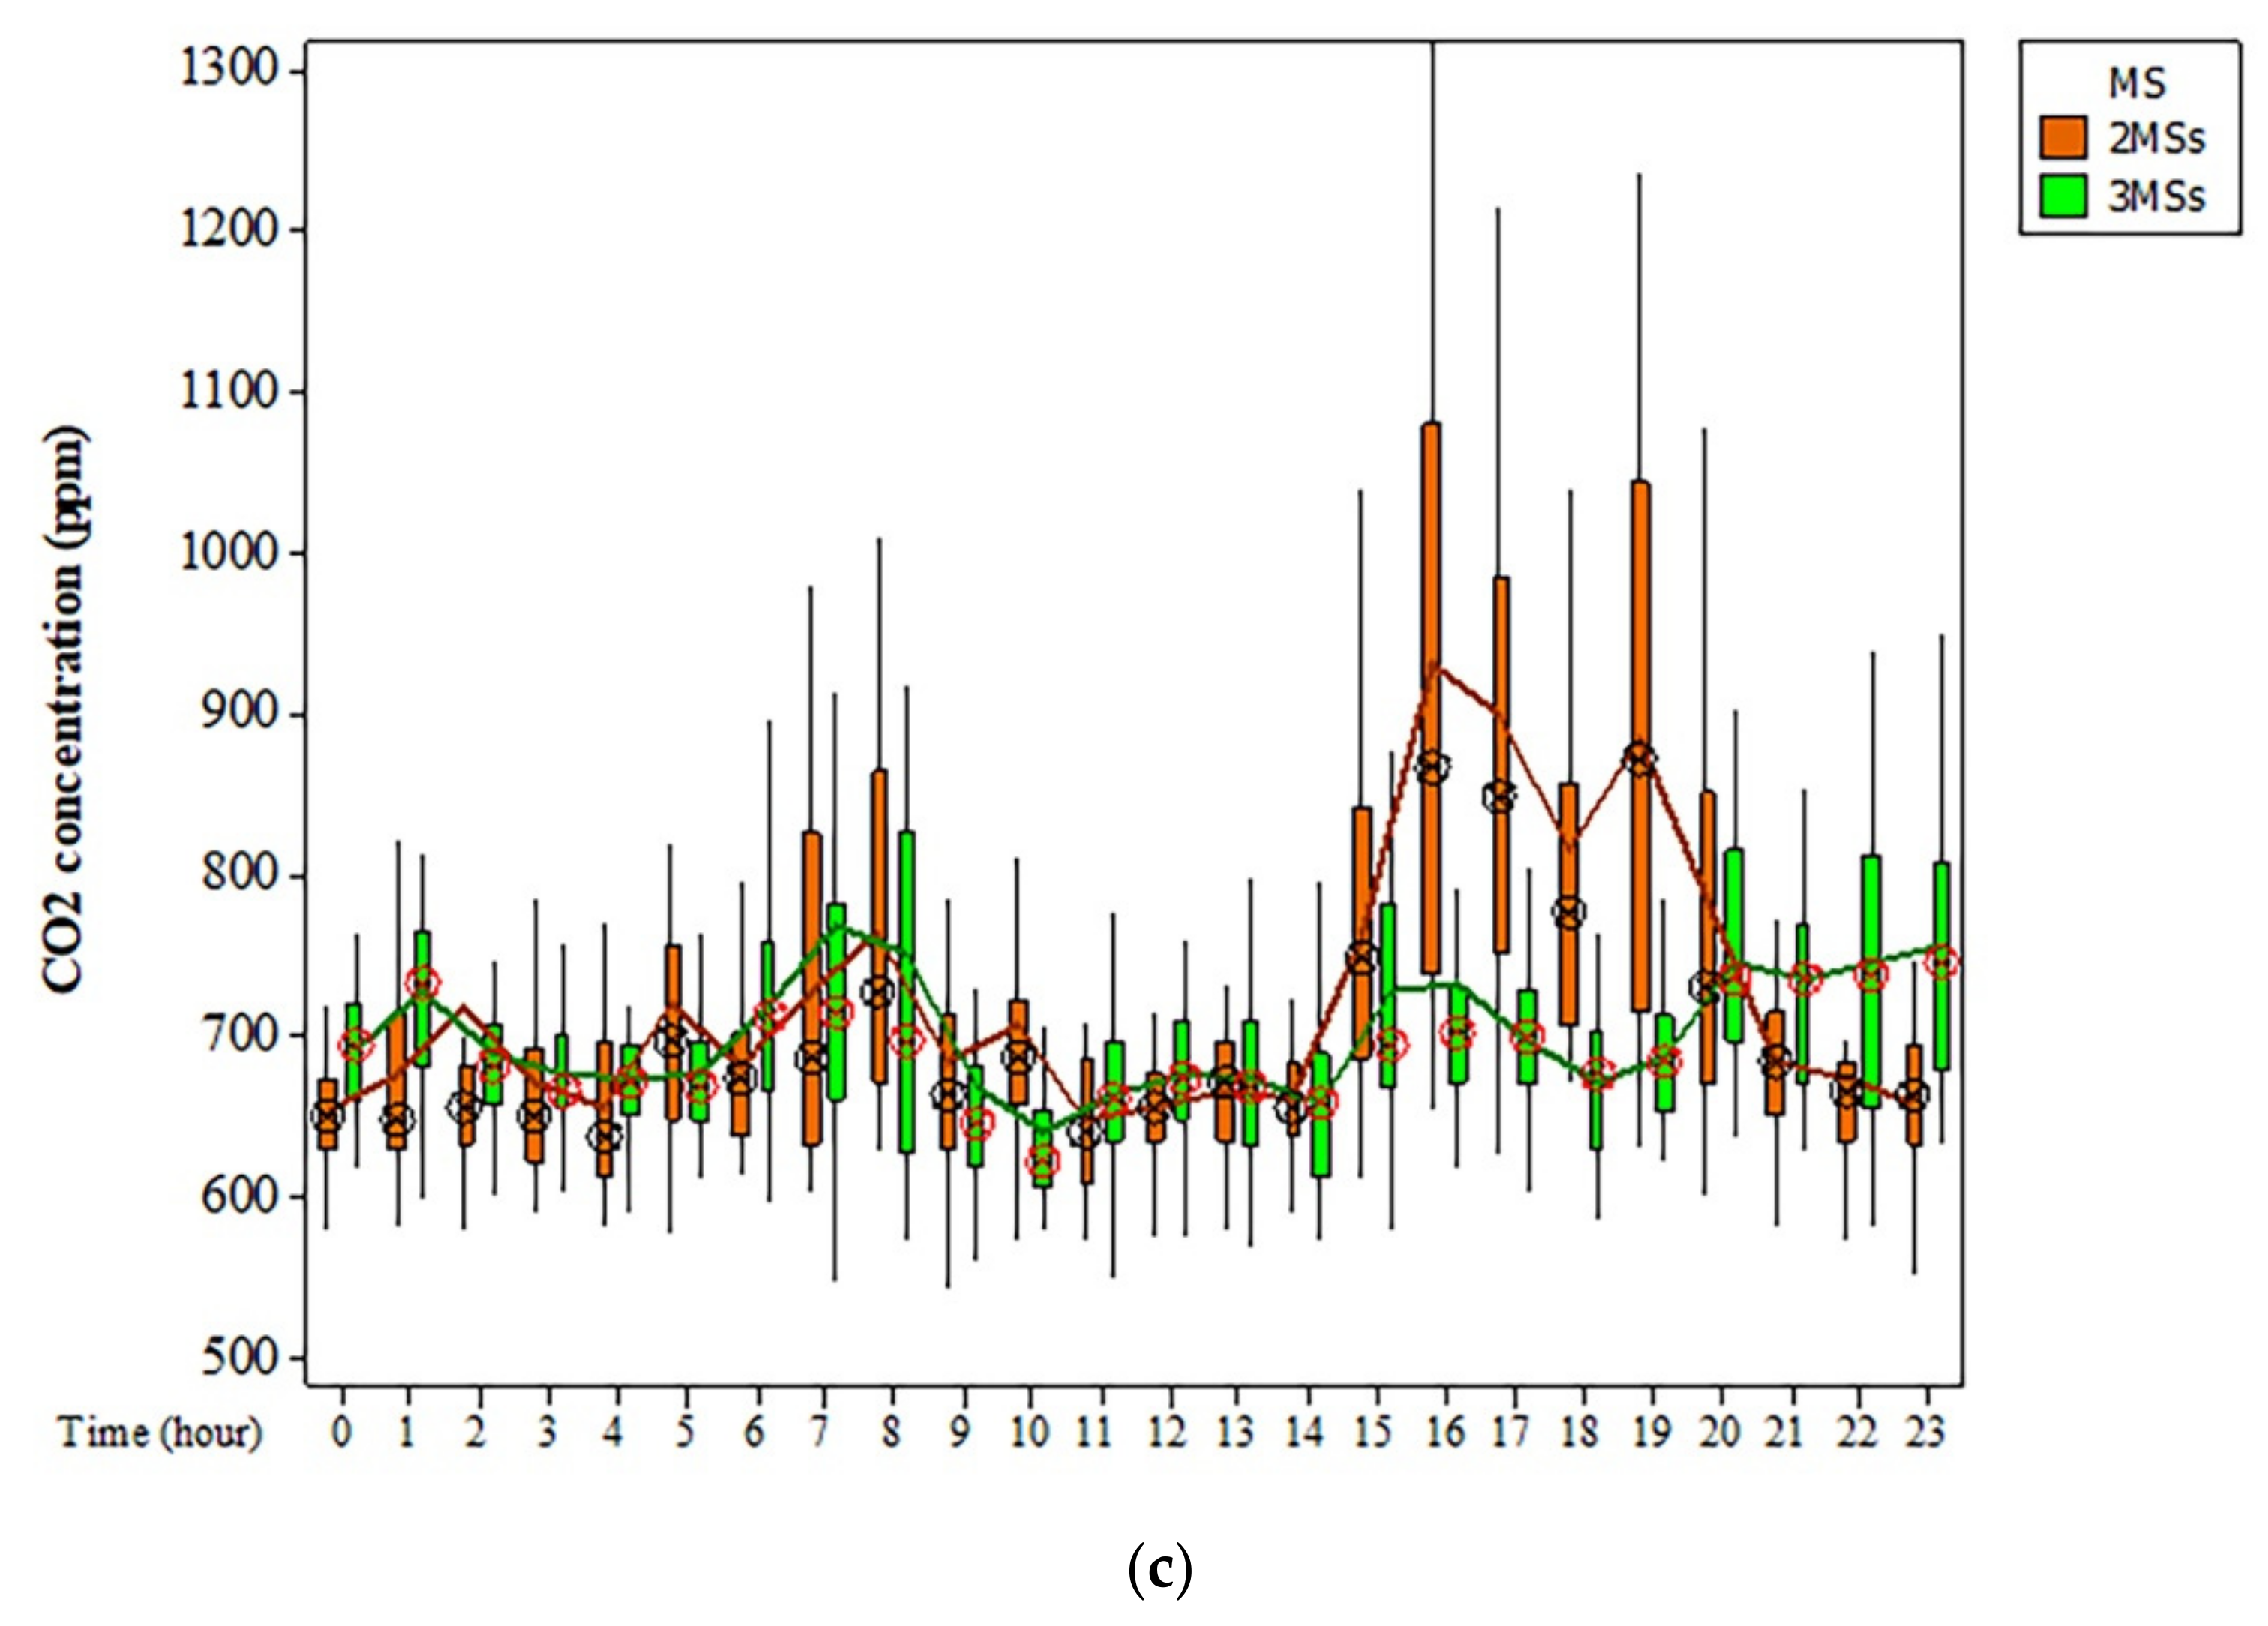
3.2. Average Daily Trend of Gas Concentrations

The trend of gas concentration showed different peaks during a 24-h analysis, obtained by averaging the values collected at the same hour in the week considered (Figure 3). This subsection shows the connections between the peaks reported in Figure 3 and statistical analyses.
In 2MSs case study, peaks occurred twice a day for NH3 at 7 a.m. and 7 p.m., whereas a decreasing trend was observed during the central hours (10 a.m.–4 p.m.) and at night. Three peaks of NH3 occurred in 3MSs case study at midnight, 8 a.m. and 4 p.m. The decrease in gas concentrations was characterised by shorter intervals in 3MSs than in 2MSs. Moreover, the area under the curve related to 3MSs (201.6 ppm day−1) was bigger than that under the curve related to 2MSs (172.1 ppm day−1). Concerning concentrations of CO2 and CH4, the curve related to CH4 showed a similar trend compared to that related to CO2 during both the experiments. In detail, concentrations of CO2 and CH4 in 2MSs were greatly enhanced during the afternoon (3–7 p.m.), whereas in the morning small peaks occurred between 1 a.m. and 10 a.m. The difference between the maximum value of gas concentrations and the minimum one for CH4 (12.3 ppm) and CO2 (128.4 ppm) for 3MS was smaller than those for CH4 (16.0 ppm) and CO2 (283.5 ppm) for 2MSs. Moreover, the area under the curves of CH4 and CO2 decreased for 2MSs from 344.9 ppm day−1 and 16,723.6 ppm day−1, respectively, to 279.1 ppm day−1 and 16,132.9 ppm day−1 for CH4 and CO2, respectively, for 3MSs.

4. Discussion

Based on the results of the one-way ANOVA for 2MSs and 3MSs, the additional MS influenced the gas concentrations in the environment of the barn.
Specifically, the increase of NH3 from 2MSs to 3MSs could be attributed to the different barn management and the consequential modification of cow behaviour. In detail, 3MSs case study produced an increase in the cows’ activity duration due to the additional feeding before and after the third milking. As it is well known, one of the processes that produces NH3 is the mixing of urine and faeces as well as the phases of urine excretion. During the 3MSs case study, cows walked on the floor more than in the 2MSs case study with the consequence of increasing NH3 concentrations. In fact, during each MS, cows were moved in groups from the pen to the milking parlour to outside the barn. The production of NH3 was not instantaneous, and higher values of NH3 occurred about one hour after the beginning of the MSs in both 2016 and 2018 (Table 3). This could be due to the degradation of urea in NH3 that is not an instantaneous process as it was reported by Mendes et al. [11].
Based on the results, the increasing of NH3 from 2MSs to 3MSs occurred with a decrease of temperature and wind velocity from 2MSs to 3MSs. Although in the literature it was found that NH3 increased with higher temperature values [31], this effect was not recorded in this study. Moreover, in a previous study it was found that higher NH3 concentrations corresponded to lower air velocity values [28]. The outcomes found for NH3 showed that the effect of climatic parameters had a lower influence on gas concentrations than the number of MSs.
With regard to Table 3, the statistical analyses performed on weeks averages of gas concentrations at different hours showed that the highest values of NH3 corresponded to hours when cows are in activity. The exception related to the second milking in the 3MSs case study, which could be explained by the fact that in the central hours of the day, air velocity was higher. In fact, Fiedler et al. [32] found lower CO2 concentrations for higher wind speed. Moreover, according to Saha et al. [25], the concentration reduction is expected with the increase of air velocity due to dilution and flushing. In addition, the activation of the sprinkler/fogging systems in the hottest hours reduced NH3 concentrations of urine pools on the floor through the dilution with water [8], as well as reduced NH3 concentration in the air is expected at increasing of relative humidity [33].
Concerning gas concentrations of CO2 and CH4, the statistical results are similar due to the high correlations found in other studies [28,34,35]. This is due to the fact that the main source of CO2 and CH4 can be attributed to enteric fermentation and respiration [35]. In detail, eructation from cows has been reported as the major source for CH4 release in ruminants [36]. Moreover, for the same kind of housing system under study, it was found that the CO2 released from manure was less than 5% of the total CO2 production due to the absence of the deep-litter [37].
Besides the reduction effect of wind speed on concentrations, the reduction of CH4 and CO2 from 2MSs to 3MSs could be influenced by the scheduling of the feeding delivery three times a day, being equal to the overall daily quantity of feed delivered. In fact, in the study by Garnsworthy [38], CH4 showed high and frequent peaks when cows were eating due to eructation events. In this study, the daily trend of gas concentrations showed that the main peaks occurred during activity when cows were eating, after which the feed was delivered or pushed in the barn. In fact, the feed delivering time was proved to correspond to the greatest cows’ feeding activity [39]. Moreover, in the central hours of the day, both climatic conditions and the cooling system lowered gas concentrations. However, in 3MSs there was a small peak at 2 a.m. when cows were lying, approximately 4 h after feeding. This 4-h interval is in line with the study by Schirmann et al. [40], who found a great rumination activity after about 4 h from feeding.
Based on the analyses of the daily trend of the gases, the peaks of CH4 and CO2 in 2016 were higher in the afternoon than those in the morning, whereas the peaks of CH4 and CO2 in 2018 were higher in the morning than those in the afternoon. This outcome could be attributed to the fact that in 2018, feed ingested in the last MS (11 p.m. to 12 a.m.) determined the peak at 7 a.m. due to rumination during the morning after the sleeping time. In 2016, the small peaks of CH4 and CO2 during the morning were lower than those in the afternoon because cows ruminated more during the early afternoon. Finally, the numerous peaks during the night were related to activities of small groups of cows, as was found in a previous study [28].

5. Further Research Needs

In this study, results showed a reduction in gas concentrations only for CH4 and CO2 from 2MSs to 3MSs. To obtain a reduction for all the gases, including NH3, further studies should consider the combination of the additional milking and the application of different mitigation techniques. Moreover, further parameters could be monitored, such as feed intake, water intake, milk yield, urination frequency and rumination activity. Since the computation of gas emissions is based on the product of the concentration difference and the ventilation rate, further studies should investigate the effect of different milking frequencies on gas emissions. This aspect has a relevant role in the environmental sustainability of the farming system, although it represents one of the three main pillars of sustainability. In the context of an increasing awareness of economic profitability, social well-being, and environmental impacts of dairy production systems, the research should be oriented towards an integrated approach to identify adequate barn management strategies that could be applied to obtain profitable productions by the minimisation of environmental and social impacts besides the optimisation of cow health and welfare.

6. Conclusions

The present study described the variation of gas concentrations from two milking sessions to three milking sessions in a cubicle free-stall dairy barn in South Italy. To date, little attention has been paid to milking frequency as a mitigation strategy. The most notable finding is related to the influence of cow behaviour on gas concentrations, as the different milking frequency changes the barn management. Statistical analyses proved that an additional milking session produced a significant increase of NH3 concentrations and a reduction of CH4 and CO2 in the barn environment.
Based on the results, the additional milking session could be considered alone as a mitigation strategy for CH4 and CO2 concentrations, but further studies are needed to estimate emissions in order to establish the level of reduction and compare this technique to others. Moreover, though NH3 concentrations were enhanced, further studies could combine the introduction of the third milking with other mitigation strategies to find sustainable solutions for the reduction of the various noxious gases produced in the barn environment.

Author Contributions

Conceptualization, P.R.D. and C.A.; methodology, P.R.D. and C.A.; software, P.R.D.; validation, P.R.D. and C.A.; formal analysis, P.R.D.; investigation, P.R.D. and C.A.; resources, C.A.; data curation, P.R.D. and C.A.; writing—original draft preparation, P.R.D.; writing—review and editing, C.A.; visualization, P.R.D.; supervision, C.A.; project administration, C.A.; funding acquisition, C.A. All authors have read and agreed to the published version of the manuscript.

Funding

The research study was funded by the University of Catania through the ‘Piano incentivi per la ricerca di Ateneo 2020-2022-Linea 2′ project on ‘Engineering solutions for sustainable development of agricultural buildings and land (LANDSUS)’ (ID: 5A722192152) coordinated by Claudia Arcidiacono. The INNOVA device was funded by the project “Centro per l’innovazione dei sistemi di qualità tracciabilità e certificazione dell’agroalimentare”—AGRIVET (ID: G46D15000170009).

Institutional Review Board Statement

Not applicable.

Informed Consent Statement

Not applicable.

Data Availability Statement

Data available on request due to privacy restrictions.

Acknowledgments

The authors are grateful to the farm ALPA S.S. for giving the opportunity of carrying out the tests. The authors further thank the Sicilian Agro-meteorological Information Service (SIAS, http://www.sias.regione.sicilia.it/) for providing measured weather data.

Conflicts of Interest

The authors declare no conflict of interest.

References

  1. FAO; GDP. Climate Change and the Global Dairy Cattle Sector—The Role of the Dairy Sector in a Low-Carbon Future; FAO: Rome, Italy, 2019. [Google Scholar]
  2. European Environment Agency. Annual European Union Greenhouse Gas Inventory 1990–2019 and Inventory Report 2021. Submission to the UNFCCC Secretariat; European Environment Agency: Brussels, Belgium, 2021. [Google Scholar]
  3. Samer, M. Emissions inventory of greenhouse gases and ammonia from livestock housing and manure management. Agic. Eng. Int. CIGR J. 2013, 15, 29–54. [Google Scholar]
  4. Hempel, S.; Menz, C.; Pinto, S.; Galán, E.; Janke, D.; Estellés, F.; Müschner-Siemens, T.; Wang, X.; Heinicke, J.; Zhang, G.; et al. Heat stress risk in European dairy cattle husbandry under different climate change scenarios—Uncertainties and potential impacts. Earth Syst. Dynam. 2019, 10, 859–884. [Google Scholar] [CrossRef] [Green Version]
  5. Novak, S.M.; Fiorelli, J.L. Greenhouse gases and ammonia emissions from organic mixed crop-dairy systems: A critical review of mitigation options. Agron. Sustain. Dev. 2010, 30, 215–236. [Google Scholar] [CrossRef] [Green Version]
  6. Poteko, J.; Zahnera, M.; Schrade, S. Effects of Housing System, Floor Type and Temperature on Ammonia and Methane Emissions from Dairy Farming: A Meta-Analysis. Biosyst. Eng. 2019, 182, 16–28. [Google Scholar] [CrossRef]
  7. Zhang, G.; Strøm, J.; Li, B.; Rom, H.; Morsing, S.; Dahl, P.; Wang, C. Emission of Ammonia and Other Contaminant Gases from Naturally Ventilated Dairy Cattle Buildings. Biosyst. Eng. 2005, 92, 355–364. [Google Scholar] [CrossRef]
  8. Baldini, C.; Borgonovo, F.; Gardoni, D.; Guarino, M. Comparison among NH3 and GHGs emissive patterns from different housing solutions of dairy farms. Atmos. Environ. 2016, 141, 60–66. [Google Scholar] [CrossRef]
  9. Bobrowski, A.B.; Willink, D.; Janke, D.; Amon, T.; Hagenkamp-Korth, F.; Hasler, M.; Hartung, E. Reduction of ammonia emissions by applying a urease inhibitor in naturally ventilated dairy barns. Biosyst. Eng. 2021, 204, 104–114. [Google Scholar] [CrossRef]
  10. Arcidiacono, C.; Porto, S.M.C.; Cascone, G. On ammonia concentrations in naturally ventilated dairy houses located in Sicily. Agric. Eng. Int. 2015, 294–310. [Google Scholar]
  11. Mendes, L.B.; Pieters, J.G.; Snoek, D.; Ogink, N.W.; Brusselman, E.; Demeyer, P. Reduction of ammonia emissions from dairy cattle cubicle houses via improved management- or design-based strategies: A modeling approach. Sci. Total. Environ. 2017, 574, 520–531. [Google Scholar] [CrossRef]
  12. Knapp, J.R.; Laur, G.L.; Vadas, P.A.; Weiss, W.P.; Tricarico, J.M. Enteric methane in dairy cattle production: Quantifying the opportunities and impact of reducing emissions. J. Dairy Sci. 2014, 97, 3231–3261. [Google Scholar] [CrossRef] [Green Version]
  13. Pickering, N.K.; Oddy, V.R.; Basarab, J.; Cammack, K.; Hayes, B.; Hegarty, R.S.; Lassen, J.; McEwan, J.C.; Miller, S.; Pinares-Patiño, C.S.; et al. Animal board invited review: Genetic possibilities to reduce enteric methane emissions from ruminants. Anim. Int. J. Anim. Biosci. 2015, 9, 1431–1440. [Google Scholar] [CrossRef] [Green Version]
  14. De Arkaute, G.M. Mitigation of greenhouse gases in dairy cattle via genetic selection: 1. Genetic parameters of direct methane using noninvasive methods and proxies of methane. J. Dairy Sci. 2020, 103, 7199–7209. [Google Scholar]
  15. Zhang, X.; Amer, P.R.; Jenkins, G.M.; Sise, J.A.; Santos, B.; Quinton, C. Prediction of effects of dairy selection indexes on methane emissions. J. Dairy Sci. 2019, 102, 11153–11168. [Google Scholar] [CrossRef]
  16. Poteko, J.; Schrade, S.; Zeyer, K.; Mohn, J.; Zaehner, M.; Zeitz, J.O.; Kreuzer, M.; Schwarm, A. Methane Emissions and Milk Fatty Acid Profiles in Dairy Cows Fed Linseed, Measured at the Group Level in a Naturally Ventilated Housing and Individually in Respiration Chambers. Animals 2020, 10, 1091. [Google Scholar] [CrossRef]
  17. Boujenane, I. Effects of Milking Frequency on Milk Production and Composition of Holstein Cows during Their First Three Lactations Effects of Milking Frequency on Milk Production and Composition of Holstein Cows during Their First Three Lactations. Iran. J. Appl. Anim. Sci. 2019, 9, 25–29. [Google Scholar]
  18. Bortacki, P.; Kujawiak, R.; Czerniawska-Piątkowska, E.; Kirdar, S.S.; Wójcik, J.; Grzesiak, W. Impact of milking frequency on yield, chemical composition and quality of milk in high producing dairy herd. Mljekarstvo/Dairy 2017, 67, 226–230. [Google Scholar] [CrossRef] [Green Version]
  19. Sanchez-Duarte, J.; Garcia, A.; Rodríguez-Hernández, K.; Reta-Sánchez, D.; Salinas-Gonzalez, H.; Ochoa-Martínez, E.; Reyes-González, A. Production response in dairy cows milked two or three times a day. Vet. México OA 2020, 7. [Google Scholar] [CrossRef]
  20. Lopes, M.A.; Nogueira, T.M.; Barbosa, G.L. Economic viability of the third milking in systems of production using. Rev. Ceres 2014, 61, 544–551. [Google Scholar] [CrossRef] [Green Version]
  21. Lapja, M.A. The impact of three milkings a day on the production parameters and profitability in a large- scale Holstein-Friesian dairy herd. Int. J. Dairy Sci. 2021, 21, 2–7. [Google Scholar]
  22. Etiene, F.; Lopes, M.A.; Ruas, J.R.; Costa, M.D.; Rocha Júnior, V. Efeito da frequência de ordenhas de vacas mestiças na rentabilidade da atividade leiteira [Effect of frequency of milking crossbred cows in the profitability of dairy farming]. Med. Veterinária (UFRPE) 2017, 11, 53–61. [Google Scholar]
  23. Bacenetti, J.; Bava, L.; Zucali, M.; Lovarelli, D.; Sandrucc, A.; Tamburini, A.; Fiala, M. Anaerobic digestion and milking frequency as mitigation strategies of the environmental burden in the milk production system. Sci. Total. Environ. 2016, 539, 450–459. [Google Scholar] [CrossRef] [PubMed]
  24. VERA. Test Protocol for Livestock Housing and Management Systems, 3rd ed.; Verification of Environmental Technologies for Agricultural Production, International VERA Secretariat: Delft, The Netherlands, 2018. [Google Scholar]
  25. Saha, C.K.; Ammon, C.; Berg, W.; Loebsin, C.; Fiedler, M.; Brunsch, R.; Von Bobrutzki, K. The effect of external wind speed and direction on sampling point concentrations, air change rate and emissions from a naturally ventilated dairy building. Biosyst. Eng. 2013, 114, 267–278. [Google Scholar] [CrossRef]
  26. Mendes, L.B.; Edouard, N.; Ogink, N.W.M.; van Dooren, H.J.C.; Tinôco, I. de F.F.; Mosquera, J. Spatial variability of mixing ratios of ammonia and tracer gases in a naturally ventilated dairy cow barn. Biosyst. Eng. 2015, 129, 360–369. [Google Scholar] [CrossRef]
  27. Ngwabie, N.; Jeppsson, K.-H.; Gustafsson, G.; Nimmermark, S. Effects of animal activity and air temperature on methane and ammonia emissions from a naturally ventilated building for dairy cows. Atmos. Environ. 2011, 45, 6760–6768. [Google Scholar] [CrossRef]
  28. D’Urso, P.R.; Arcidiacono, C.; Valenti, F.; Cascone, G. Assessing Influence Factors on Daily Ammonia and Greenhouse Gas Concentrations from an Open-Sided Cubicle Barn in Hot Mediterranean Climate. Anim. 2021, 11, 1400. [Google Scholar]
  29. Zhuang, S.; Brusselman, E.; Sonck, B.; Demeyer, P. Validation of Five Gas Analysers for Application in Ammonia Emission Measurements at Livestock Houses According to the VERA Test Protocol. Appl. Sci. 2020, 10, 5034. [Google Scholar] [CrossRef]
  30. Rom, H.B.; Zhang, G. Time Delay for Aerial Ammonia Concentration Measurements in Livestock Buildings. Livest. Build. 2010, 10, 4634–4642. [Google Scholar] [CrossRef] [Green Version]
  31. Janke, D.; Willink, D.; Ammon, C.; Hempel, S.; Schrade, S.; Demeyer, P.; Hartung, E.; Amon, B.; Ogink, N.; Amon, T. Calculation of Ventilation Rates and Ammonia Emissions: Comparison of Sampling Strategies for a Naturally Ventilated Dairy Barn. Biosyst. Eng. 2020, 198, 15–30. [Google Scholar] [CrossRef]
  32. Fiedler, M.; Saha, C.K.; Ammon, C.; Berg, W.; Loebsin, C.; Sanftleben, P.; Amon, T. Spatial Distribution of Air Flow and CO2 Concentration in a Naturally Ventilated Dairy Building. Environ. Eng. Manag. J. 2014, 13, 2193–2200. [Google Scholar] [CrossRef]
  33. Hempel, S.; Saha, C.K.; Fiedler, M.; Berg, W.; Hansen, C.; Amon, B.; Amon, T. Non-linear temperature dependency of ammonia and methane emissions from a naturally ventilated dairy barn. Biosyst. Eng. 2016, 145, 10–21. [Google Scholar] [CrossRef] [Green Version]
  34. Ngwabie, N.; Jeppsson, K.-H.; Nimmermark, S.; Swensson, C.; Gustafsson, G. Multi-location measurements of greenhouse gases and emission rates of methane and ammonia from a naturally-ventilated barn for dairy cows. Biosyst. Eng. 2009, 103, 68–77. [Google Scholar] [CrossRef]
  35. Schmithausen, A.J.; Schiefler, I.; Trimborn, M.; Gerlach, K.; Südekum, K.-H.; Pries, M.; Büscher, W. Quantification of Methane and Ammonia Emissions in a Naturally Ventilated Barn by Using Defined Criteria to Calculate Emission Rates. Animals 2018, 8, 75. [Google Scholar] [CrossRef] [Green Version]
  36. Zou, B.; Shi, Z.; Du, S. Gases emissions estimation and analysis by using carbon dioxide balance method in natural-ventilated dairy cow barns. Int. J. Agric. Biol. Eng. 2020, 13, 41–47. [Google Scholar] [CrossRef]
  37. Ogink, N.W.M.; Mosquera, J.; Calvet, S.; Zhang, G. Methods for Measuring Gas Emissions from Naturally Ventilated Livestock Buildings: Developments over the Last Decade and Perspectives for Improvement. Biosyst. Eng. 2013, 116, 297–308. [Google Scholar] [CrossRef]
  38. Garnsworthy, P.C.; Craigon, J.; Saunders, N. On-farm methane measurements during milking correlate with total methane production by individual dairy cows. J. Dairy Sci. 2012, 95, 3166–3180. [Google Scholar] [CrossRef] [Green Version]
  39. Beauchemin, K. Invited review: Current perspectives on eating and rumination activity in dairy cows. J. Dairy Sci. 2018, 101, 4762–4784. [Google Scholar] [CrossRef] [Green Version]
  40. Schirmann, K.; Chapinal, N.; Weary, D.M.; Heuwieser, W.; Von Keyserlingk, M.A.G. Rumination and its relationship to feeding and lying behavior in Holstein dairy cows. J. Dairy Sci. 2012, 95, 3212–3217. [Google Scholar] [CrossRef] [Green Version]
Figure 1. Plan of the barn under study.
Sustainability 13 09235 g001
Figure 2. Cows’ daily routine in the two different case studies during 2016 and 2018.
Sustainability 13 09235 g002
Figure 3. Weekly values of NH3 (a), CH4 (b) and CO2 (c) concentrations for 2MS and 3 MSs.
Sustainability 13 09235 g003aSustainability 13 09235 g003b
Table 1. Results of the statistical analyses for different MSs.
Milking Sessions
NumberMean ValueTukey Post Hoc Test *
NH3
3MSs8.8A
2MSs7.4 B
CH4
2MSs14.6A
3MSs12.3 B
CO2
2MSs720.4A
3MSs703.7 B
* Rows with a different letter (A or B) are significantly different.
Table 2. Results of the statistical analyses for cows’ behaviour at different MSs.
Cow Behaviour for 2MSsCow Behaviour for 3MSs
RangeMean ValueTukey Post Hoc Test *RangeMean ValueTukey Post Hoc Test *
NH3NH3
activity8.1A activity9.0p = 0.07
lying6.7 Blying8.6
CH4CH4
activity17.5A activity13.4A
lying12.7 Blying11.1 B
CO2CO2
activity772.3A activity718.3A
lying669.5 Blying689.0 B
* Rows with a different letter (A or B) are significantly different.
Table 3. Results of the statistical analyses on NH3 level for groups of hours at different MSs.
NH3 Concentration for 2MSsNH3 Concentration for 3MSs
HourMean ValueTukey Post Hoc Test *HourMean ValueTukey Post Hoc Test *
811.0A 811.3A
2010.6AB 011.0AB
710.2ABC 910.8ABC
199.8ABCD 110.6ABCD
68.4 BCDE 710.4ABCDE
98.3 BCDE 2310.0ABCDEF
58.3 BCDE 29.7ABCDEFG
187.9 CDEF 229.5ABCDEFGH
217.6 DEF 39.4ABCDEFGH
37.6 DEFG 219.1 BCDEFGHI
47.5 DEFGH 58.7 CDEFGHI
27.5 EFGH 68.6 DEFGHI
227.4 EFGH 48.6 DEFGHI
237.1 EFGHI168.4 DEFGHIJ
06.9 EFGHI108.4 DEFGHIJ
16.9 EFGHI208.4 EFGHIJ
106.5 EFGHI178.2 FGHIJ
176.5 EFGHI197.8 GHIJ
116.0 EFGHI117.7 GHIJ
125.7 FGHI187.6 HIJ
135.5 FGHI127.3 HIJ
145.3 GHI137.2 IJ
165.0 HI157.0 IJ
155.0 I146.3 J
* Rows with a different letter (A, B, C, D, E, F, G, H, I) are significantly different.
Publisher’s Note: MDPI stays neutral with regard to jurisdictional claims in published maps and institutional affiliations.

