
Junction Management for Connected and Automated Vehicles: Intersection or Roundabout?

School of Civil and Environmental Engineering, Nanyang Technological University, 50 Nanyang Avenue, Singapore 639798, Singapore
*
Author to whom correspondence should be addressed.
Sustainability 2021, 13(16), 9482; https://0-doi-org.brum.beds.ac.uk/10.3390/su13169482
Submission received: 16 July 2021
/
Revised: 12 August 2021
/
Accepted: 19 August 2021
/
Published: 23 August 2021
(This article belongs to the Special Issue Transport Sustainability and Resilience in Smart Cities)
Abstract
:The concept of signal-free management at road junctions is tailored for Connected and Automated Vehicles (CAVs), in which the conventional signal control is replaced by various right-of-way assignment policies. First-Come-First-Served (FCFS) is the most commonly used policy. In most proposed strategies, although the traffic signals are replaced, the organization of vehicle trajectory remains the same as that of traffic lights. As a naturally signal-free strategy, roundabout has not received enough attention. A key motivation of this study is to theoretically compare the performance of signalized intersection (I-Signal), intersection using FCFS policy (I-FCFS), roundabout using the typical major-minor priority pattern (R-MM), and roundabout adopting FCFS policy (R-FCFS) under pure CAVs environment. Queueing theory is applied to derive the theoretical formulas of the capacity and average delay of each strategy. M/G/1 model is used to model the three signal-free strategies, while M/M/1/setup model is used to capture the red-and-green light switch nature of signal control. The critical safety time gaps are the main variables and are assumed to be generally distributed in the theoretical derivation. Analytically, I-Signal has the largest capacity benefiting from the ability to separate conflict points in groups, but in some cases it will have higher delay. Among the other three signal-free strategies, R-FCFS has the highest capacity and the least average control delay, indicating that the optimization of signal-free management of CAVs based on roundabout setting is worthy of further study.
1. Introduction
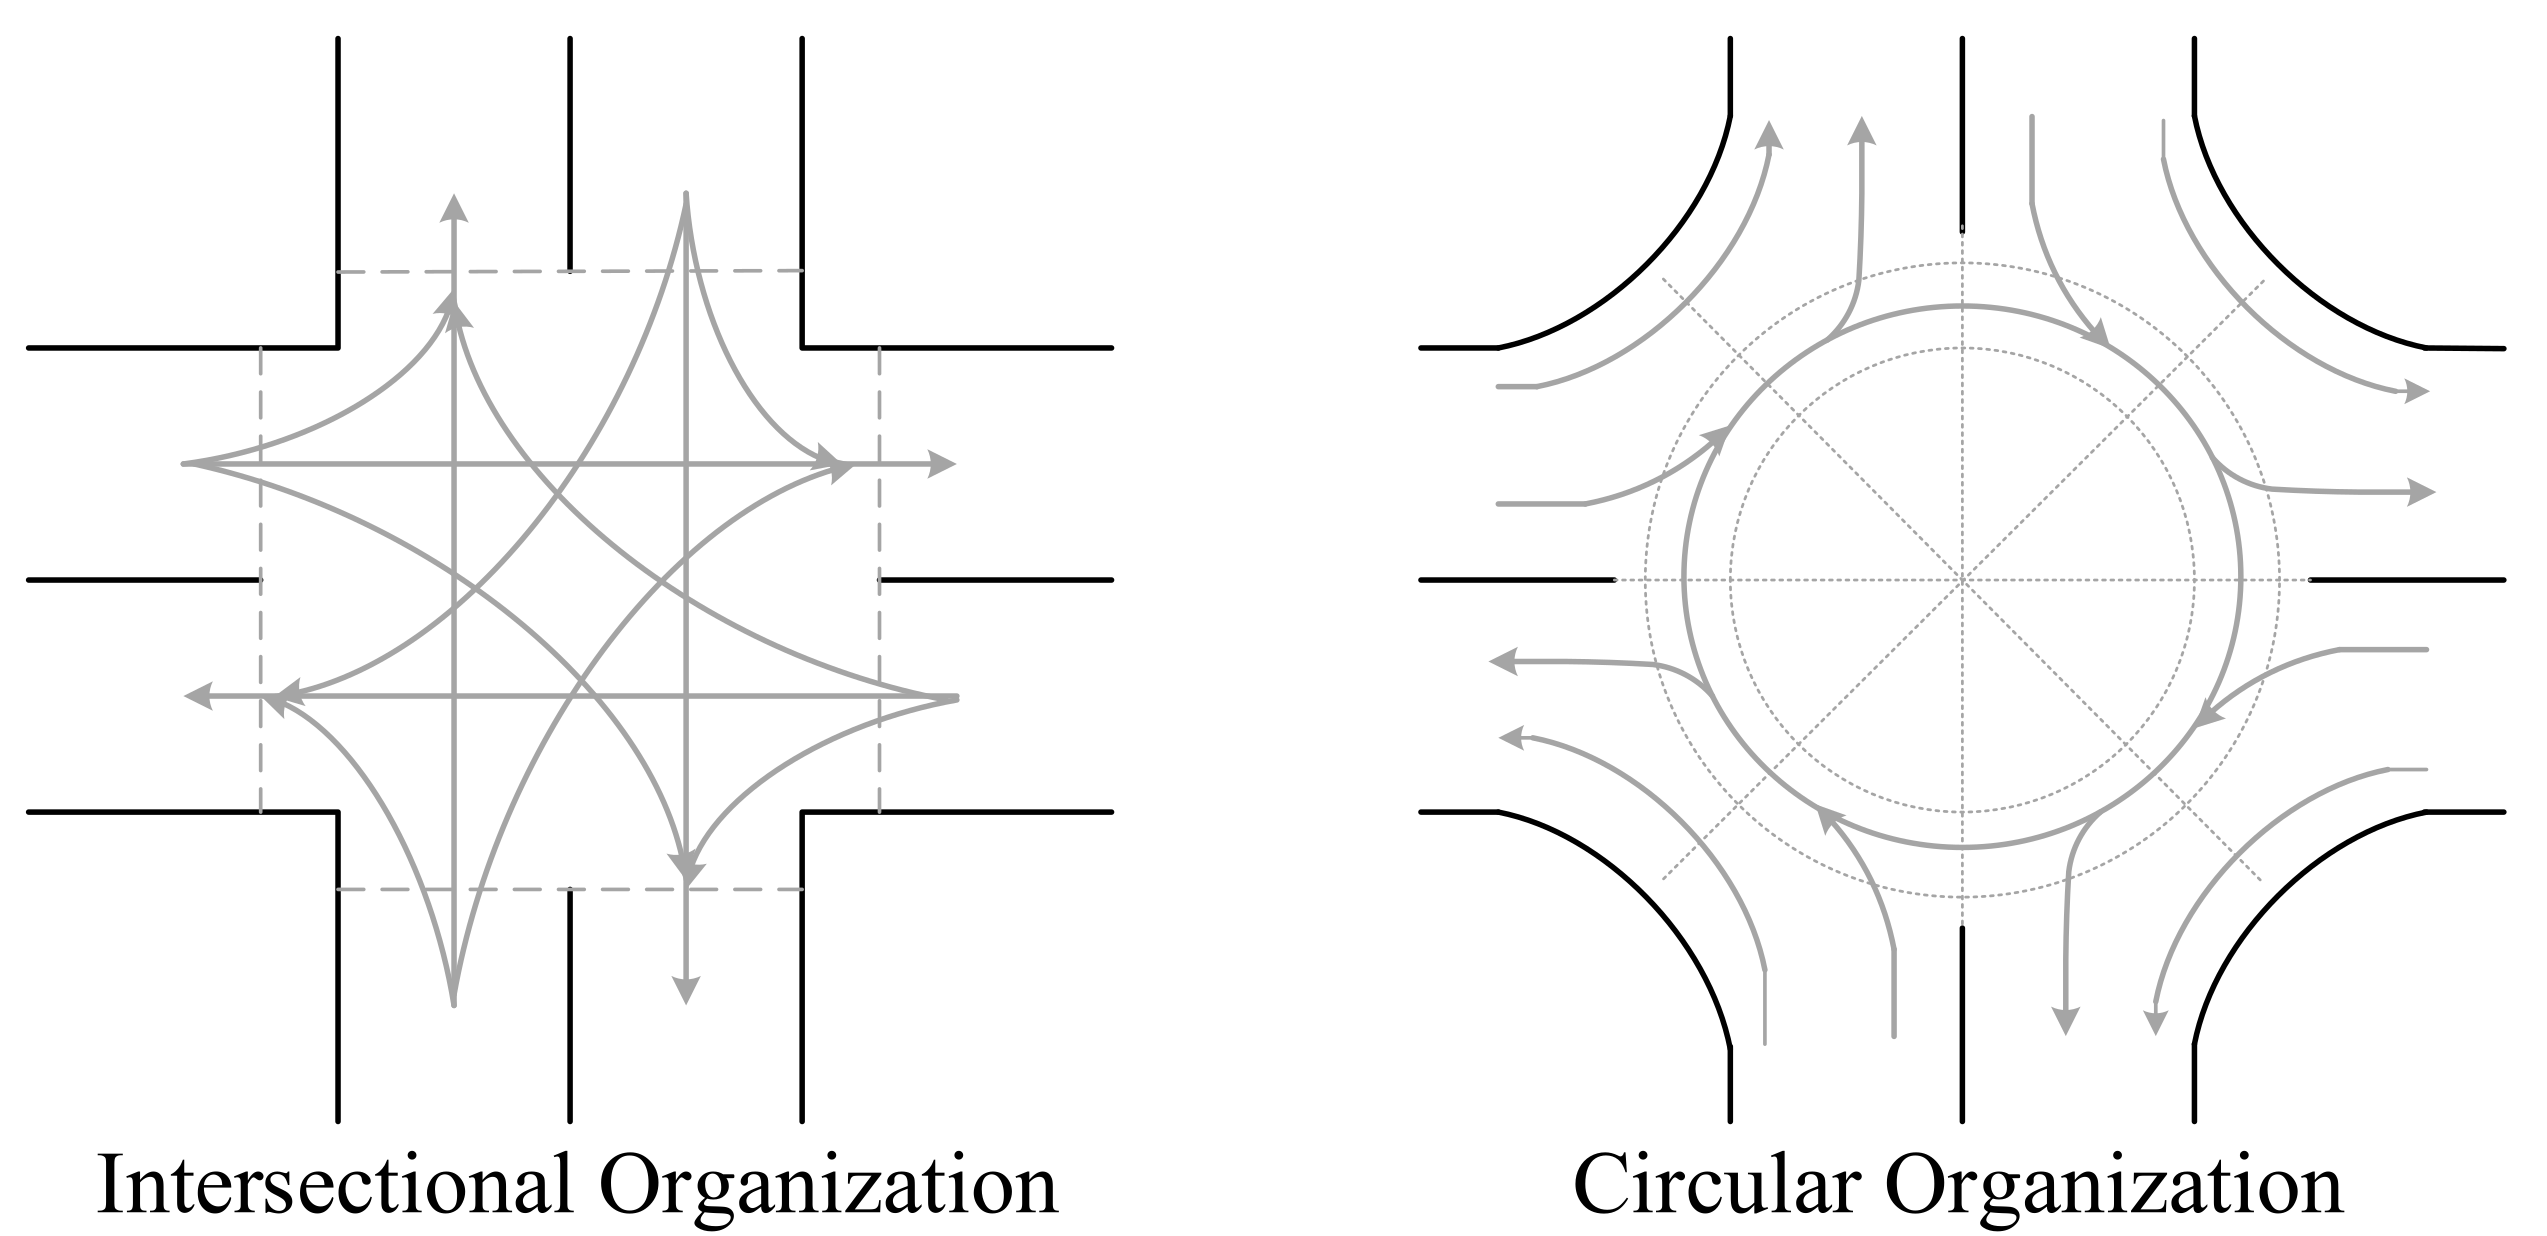
The advanced development of automation and wireless communication technologies enables the new generation vehicles: Connected and Automated Vehicles (CAVs). CAVs are poised to reshape transportation and mobility by replacing humans as the driver and service provider, this transformation provides a valuable opportunity to improve safety, capacity, energy efficiency and reduce emissions [1], to mitigate challenges of transport and logistic services [2], thereby contributing to sustainable development. How to prepare for the opportunities and challenges brought by CAVs has become a popular research topic [3,4], including the new challenges of the corresponding traffic flow management under CAVs environment. As the crux of traffic network, the intersection management for CAVs has been researched [5]. With the ability to communicate with each other and between infrastructures, CAVs can negotiate the right-of-way at intersections and coordinate their movements without the indications of signals. Based on these characteristics, Autonomous Intersection Management (AIM) is customized for CAVs. In AIM [6], the intersection area is divided into cells, CAVs need to send requirement to reserve the spatial-temporal occupancy of cells from the Intersection Manager (IM). With collision-free as the primary principle, the reservations would be accepted or rejected in accordance with right-of-way assignment policies. There are variant signal-free intersection management policies for CAVs have been proposed and studied. However, the vast majority of them are based on the setting that the vehicle trajectories are intersection-organized, while research based on circular organization, i.e., roundabout, is far less. The two organizations at a road junction are depicted in Figure 1.
For human-driven vehicles (HVs), the respective applicable scenarios and conditions for roundabouts and intersections have been clearly defined [7,8,9], and the state of the art calculation method of capacity can be found in [10,11]. However, when it comes to the era of CAVs, the situation may be different, and there is a lack of direct comparison of the performance of intersections and roundabouts in existing literature. This paper intends to fill this gap and attempts to examine the performance of different traffic management strategies (with cross intersectional organization and circular organization) for CAVs under the same traffic demand at the same road junction.
1.1. Related Work
How to leverage the advantages of CAVs to further improve the traffic management at road junctions has attracted extensive research attention. The most distinctive characteristic of CAVs is that they can exchange information with each other and surroundings through the Vehicle-to-Vehicle (V2V) and Vehicle-to-Infrastructure (V2I) communication technologies [12], resulting in the much less reaction and response time compared to the human-driven vehicles. Also benefiting from the connectivity guaranteed by wireless communications, CAVs are able to keep a smaller headway to a predecessor and form platoons on the road. The system that implements this new car-following behavior is called Cooperative Adaptive Cruise Control (CACC, shown in Figure 2).
It is demonstrated that traffic flow can be improved in terms of stability, safety and highway capacity with more vehicles participating in CACC platoons [13,14,15]. It is also pointed out that the advanced technologies of CAVs withhold the potential to resolve all potential challenges and revolutionize highway operations [16]. For the management of CAVs at road junctions, some researchers have proposed the concept of signal-free intersection management [17], which can be traced back to Autonomous Intersection Management (AIM). The framework of AIM is proposed by Dresner and Stone [18], in which the right of crossing the intersection is assigned in a First-Come-First-Served (FCFS) manner. It has been demonstrated that AIM using FCFS policy can reduce delay and emission compared to conventional intersection signal control under certain traffic conditions [19,20].
In order to eliminate collisions and ensure safety, the potential conflict points are the most critical consideration in any signal-free strategy. In this regard, roundabouts have higher safety standards, because there are less conflict points compared to intersections [21]. For a typical 6-lane 4-way road junction in cross intersectional organization, there are at least 16 conflict points need to be carefully modelled to avoid the potential conflicts. However, if the junction is organized as roundabout, the number of conflict points reduces to 4, as shown in Figure 1 (Diverging conflict points are not counted as the diverging conflicts can be easily avoided). Fewer conflict points bring the circular organization substantial safety benefits, which is why the roundabout first policy has been adopted in some States of the U.S. [22].
In particular, conflict points determine the safety constraints of various optimization goals of AIM, such as the total travel time minimization in [23], intersection capacity and throughput maximization in [24,25], energy consumption minimization in [17], etc. More conflicts imply more constraints and more computational efforts. This is why in [26], the conflict points within an intersection are aggregated into conflict regions to reduce the difficulty of modeling and improve computational efficiency. Therefore, from the perspective of fewer conflict points, in the context of CAVs, intersectional organization may not necessarily outperform roundabout organization. In [27], roundabout is demonstrated to have comparable performance as an optimized intersection control system under CAVs environment called intersection cooperative adaptive cruise control (iCACC). iCACC system ensures collision-free principle and minimizes the intersection delay. Although the comparison results in [27] are based on simulations, the potential of roundabouts for CAVs management is revealed, and theoretical analysis is worthy of study.
However, the research of roundabouts under CAVs environment is rare, and limited to merging control. Such as, using model predictive control to merge CAVs at roundabouts [28]; optimizing the decision-making process of accessing the potential merging gaps for CAVs at single-lane roundabouts [29]; applying a cooperative merging control for CAVs at roundabouts in a mixed-traffic environment [30]. Under the same traffic demand, the performance comparison of intersectional organization and roundabout at the same road junction is not investigated.
The reason why roundabouts are not getting enough attention in junction management research for CAVs may be that the setting of intersections is more common in current urban roads. With the appropriate signal control, the intersectional management can greatly improve the actual traffic throughput of the junction and separate conflicting streams, while roundabouts could reach capacity even with moderate traffic demands [31]. However, it has been demonstrated that the compact headway travel behavior of CAVs will double the intersection capacity [32] and so do the roundabouts. It is very likely that with the special car-following behavior of CAVs, roundabout may no longer suffers in a limitation of capacity and has comparable performance in terms of average control delay. In order to verify this conjecture, this study theoretically derives and analyzes the performance of intersection and roundabout in terms of capacity and delay under the same CAVs flow.
1.2. Contributions
For a road junction under CAVs environment with the same traffic demand, the performances of intersection and roundabout adopting different control policies are compared in this study. To the best knowledge of the authors, it is the first time the performances of intersection and roundabout in a CAVs environment are directly and theoretically compared. Based on the characteristics of CAVs, the theoretical formulas to estimate the capacity and average control delay of different junction management strategies are derived using queueing theory.
The remainder of this paper is organized as follows. The preliminaries including basic methods, parameters and assumptions are elaborated in Section 2. The detailed derivations of the capacity and delay of each control strategy (as well as the comparison analysis) are given separately in Section 3 and Section 4. Section 5 concludes the paper and discusses the direction of future work.
2. Preliminaries
Main parameters and variables applied hereafter are summarized in Table 1.
The application of queueing theory to model and analyze traffic flow at intersections can be traced back to 1960s [33]. Arrival process (arrival rate ) and service mechanism (service rate ) are the core of a queuing situation. The service rate determines the capacity of the system:
And Little’s Law connects the capacity of a queueing system, the average time spent in the system, and the average arrival rate into the system without knowing any other features of the queue [34]:
where is the average waiting time in the system, is the arriving rate and is the mean number of waiting customers, i.e, the mean number of queueing vehicles in this study. is determined by the arrival rate and the service rate, for example, in M/M/1 Queue, where the arrival process and service process of the 1 system server are Markov chain processes,
The Little’s law, of great generality, holds irrespective of the form of inter-arrival and service time distributions and discrepancy that may be within the system [35], that is the relationship is not influenced by the arrival process distribution, the service distribution, or the service order [36]. It is widely accepted to calculate and analyse the performance of intersection traffic management [37,38].
In this study, queueing theory is applied to derive the theoretical formulas of the capacity and average delay of each strategy. M/G/1 model, where service process is general, is used to model the three signal-free strategies, while M/M/1/setup model is used to capture the red-and-green light switch nature of signal control. From Equation (1), the average service rate of each strategy is the key to derive the capacity, details are elaborated in Section 3. Once we get the capacity, average control delay can be further derived according to the Little’s Law, details are presented in Section 4.
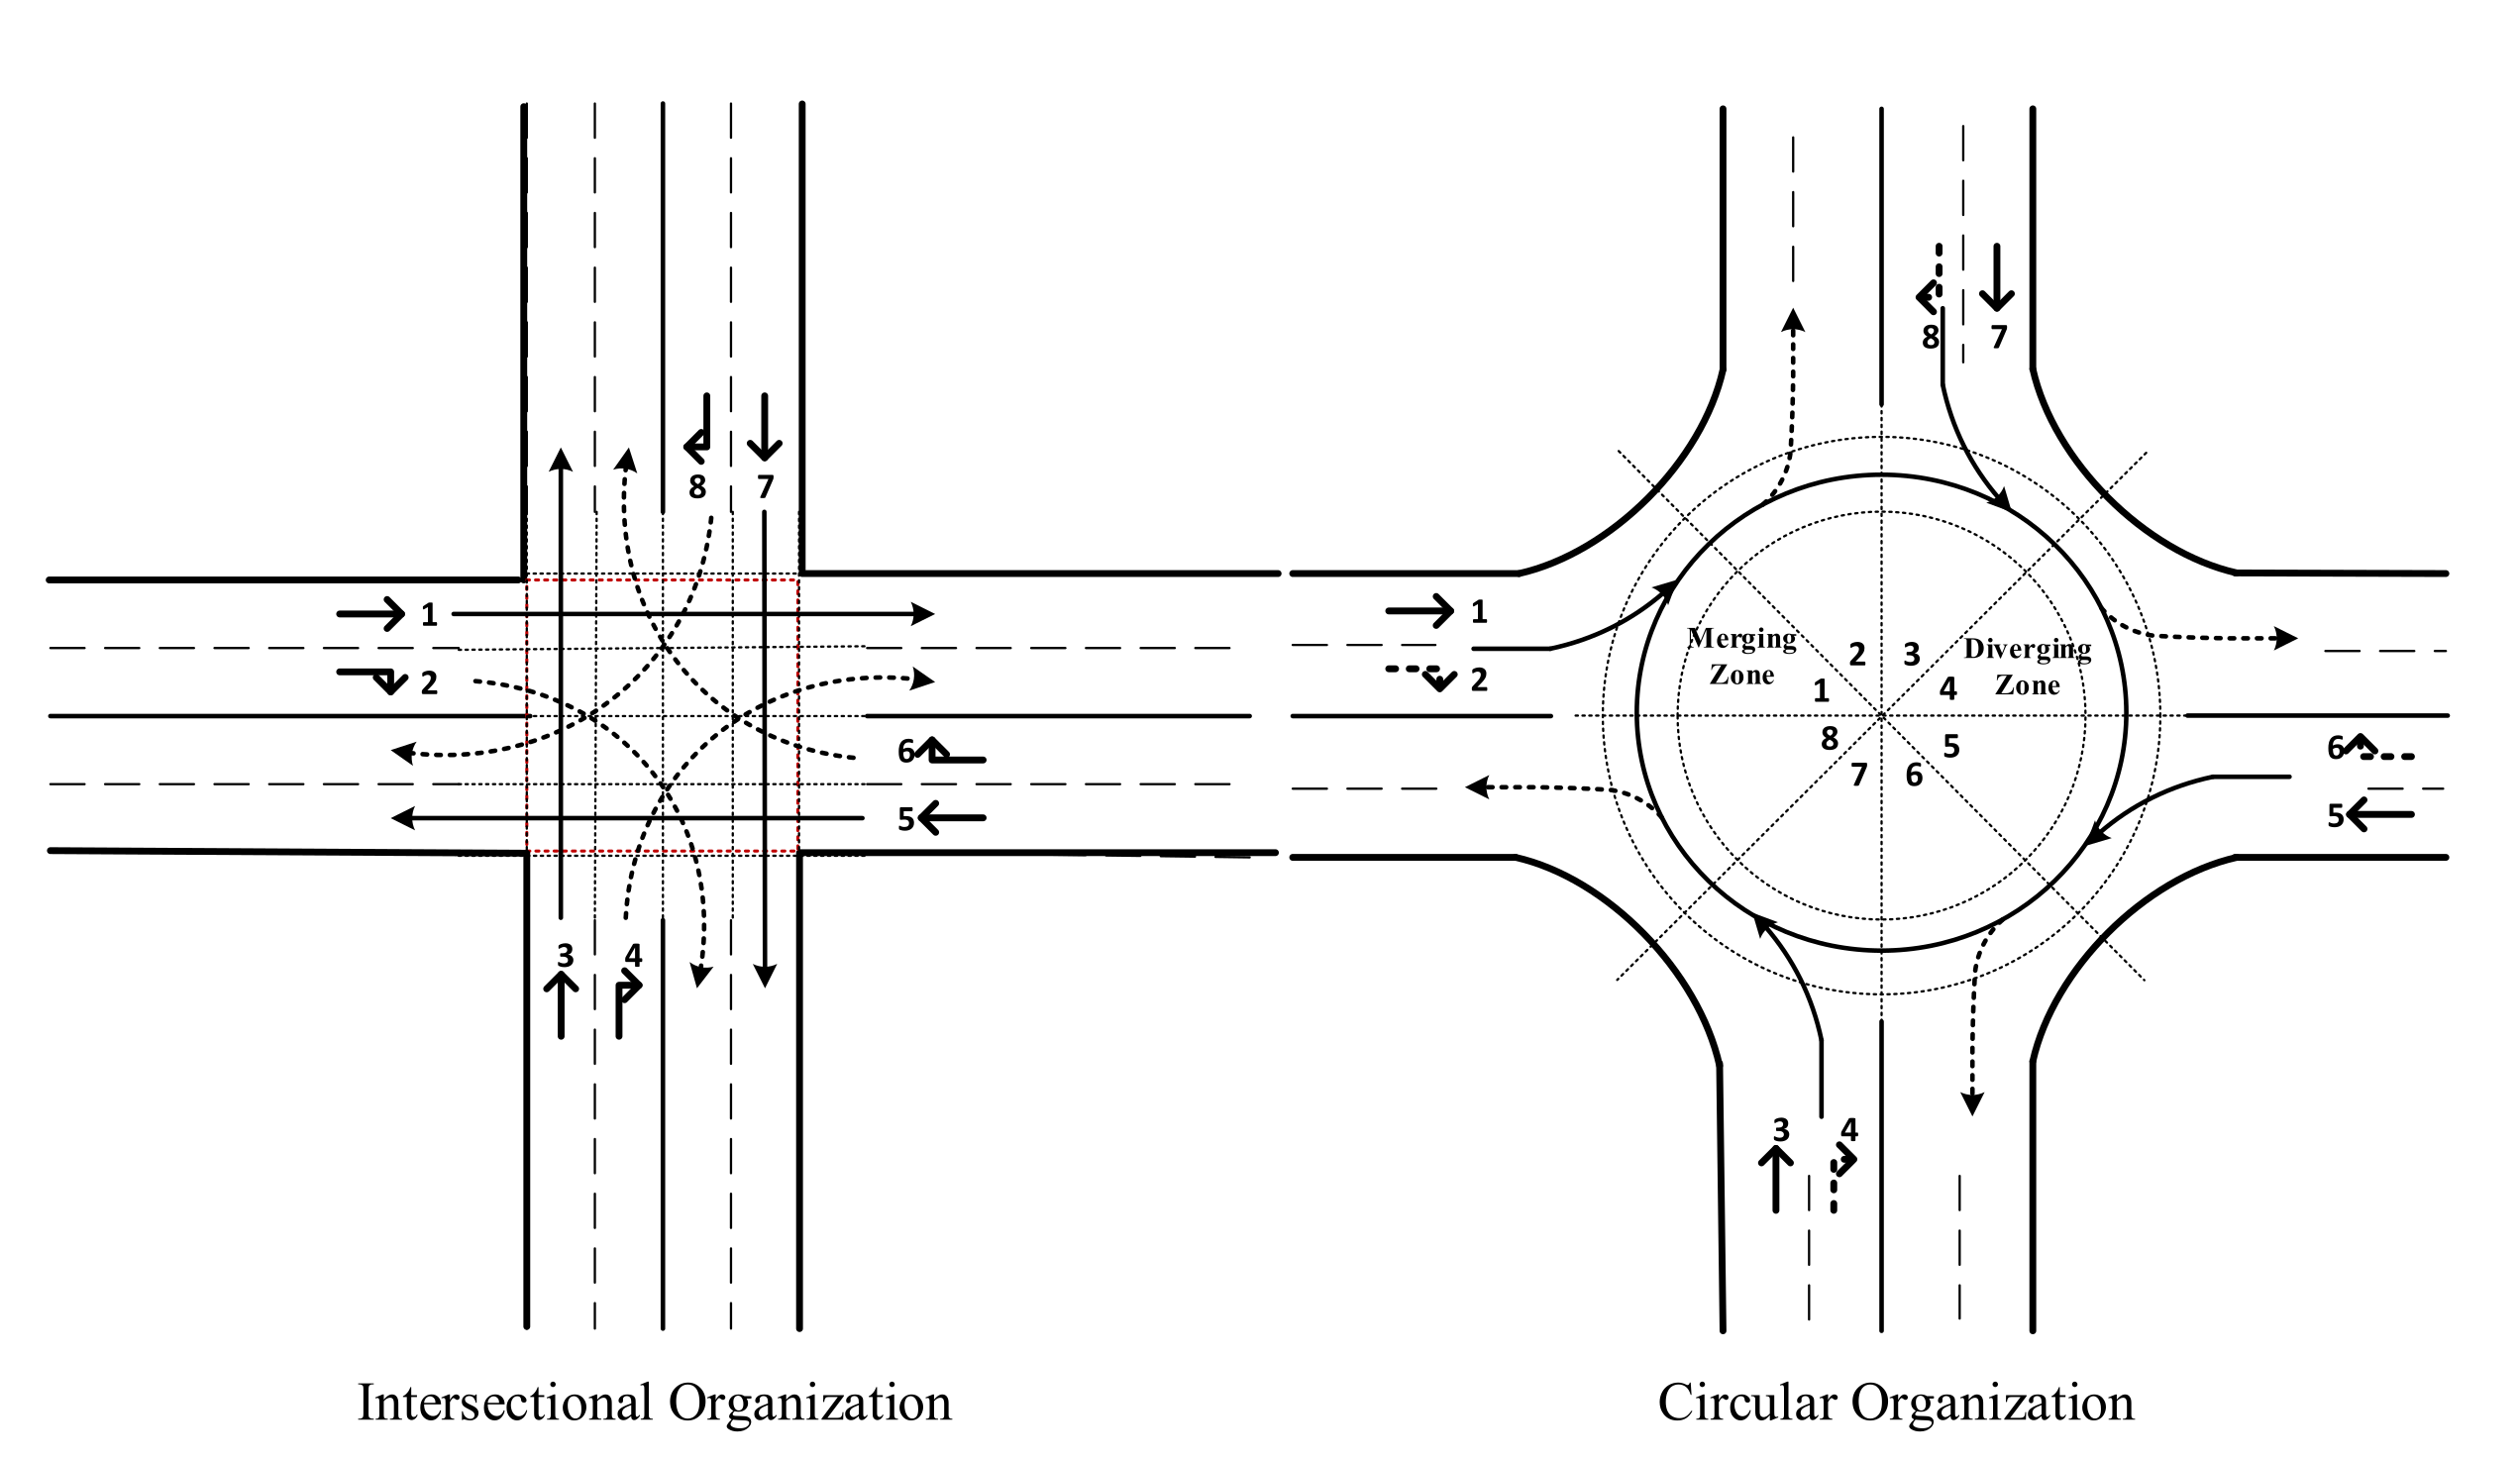
The major concern of this study is whether roundabout has comparable performance to intersection under CAVs environment for the same road junction. A typical urban road junction configuration is focused, as depicted in Figure 3, in which only motorized traffic is considered. The road junction consists of 8 in-coming traffic streams, and left-turning streams are not considered as they have no conflicts with other motorized lanes. To be conservative, the single-lane type roundabout is analyzed considering the limited geometric resources. Note that if there is enough space to set up a multi-lane roundabout, the performance should be better than the analyzed single-lane roundabout.
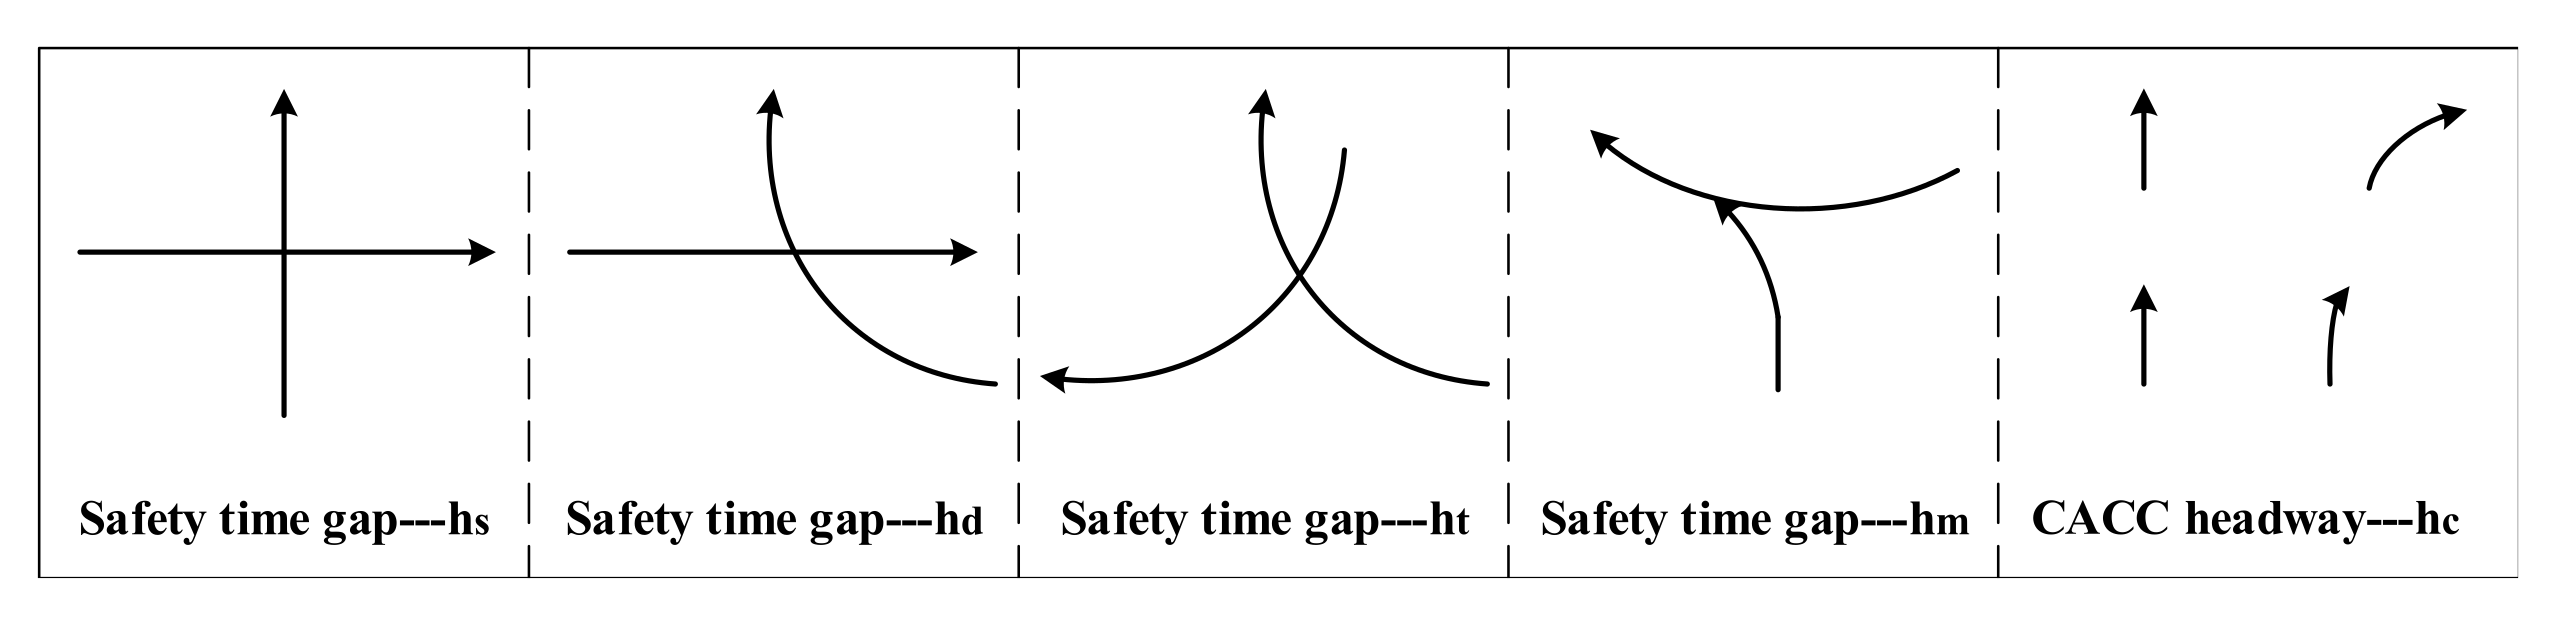
All the possible conflict types in Figure 3 are elaborated in Figure 4. The safety time gap refers to the time required for vehicles to consecutively and safely pass a conflict point.
Since CAVs are not around the corner yet, it is difficult to know the specific distribution of the safety gaps, but they can be easily divided into two categories: the safety time gap () for two vehicles from conflicting streams and the safety time gap () for two vehicles from the non-conflicting streams. With this categorization, the research in this paper is based on the following assumptions:
- The communication capabilities of CAVs are perfectly operated, without any malfunctions.
- Lane changing is not allowed within the junction area, and vehicles strictly follow the traffic rules determined by the organization of the junction.
- The arrival process of vehicles on each stream is a Poison process with parameter and independent of each other.
- The difference between is not distinguished in this paper and a general distribution with expectation for is assumed. The distribution of is determined by the CACC policies with expectation . Empirically, .
- Gap acceptance of CAVs is determined by the advanced control systems.
3. Capacity
Capacity refers to the maximum sustainable hourly flow rate at which persons or vehicles reasonably can be expected to traverse a point or an uniform section of a lane or roadway during a given time period under predefined conditions. The capacity of the strategies are derived and compared in the following subsections.
3.1. Signalized Intersection (I-Signal)
The capacity of an intersection using signal control can be calculated as:
where is the cycle time; is the effective green time of lane group g; is the rate at which vehicles in lane group g can pass through the intersection; is the saturation flow rate of lane group g, and , where N is the number of lanes in group g, is the saturation rate per lane, and f is an adjustment factor for the road geometry (f is set to be one for the ease of comparison).
The base rate is the maximum discharge rate for an infinitely long queue of vehicles facing a permanently green signal [9]. For CAVs, the base rate can be considered as the reciprocal of the CACC headway:
In signal control, the cycle time equals total duration of green time plus total loss time: , leading to . For the intersection depicted in Figure 3 (left), it can be verified that no matter how the lanes are grouped, at most two lanes can be released simultaneously in order to separate the potential conflicts, resulting in . Let . Considering the nature of signal control, the difference is due to the inevitable existence of the loss time , which normally consists of start-up loss time and the clearance loss time. The total loss time is less than the duration of green light: , therefore, it can be obtained:
3.2. Intersection Using FCFS Policy (I-FCFS)
For an arbitrary CAV under FCFS policy, there are two situations for its preceding vehicle. One situation (denoted as event ) is that its preceding vehicle comes from the same stream or comes from the non-conflicting streams. These streams are grouped in the set . The service time of vehicle is denoted by . Another situation (denoted as event ) is that its preceding vehicle comes from the conflicting streams, which are in the set . The service time of event is represented as . Therefore, the service time X of a CAV under FCFS policy can be estimated as:
where and denote the probabilities of occurrence of events and , respectively.
As the arriving process of vehicles are assumed to be the Poisson distribution [33], the time gap between two consecutive vehicle in the stream i is exponentially distributed, i.e., and . The probability that the nth vehicle comes from stream i, can be calculated as follows:
With Equation (8), the probabilities of occurrence of event can be calculated as:
For the sake of simplicity, we denote as . Correspondingly,
The service time and are determined by the categorization of safety gaps, corresponding to and , we have:
Capacity is equivalent to the service rate in queueing theory [39]. The intersection capacity under FCFS policy for CAVs can be estimated as:
Table 2 shows the conflicting streams of a stream i within the analyzed intersection.
3.3. Roundabout Using FCFS Policy (R-FCFS)
The capacity of roundabout under FCFS policy can be determined by applying the same logic that derives . The difference lies in the potential collision mechanism due to the different organization of the trajectories, i.e., the probabilities of occurrence of events and under circular organization are different.
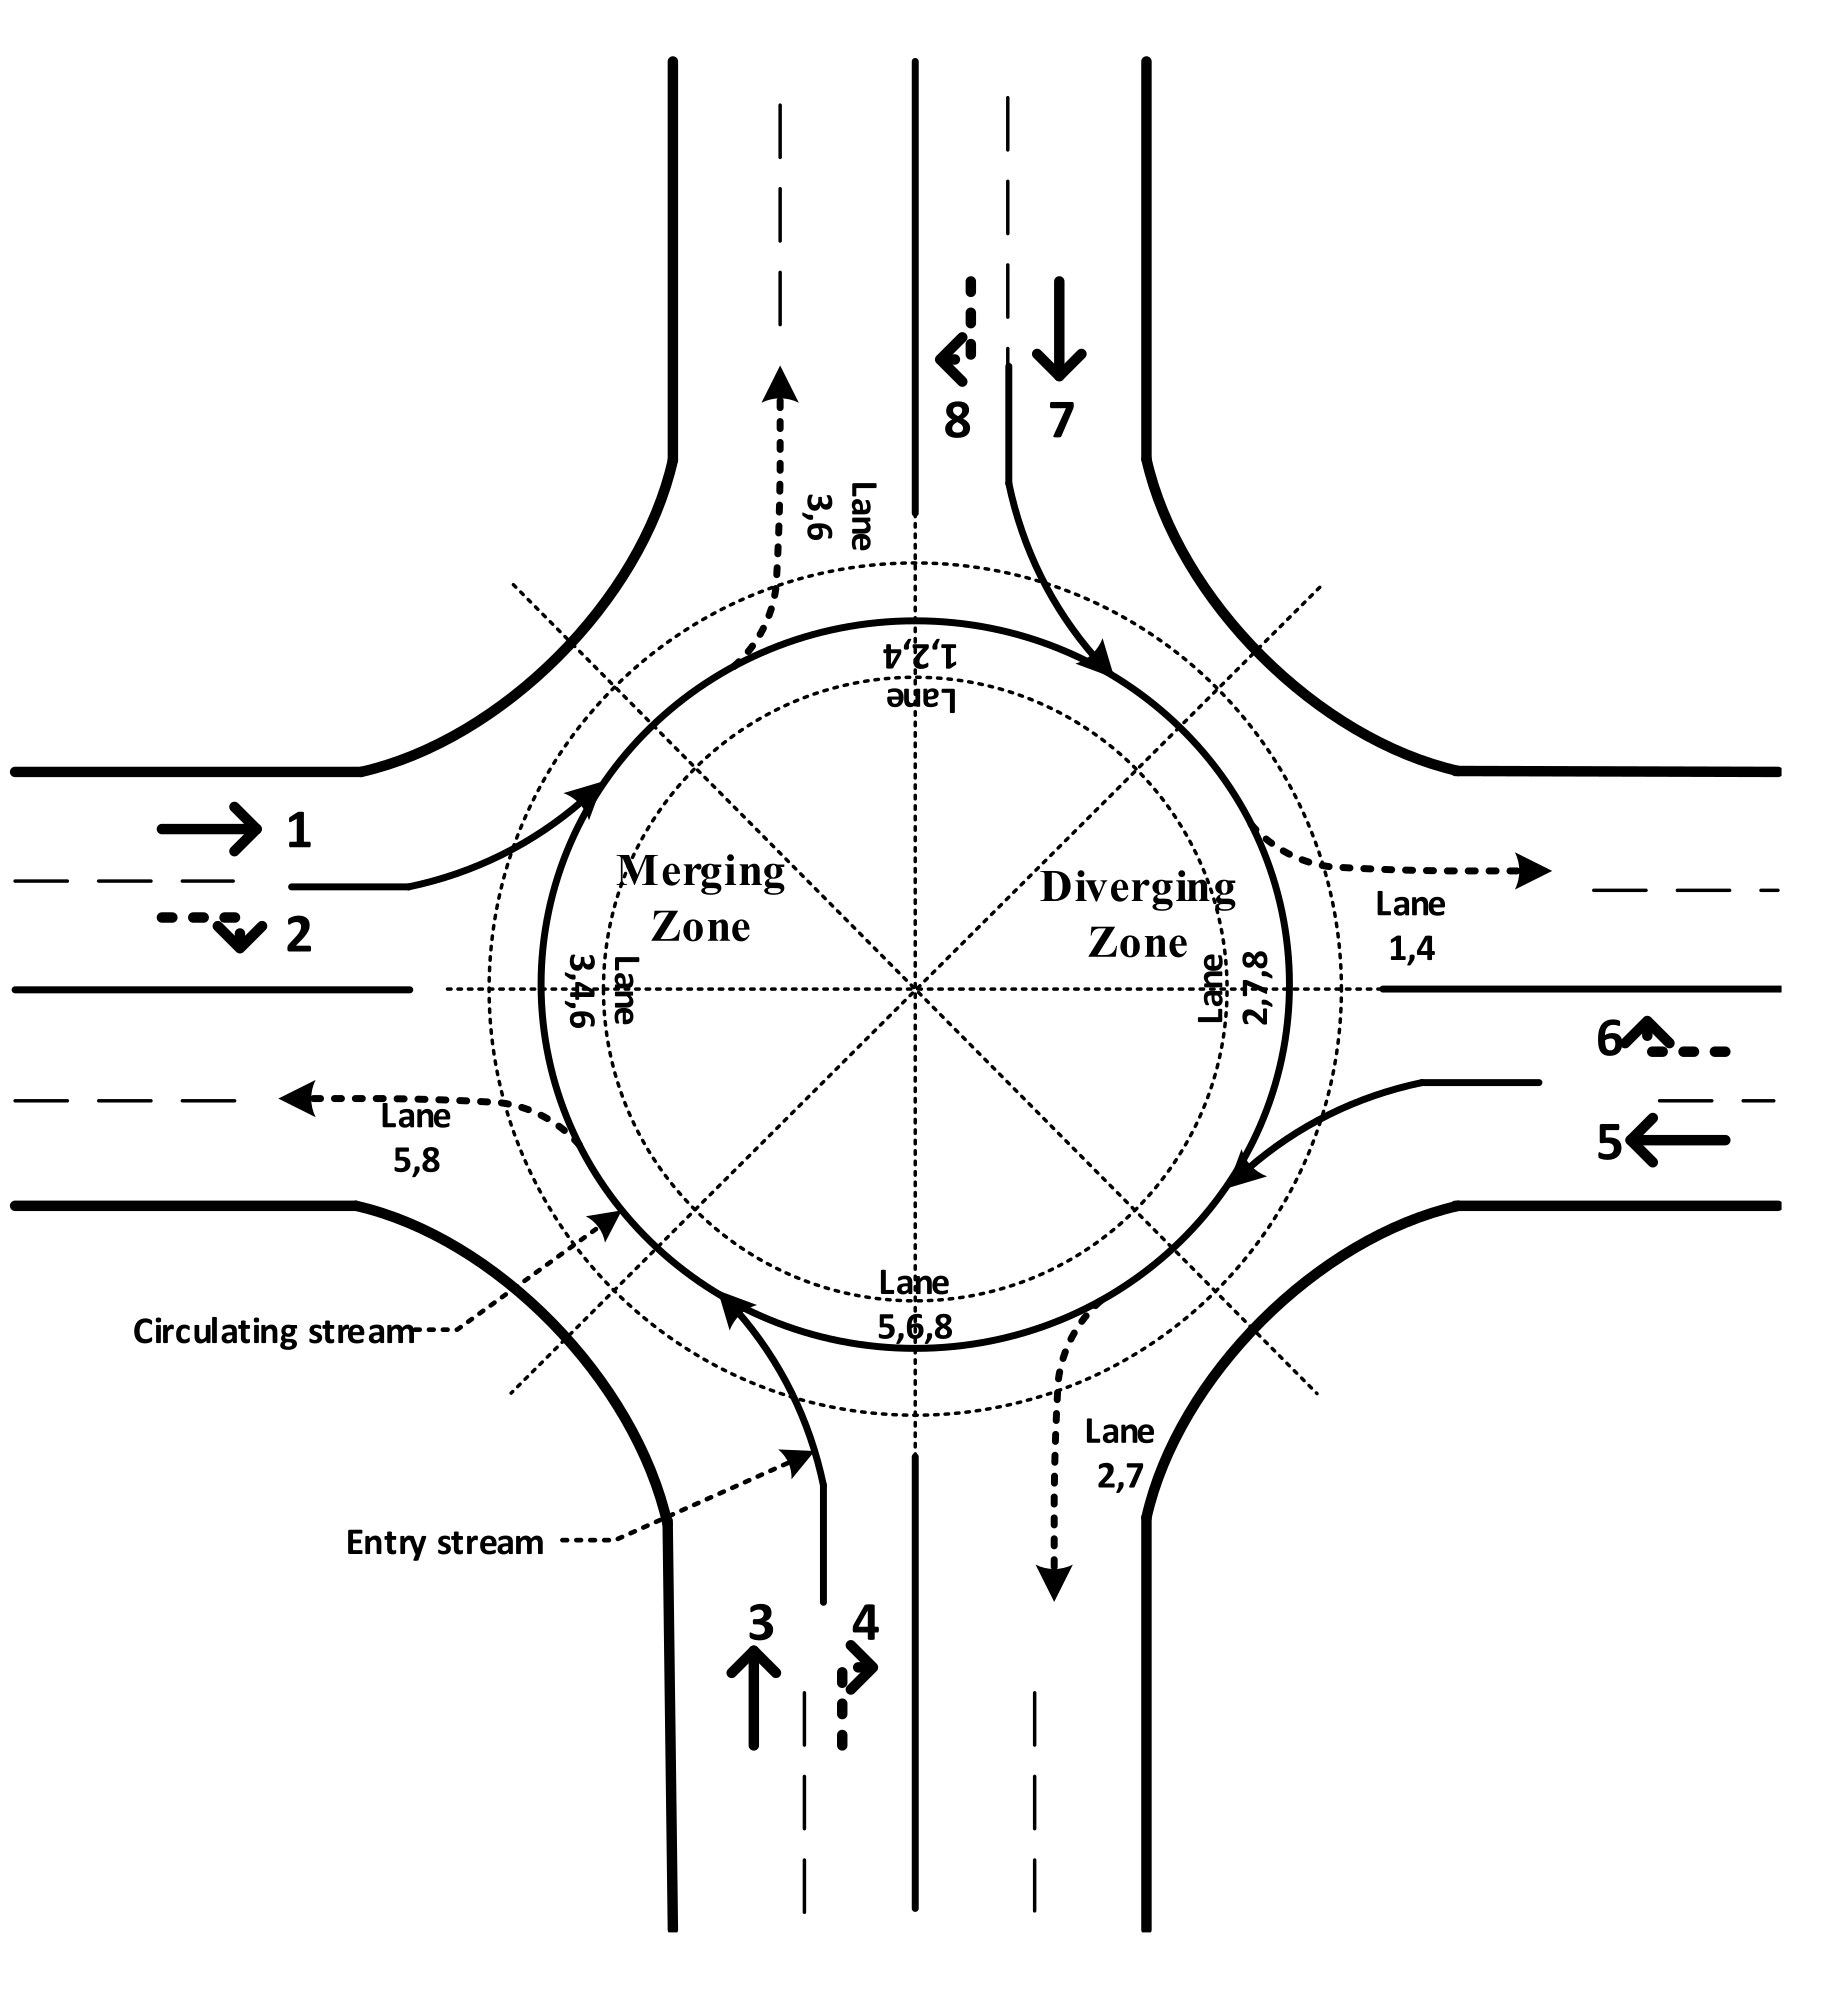
At roundabout, an entry stream e only conflicts with the circulating stream . The stream structure of roundabout is further elaborated in Figure 5. Take the eastward approach as an example, the entry stream is made up of the vehicles on lane 1 and lane 2, conflicting with the circulating stream made up of the vehicles from lane 3, lane 4 and lane 6. The general arriving process of vehicles on each circulating flow is simplified as a superimposed Poisson process with parameter , Table 3 summarizes all the superimpositions depicted in Figure 5. It is demonstrated that the simplification has little effect on the accuracy of the calculation [40]. Note that this superimposition of k independent Poisson processes with rates is also a Poisson process with rate .
With the distribution of the conflicting streams, the capacity of the roundabout under FCFS policy can be given by:
where,
3.4. Roundabout Using Major-Minor Policy (R-MM)
Typically, roundabout is controlled by the major-minor priority strategy, in which each entry stream e has the minor priority and has to find the proper gap between two consecutive circulating vehicles to merge into the circulating stream . Vehicles on the circulating stream has the major priority. That is, the incoming streams need to overcome the impedance effect of the circulating flow. Under major-minor priority strategy, the expectation of service time of vehicles can be estimated as:
Correspondingly,
where, .
The derivation of Equation (16) is elaborated as follows [41]. Let denote the inter departure time between the th and nth vehicles from stream e, and let denote the number of vehicles in the queue on the stream e when the vehicle from stream e merges into the stream . The queue can be written as:
where is the Poisson arrival process of stream e.
It can be verified that the process has the dynamics of an queue length process at departures where corresponds to the service time of the vehicles on stream e under major-minor priority policy. Every CAV on the stream e needs a critical headway T for the mth attempt to merge into stream . Every CAV sticks to the same critical headway, but different CAVs have different values of critical headway due to different control systems. The probability for the attempt of a CAV being successful is: , where is the gap of vehicles on the circulating stream, and is an exponential random variable with mean . The distribution function of random variable can be defined as:
Since random variable is generally distributed, we apply the Laplace transform of as , which follows from:
For one CAV, gap acceptance is determined by its control system, leading to , Equation (23) is the sum of a geometric sequence,
For a stream, T is distributed the same as . Using the moment generating function, the mean service time of vehicles on stream e can be obtained:
Thus, Equation (16) can be obtained.
3.5. Capacity Comparison
By comparing Equations (14) and (17), it can be easily concluded that R-FCFS policy outperforms major-minor policy in terms of capacity. The brief derivation is as follows:
In the above derivation, is applied. leads to . This result is in line with expectations. Using the communication technologies of CAVs, FCFS policy can assign the junction temporal-spatial resources more efficiently. If the major-minor priority pattern is still defaulted at roundabouts in the case of CAVs environment, the advantages of CAVs are wasted. The main purpose of this study is to explore whether the roundabout may replace the intersection settings at urban roads in the environment of CAVs. Since R-FCFS has been confirmed to be superior to R-MM, R-FCFS is used as the representative of roundabout management and is compared with intersection strategies. The performance of R-MM is no longer compared below.
The relationship between and depends on the traffic demand pattern, and the difference lies in and , for the junction analyzed in this paper, we can verify that:
That is , resulting in:
Specifically,
And,
It can be obtained that:
In summary:
As can be seen from the previous derivation and comparison that the reason for the low capacity of I-FCFS is the impedance of more conflict points than that of R-FCFS.
Furthermore, with Equation (6), we can summarize as follows:
It can be seen that intersection using signal control has the highest capacity benefiting from the separating of conflict points, because the safety gaps that CAVs need to maintain in signal control is mainly the CACC headways .
However, it is still unclear which strategy is better when the traffic demand does not reach the maximum capacity. Therefore, average control delay of each strategy is used as another performance measurement and is derived and compared in the following.
4. Delay
In addition to capacity, efficiency is also an indicator that traffic management attaches great importance to. Average control delay of each strategy is derived and analyzed in this section.
4.1. Delay Formulation
Derived from Little’s law, for M/G/1 queue, the average waiting time by Pollaczek-Khinchin mean formula is:
It should be noted that Equation (34) is only applicable when the system is stable, meaning . The predication of capacities and performance analysis under heavy flow conditions is beyond the scope of this study.
The service time and have the similar formulation (i.e., ). Since and are independent variables, can be calculated as:
Calculating the corresponding values of and and substituting them into Equation (34), the delay of I-FCFS and R-FCFS can be obtained:
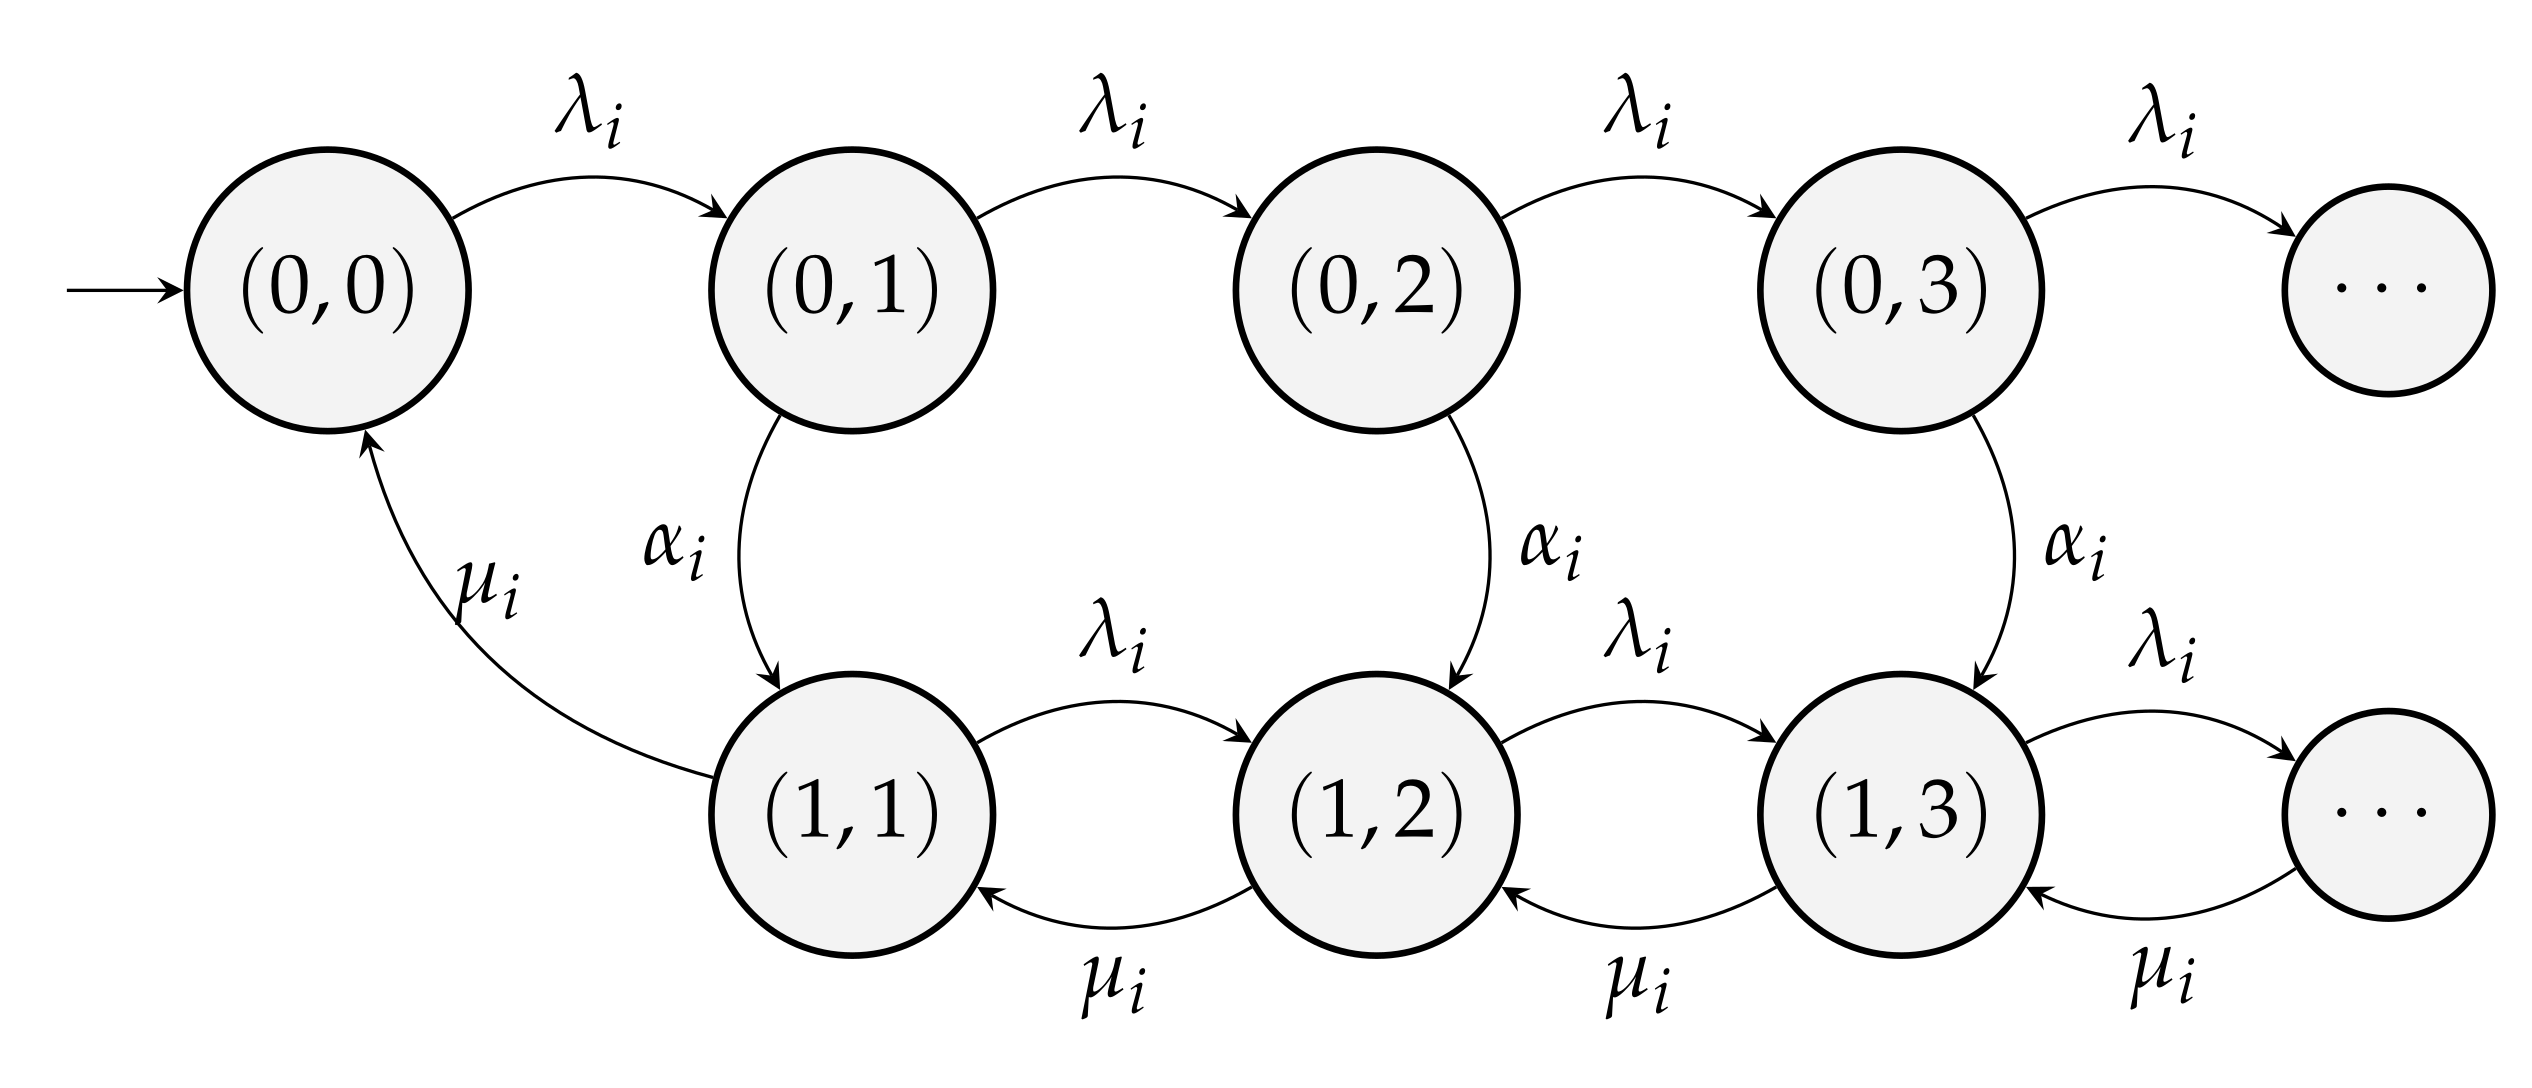
The average control delay of I-Signal are derived as follows. In order to capture the nature of signal control, M/M/1/setup model is used. An M/M/1/setup system can be generalized by a renewal cycle diagram, shown in Figure 6.
Each state is denoted by the pair , where n is the number of on servers, and m is the number of vehicles in the system. When the vehicles on lane i are waiting for the right-of-way to pass through the junction (red signal), then the service is on setup phase (), and when the vehicles are passing the junction, the service is on () (green signal). is the vehicle arrival rate of stream i, and is the service rate. in M/M/1/setup system is called the setup rate, applied to capture the red-and-green light switch nature of signal control. The closed-form expression of the average queue length in an M/M/1/setup system is derived by Gandhi et al. [42]:
The service rate of a particular stream i is the rate at which vehicles queueing in lane i can potentially be served by the junction, which is related to the saturation flow rate and the effective green ratio of the lane group which movement i belongs to. Similar to Equation (4), can be calculated as (using notation from Table 1):
For a stream i, the setup rate is equal to the service rate of other group streams that are on service. Similar to Equation (39), can be calculated as:
Further, applying Little’s law, the average delay of a vehicle in stream i is:
With Equation (41), the delay expectation of the whole intersection using signal control can be estimated as:
4.2. Delay Comparison
To compare the delay performance of different control policies according to the theoretical formulas, the specific distributions of and of CAVs need to be known. For conventional human-driven vehicles, the safety time gaps are more relevant to human factors such as individual response time and reaction time. For CAVs, the safety time gaps are determined by the control policies applied. In literature, the headway is normally assumed as uniformly distributed with the parameter in range of [0.5 s, 2.0 s] [44], and this uniform distribution of is applied to calculate the values of delay. The random variable is estimated as in the calculation.
4.2.1. Signal vs. Signal-Free Strategies
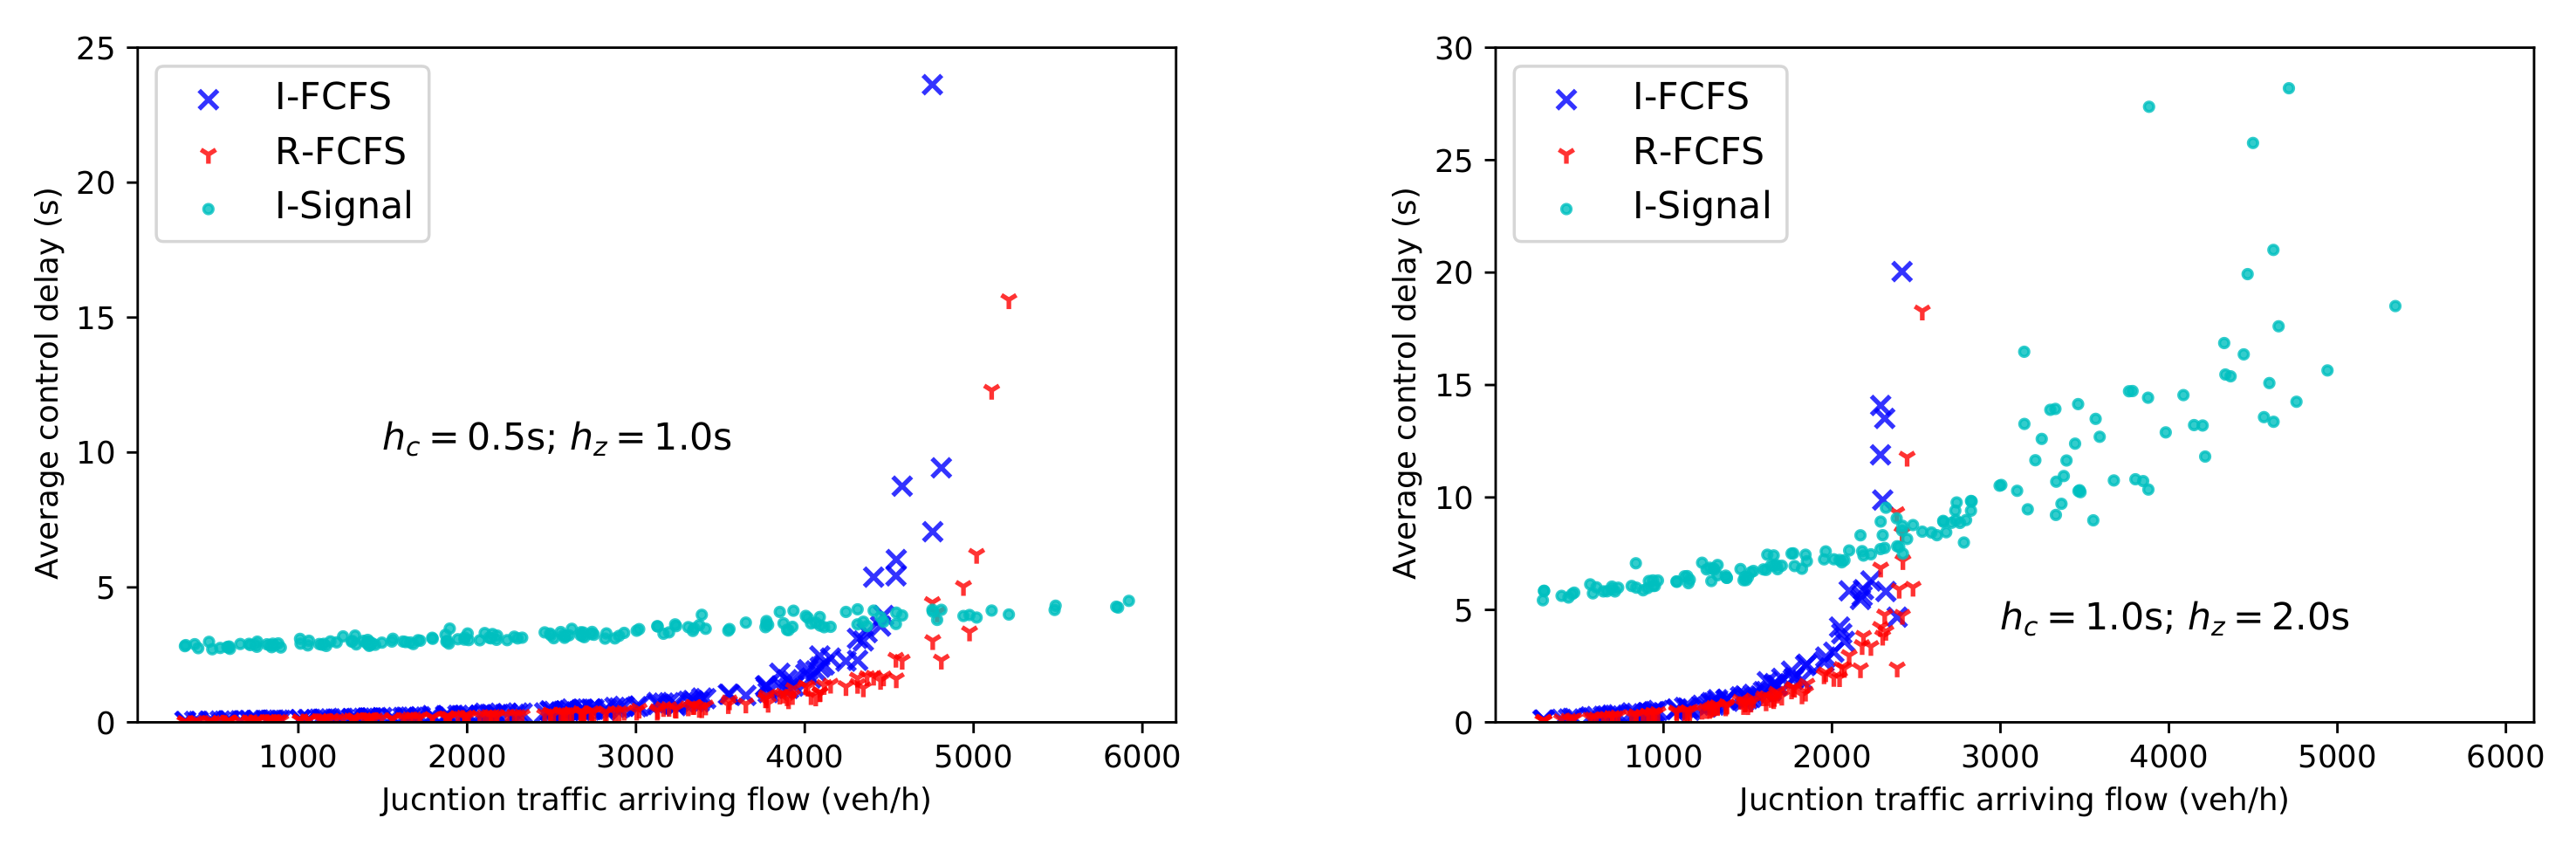
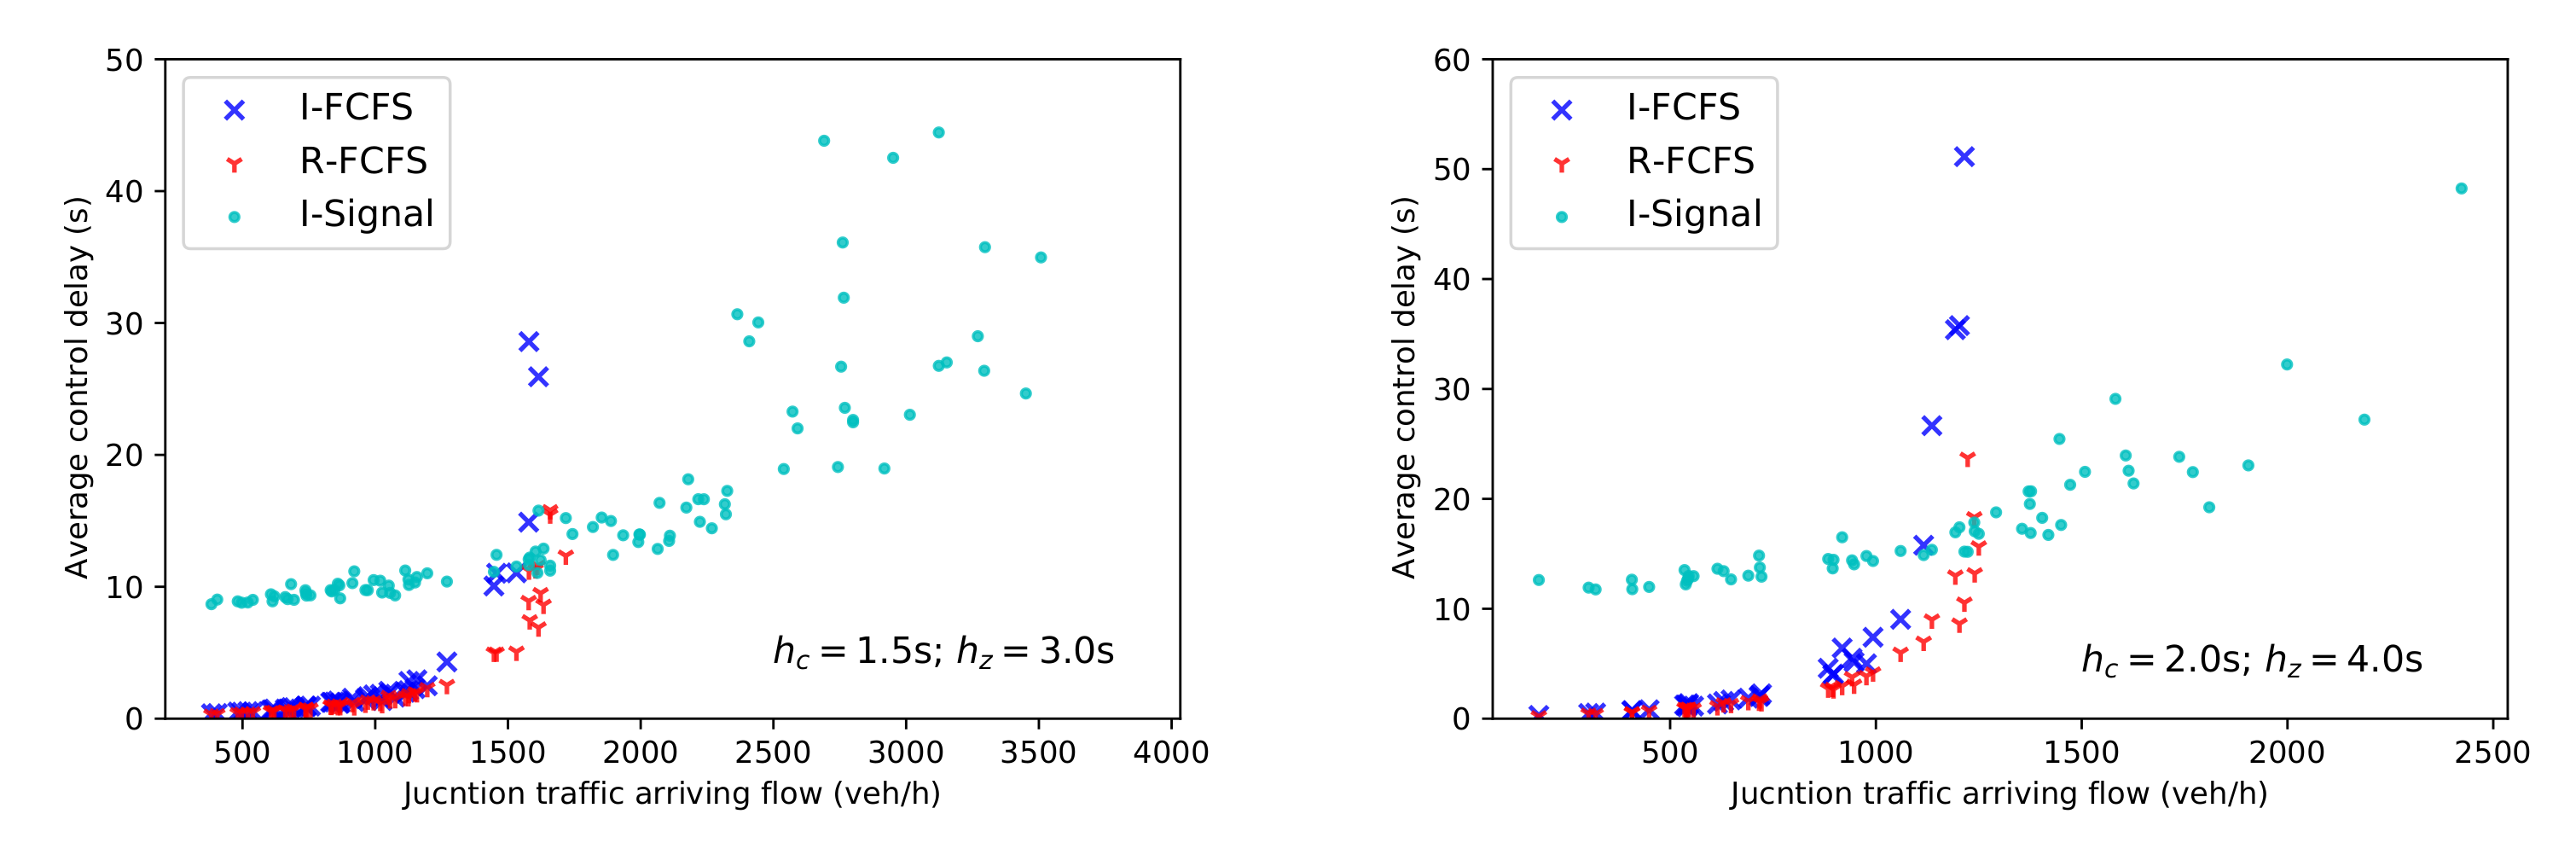
According to the derived formulas, the relationships between and or depend not only on the value of , but also on the traffic demand . Four cases with s, 1.0 s, 1.5 s and 2.0 s, respectively representing the CAVs behavior being aggressive, less aggressive, neutral and conservative, are analyzed under the random traffic demand pattern, in which the traffic arriving rate of each stream is randomly generated rather than some specific demand combination. The corresponding comparison of average delay is shown in Figure 8 and Figure 9.
It can be seen that, under CAVs environment, signal control does not always dominate, FCFS policy outperforms signal when the traffic demand is relatively lower. It is consistent with the results illustrated in [45]: FCFS based AIM can reduce travel delay compared to signal control under light traffic; and in [46]: FCFS policy may result in more delay than signal under heavy traffic.
To some extent, signal-free strategies are more compatible with the advanced features of CAVs, and the performance of the two signal-free strategies is compared in the following.
4.2.2. R-FCFS vs. I-FCFS
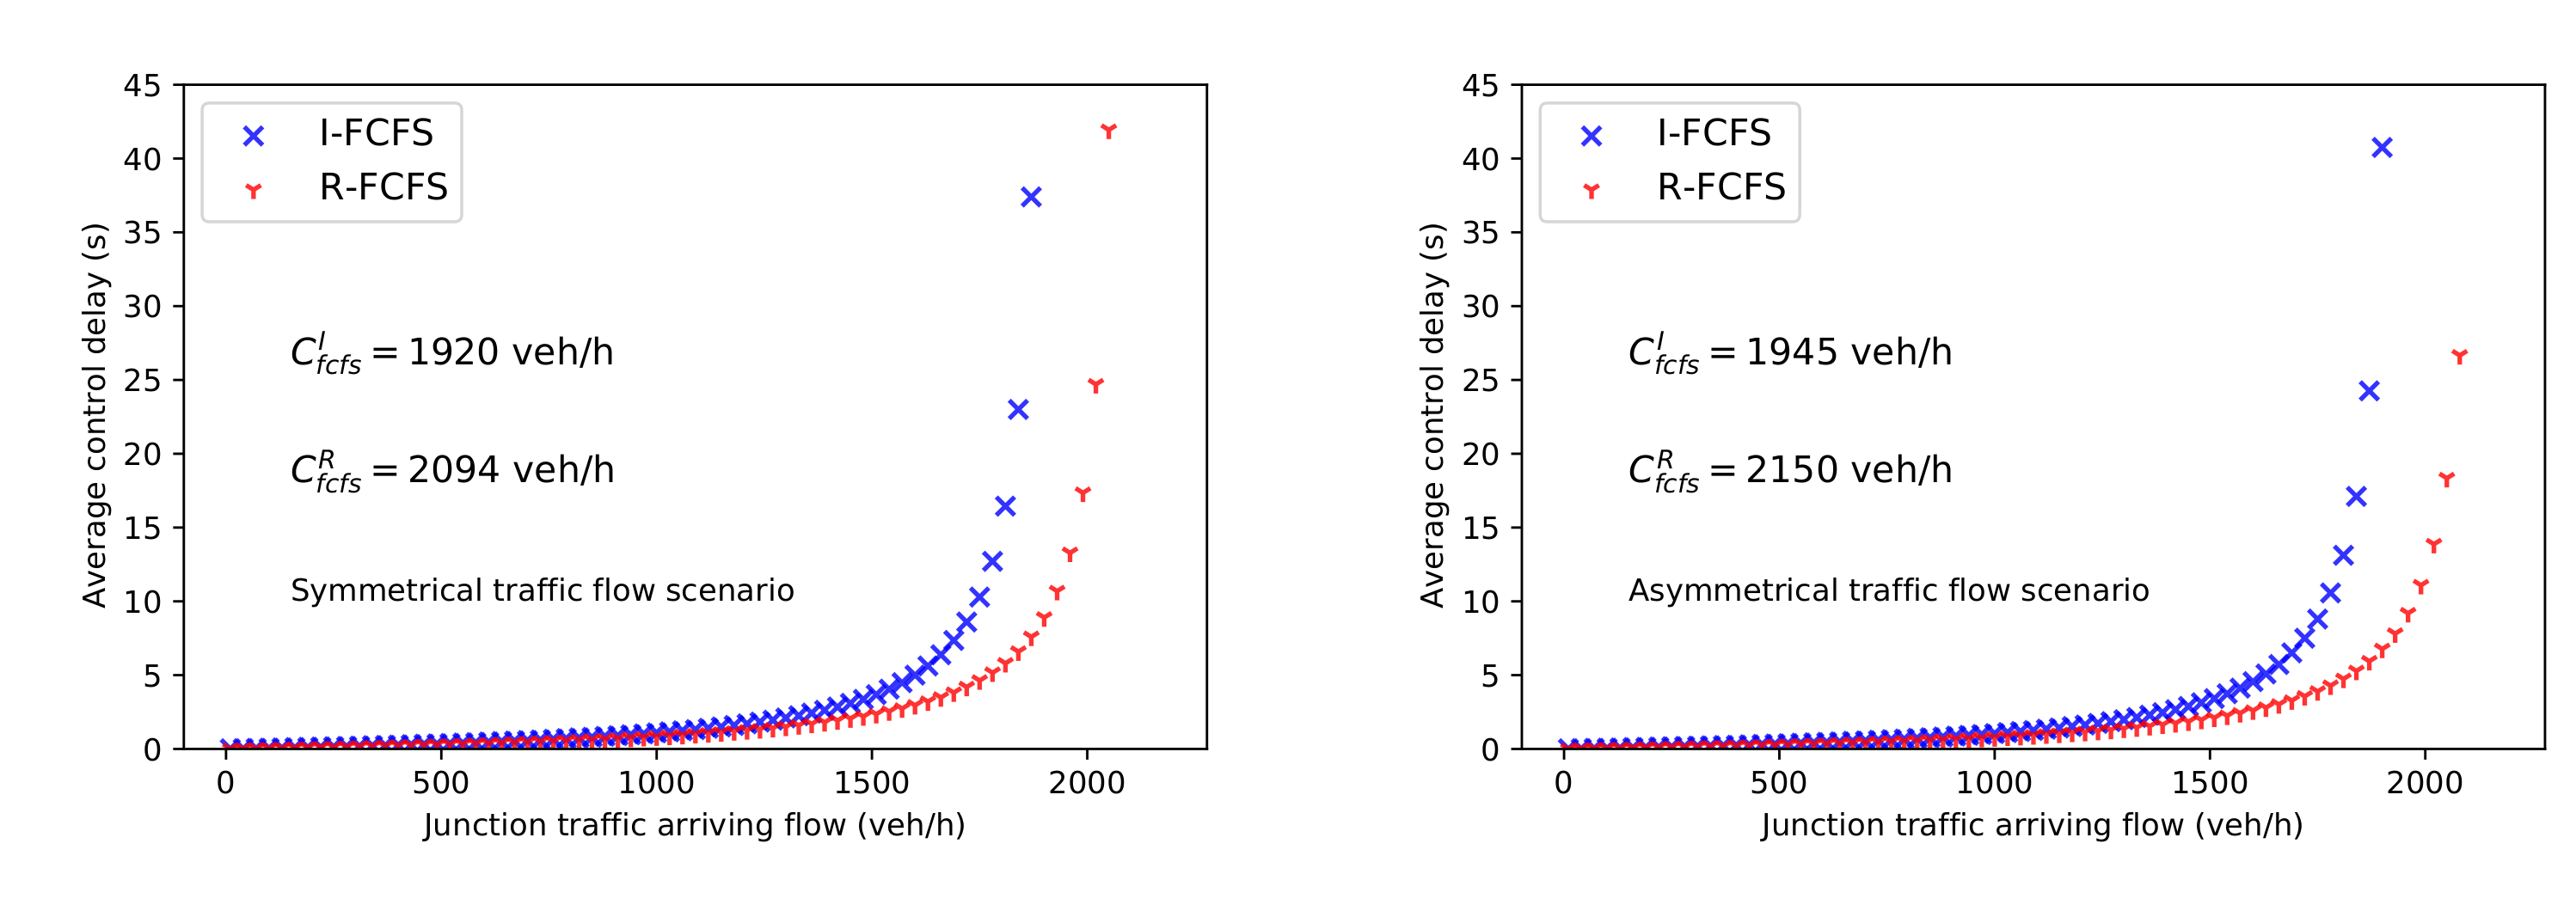
It is obtained that and , with the same traffic arriving rate, comparing the theoretical formulas Equations (36) and (37), got:
In general, under CAVs environment, for the same road junction, we can see that roundabout using FCFS policy outperforms I-FCFS in capacity and efficiency, see Equations (32) and (43). It is worth mentioning that this conclusion holds for any distribution of and , because they are assumed to be generally distributed in the derivation.
In order to more intuitively reflect the performance of I-FCFS and R-FCFS, delays are compared under two representative traffic demand patterns according to the derived equations, as shown in Figure 10. Symmetrical traffic flow scenario refers to the case where the traffic demand of each stream is the same, i.e., . Note that although the arrival rates are the same, the real traffic dynamics are not the same and independent of each other. The asymmetrical traffic flow scenario reflects the major-minor traffic pattern in which . Better performance of R-FCFS is verified.
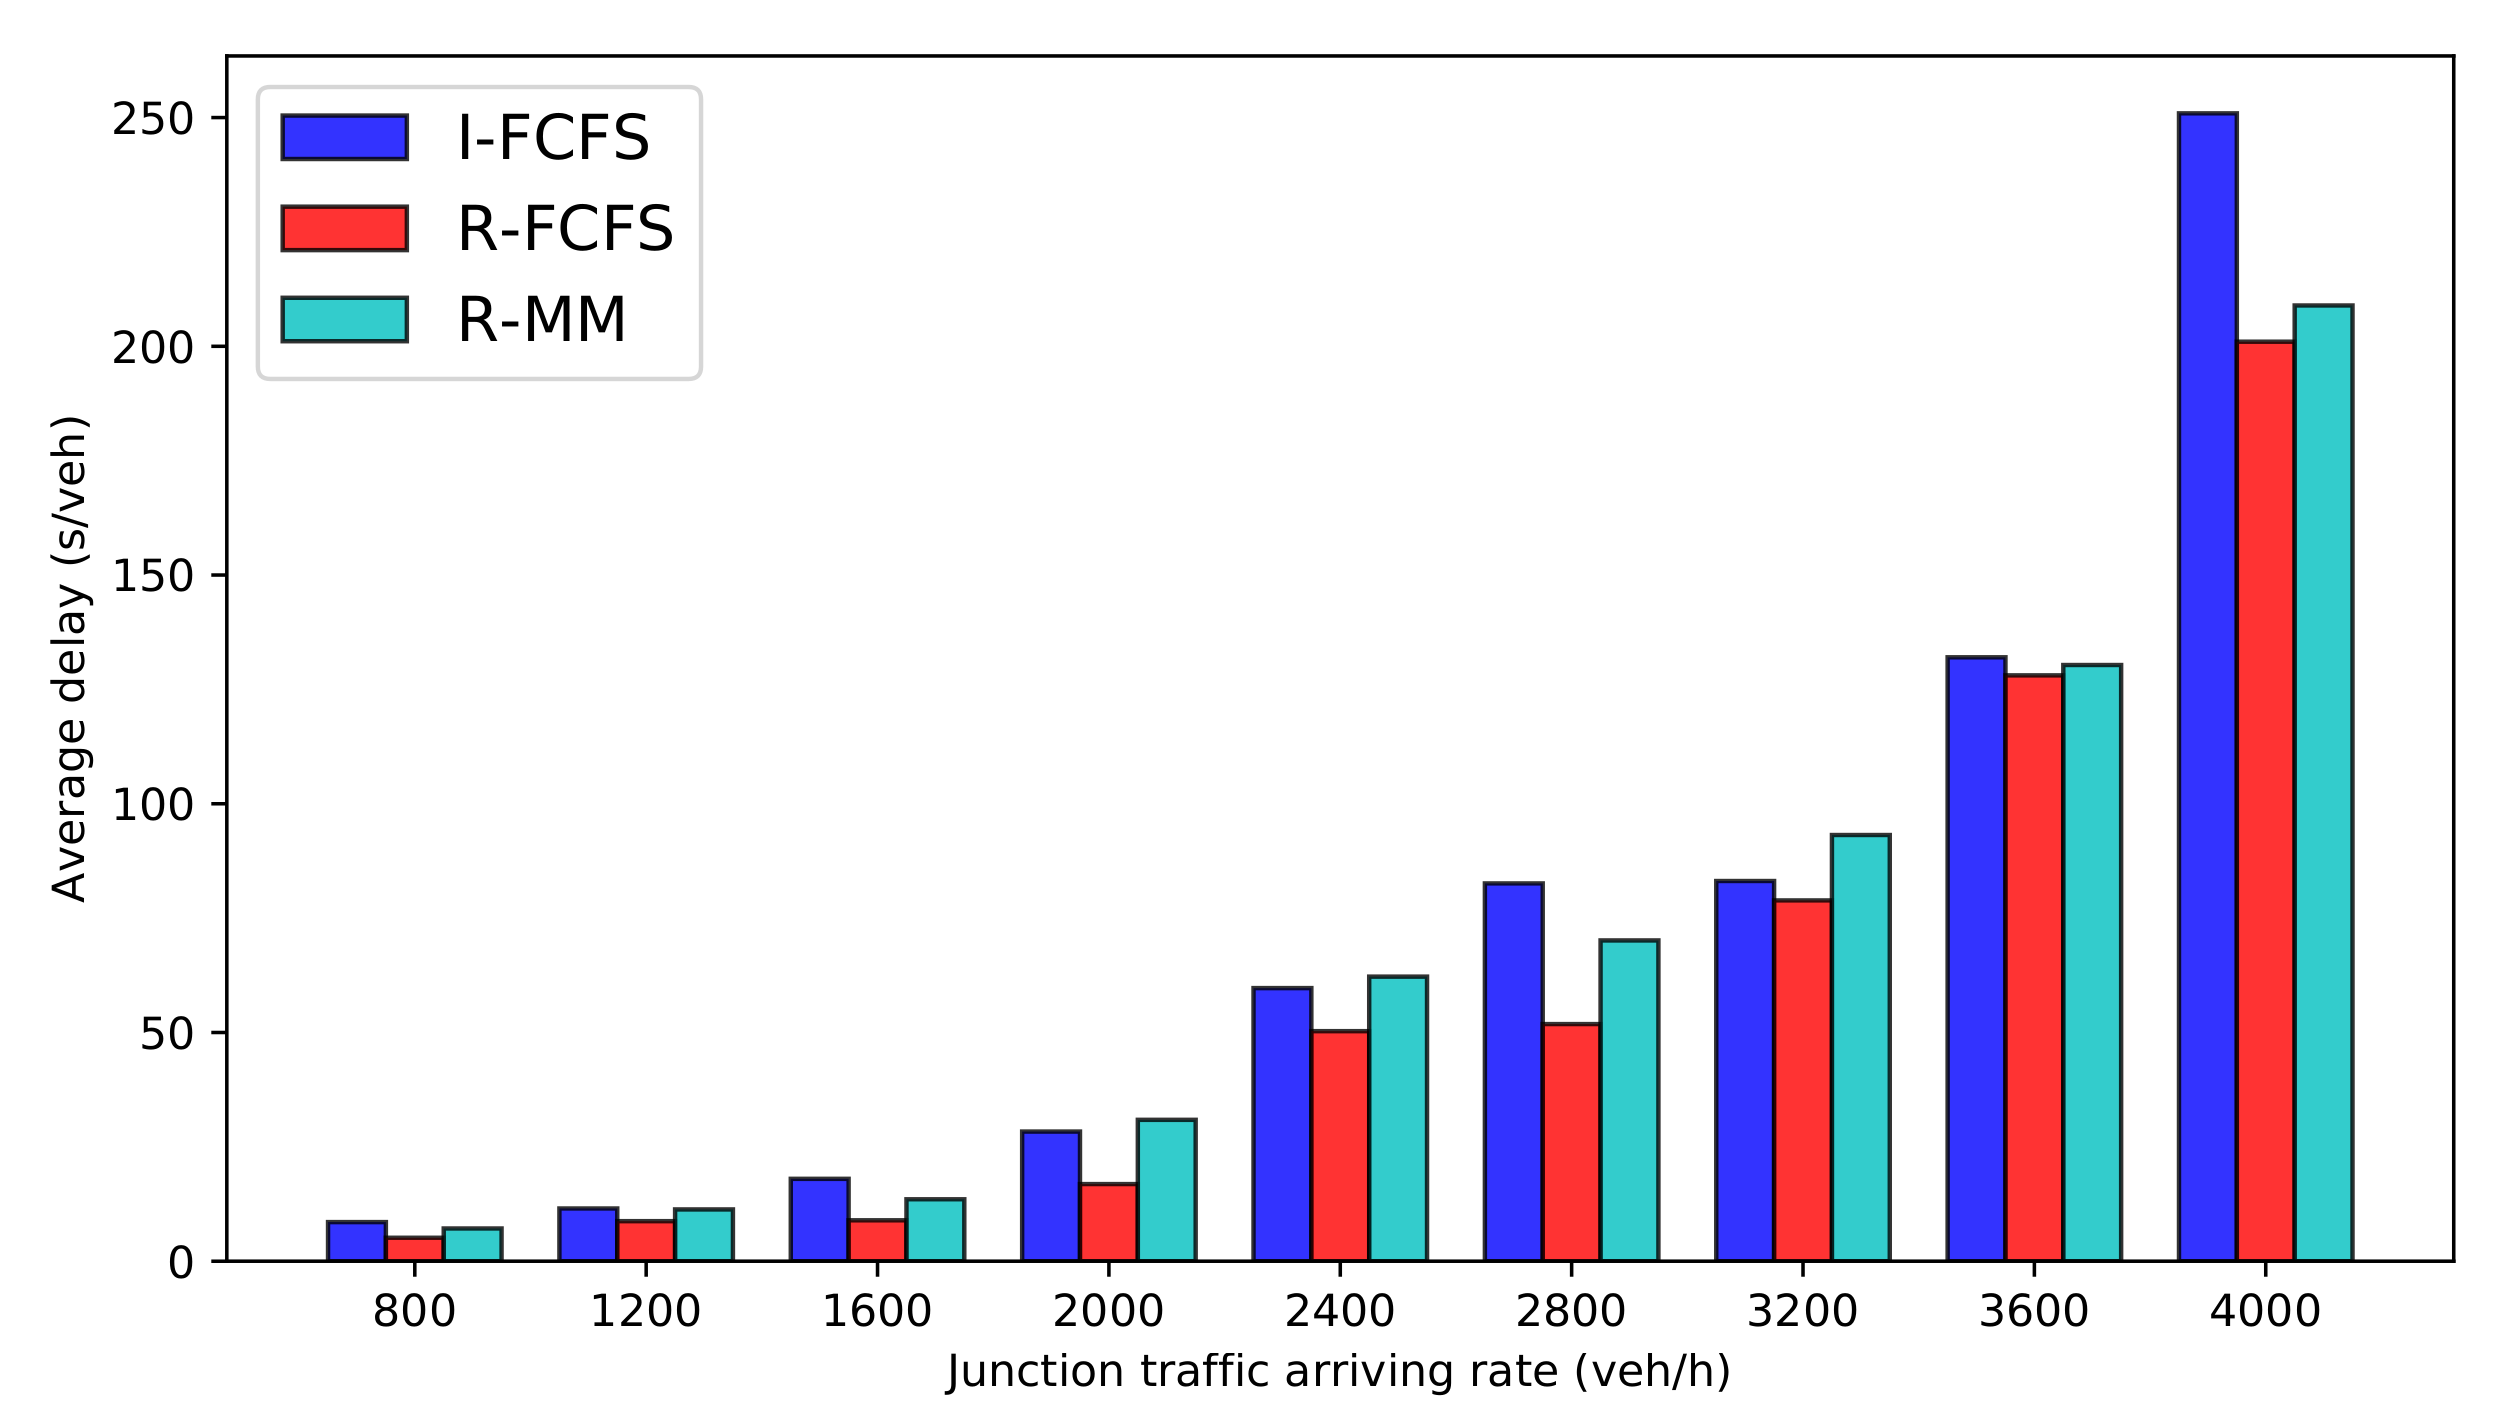
As we emphasized, the derived delay function is only applicable when the capacity of each strategy is not reached. Therefore, traffic simulations are conducted to corroborate the theoretical conclusions and to demonstrate the delay of each strategy when the junction traffic arriving rate exceeds the capacity.
SUMO traffic simulator is used to build the road junction, and TraCI interface is used to customize the FCFS policy to SUMO [47]. Cooperative adaptive cruise control (CACC) is adopted to simulate the car-following behavior of CAVs [48], in which the platoon headway s, the critical inter-arrival between consecutive platoons is set as s [49], and the driver imperfection is set to as perfect CAV behavior is expected. The situation shown in Figure 3 under symmetrical traffic flow scenario is simulated. The comparison of the average vehicle delay caused by each control strategy is shown in Figure 11. For each simulated scenario, each control has the same incoming traffic flow, thus the difference in delay only comes from the different junction organizations and control strategies.
As can be seen from Figure 11, under the same traffic flow situation, roundabout adopting FCFS policy always has the best performance among the three strategies. In addition, when the traffic flow is approaching the capacity, the control delay of each strategy increases greatly, which is very close to the theoretically derived value. The results of theoretical derivation are supported. The specific values for delays in Figure 11 can be found in Table 4.
It is worth noting that the three strategies comparatively analyzed in this paper, especially I-FCFS and R-FCFS, are very sensitive to the real-time traffic dynamics, since the assignment of road rights in FCFS is directly related to the arrival-time of vehicles. In other words, the randomness of traffic flow has a great influence on the performance of these strategies [50]. As a predetermined control policy, FCFS has its limitations. This is the reason why many optimization approaches are proposed for AIM on the basis of FCFS in order to further improve traffic [51]. However, as mentioned in the literature review, most of the research on signal-free junction management for CAVs, including the optimization of AIM, are based on the intersectional organization, circular organization is rarely considered. Through the comparison in this study, under the same circumstances, R-FCFS has a better performance than I-FCFS, which makes it reasonable to believe that the optimization based on R-FCFS may perform better than the optimization based on I-FCFS.
5. Conclusions
The paper sets out to compare the performance of intersection and roundabout in terms of capacity and delay in pure CAVs environment. The same in-coming traffic demand is guaranteed. Four management strategies are analyzed: Intersection using signal control (I-Signal), intersection using FCFS policy (I-FCFS), roundabout adopting FCFS policy (R-FCFS) and roundabout using the typical major-minor priority pattern (R-MM). Accounting for the characteristics of CAVs, queueing theory is applied to derive the formulas based on the general distribution of safety gaps rather than some specific distributions, which makes the formulas more applicable. The capacity of each strategy is inversely related to safety gaps, the smaller and , the larger the capacity. Under the same circumstances, I-Signal has the largest theoretical capacity, while R-FCFS has the largest capacity among the three signal-free strategies. Average delay is used as another measurement of the performance when the capacity of each strategy is not reached. Typical demand situations are analyzed. In terms of delay, signal-free policies outperform signal control under lower traffic demand situations, benefiting from the advanced CAVs characteristics.
The comparison results reveal an important point that the optimal management of CAVs based on circular trajectory organization, i.e., roundabout, could have at least the comparable performance as the optimal policy based on the intersectional organization. Roundabout should be given more attention in the signal-free management for CAVs. Thus, for the same incoming traffic demand under CAVs environment, with the same optimization goals, comparing the performance of intersection and roundabout is one of our future work. In addition, in order to facilitate the derivation of the formulas and the comparison of performances, some necessary assumptions are used. In the future, when the exact distributions of CAVs safety gaps are known, using the real data of junction traffic demand, the applicable scenarios and conditions of each strategy can be further distinguished using the proposed methods. This paper stems from the curiosity about whether roundabout has comparable performance to intersection under the pure CAVs environment. However, CAVs will coexist with conventional vehicles for a foreseeable transitional stage, as the full penetration of CAV technology still requires long-term development and evolution, which makes the mixed traffic composed of CAVs and conventional vehicles inevitable. The analysis of mixed traffic is of great significance, and is one of our future works.
Author Contributions
Conceptualization, methodology, data analysis, writing original draft preparation, Y.W.; supervision, proofreading, review and editing, F.Z. All authors have read and agreed to the published version of the manuscript.
Funding
This research was funded by Singapore Ministry of Education Academic Research Fund Tier 2 MOE2017-T2-1-029.
Institutional Review Board Statement
Not applicable.
Informed Consent Statement
Not applicable.
Conflicts of Interest
The authors declare no conflict of interest.
References
- Taiebat, M.; Brown, A.L.; Safford, H.R.; Qu, S.; Xu, M. A review on energy, environmental, and sustainability implications of connected and automated vehicles. Environ. Sci. Technol. 2018, 52, 11449–11465. [Google Scholar] [CrossRef]
- Azmat, M.; Kummer, S. Potential applications of unmanned ground and aerial vehicles to mitigate challenges of transport and logistics-related critical success factors in the humanitarian supply chain. Asian J. Sustain. Soc. Responsib. 2020, 5, 3. [Google Scholar] [CrossRef] [Green Version]
- Fagnant, D.J.; Kockelman, K. Preparing a nation for autonomous vehicles: Opportunities, barriers and policy recommendations. Transp. Res. Part A Policy Pract. 2015, 77, 167–181. [Google Scholar] [CrossRef]
- Wintersberger, S.; Azmat, M.; Kummer, S. Are we ready to ride autonomous vehicles? A Pilot Study on Austrian Consumers’ Perspective. Logistics 2019, 3, 20. [Google Scholar] [CrossRef] [Green Version]
- Chen, L.; Englund, C. Cooperative intersection management: A survey. IEEE Trans. Intell. Transp. Syst. 2016, 17, 570–586. [Google Scholar] [CrossRef]
- Dresner, K.; Stone, P. Multiagent traffic management: A reservation-based intersection control mechanism. In Third International Joint Conference on Autonomous Agents and Multiagent Systems-Volume 3; IEEE Computer Society: Los Alamitos, CA, USA, 2004; pp. 530–537. [Google Scholar]
- Kimber, R. The Traffic Capacity of Roundabouts, TRRL Laboratory Report 942; Transport and Road Research Laboratory: Crowthorne, UK, 1980. [Google Scholar]
- Veith, G. Guide to Road Design: Part 4A: Unsignalised and Signalised Intersections; Technical Report; Austroads: Sydney, Australia, 2010. [Google Scholar]
- HCM. Highway Capacity Manual, 6th ed.; Transportation Research Board: Washington, DC, USA, 2016. [Google Scholar]
- Mauro, R.; Pompigna, A. State of the art and computational aspects of time-dependent waiting models for non-signalised intersections. J. Traffic Transp. Eng. (Engl. Ed.) 2020, 7, 808–831. [Google Scholar] [CrossRef]
- Pompigna, A.; Guerrieri, M.; Mauro, R. New Extensions and Applications of the Modified Chumanov Model for Calculating Entry Capacity of Single-Lane Roundabouts. Sustainability 2020, 12, 6122. [Google Scholar] [CrossRef]
- Molina-Masegosa, R.; Gozalvez, J. LTE-V for sidelink 5G V2X vehicular communications: A new 5G technology for short-range vehicle-to-everything communications. IEEE Veh. Technol. Mag. 2017, 12, 30–39. [Google Scholar] [CrossRef]
- Van Arem, B.; Van Driel, C.J.; Visser, R. The impact of cooperative adaptive cruise control on traffic-flow characteristics. IEEE Trans. Intell. Transp. Syst. 2006, 7, 429–436. [Google Scholar] [CrossRef] [Green Version]
- Makridis, M.; Mattas, K.; Ciuffo, B.; Raposo, M.A.; Thiel, C. Assessing the impact of connected and automated vehicles. A freeway scenario. In Advanced Microsystems for Automotive Applications 2017; Springer: Cham, Switzerland, 2018; pp. 213–225. [Google Scholar]
- Zhou, J.; Zhu, F. Analytical analysis of the effect of maximum platoon size of connected and automated vehicles. Transp. Res. Part C Emerg. Technol. 2021, 122, 102882. [Google Scholar] [CrossRef]
- Azmat, M.; Kummer, S.; Moura, L.T.; Gennaro, F.D.; Moser, R. Future outlook of highway operations with implementation of innovative technologies like AV, CV, IoT and Big Data. Logistics 2019, 3, 15. [Google Scholar] [CrossRef] [Green Version]
- Malikopoulos, A.A.; Cassandras, C.G.; Zhang, Y.J. A decentralized energy-optimal control framework for connected automated vehicles at signal-free intersections. Automatica 2018, 93, 244–256. [Google Scholar] [CrossRef] [Green Version]
- Dresner, K.; Stone, P. A multiagent approach to autonomous intersection management. J. Artif. Intell. Res. 2008, 31, 591–656. [Google Scholar] [CrossRef] [Green Version]
- Hausknecht, M.; Au, T.C.; Stone, P. Autonomous intersection management: Multi-intersection optimization. In Proceedings of the 2011 IEEE/RSJ International Conference on Intelligent Robots and Systems, San Francisco, CA, USA, 25–30 September 2011; pp. 4581–4586. [Google Scholar]
- Fajardo, D.; Au, T.C.; Waller, S.; Stone, P.; Yang, D. Automated intersection control: Performance of future innovation versus current traffic signal control. Transp. Res. Rec. J. Transp. Res. Board 2011, 2259, 223–232. [Google Scholar] [CrossRef] [Green Version]
- Mauro, R.; Cattani, M. Functional and economic evaluations for choosing road intersection layout. PROMET-Traffic Transp. 2012, 24, 441–448. [Google Scholar] [CrossRef] [Green Version]
- NYSDOT. NYSDOT’s Web Site Dedicated to Modern Roundabouts. 2018. Available online: https://www.dot.ny.gov/main/roundabouts (accessed on 20 August 2019).
- Zhu, F.; Ukkusuri, S.V. A linear programming formulation for autonomous intersection control within a dynamic traffic assignment and connected vehicle environment. Transp. Res. Part C Emerg. Technol. 2015, 55, 363–378. [Google Scholar] [CrossRef]
- Sun, W.; Zheng, J.; Liu, H.X. A capacity maximization scheme for intersection management with automated vehicles. Transp. Res. Procedia 2017, 23, 121–136. [Google Scholar] [CrossRef]
- Mirheli, A.; Hajibabai, L.; Hajbabaie, A. Development of a signal-head-free intersection control logic in a fully connected and autonomous vehicle environment. Transp. Res. Part C Emerg. Technol. 2018, 92, 412–425. [Google Scholar] [CrossRef]
- Levin, M.W.; Fritz, H.; Boyles, S.D. On optimizing Reservation-Based intersection controls. IEEE Trans. Intell. Transp. Syst. 2017, 18, 505–515. [Google Scholar] [CrossRef]
- Zohdy, I.H.; Rakha, H.A. Intersection management via vehicle connectivity: The intersection cooperative adaptive cruise control system concept. J. Intell. Transp. Syst. 2016, 20, 17–32. [Google Scholar] [CrossRef]
- Nor, M.H.B.M.; Namerikawa, T. Merging of Connected and Automated Vehicles at Roundabout Using Model Predictive Control. In Proceedings of the 2018 57th Annual Conference of the Society of Instrument and Control Engineers of Japan (SICE), Nara, Japan, 11–14 September 2018; pp. 272–277. [Google Scholar]
- Debada, E.G.; Gillet, D. Virtual Vehicle-Based Cooperative Maneuver Planning for Connected Automated Vehicles at Single-Lane Roundabouts. IEEE Intell. Transp. Syst. Mag. 2018, 10, 35–46. [Google Scholar] [CrossRef]
- Zhao, L.; Malikopoulos, A.; Rios-Torres, J. Optimal control of connected and automated vehicles at roundabouts: An investigation in a mixed-traffic environment. IFAC-PapersOnLine 2018, 51, 73–78. [Google Scholar] [CrossRef]
- Yang, X.; Li, X.; Xue, K. A new traffic-signal control for modern roundabouts: Method and application. IEEE Trans. Intell. Transp. Syst. 2004, 5, 282–287. [Google Scholar] [CrossRef]
- Lioris, J.; Pedarsani, R.; Tascikaraoglu, F.Y.; Varaiya, P. Platoons of connected vehicles can double throughput in urban roads. Transp. Res. Part C Emerg. Technol. 2017, 77, 292–305. [Google Scholar] [CrossRef] [Green Version]
- Heidemann, D.; Wegmann, H. Queueing at unsignalized intersections. Transp. Res. Part B Methodol. 1997, 31, 239–263. [Google Scholar] [CrossRef]
- Little, J.D.; Graves, S.C. Little’s law. In Building Intuition; Springer: Boston, MA, USA, 2008; pp. 81–100. [Google Scholar]
- Medhi, J. Stochastic Models in Queueing Theory; Elsevier: Amsterdam, The Netherlands, 2002. [Google Scholar]
- Simchi-Levi, D.; Trick, M.A. Introduction to Little’s Law as Viewed on Its 50th Anniversary. Oper. Res. 2011, 59, 535. [Google Scholar] [CrossRef]
- Wu, N. A universal procedure for capacity determination at unsignalized (priority-controlled) intersections. Transp. Res. Part B Methodol. 2001, 35, 593–623. [Google Scholar] [CrossRef]
- Boon, M.A.; Mandjes, M.; Núñez-Queija, R. Congestion analysis of unsignalized intersections: The impact of impatience and Markov platooning. Eur. J. Oper. Res. 2019, 273, 1026–1035. [Google Scholar]
- Tanner, J. A theoretical analysis of delays at an uncontrolled intersection. Biometrika 1962, 49, 163–170. [Google Scholar] [CrossRef]
- Wu, N. Impedance Effects for Streams of Higher Ranks at unsignalized intersections. In Proceedings of the Third International Symposium on Highway Capacity, Copenhagen, Denmark, 22–26 June 1998; pp. 1137–1154. [Google Scholar]
- Abhishek, A.; Mandjes, M.; Boon, M.; Núñez-Queija, R. Congestion analysis of unsignalized intersections. In Proceedings of the 2016 8th International Conference on Communication Systems and Networks (COMSNETS), Bangalore, India, 5–10 January 2016. [Google Scholar]
- Gandhi, A.; Doroudi, S.; Harchol-Balter, M.; Scheller-Wolf, A. Exact analysis of the M/M/k/setup class of Markov chains via recursive renewal reward. In ACM SIGMETRICS Performance Evaluation Review; ACM: New York, NY, USA, 2013; Volume 41, pp. 153–166. [Google Scholar]
- Webster, F.V. Traffic Signal Settings; Technical Report; Transportation Research Board: Washington, DC, USA, 1958. [Google Scholar]
- Ghiasi, A.; Hussain, O.; Qian, Z.S.; Li, X. A mixed traffic capacity analysis and lane management model for connected automated vehicles: A Markov chain method. Transp. Res. Part B Methodol. 2017, 106, 266–292. [Google Scholar] [CrossRef]
- Dresner, K.M. Autonomous Intersection Management; Technical Report; University of Texas at Austin Austin United States: Austin, TX, USA, 2009. [Google Scholar]
- Levin, M.W.; Boyles, S.D.; Patel, R. Paradoxes of reservation-based intersection controls in traffic networks. Transp. Res. Part A Policy Pract. 2016, 90, 14–25. [Google Scholar] [CrossRef]
- Lopez, P.A.; Behrisch, M.; Bieker-Walz, L.; Erdmann, J.; Flötteröd, Y.P.; Hilbrich, R.; Lücken, L.; Rummel, J.; Wagner, P.; Wießner, E. Microscopic Traffic Simulation using SUMO. In Proceedings of the 21st IEEE International Conference on Intelligent Transportation Systems, Maui, HI, USA, 4–7 November 2018. [Google Scholar]
- Milanés, V.; Shladover, S.E. Modeling cooperative and autonomous adaptive cruise control dynamic responses using experimental data. Transp. Res. Part C Emerg. Technol. 2014, 48, 285–300. [Google Scholar] [CrossRef] [Green Version]
- Jiang, Y.; Li, S.; Shamo, D.E. A platoon-based traffic signal timing algorithm for major–minor intersection types. Transp. Res. Part B Methodol. 2006, 40, 543–562. [Google Scholar] [CrossRef]
- Wu, Y.; Chen, H.; Zhu, F. DCL-AIM: Decentralized coordination learning of autonomous intersection management for connected and automated vehicles. Transp. Res. Part C Emerg. Technol. 2019, 103, 246–260. [Google Scholar] [CrossRef]
- Yu, C.; Sun, W.; Liu, H.X.; Yang, X. Managing connected and automated vehicles at isolated intersections: From reservation-to optimization-based methods. Transp. Res. Part B Methodol. 2019, 122, 416–435. [Google Scholar] [CrossRef]
Figure 1.
Intersectional and circular organizations at a road junction.

Figure 2.
Cooperative adaptive cruise control of CAVs.

Figure 3.
The situation analyzed in this paper.

Figure 4.
Illustration of conflict types of a typical intersection or roundabout.

Figure 5.
Stream structure of roundabout.

Figure 6.
Markov chain for the M/M/1/setup.

Figure 7.
The performance of Webster signal control and M/M/1/setup model.

Figure 8.
Delay comparison under random demand scenario with (a) s, s and (b) s, s.

Figure 9.
Delay comparison under random demand scenario with (a) s, s and (b) s, s.

Figure 10.
Delay comparison under (a) symmetrical traffic flow scenario and (b) asymmetrical traffic flow scenario.
Figure 10.
Delay comparison under (a) symmetrical traffic flow scenario and (b) asymmetrical traffic flow scenario.

Figure 11.
Delay comparison of simulation results.


Table 1.
Notations.
| Set | Description |
|---|---|
| L | set of lanes (streams) |
| set of non-conflicting streams of stream i | |
| set of conflicting streams of stream i | |
| E | set of entry approaches |
| Variable | Description |
| C | capacity of a control strategy |
| D | average control delay |
| signal cycle time (s) | |
| total loss time in signal control (s) | |
| total green time in signal control (s) | |
| an arbitrary CAV | |
| headway of CACC (s) | |
| safety time gap between two vehicles from conflicting streams (s) | |
| base/saturation flow rate of a stream () | |
| vehicle arrival rate of stream i () | |
| the sum of the arrival rate in stream group g | |
| the maximum arrival rate in stream group g | |
| the sum of | |
| the sum of | |
| service rate of a queueing system | |
| X | service time |
| W | mean waiting time of a queueing system |
Table 2.
The conflicting streams of a stream i within the intersection.
| Stream i | Conflicting Stream Set |
|---|---|
| 1 | 3 6 7 8 |
| 2 | 3 4 5 8 |
| 3 | 1 2 5 8 |
| 4 | 2 5 6 7 |
| 5 | 2 3 4 7 |
| 6 | 1 4 7 8 |
| 7 | 1 4 5 6 |
| 8 | 1 2 3 6 |
Table 3.
The circulating stream of an entry stream e within the single-lane roundabout.
| Entry Stream | Circulating Stream | |
|---|---|---|
| superimposed of stream | 1 2 | 3 4 6 |
| superimposed of stream | 3 4 | 5 6 8 |
| superimposed of stream | 5 6 | 2 7 8 |
| superimposed of stream | 7 8 | 1 2 4 |
Table 4.
The average delay (s) of simulations.
| Junction Traffic Arriving Rate | I-FCFS | R-FCFS | R-MM |
|---|---|---|---|
| 800 veh/h | 8.55 | 5.13 | 7.16 |
| 1200 veh/h | 11.53 | 8.75 | 11.32 |
| 1600 veh/h | 18.01 | 8.94 | 13.54 |
| 2000 veh/h | 28.34 | 16.86 | 30.9 |
| 2400 veh/h | 59.70 | 50.29 | 62.21 |
| 2800 veh/h | 82.59 | 51.84 | 70.12 |
| 3200 veh/h | 83.11 | 78.87 | 93.17 |
| 3600 veh/h | 132.01 | 128.06 | 130.33 |
| 4000 veh/h | 250.92 | 201.00 | 208.92 |
Publisher’s Note: MDPI stays neutral with regard to jurisdictional claims in published maps and institutional affiliations. |
© 2021 by the authors. Licensee MDPI, Basel, Switzerland. This article is an open access article distributed under the terms and conditions of the Creative Commons Attribution (CC BY) license (https://creativecommons.org/licenses/by/4.0/).
Share and Cite
MDPI and ACS Style
Wu, Y.; Zhu, F. Junction Management for Connected and Automated Vehicles: Intersection or Roundabout? Sustainability 2021, 13, 9482. https://0-doi-org.brum.beds.ac.uk/10.3390/su13169482
AMA Style
Wu Y, Zhu F. Junction Management for Connected and Automated Vehicles: Intersection or Roundabout? Sustainability. 2021; 13(16):9482. https://0-doi-org.brum.beds.ac.uk/10.3390/su13169482
Chicago/Turabian StyleWu, Yuanyuan, and Feng Zhu. 2021. "Junction Management for Connected and Automated Vehicles: Intersection or Roundabout?" Sustainability 13, no. 16: 9482. https://0-doi-org.brum.beds.ac.uk/10.3390/su13169482
Note that from the first issue of 2016, this journal uses article numbers instead of page numbers. See further details here.