1. Introduction
CAESAR II (Complementary Analyses for Emergency planning based on Seismic Risks impact evaluations) is a tool developed as a decision support system for public authorities involved in the development of seismic disaster risk reduction plans, with the possibility of planning medium and long-term investments, as well as defining customized financial support mechanisms and tax incentives.
The project, developed as a follow-up of the EU-FP7 CRISMA project (2012–2015), is funded by Agency for the Territorial Cohesion, the Managing Authority for the program Governance and Institutional Capacity 2014/2020, as an intervention aimed at the transfer, evolution and dissemination of best practices among Italian Public Administrations. The beneficiary Administration, as well as the Leading Body, is the Municipality of Cava de’ Tirreni (Campania Region), the transferring bodies are the Campania Region and the PLINIVS-LUPT Study Center of the University of Naples Federico II and the reusing bodies are the Municipality of Grumento Nova (Basilicata Region) and the Region of Sicily.
CAESAR II includes a module for the simulation of mass-retrofitting measures applied at a municipal scale integrating different categories of seismic and energy improvement measures, based on the vulnerability analysis of the existing building stock. The core of the CAESAR II tool is represented by the production of on-demand ‘Seismic Impact scenarios’ according to the requests of the end-users in terms of hazard intensities and relevant elements at risk to be considered in the area object of the simulation. The output of the model includes information on expected damage thresholds for buildings and population. Impact scenarios can be customized based on the territorial detail requested, data availability and specific needs. The scenarios include geo-referenced data managed by geo-servers capable of exchanging data in a format compliant with OGC standards and the European INSPIRE Directive. The output of the simulations can be further processed through multi-criteria and cost-benefit analysis modules to support the appraisal of alternative seismic and energy retrofitting options.
In the literature, there are many works related to risk analysis, either in a broad sense or to some specific factor. Some specific studies on the vulnerability can be found in [
1,
2,
3,
4,
5,
6,
7,
8,
9,
10] and on the exposure in [
11,
12] Regarding the costs analyses, some works are reported in [
13,
14] and on the multi-criteria, there are [
15,
16,
17,
18,
19].
In recent years, research has focused on creating comprehensive tools for every aspect of the process. One of the newcomers is the IRMA (Italian Risk Maps) platform [
20], developed by the Department of Italian Civil Protection (DPC). It integrates tools for calculating damage scenarios and risk maps for the Italian territory. The IRMA platform is designed for the scientific community and allows users to create and load different exposure/vulnerability databases and different sets of fragility curves. The hazard for calculating risk maps is instead preloaded and is the hazard model developed by INGV (National Institute of Geophysics and Volcanology) and adopted at the national level.
In this framework, the CAESAR II project is born. It is a web-service procedure conceived as a decision support system for public authorities engaged in the development of disaster risk reduction plans. It is a web-service tool producing scenario and seismic risk analyses in terms of economic, building and human life losses and evaluating their possible reduction through cost-benefit and multi-criteria analyses to support decisions. The application can analyze the Italian municipalities on a mesh of 250 × 250 m for which hazard and exposure factors are defined. CAESAR II is based on three models of analysis, described below:
The three models have been synergistically implemented in different modules within the so-called ‘reuse kit’.
In the following sections, the CAESAR II model is illustrated e its application concerning the municipality of Cava de’ Tirreni is shown.
2. Seismic Impact Risk and Scenario Analysis Model
2.1. Risk and Scenario
The ‘Seismic Impact Risk and Scenario Analysis Model’ constitutes the core of CAESAR II tool. It is able to furnish preliminary assessments of the effects on the territory caused by earthquakes through ‘risk’ and ‘scenario’ analyses.
‘Risk’ is the probability that a prefixed level of damage (on people, buildings, infrastructures, economy, etc.) caused by seismic events will occur within a given period in a specific geographical area. Therefore, the risk should be intended as a cumulative assessment, which considers the total potential damage in the same area generated by different events in a fixed time frame. ‘Scenario’, instead, represents the probabilistic distribution, in a particular geographical area, of the damage induced by a single seismic event with an assigned probability of occurrence (assumed as the ‘reference scenario’).
In both types of analyses, three variables come into question: hazard, exposure and vulnerability. They can be evaluated on a deterministic or probabilistic basis. In CAESAR II, the approach followed is the probabilistic one, which allows applications at territorial scale, even in the absence of limited data.
The ‘hazard’ is the probability of occurrence, in a specific area and a specific period, of all possible seismic events, for risk analysis, or of a single event, in the case of scenario analysis. The ‘exposure’ is the geographic distribution in quantitative and qualitative terms of the different elements at risk that characterize the area under consideration (people, buildings, infrastructure, activities and movable property). The conditions and/or operation may be damaged, altered or destroyed due to the occurrence of the natural event. The ‘vulnerability’ is the sensitivity of an exposed element to a natural event. It can be evaluated as the probability that the exposed element will suffer a certain level of damage or change of state, concerning an appropriate scale, because of a seismic event of assigned intensity.
In emergency planning, both risk and scenario analyses can be used in response to the different goals that are to be pursued. Risk analyses allow for comparative evaluations of areas subject to planning both for decisions on intervention strategies (e.g., evacuation priorities, etc.) and the definition of damage mitigation interventions. Scenario analyses allow for the quantification of the resources necessary for the emergency planning and the organization of the operative intervention through the identification of the extent of the area of interest and the evaluation of the territorial impact.
2.2. Hazard
In the CAESAR II tool, the hazard parameter used is the PGA (peak ground acceleration), because of the availability of PGA-Level Damage fragility curves developed by the authors, whose reliability has been tested in other applications. Although hazard may be defined by different parameters relevant to seismic motions, such as spectral shape, duration and energy content, PGA has been chosen since it represents the most consolidated quantity used by the Italian community [
1,
2,
3,
5]. In this sense, the available PGA data sufficiently characterize the entire national territory, while the use of different parameters can result in less reliable analyses. It is not excluded that further hazard parameters will also be adopted in the future.
In the case of ‘risk’ analysis, the primary seismic hazard adopted is the maximum value of horizontal ground acceleration (PGA), calculated by the National Institute of Geophysics and Volcanology (INGV). The PGA values are given in correspondence of a grid of 10,751 points, defined by latitude and longitude coordinates and covering the whole Italian territory.
For each node in the geographic mesh, parameters are provided at specified return periods, TR (30, 50, 72, 101, 140, 201, 475, 975 and 2475 years). PGA maps are calculated for different exceedance probabilities over 50 years (9 in total, ranging from 2% to 81%). For each estimation, the 50th percentile distribution (median map, which is the reference map for each exceedance probability) and the 16th and 84th percentile distributions are available, indicating the variability of the estimates.
In the case of a ‘scenario’ analysis, the seismic event taken as a reference can be assumed through (1) an attenuation law as a function of some seismic parameters, such as the coordinates of the hypocentre and the magnitude value, or (2) a shaking map (ShakeMap). The distribution over the territory of the parameters that define the extent of a seismic event (e.g., the PGA) can be derived through the adoption of an attenuation law, as a function of other seismic parameters (usually the magnitude) and epicentral (or hypocentral) coordinates. CAESAR II adopts, as an attenuation law, the relation of Blake [
21], which assumes a decimal logarithmic decay, and the conversion law determined by Faenza and Michelini [
22,
23] between the observed shaking parameters and the MCS intensity scale.
In Italy, shaking maps are provided by INGV for all earthquakes with a magnitude of M ≥ 3.0 occurring in the national territory and the surrounding areas. These are published on the website
http://shakemap.rm.ingv.it (accessed on 22 August 2021). When new information or additional earthquake data become available (e.g., the size of the earthquake fault—extended fault—or new data from networks operated by other agencies), the maps are updated to improve the definition of ground shaking, particularly in epicentral areas. They provide an immediate visualisation of the level of shaking of an area affected or interested by an earthquake, reporting the peak values recorded by accelerometers and seismometers located in the area, mainly provided by the National Accelerometric Network (RAN) of the Department of Civil Protection and the National Seismic Network (RSN) of INGV. If there are no observed values, an ad hoc software interpolates the data using, for example, the attenuation laws of the shaking with the distance available for the centre of each cell of the grid belonging to the area under examination.
2.3. Exposure
Exposure and vulnerability are closely related factors. For each category of elements at risk, the estimate of vulnerability to the seismic event must be accompanied by a qualitative and quantitative analysis of the exposed property (exposure) to identify the spatial, and possibly temporal, distribution of the typological classes of elements at risk, called classes of vulnerability, each of which is a set of elements whose characteristics present similar behaviour (Vulnerability) concerning the earthquake. In other words, it is necessary to identify the salient characteristics of the element at risk (vulnerability factors), to which a specific capacity to respond to the natural phenomenon is attributed.
CAESAR II refers to two types of elements at risk: ordinary buildings and their occupants. The estimation of the buildings in the area under examination can be based on a statistical analysis, which evaluates the percentage distribution of the different classes of vulnerability of the buildings (A, B, C, D for decreasing vulnerability) based on their different behaviour towards the natural event. A similar procedure is adopted to estimate the population and the distribution of occupants for buildings divided by vulnerability class.
The exposure model uses a procedure that can consider both the General Population and Housing Census data furnished by Italian National Statistical Institute (ISTAT) [
24], or the ISTAT data combined with information coming from a data collection activity building by building on the investigated area. In the last case, the data are collected by compiling a first-level form, called the PLINIVS form, included in the CAESAR II tool (automatically loaded through an ad hoc application or manually loaded from Excel or a .csv format). The macro-sections of the PLINIVS form are the following:
IDENTIFICATION section. It geo-locates the building.
GENERAL INFORMATION section. For each building, it refers to: type (ordinary building, warehouse, power station, etc.), destination (hospital, school, etc.), use (entirely used, partially used, not used and abandoned) and exposure (ordinary, strategic, exposed to particular risks).
CONDITION section. It refers to: age, state of conservation of the structure (poor, mediocre, good and excellent) and type of finishes (economic, ordinary, luxury).
DESCRIPTIVE FEATURES section. It refers to: total number of floors starting from the ground floor, number of floors above ground, including the attic; number of residential apartments; presence of basement occupied; height of the first floor; minimum and maximum heights of all floors up to the roof; presence of obstacles with a height greater than 2 m; orientation (angle between the longest facade or the main facade and the North); and building position in the structural aggregate.
STRUCTURAL CHARACTERISTICS section. It refers to: vertical structures (sack masonry with or without reinforcements, hewn stone masonry, tuff block masonry, reinforced concrete frame with weak or resistant infill, etc.); horizontal structures (timber floor, floor with steel beams, concrete floor, vaults, etc.); thickness of the walls; and typologies of continuous facades (tuff blocks or squared stones, concrete blocks, etc.).
OPENINGS section. It refers to: percentage of openings on the façade; number of small, medium and large windows; material (wood, PVC, aluminum or wood-aluminum, light steel and anti-intrusion type steel); protections and status.
INTERVENTIONS section. It refers to: age and typology of intervention (extraordinary maintenance, redevelopment and adaptation).
REGULARITY section. It refers to: distribution of masses and stiffnesses in plan and elevation; type of structure (with single or double monodirectional frame, with single or double directional wall, or walls with frames); presence of a soft floor (pilotis on a part of the ground floor, completely open ground floor or intermediate soft floors); and possible presence of squat elements.
The input data on buildings are processed by the S.A.V.E. [
25] and B.I.N.C. [
12] procedures, which aim to characterise the seismic vulnerability of specific building typologies (S.A.V.E.) and to evaluate a probable geographical distribution of these building typologies according to their recurrence in the ISTAT census data (B.I.N.C.).
In particular, the S.A.V.E. model is used to assign vulnerability classes to single buildings, detected in the data collection campaigns on the territory, according to their typological and structural characteristics. The B.I.N.C. model exploits the S.A.V.E. method and defines a probable distribution of the ISTAT buildings on the vulnerability classes, starting from the population density of the considered municipality and from the ages of construction of the buildings identified on each census section.
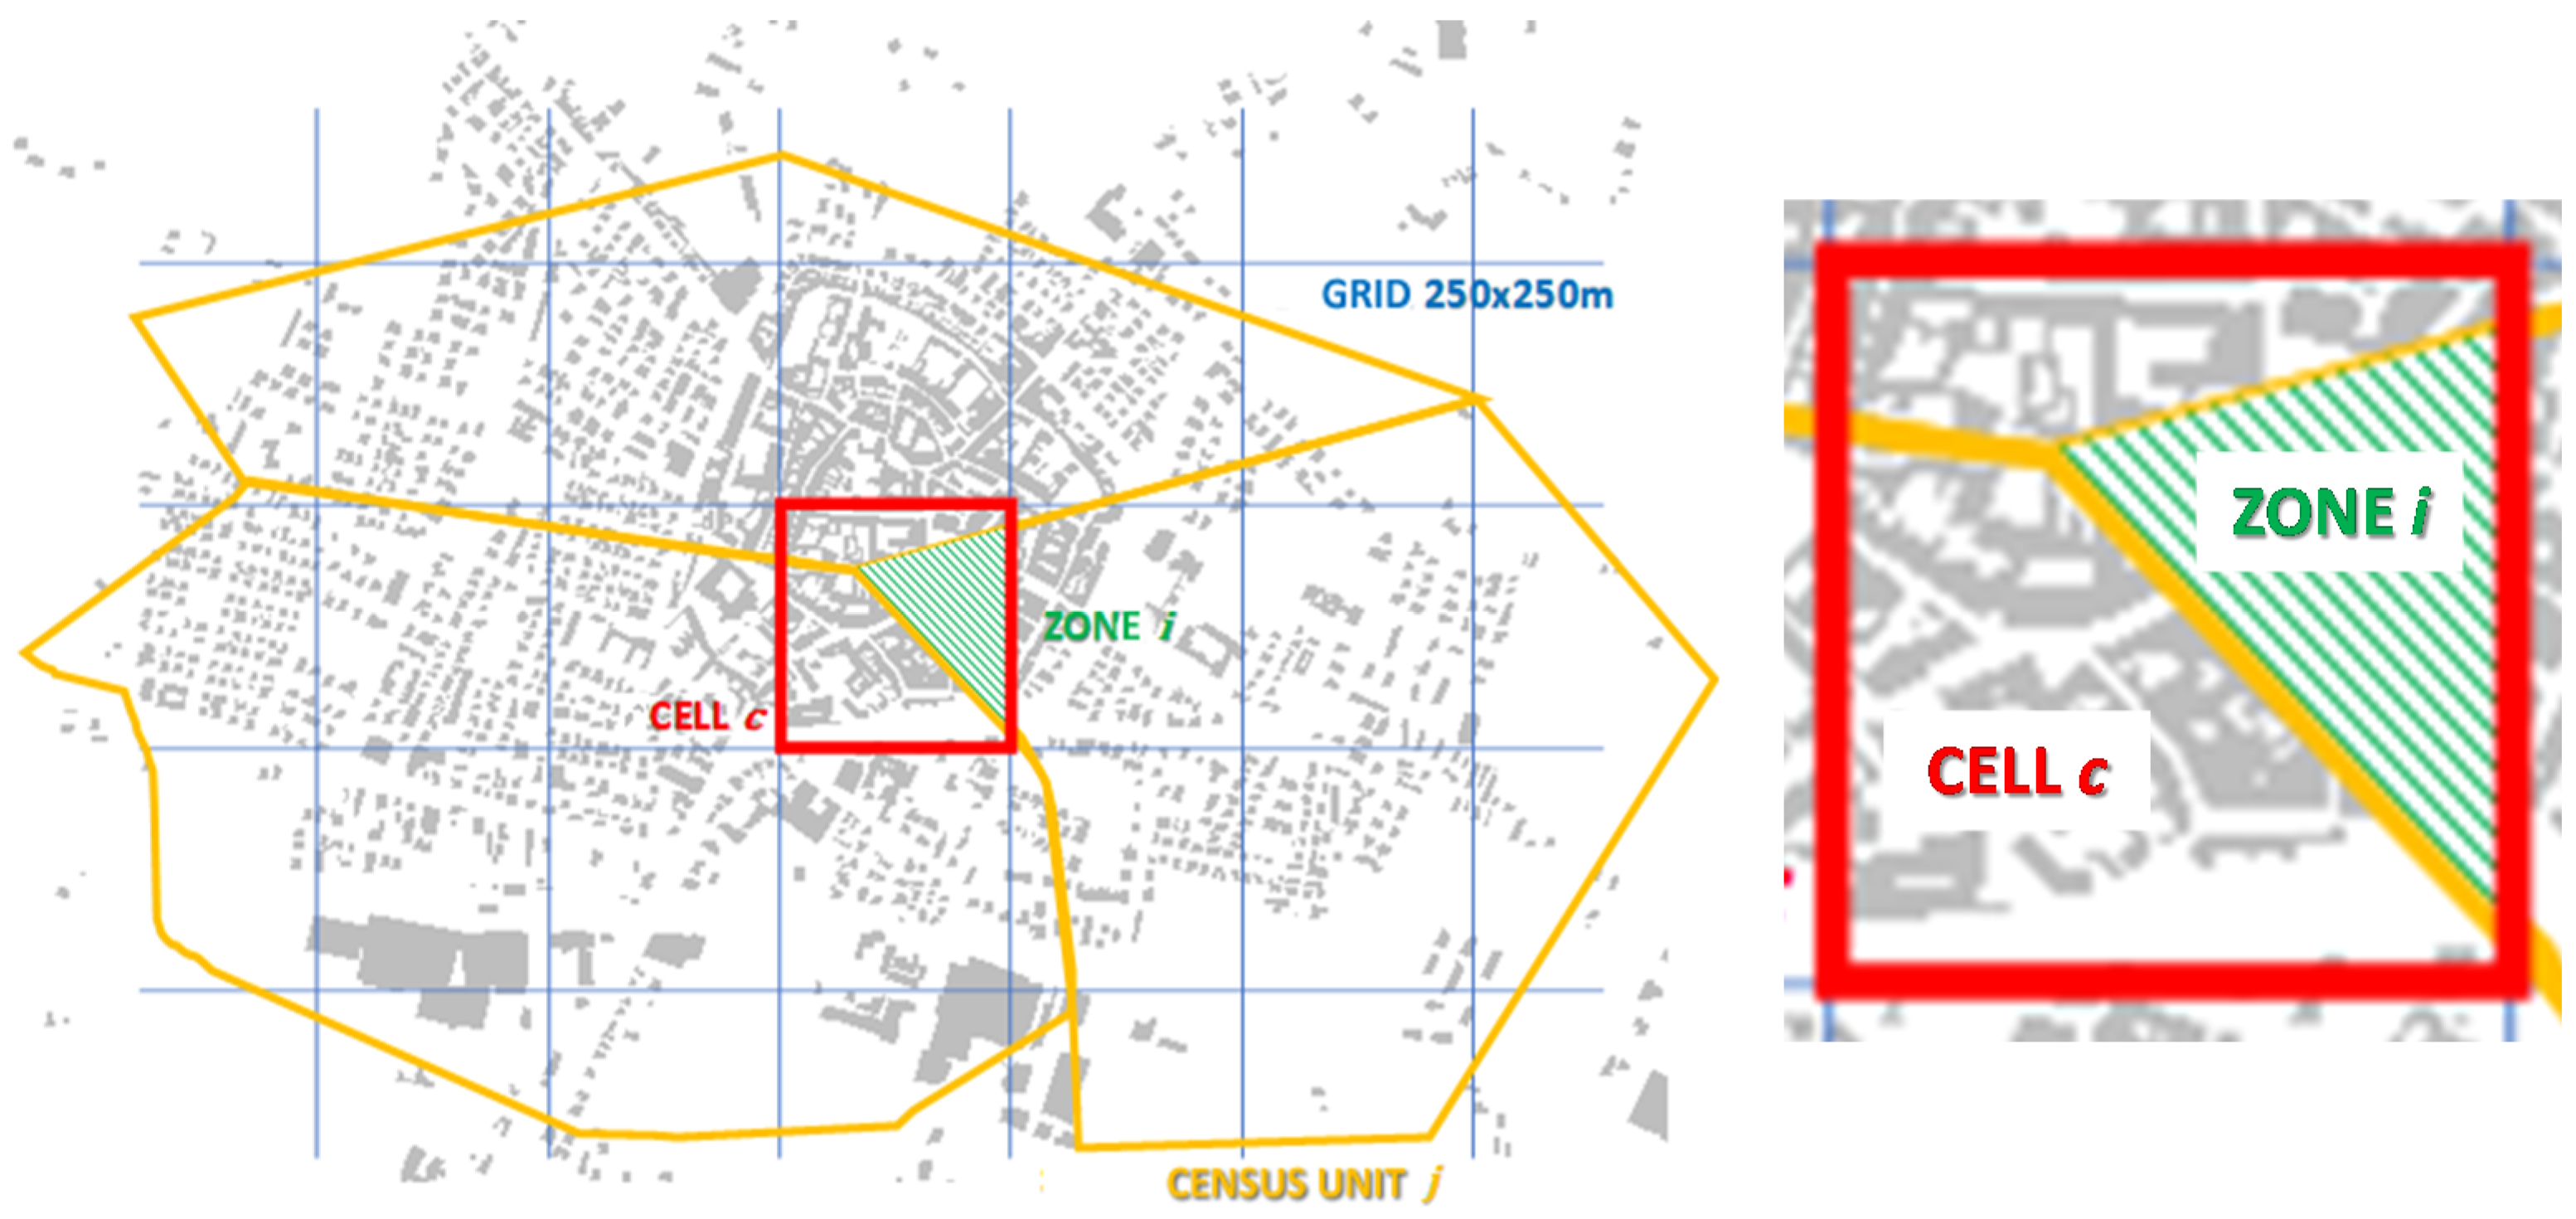
The distribution of vulnerability classes (exposure) is defined for each minimum reference unit of the model (250 × 250 m cell of a regular square-mesh). However, the ISTAT data on buildings refer to individual census sections, which may also contain a large number of cells, so a criterion for assigning census data to each cell was adopted, following relations (1) and (2), having defined ‘zones’ as the areas of intersection between census sections and the grid (
Figure 1).
The number of buildings in zone i of census section j of vulnerability class k are estimated as in the Equation (1); the number of buildings in cell c of vulnerability class k are obtained by the relation (2):
cell;
census section;
zone, intersection of the reference grid and census section;
vulnerability class (k = A, B, C, D);
number of zones constituting cell I;
number of buildings in census section j;
number of buildings of census section j; of vulnerability class k (BINC);
number of buildings of census section j; surveyed;
number of buildings in zone i of census section j; of vulnerability class k;
number of buildings detected of zone i of census section j; of vulnerability class k (S.A.V.E.);
number of undetected buildings of zone i of census section j; of vulnerability class k;
number of buildings in cell c of vulnerability class k.
Regarding the occupants’ exposure, the CAESAR II model considers the assumption that the population is uniformly distributed over the homes. The data collected by the PLINIVS Study Centre and processed with the SAVE method have allowed us to define a correlation between the number of houses present in a building and the vulnerability class to which the building belongs (
Table 1).
Therefore, the population distribution over the vulnerability classes is calculated as:
number of buildings of vulnerability class k;
average of dwellings for the buildings of vulnerability class k;
number of buildings of vulnerability class t;
average of dwellings for the buildings of vulnerability class t;
population indicated in the ISTAT data.
Finally, the average number of occupants in the seismic class k () of each cell in the reference grid varied was evaluated using the following Relation (4):
number of people per seismic class k, estimated cell by cell, based on ISTAT data;
average percentage of occupants, assumed to be 65% of the total population.
2.4. Vulnerability
A building’s vulnerability is the probability that the system (entire building), subsystems (walls, framing, roofs, etc.) or components of the system (beams, columns, infill panels, windows, doors, etc.) will be damaged as a result of an assigned action to which they are subjected. The concept of vulnerability requires the unambiguous definition of the level of ‘damageability’ of the exposed asset due to the natural event. The damage scale adopted in CAESAR II refers to the six levels of damage of the following: D0: no damage; D1: no structural damage; D2: light structural damage; D3: structural damage; D4: partial collapse; D5: total collapse.
The propensity of a building to sustain damage is a function of its constituent elements. The strength, ductility and technological aspects of structural (walls, beams, columns, floors, roofs, etc.) and non-structural (infill panels, openings, protective panels, etc.) elements strongly influence the vulnerability of the building itself [
26,
27].
The vulnerability of a building to an earthquake can be assessed through the so-called fragility curves. For an assigned class of vulnerability, they express the probability of exceeding a certain level of damage as the hazard measurement parameter varies, which may be the peak seismic acceleration, spectral intensity, macroseismic intensity, etc. [
28,
29,
30].
CAESAR II uses the model of fragility curves for ordinary buildings. These curves have been calibrated on data from damage probability matrices produced through a statistical analysis of the observed damages following earthquakes that have occurred in Italy since 1980 and have been converted to PGAs via Margottini’s law [
31]. The mean and standard deviation parameters of the fragility curves are shown in
Table 2.
The vulnerability of the population to the earthquake is determined with reference to the damage suffered by the buildings occupied by the people. In
Table 3, the percentages of dead Q
D and injured Q
I are reported as a function of the building’s level of damage. The values shown were calibrated based on data collected from past earthquake events [
7].
Finally, the model adopted in CAESAR II allows to estimate the effects of risk related to the chosen reference period. The model discretizes the territory through a square mesh of size 250 × 250 m. To each cell is assigned: hazard data, in terms of PGA, and exposure data, in terms of the number of buildings for each structural vulnerability class and the number of occupants. Combining these data with seismic vulnerability (percentiles 16, 50 and 84%), the model yields the following products on a cell-by-cell basis:
Number of collapsed buildings, as the sum of buildings with D4 and D5 damage;
Number of unsafe buildings, as the sum of buildings with D4 and D5 damage and 60% of buildings with D3 damage;
Number of deaths and injuries , as assessed through the Equations (5) and (6);
Number of homeless assessed through the relation (7):
seismic class of the building (A, B, C, D);
damage level of the building (D1, D2, D3, D4, D5);
number of buildings, per cell, of seismic class t having damage level j;
average number of occupants per building of seismic class t;
tourism index of the city (0–100%);
percentage of deaths per seismic class t and damage level j;
percent injured per seismic class t and damage level j:
number of buildings, per cell, of seismic class t having damage level D3;
number of buildings, per cell, of seismic class t having damage level D4;
number of buildings, per cell, of seismic class t having damage level D5.
3. Cost-Benefit Model
The private operator decides on the realization of a specific investment only based on its profit, that is, considering the difference between the cost of the mitigation investment and the benefits (avoided costs) achievable over time.
The public operator must also consider the costs and benefits that arise as a consequence of the construction of the work towards the environment and the community.
In this perspective, CAESAR II provides a Cost Benefit Analysis model useful for the decision maker for evaluating the convenience of possible large-scale seismic mitigation interventions (in terms of reducing the seismic and energetic vulnerability of buildings).
The cost-benefit analysis is an economic analysis, which takes into consideration only those costs and benefits that, directly or indirectly, can be expressed through monetary values. In CAESAR II, only direct cost items are considered, that is, directly related to the damage caused by the event. Indirect cost components, such as productivity losses, etc., are not considered [
13,
14].
With reference to a predetermined ‘payback period’ (up 50 years) and a period of occurrence of an assigned seismic event, CAESAR II allows users to compare four different hypotheses of impact scenarios: the ‘non-mitigated’ scenario, characterized by a seismic event that occurs on the building’s settlements at present, and three different ‘mitigated’ scenarios that foresee the improvement of seismic and energy vulnerability.
CAESAR II considers two possible decision makers with different perspectives: ‘government’ and ‘citizens’. The assumed costs and the benefits are indicated in
Table 4.
The direct costs, connected to protection, improvement and structural seismic adaptation to reduce the general vulnerability of ordinary buildings, are the following. The model implemented in CAESAR II only considers mitigation hypotheses relating to the building. Hypotheses of the displacement of the population are not evaluated. All the parametric costs indicated have been elaborated based on the data provided by the Italian Civil Protection Department, relating to the seismic emergency in L’Aquila in 2009.
Table 5 shows the average cost of mitigation interventions: from a seismic vulnerability class (A–D) to another (EUR/m
2) and concerning the retrofitting interventions of two different levels: “Energy 1” (consisting in thermal plaster application, glazing system substitution, roof insulation) and “Energy 2” (consisting in external insulation application, glazing system substitution, roof insulator, HVAC system substitution).
The evaluation of energy consumption reduction that is achievable by applying retrofitting interventions has been carried out through simulations with dedicated energy analysis software on two sub-sets of building samples related to masonry and reinforced concrete structures, considering the recurring building typologies, construction technologies and dimensional ratios available from the building inventory database. Parametric cost data have been modelled for each of the different vulnerability classes identified by the simulation model, as an average of the diverse construction and typo-morphological features identified for each class, including the structure and walls, roof system and windows.
Reconstruction costs (RC) related to reconstruction, on-site or in a new different location, involving buildings irreversibly damaged by the earthquake (damage level D4–D5 under the EMS’98 classification). They are valuable by Equation (9):
average area of the i-th damage level building to be rebuilt on-site;
reconstruction cost for a residential building on site (1235.94 EUR/m2);
number of i-th damage level buildings to be rebuilt, delocalized;
average area of the i-th damage level building to be rebuilt, delocalized;
reconstruction cost for a residential building, delocalized (1.250 EUR/m2).
Restoration costs (RT) connected to the activities planned for recovery buildings and infrastructures damaged in a non-irreversible way by the earthquake (damage level D1–D2–D3 under the EMS’98 classification), valuable by Equation (10):
number of i-th damage level buildings to be restored;
average area of the i-th damage level building to be restored;
restoration cost for a residential building as a function of damage level ( = 360 EUR/m2; = 458 EUR/m2; = 545 EUR/m2).
Demolition and rubble removal (DR) concerning lost buildings and the management cost for specialized landfills. They are valuable by Equation (11):
number of i-th damage level buildings to be demolished;
average volume of the i-th damage level building to be demolished;
demolition cost for a lost building as a function of vulnerability class ( = 12 EUR/m3; = 14 EUR/m3; = 16 EUR/m3);
cost of rubble transportation to the landfill (0.6 EUR/m);
average site distance from the landfill (300 m);
average landfill management cost (1.4682 EUR/m2).
Health care costs (HT) associated with safeguarding the population affected by the earthquake (medical equipment, strengthening existing local public facilities, physical and psychological support). These costs can be calculated as in Equation (12):
number of people in need of medical care;
unit cost of medical care operations (200 EUR);
average time for medical care (10 days).
Evacuation costs (EV) of the population calculates split up according to the destination and the means of transport employed. They are valuable by Equation (13):
number of homeless people with no vehicle;
total cost of public transport (15,599 EUR);
cost of checkpoints set-up (7050 EUR);
total number of homeless people;
number of homeless people evacuated at checkpoints;
daily cost of checkpoints staff (5930 EUR);
checkpoints’ time usage;
unit cost of the emergency kit (10 EUR);
daily depreciation cost per tent set up (20.55 EUR);
number of homeless people evacuated in tents;
average number of people for each tent set up;
daily cost for the stay in the hotel (45 EUR);
number of homeless people accommodated in hotels;
daily cost for accommodation in the tent;
number of homeless people placed in tents.
Emergency management costs (EM) concerning the activities following an earthquake, which includes the construction of operational structures and the deployment of vehicles and employees to prepare equipped areas. They are valuable by Equation (14):
average daily presence of Department of Italian Civil Protection staff;
unit cost for coordination centre setup (3000 EUR);
cost of communication networks and IT services (about 2,000,000 EUR);
cost for daily presence of Department of Italian Civil Protection staff (126.18 EUR/day);
presence of the Department of Italian Civil Protection staff;
cost for daily presence of operating structures staff (130 EUR/day);
presence of operating structures staff;
cost for daily presence of operating structures means of transport (20 EUR/day);
presence of operating structures means of transport;
cost for daily presence of volunteer staff (100 EUR/day);
presence of volunteer staff.
The ‘benefits’ assumed in the model are as follows:
Direct costs reduction due to mitigation (CR). The overall benefit deriving from the mitigation action adopted is equal to the difference of damage for each ‘mitigated’ scenarios compared to the ‘non mitigated’ scenario, appropriately discounted at time t0 (of realization of the mitigation investment) and taking into account the value of the money over time through the Equation (15):
Seismic and Energy Tax incentives(TAX). The model considers possible state fiscal incentives in favour of citizens for the implementation of structural and energy improvements, discounted value in accordance with Equation (15). With reference to the current Italian legislation, for the mitigation interventions, the following parameters are assumed: (1) a maximum threshold per dwelling within which it is possible to take advantage of tax incentives, equal to EUR 96,000; (2) a percentage of tax incentive, which can be modified by the user, assumed equal 100% in the case study illustrated below.
Reduction of energy consumption(EC). The choices for the possible level of improvement of the building’s energy class lead to energy savings, which are estimated in annual average terms for the number of buildings involved in the improvement, as indicated in Equation (16) and the discounted value in accordance with Equation (15), on the basis of the analysis of the prices of the interventions carried out in Italy. In function of retrofitting interventions level, the following reduction of energy consumption are assumed: 25% for Energy 1 and 50% for Energy 2. Equation (16) is calculated as follows:
thermal consumption of oil (11.5 kWh·m3);
oil price (0.90 EUR/m3);
yearly thermal consumption of energy for j-th vulnerability class (A: 200 kWh/m2; B: 180 kWh/m2; C: 150 kWh/m2; D: 120 kWh/m2);
average area of the j-th vulnerability class of buildings to be mitigated.
4. Multi-Criteria Analysis Model
In the framework of decision-making processes aiming to reduce the seismic risk, the number of alternatives and variables involved are high, and each of them leads to a result that does not necessarily coincide with that produced by the others, making it extremely difficult to identify an alternative that is absolutely the best in relation to each criterion considered. So, the approach provided by single-criterion linear optimization is too rigid and difficult to refer to a model that adequately represents the problem. For these reasons, in CAESAR II, a multi-criteria decision-making model is adopted with the aim to rationalize the decision-making process and to optimize a set of criteria weighted according to the decision makers’ preferences [
15,
16,
18]. This new kind of evaluation scheme identifies alternatives that satisfy a certain number of explicitly defined standards. It is possible to sort the elements of a
decision tree as:
Objectives: statements regarding the condition to achieve, made operational by allocating one or more qualitative and quantitative attributes;
Criteria: standards of judgment or rules useful to test the worth of decision alternatives, including both the concept of the goal and attributes;
Alternatives: elements of evaluation and choice that must be ordered based on dominance scores representing the entries of the decision matrix.
One of multi-criteria’s most powerful tool is undoubtedly the Analytic Hierarchy Process [
32]. Such a complex algorithm makes it possible to evaluate the priority of actions, programs, intervention strategies, plans and projects by applying mathematical concepts to decision making, as well as quantitative methodologies to evaluate mostly intangible and subjective judgments. They oppose the classic single-criterion linear analysis models suitable only to straightforward cases and under enough simplified hypotheses. The main advantage is now the flexibility in solving difficult problems by adopting a typical human mind’s cognitive model.
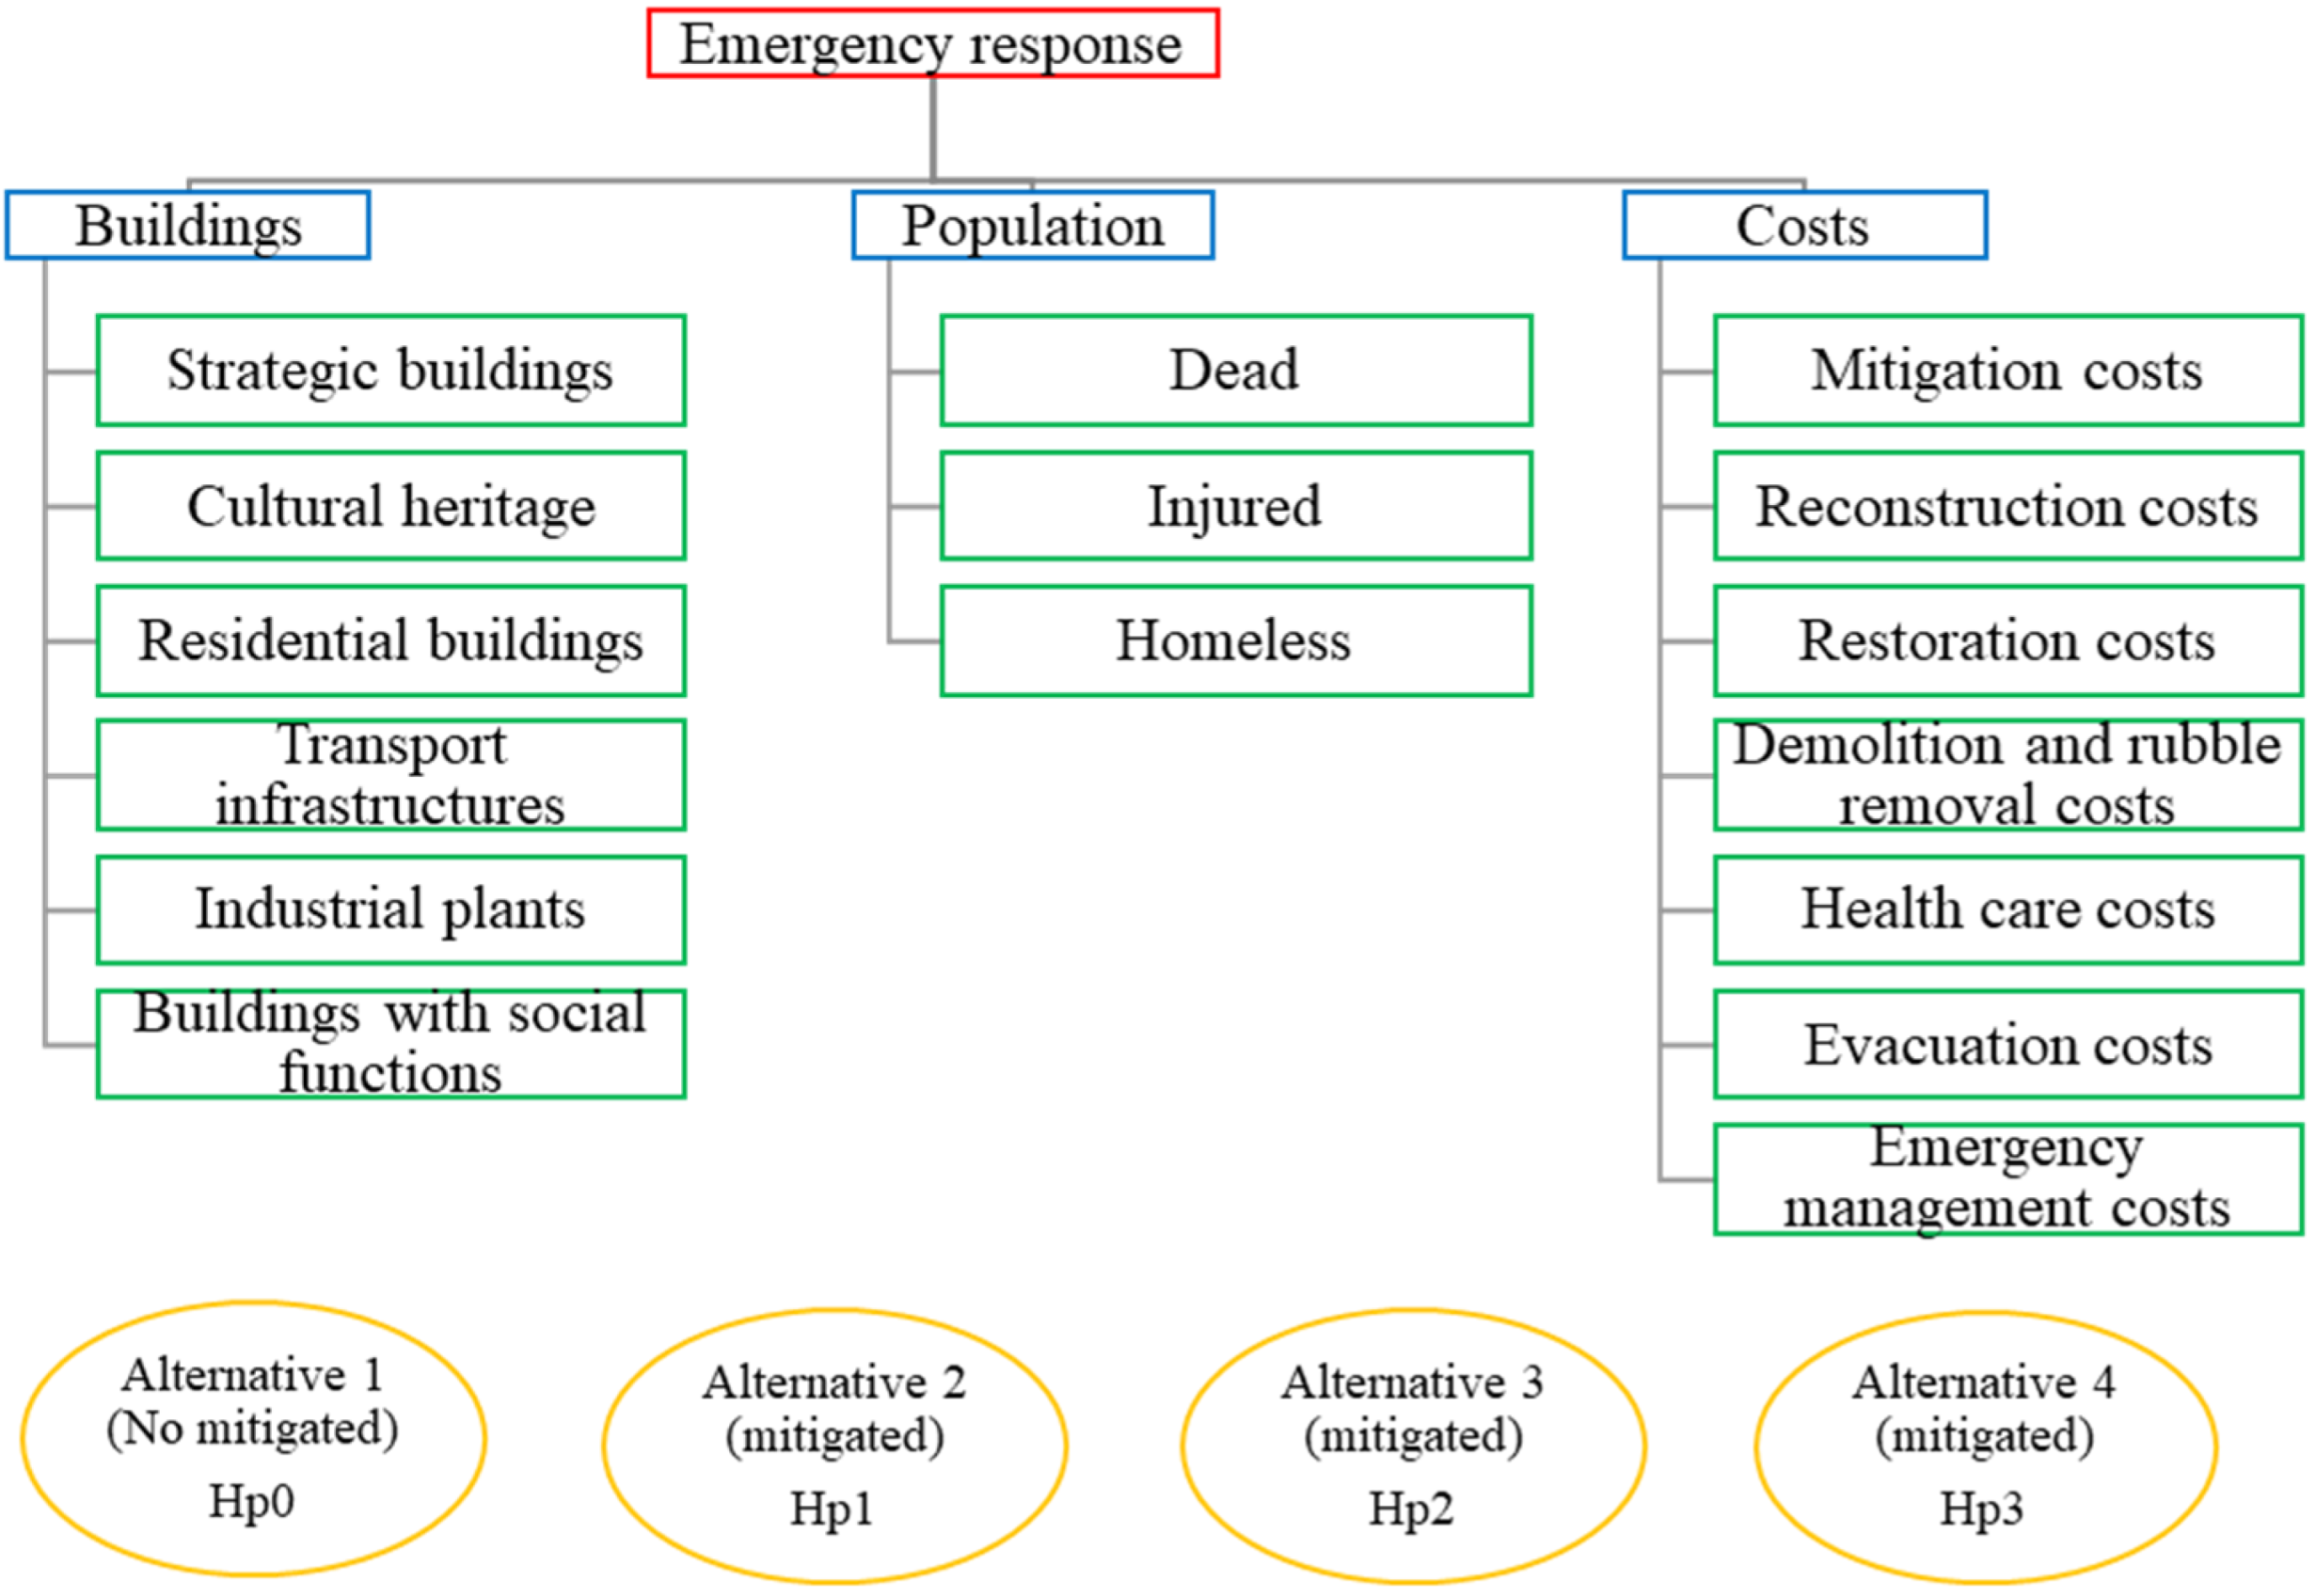
It is possible to obtain reliable scales by only using personal judgments, identifying all the single elements of a problem, placing them inside homogeneous sets and sorting each set at a different level. In hierarchies, intricate schemes are analysed from the top-down in their basics, simulating how the human brain analyses complexity and breaks down the objects perceived by the senses into categories and sub-categories, building a so-called dominance hierarchy (
Figure 2).
The first level contains the general objective, while the second level contains its further specifications. A possible third level can add more details to the upper level, and so on. Finally, alternatives are placed at the base of the dominance hierarchy. Once completed this initial phase, pairwise comparisons are performed for each element of a certain level, with reference to the element placed at that immediately higher. According to the hierarchy shown in
Figure 1, second-level criteria are pairwise compared with reference to the overall objective. Third-level sub-criteria are pairwise compared with reference to each second-level criterion until the alternatives are compared according to each third-level sub-criterion, each second-level criterion and, finally, the overall objective.
These operations provide a series of comparison coefficients placed into a so-called dominance matrix and a priority vector that measures all the alternatives’ relative reasonability. When the use of judgments is necessary, these can be expressed via the semantic scale of Saaty (
Table 6). Such a scheme links natural numbers to qualitative linguistic variables, making it possible to answer the crucial question behind all pairwise comparisons: “How much does an element dominate another with reference to a specific criterion or attribute?”
Denoting by
the number of criteria to be considered, the dominance matrix
, built by an individual decision-maker, will be square and symmetrical (17):
where
denotes the
k-th preference of the generic decision maker, referred to the
i-th criterion concerning the
j-th one. If there is more than one decision maker, the individual preferences are averaged and inserted into a new dominance matrix
A (18) as follows:
Following the Analytic Hierarchy Process, each criterion’s normalised weight
is calculated as in (19):
The eigenvalue for each row of the dominance matrix
is computed as in (20):
Thus, the maximum eigenvalue is calculated as in (21), which represents the limit value that
must take in order to calculate (22):
The following
consistency index measures the deviation of
from the coherence and allows the measurement of the overall difference between the two sets of values, namely as in (23):
The impossibility to make reliable judgments, lack of data and inexperience can drive inconsistency. However, it is crucial to establish its maximum admissible value to avoid completely erroneous data; thus, the consistency index is compared with an arbitrary
random index . The ratio between
and
provides the
consistency ratio as expressed in (24):
5. Cava De’ Tirreni Case Study
The CAESAR II model has been implemented in a reuse kit, available for all public administrations on the website
www.progettocaesar2.it, accessed on 22 August 2021.
It has been tested through an application to Cava de’ Tirreni municipality (Campania Region, Italy), characterized by a surface of 36.56 km2 and a number of inhabitants equal to 54,000.
The analysis developed concerns a ‘scenario analysis’ (see
Section 2), with reference a historical event, the 1980 Irpinia earthquake (Magnitude: 6.81; Depth: 12 km; Longitude: 40.842; Latitude: 15.283), and adopting, as an attenuation law, the relation of Blake [
21] and the conversion law determined by Faenza and Michelini [
22,
23] between the observed shaking parameters and the MCS intensity scale.
The buildings of the municipality have been analyzed through field surveys. The first phase of the analysis concerned a guided interview with a municipal technician, an expert of the area, for the compilation of an ad hoc form called CARTIS [
11] and the identification of sectors characterized by homogeneous building typologies. This allowed for a preliminary study useful for the subsequent carrying out of field surveys building by building, by compilation of a PLINIVS first-level form for 3130 ordinary buildings out of 4836 residential buildings (
Figure 3). Through the procedure illustrated in
Section 2, the CAESAR II tool furnished the distribution of the vulnerability classes (exposure) for each minimum reference unit of the model (250 × 250 m), combining the ISTAT data and the information coming from the data collection activity building by building, as shown in
Figure 4.
The scenario analyses have been replicated for four alternatives with reference to a ‘no mitigation’ case (Hp 0), characterized by the actual exposure (
Figure 3), and another three cases, with different mitigations strategies (Hp 1, Hp 2, Hp 3) able to improve the seismic and the energy behaviour (
Table 7).
The analyses have been developed assuming the ‘payback period’ and the period of occurrence of the assigned seismic event equal to 50 and 10 years, respectively. The interest rate is 7%.
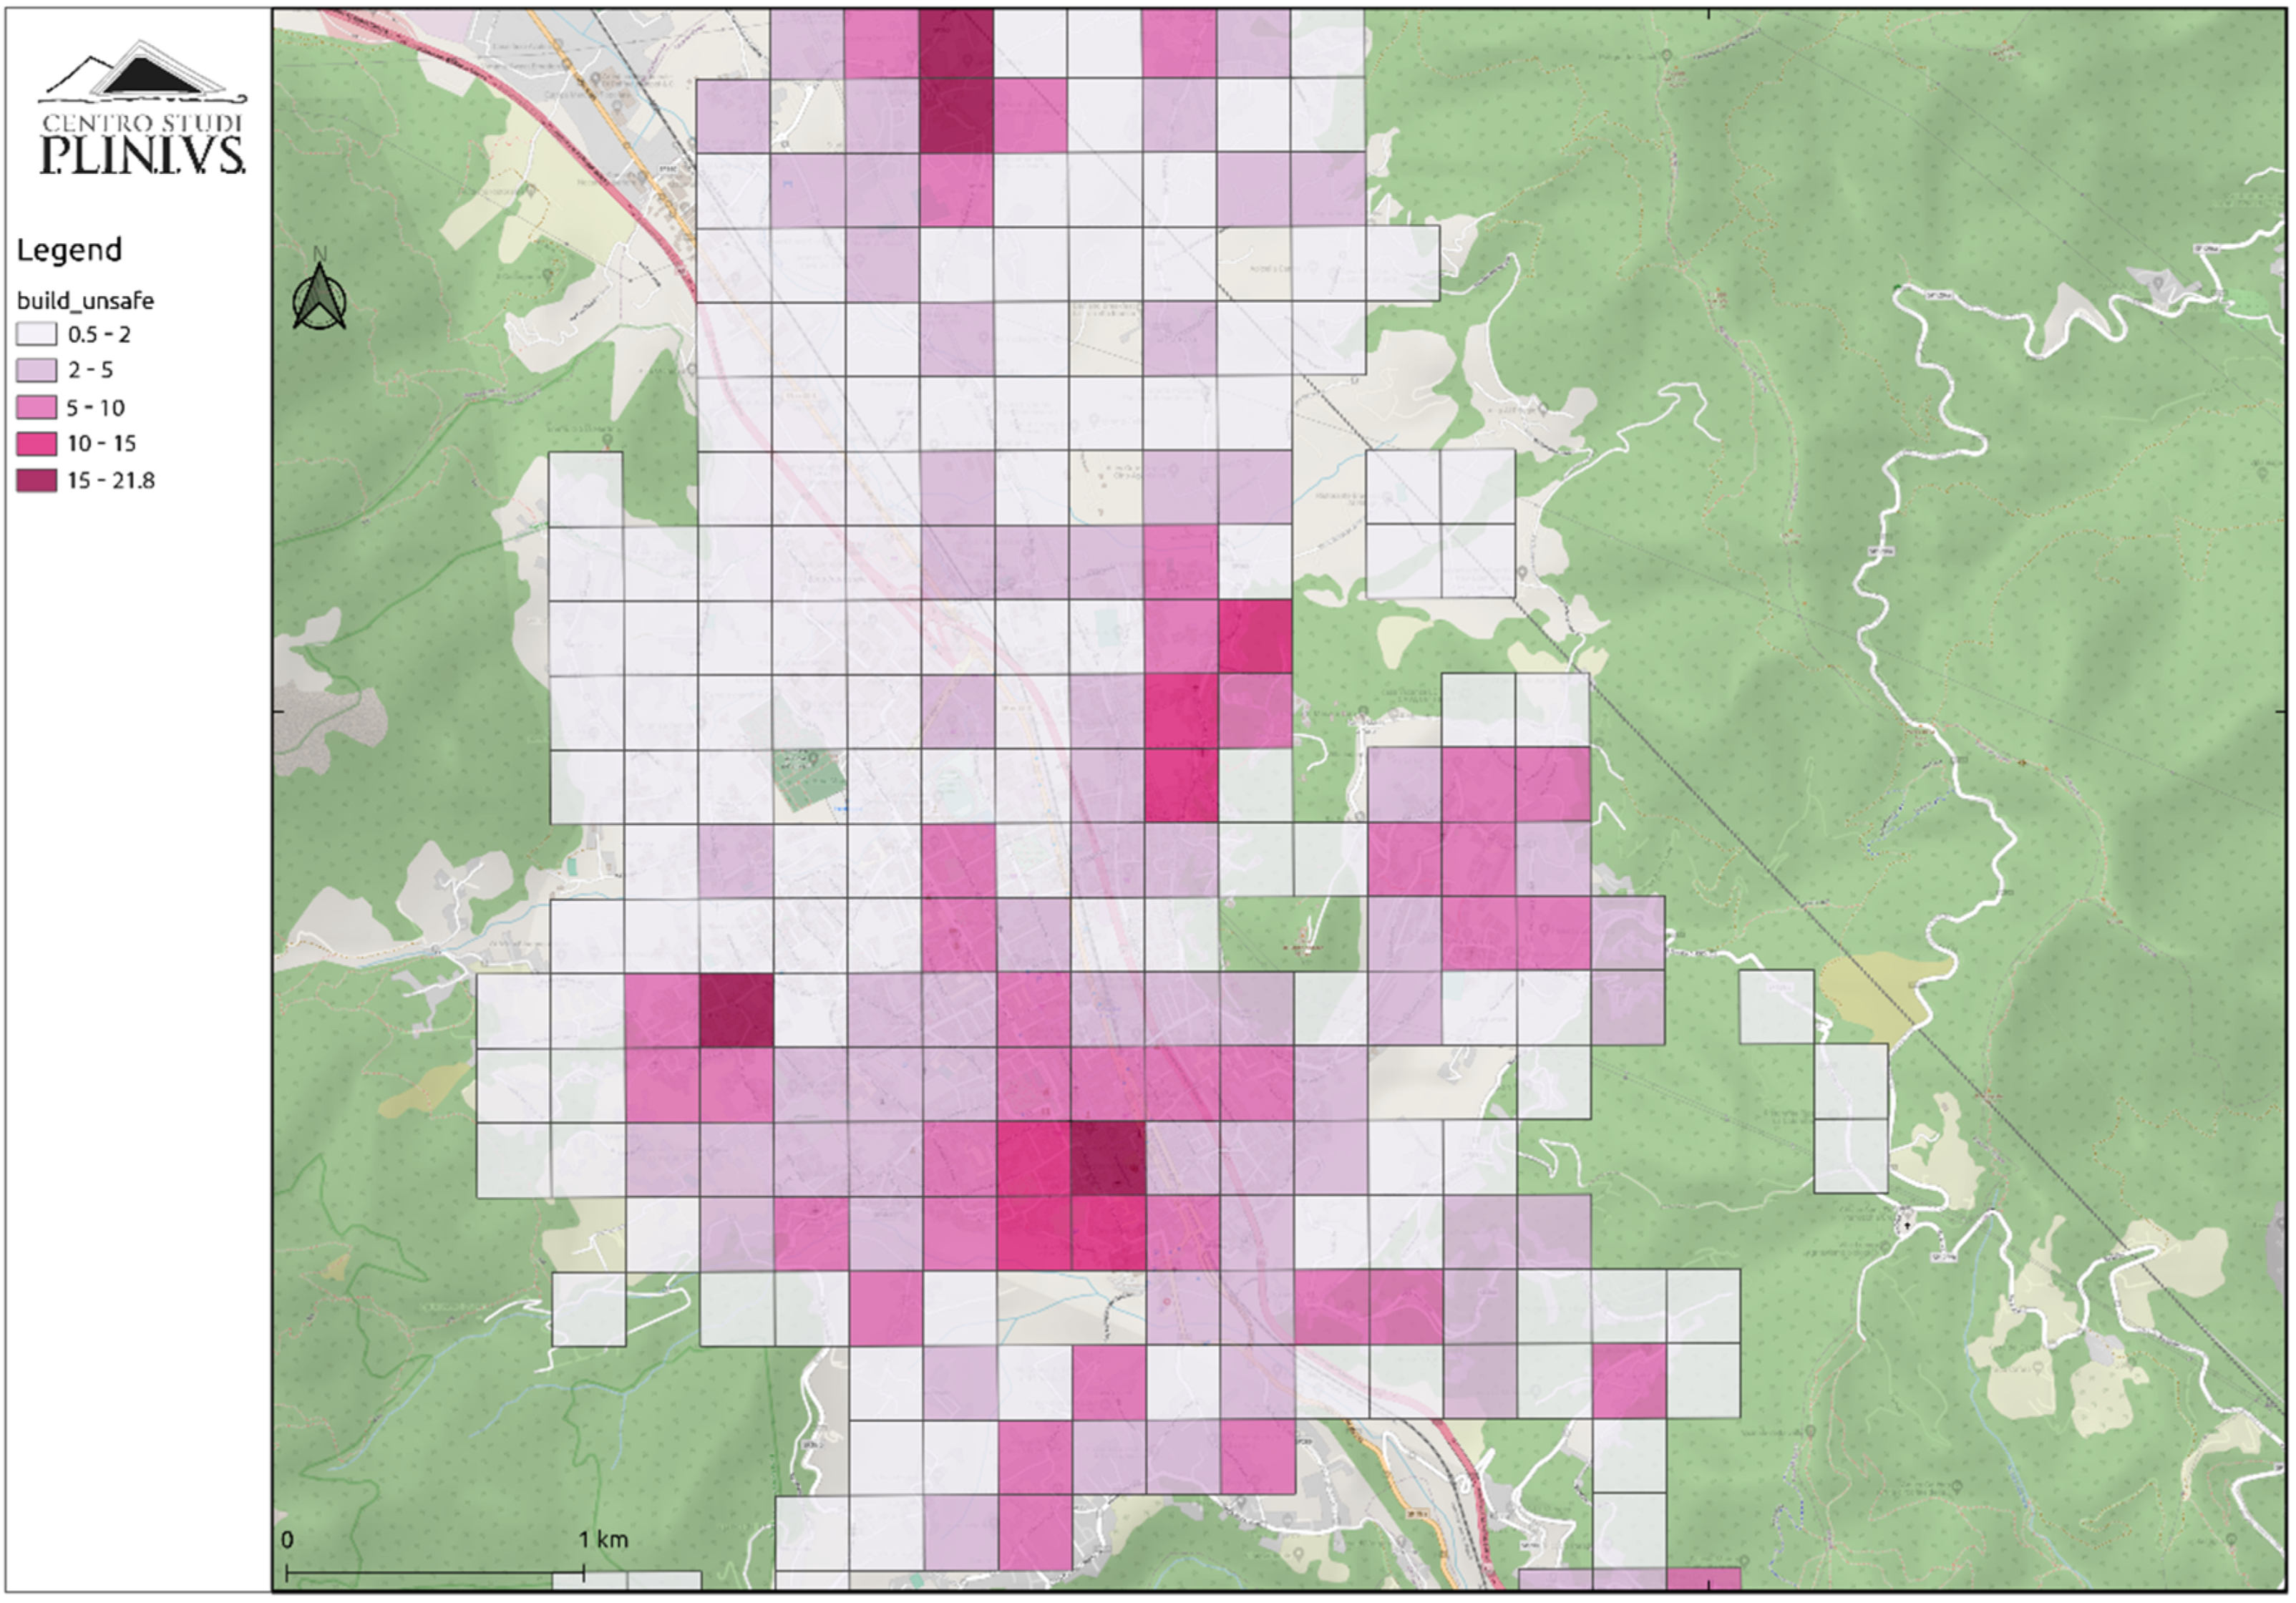
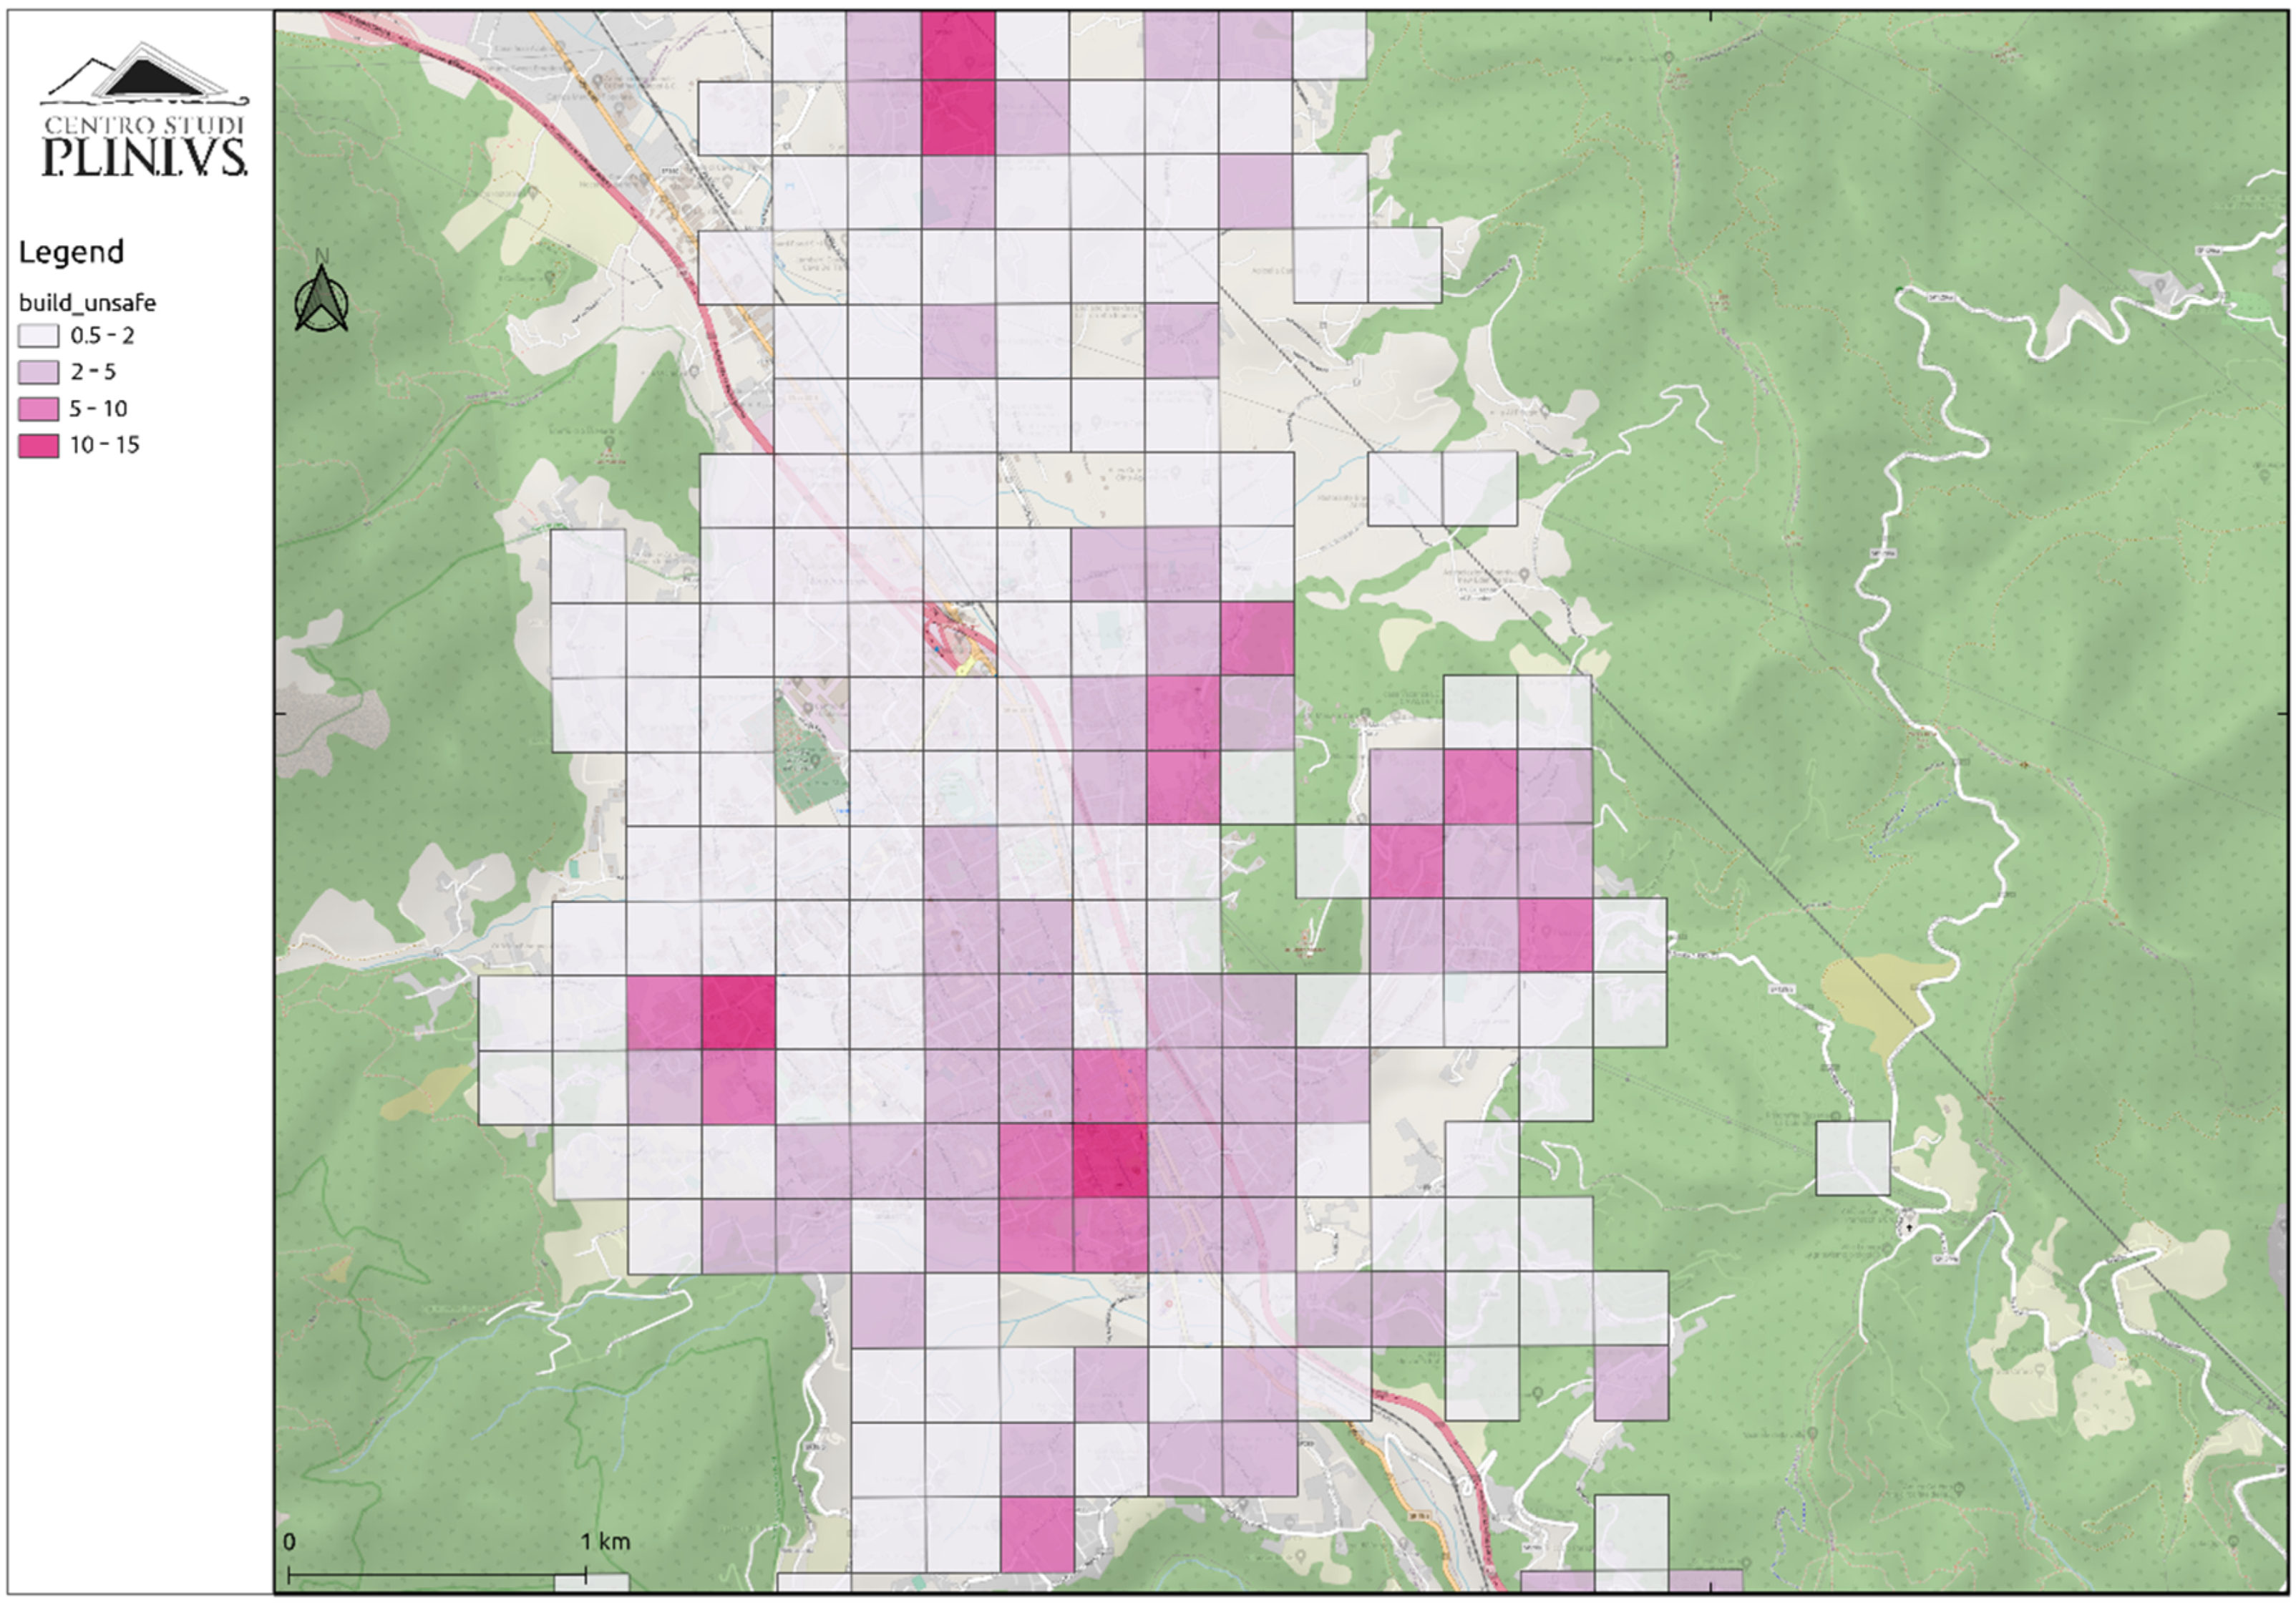
The outputs of the analyses developed by the CAESAR II tool are indicated in
Table 8 and shown in
Figure 5 and
Figure 6 with reference to the number of unsafe buildings for each cell, calculated for Hp 0 and Hp 3, respectively. The results show greater damage for the ‘not mitigated’ scenario (Hp 0) than the mitigated ones (Hp 1, Hp 2, Hp 3). The Hp 3 alternative is the one with the least damage, but also the one with the highest costs in terms of seismic mitigation. The Hp 2 alternative, on the other hand, is the one that presents the highest costs in terms of energy mitigation.
The different alternatives have been compared through the multi-criteria analysis model. Preliminarily, the decision maker of the municipal administration filled out a short questionnaire, which allowed the model to parameterize his preferences regarding binary comparisons between the criteria in
Figure 2. The results are shown in
Table 9. The decision maker assigned decreasing importance to the protection of human lives (77.6%), damage to buildings (15.3%) and increase in costs (7.1%). Consequently, the alternative that best meets the needs of the decision maker is Hp 3 (0302), followed by HP 2 (0301), Hp 1 (0300) and finally HP 0 (0096). Hence, the alternative with more effective seismic mitigation in terms of reducing damage to population and buildings is preferred.
6. Conclusions
CAESAR II is a decision support tool for local authorities, developed to improve the coordination capacity of the seismic emergency planning and management processes, as well as the allocation of resources intended for risk mitigation on buildings and infrastructures, also with the use of cost-benefit and multi-criteria analysis tools.
The project is aimed at overcoming the current fragmentation and excessive articulation of administrative skills and thus allowing for a better quality in the action of the Public Administration (PA). The main objective is that of governance that works in an organic way, systematizing all the actors involved, at all levels, in the implementation of public investment programs to act in a coordinated, more efficient, more effective way and to a better ability to carry out interventions aimed at achieving the expected results.
The Italian municipalities with CAESAR II have a new tool at their disposal capable of enabling them to access the most sophisticated technologies to analyze the seismic risk within their territory, with a detail on a neighborhood scale (side cell 250 × 250 m as the minimum unit of analysis). The main pilot municipality is Cava de‘ Tirreni, where the technicians in charge have cataloged about 3000 buildings in order to deepen their knowledge of the buildings on display and make the analysis of the CAESAR II model more reliable. The case study shows the incidence of large-scale seismic mitigation and energy improvement measures in decision-makers assessments. The multi-criteria analysis associated with the hazard/impact assessment tool allows decision-makers to better understand the relationship between financial investments and potential benefits. The Cava de’ Tirreni case study shows how only a significant seismic improvement of building vulnerability (i.e., maximising the number of buildings brought to a D vulnerability class) can ensure an adequate reduction of expected impact on the population. On the other hand, energy improvements associated with seismic mitigation, while having a relevant financial impact on public and private stakeholders, result in shorter payback times for private households. The tool allows users to reflect on the optimal balance among available financial resources and targeted risk reduction objectives, as well as to properly justify to funding institutions the financial needs for seismic mitigation at a municipal level.
The future objective is the implementation of additional features, in order to permit the following: i) the improvement of the assessments of the seismic hazard (currently deduced from the official website of the INGV) at the base of the tool, thanks to the level I microzonation analysis; ii) the introduction of additional models aimed at assessing the impact on the territory due to other natural phenomena such as hydrogeological, volcanic or climate change events, with a view to digital, intelligent and multi-hazard resilience.
CAESAR II works on a grid that discretizes the entire national territory compatible with that introduced by the European Union, and this will allow it to, over time, form a large mosaic of the seismic risk and damage expected on a national scale with a detail never considered before, offering essential information for the planning and management of risks to the bodies in charge of supra-municipal governance.
Author Contributions
Conceptualization, G.Z., D.D.G. and M.F.L.; methodology, D.D.G., M.F.L. and F.L.P.; software, S.N.; validation, D.D.G., M.F.L., S.S. and F.L.P.; formal analysis, D.D.G., M.F.L. and F.L.P.; investigation, S.N and F.L.P.; resources, G.Z.; data curation, S.N.; writing—original draft preparation, D.D.G. and F.L.P.; writing—review and editing, D.D.G., M.F.L. and S.S.; visualization, D.D.G. and M.F.L.; supervision, G.Z.; project administration, G.Z.; funding acquisition, G.Z. All authors have read and agreed to the published version of the manuscript.
Funding
This research (CAESAR II Tool, ‘Complementary Analyses for Emergency Planning Based on Seismic Risks Impact Evaluations’) was co-funded by Made with the co-financing of the European Union in National Operational Governance Program and Institutional Capacity 2014–2020-FSE/FESR, through the Agency for Territorial Cohesion, as an intervention aimed at the transfer, evolution and dissemination of best practices among Public Administrations. Cup: J76E18000110006, Local Code: ID-49 – SI_1_604D.
Institutional Review Board Statement
Not applicable.
Informed Consent Statement
Not applicable.
Data Availability Statement
Not applicable.
Conflicts of Interest
The authors declare no conflict of interest. The funders had no role in the design of the study; in the collection, analyses, or interpretation of data; in the writing of the manuscript, or in the decision to publish the results.
References
- Da Porto, F.; Donà, M.; Rosti, A.; Rota, M.; Lagomarsino, S.; Cattari, S.; Borzi, B.; Onida, M.; De Gregorio, D.; Perelli, F.L.; et al. Comparative analysis of the fragility curves for Italian residential masonry and RC buildings. Bull. Earthq. Eng. 2021, 19, 3209–3252. [Google Scholar] [CrossRef]
- Zuccaro, G.; Perelli, F.L.; De Gregorio, D.; Cacace, F. Empirical vulnerability curves for Italian mansory buildings: Evolution of vulnerability model from the DPM to curves as a function of acceleration. Bull. Earthq. Eng. 2021, 19, 3077–3097. [Google Scholar] [CrossRef]
- Perelli, F.L.; De Gregorio, D.; Cacace, F.; Zuccaro, G. Empirical vulnerability curves for Italian masonry buildings. In Proceedings of the 7th International Conference on Computational Methods in Structural Dynamics and Earthquake Engineering (COMPDYN 2019), Crete Island, Greece, 25–27 May 2019; Volume 1, pp. 1745–1758. Available online: https://2019.compdyn.org (accessed on 22 August 2021).
- Zuccaro, G.; Albanese, V.; Cacace, F.; Mercuri, C.; Papa, F.; Pizza, A.G.; Sergio, S.; Severino, M.; Santini, A.; Moraci, N. Seismic vulnerability evaluations within the structural and functional survey activities of the com bases in Italy. AIP Conf. Proc. 2008, 1020, 1665–1674. [Google Scholar]
- Lagomarsino, S.; Cattari, S.; Ottonelli, D. The heuristic vulnerability model: Fragility curves for masonry buildings. Bull. Earthq. Eng. 2021, 19, 3129–3163. [Google Scholar] [CrossRef]
- Zuccaro, G.; Dato, F.; Cacace, F.; De Gregorio, D.; Sessa, S. Seismic collapse mechanisms analyses and masonry structures typologies: A possible correlation. Ing. Sismica 2017, 34, 121–149. [Google Scholar]
- Zuccaro, G.; Cacace, F. Seismic casualty evaluation: The Italian model, an application to the l’aquila 2009 event. In Human Casualties in Earthquakes; Springer: Berlin/Heidelberg, Germany, 2011; pp. 171–184. [Google Scholar]
- Uva, G.; Sanjust, C.A.; Casolo, S.; Mezzina, M. The ANTAEUS project for the regional vulnerability assessment of the current building stock in historical centres. Int. J. Arch. Heritage 2014, 10, 20–43. [Google Scholar] [CrossRef]
- Sessa, S.; Marmo, F.; Vaiana, N.; Rosati, L. Probabilistic assessment of axial force—biaxial bending capacity domains of reinforced concrete sections. Meccanica 2019, 54, 1451–1469. [Google Scholar] [CrossRef]
- Sessa, S.; D’Urso, M. Employment of Bayesian networks for risk assessment of excavation processes in dense urban areas. In Safety, Reliability, Risk and Life-Cycle Performance of Structures and Infrastructures; Informa UK Limited: London, UK, 2014; pp. 3163–3169. [Google Scholar]
- Zuccaro, G.; Dolce, M.; De Gregorio, D.; Speranza, E.; Moroni, C. The CARTIS form for the typological-structural characterization of urban compartments made up of ordinary buildings. Exposure assessment in seismic risk analysis In Proceeding of the 34 GNGTS Conference, Trieste, Italy, 17–19 November 2015; pp. 281–287. (In Italian). [Google Scholar]
- Cacace, F.; Zuccaro, G.; De Gregorio, D.; Perelli, F.L. Building inventory at national scale by evaluation of seismic vulnerability classes distribution based on census data analysis: BINC procedure. Int. J. Disaster Risk Reduct. 2018, 28, 384–393. [Google Scholar] [CrossRef]
- Zuccaro, G.; Leone, M.F.; Del Cogliano, D.; Sgroi, A. Economic impact of explosive volcanic eruptions: A simulation-based assessment model applied to Campania region volcanoes. J. Volcanol. Geotherm. Res. 2013, 266, 1–15. [Google Scholar] [CrossRef]
- Leone, M.F.; Zuccaro, G. Seismic and energy retrofitting of residential buildings: A simulation-based approach. UPLanD J. Urban Plan. Landsc. Environ. Des. 2016, 1, 11–25. [Google Scholar]
- Leake, C.; Malczewski, J. GIS and multicriteria decision analysis. J. Oper. Res. Soc. 2000, 51, 247. [Google Scholar] [CrossRef]
- D’Urso, M.G.; Masi, D.; Zuccaro, G.; Gregorio, D. Multicriteria fuzzy analysis for a GIS-based management of earthquake scenarios. Comput. Civ. Infrastruct. Eng. 2017, 33, 165–179. [Google Scholar] [CrossRef]
- Formisano, A.; Castaldo, C.; Chiumiento, G. Optimal seismic upgrading of a reinforced concrete school building with metal-based devices using an efficient multi-criteria decision-making method. Struct. Infrastruct. Eng. 2017, 13, 1373–1389. [Google Scholar] [CrossRef]
- Caroleo, B.; Palumbo, E.; Osella, M.; Lotito, A.; Rizzo, G.; Ferro, E.; Attanasio, A.; Chiusano, S.; Zuccaro, G.; Leone, M.; et al. A knowledge-based multi-criteria decision support system encompassing cascading effects for disaster management. Int. J. Inf. Technol. Decis. Mak. 2018, 17, 1469–1498. [Google Scholar] [CrossRef]
- Caterino, N.; Nuzzo, I.; Ianniello, A.; Varchetta, G.; Cosenza, E. A BIM-based decision-making framework for optimal seismic retrofit of existing buildings. Eng. Struct. 2021, 242, 112544. [Google Scholar] [CrossRef]
- Borzi, B.; Onida, M.; Faravelli, M.; Polli, D.; Pagano, M.; Quaroni, D.; Cantoni, A.; Speranza, E.; Moroni, C. IRMA platform for the calculation of damages and risks of Italian residential buildings. Bull. Earthq. Eng. 2021, 19, 3033–3055. [Google Scholar] [CrossRef]
- Blake, A. On the estimation of focal depth from macroseismic data*. Bull. Seism. Soc. Am. 1941, 31, 225–231. [Google Scholar] [CrossRef]
- Faenza, L.; Michelini, A. Regression analysis of MCS intensity and ground motion spectral accelerations (SAs) in Italy. Geophys. J. Int. 2011, 186, 1415–1430. [Google Scholar] [CrossRef] [Green Version]
- Faenza, L.; Michelini, A. Regression analysis of MCS intensity and ground motion parameters in Italy and its application in ShakeMap. Geophys. J. Int. 2010, 180, 1138–1152. [Google Scholar] [CrossRef] [Green Version]
- ISTAT. 14th General Population and Housing Census 2001. Available online: http://dawinci.istat.it (accessed on 22 August 2021).
- Zuccaro, G.; Cacace, F. Seismic vulnerability assessment based on typological characteristics. The first level procedure “SAVE”. Soil Dyn. Earthq. Eng. 2015, 69, 262–269. [Google Scholar] [CrossRef]
- Zuccaro, G.; De Gregorio, D. Time and space dependency in impact damage evaluation of a sub-Plinian eruption at Mount Vesuvius. Nat. Hazards 2013, 68, 1399–1423. [Google Scholar] [CrossRef]
- Sessa, S.; Marmo, F.; Rosati, L.; Leonetti, L.; Garcea, G.; Casciaro, R. Evaluation of the capacity surfaces of reinforced concrete sections: Eurocode versus a plasticity-based approach. Meccanica 2018, 53, 1493–1512. [Google Scholar] [CrossRef]
- Fragility and Vulnerability Assessment Guide. Available online: https://gpss.worldbank.org/sites/gpss/files/2019-10/Fragility%20and%20Vulnerability%20Assessment%20Guide.pdf (accessed on 22 August 2021).
- Pan, Y.; Ventura, C.E.; Tannert, T. Damage index fragility assessment of low-rise light-frame wood buildings under long duration subduction earthquakes. Struct. Saf. 2020, 84, 101940. [Google Scholar] [CrossRef]
- Hoult, R.; Goldsworthy, H.; Lumantarna, E. Fragility functions for RC shear wall buildings in Australia. Earthq. Spectra 2019, 35, 333–360. [Google Scholar] [CrossRef]
- Margottini, C.; Molin, D.; Serva, L. Intensity versus ground motion: A new approach using Italian data. Eng. Geol. 1992, 33, 45–58. [Google Scholar] [CrossRef]
- Saaty, T.L. The Analytic Hierarchy Process: Planning, Priority Setting, Resource Allocation; McGraw-Hill: New York, NY, USA, 1980. [Google Scholar]
Figure 1.
Illustrative representation of the ‘zones’ (green), defined as the areas of intersection between the ISTAT census sections (yellow) and the 250 × 250 m cells (red) of the model’s reference grid (blue).
Figure 1.
Illustrative representation of the ‘zones’ (green), defined as the areas of intersection between the ISTAT census sections (yellow) and the 250 × 250 m cells (red) of the model’s reference grid (blue).
Figure 2.
The dominance hierarchy.
Figure 2.
The dominance hierarchy.
Figure 3.
Residential buildings (blue) in Cava de’ Tirreni Municipality (Hp 0).
Figure 3.
Residential buildings (blue) in Cava de’ Tirreni Municipality (Hp 0).
Figure 4.
Map developed by CAESAR II tool: for each cell, the distribution of seismic vulnerability classes and number of buildings (Hp 0).
Figure 4.
Map developed by CAESAR II tool: for each cell, the distribution of seismic vulnerability classes and number of buildings (Hp 0).
Figure 5.
Map developed by CAESAR II tool: for each cell, number of unsafe buildings for Hp 0.
Figure 5.
Map developed by CAESAR II tool: for each cell, number of unsafe buildings for Hp 0.
Figure 6.
Map developed by CAESAR II tool: for each cell, number of unsafe buildings for Hp 3.
Figure 6.
Map developed by CAESAR II tool: for each cell, number of unsafe buildings for Hp 3.
Table 1.
Average of dwellings for buildings for each vulnerability class (MAb).
Table 1.
Average of dwellings for buildings for each vulnerability class (MAb).
| Average of Dwellings | Vulnerability Class |
|---|
| A | B | C | D |
|---|
| MAb | 2.0 | 2.7 | 3.45 | 6.90 |
Table 2.
Logarithmic mean and logarithmic standard deviation of the fragility curves.
Table 2.
Logarithmic mean and logarithmic standard deviation of the fragility curves.
| Class | Percentile | D1 | D2 | D3 | D4 | D5 |
|---|
| μ | σ | μ | σ | μ | σ | μ | σ | μ | σ |
|---|
| A | 16% | −3.50 | 0.80 | −2.70 | 0.80 | −1.95 | 0.70 | −1.35 | 0.60 | −0.75 | 0.60 |
| A | 50% | −3.35 | 0.80 | −2.60 | 0.80 | −1.74 | 0.80 | −0.95 | 0.75 | −0.40 | 0.75 |
| A | 84% | −3.25 | 0.80 | −2.25 | 0.80 | −1.65 | 0.80 | −1.00 | 0.80 | −0.15 | 0.80 |
| B | 16% | −2.80 | 1.20 | −1.55 | 1.10 | −0.70 | 1.10 | 0.00 | 0.80 | 0.50 | 0.55 |
| B | 50% | −2.45 | 1.20 | −1.20 | 1,00 | −0.45 | 0.90 | 0.10 | 0.70 | 0.40 | 0.70 |
| B | 84% | −1.90 | 1.00 | −0.90 | 0.80 | −0.35 | 0.70 | 0.20 | 0.40 | 0.45 | 0.40 |
| C | 16% | −2.60 | 1.60 | −1.20 | 1.20 | −0.35 | 0.90 | 0.20 | 0.70 | 0.55 | 0.45 |
| C | 50% | −2.10 | 1.30 | −0.80 | 1.00 | −0.15 | 0.80 | 0.40 | 0.80 | 0.70 | 0.70 |
| C | 84% | −1.50 | 1.20 | −0.50 | 0.80 | −0.03 | 0.60 | 0.20 | 0.45 | 0.55 | 0.40 |
| D | 16% | −1.40 | 1.40 | −0.10 | 1.00 | 0.40 | 0.60 | 0.70 | 0.55 | 1.30 | 0.60 |
| D | 50% | −1.00 | 1.20 | 0.00 | 0.80 | 0.60 | 0.60 | 0.80 | 0.50 | 1.50 | 0.60 |
| D | 84% | −0.40 | 1.00 | 0.40 | 0.70 | 1.10 | 0.80 | 1.20 | 0.60 | 1.70 | 0.60 |
Table 3.
Percentage of death (QD) and injured (QI) regarding the levels of damage and vulnerability class.
Table 3.
Percentage of death (QD) and injured (QI) regarding the levels of damage and vulnerability class.
| QD, QI [%] | Level of Damage | Vulnerability Class |
|---|
| D0 | D1 | D2 | D3 | D4 | D5 |
|---|
| QD | 0 | 0 | 0 | 0 | 0.03 | 0.14 | A, B, C |
| QD | 0 | 0 | 0 | 0 | 0.06 | 0.28 | D |
| QI | 0 | 0 | 0 | 0 | 0.10 | 0.56 | A, B, C |
| QI | 0 | 0 | 0 | 0 | 0.12 | 0.42 | D |
Table 4.
Items of the cost-benefit analysis as a function of the decision maker.
Table 4.
Items of the cost-benefit analysis as a function of the decision maker.
| Costs | Benefits |
|---|
| Government | Citizens | Government | Citizens |
| Reconstructions costs | Mitigation costs | Impact costs reduction due to mitigation | Seismic and Energy Tax incentives |
| Restoration costs |
| Demolition and rubble removal |
| Health care costs | Reduction of energy consumption |
| Evacuation costs |
| Emergency costs |
Table 5.
Average cost of mitigation interventions (EUR/m2).
Table 5.
Average cost of mitigation interventions (EUR/m2).
| Class | B | C | D | Energy 1 | Energy 2 |
|---|
| A | 360 | 510 | 624 | 790 | 910 |
| B | – | 390 | 540 | 670 | 790 |
| C | – | – | 378 | 500 | 620 |
Table 6.
The semantic scale of Saaty.
Table 6.
The semantic scale of Saaty.
| Intensity of Dominance (aij) | Judgement |
|---|
| 1 | Equal importance |
| 3 | Weak predominance |
| 5 | Moderate predominance |
| 7 | Strong predominance |
| 9 | Absolute predominance |
| 2 | Intermediate values |
| 4 |
| 6 |
| 8 |
Table 7.
Alternatives assumed for Cava de’ Tirreni case study. The second column (‘Actual class’) indicates the current vulnerability classes. The following columns indicate the classes assumed for each mitigation hypothesis (Hp 1, Hp 2, Hp 3). For energy interventions, the following coding is assumed: 1—Energy 1, 2—Energy 2, NO—none.
| Actual Class | Class Assumed in the Alternative |
|---|
| B | C | D |
|---|
| SEISMIC | ENERGY | SEISMIC | ENERGY | SEISMIC | ENERGY |
|---|
| Hp 1 | A | 0 | NO | 25 | 1 | 0 | NO |
| B | – | – | 0 | NO | 25 | 1 |
| C | – | – | – | – | 0 | NO |
| D | – | – | – | – | – | – |
| Hp 2 | A | 50 | 1 | 0 | NO | 0 | NO |
| B | – | – | 50 | 1 | 0 | NO |
| C | – | – | – | – | 0 | NO |
| D | – | – | – | – | – | – |
| Hp 3 | A | 25 | 1 | 25 | 1 | 0 | NO |
| B | – | – | 0 | NO | 20 | 1 |
| C | – | – | – | – | 20 | 1 |
| D | – | – | – | – | – | – |
Table 8.
Results of CAESAR II model for Cava de’ Tirreni case study.
Table 8.
Results of CAESAR II model for Cava de’ Tirreni case study.
| | | | Hp 0 | Hp 1 | Hp 2 | Hp 3 |
|---|
| Buildings | Collapsed (D4 + D5) | [n] | 434 | 329 | 238 | 233 |
| Unsafe (0.6 D3 + D4 + D5) | [n] | 848 | 657 | 519 | 501 |
| Occupants | Dead | [n] | 65 | 49 | 35 | 35 |
| Injured | [n] | 238 | 180 | 128 | 126 |
| Homeless | [n] | 3628 | 2833 | 2256 | 2181 |
| Governments Costs | Reconstruction | [€] | 359,383,521 | 210,831,534 | 131,192,500 | 120,105,056 |
| Restoration | [€] | 1,194,932,709 | 1,228,235,787 | 1,385,379,882 | 1.271,031,390 |
| Demolition | [€] | 1,571,042 | 1,204,237 | 966,785 | 928,798 |
| Health care | [€] | 475,835 | 359,950 | 255,216 | 252,269 |
| Evacuation | [€] | 784,600 | 729,661 | 689,744 | 684,539 |
| Emergency | [€] | 297,709,572 | 297,709,572 | 297,709,572 | 297,709,572 |
| Citizens Costs | Seismic Mitigation | [€] | 0 | 230,272,793 | 327,948,221 | 373,116,873 |
| Energy Mitigation | [€] | 0 | 275,256,241 | 550,512,482 | 502,841,003 |
| Governments Benefits | Direct costs reduction | [€] | 0 | 579,348,495 | 471,097,308 | 535,805,764 |
| Citizens Benefits | Seismic incentives | [€] | 0 | 98,833,317 | 197,666,634 | 188,606,304 |
| Energy incentives | [€] | 0 | 102,951,372 | 205,902,744 | 196,464,900 |
| Reduction of energy consumption | [€] | 0 | 14,447,549 | 28,895,106 | 26,967,695 |
Table 9.
Results of CAESAR II tool for Cava de’ Tirreni case study. Output of multi-criteria model. The alternative with the highest score is Hp 3.
Table 9.
Results of CAESAR II tool for Cava de’ Tirreni case study. Output of multi-criteria model. The alternative with the highest score is Hp 3.
| | | Criteria | Weights Normalized in the “Emergency Response” Objective |
|---|
| | | Buildings | People | Costs |
|---|
| | Normalized weights | 0.153 | 0.776 | 0.071 | |
| Alternatives | Normalized weights Hp 0 | 0.228 | 0.063 | 0.176 | 0.096 |
| Normalized weights Hp 1 | 0.257 | 0.312 | 0.265 | 0.300 |
| Normalized weights Hp 2 | 0.257 | 0.312 | 0.278 | 0.301 |
| Normalized weights Hp 3 | 0.257 | 0.313 | 0.281 | 0.302 |
| Publisher’s Note: MDPI stays neutral with regard to jurisdictional claims in published maps and institutional affiliations. |
© 2021 by the authors. Licensee MDPI, Basel, Switzerland. This article is an open access article distributed under the terms and conditions of the Creative Commons Attribution (CC BY) license (https://creativecommons.org/licenses/by/4.0/).


 ,
, 


