
Ageing Urban Population Prognostic between 2020 and 2050 in Transylvania Region (Romania)


1
Faculty of Geography, Doctoral School of Geography, Babeş-Bolyai University, 400006 Cluj-Napoca, Romania
2
Department of Human Geography and Tourism, Babeş-Bolyai University, 400006 Cluj-Napoca, Romania
3
Center for Research on Settlements and Urbanism, Babeş-Bolyai University, 400006 Cluj-Napoca, Romania
*
Author to whom correspondence should be addressed.
Sustainability 2021, 13(17), 9940; https://0-doi-org.brum.beds.ac.uk/10.3390/su13179940
Submission received: 14 July 2021
/
Revised: 11 August 2021
/
Accepted: 20 August 2021
/
Published: 4 September 2021
(This article belongs to the Special Issue Urban Growth and Demographic Dynamics)
Abstract
:Population ageing represents a dramatic scenario and a progressive process inducing major changes in the dynamics of the population and especially in the age structure. The ageing population process is a phenomenon relevant to define not only demographic but also social, cultural, and territorial transformations in relation to the urban settlements. In this article, we present a case study regarding the ageing process persistent in urban areas from the counties of the Transylvania region. The present study emphasizing the evolution of the older adults age group between 2015 and 2019, drawing a forecast model for the prognosis period 2020–2050. The tendencies of the population decline process are revealed by the outcomes of the ageing index, outlining some long-term effects of population ageing over the years. The study of this phenomenon reveals an important framework at the regional level of Transylvania and points out the means to determine its existence in other regions or countries, since it affects the urban population evolution and its dynamics.
1. Introduction
Demographic ageing is a global phenomenon with local implications attracting increasing attention in the public discourse of developed countries such as the USA, Australia, Japan, and most of the European Union countries, being described sometimes as a “global demographic revolution” [1,2,3,4,5,6]. In developed regions of the world the population is growing older—a phenomenon that is having a profound impact on a broad range of economic, political and social processes [7,8,9,10,11].
In the present context, demographic developments such as decline in fertility rates and increase in life expectancy are to be expected in a growing number of countries, as the population will age much faster in the next decades than previously [12,13]. The number of people over the age of 60 is projected to reach almost 2 billion by 2050, representing 22 per cent of the world’s population [14]. Nevertheless, since the determinants of population ageing (fertility rate, mortality rate, net migration) became a topic of study since the 1950s (e.g., Valaoras 1950; Coale 1956; United Nations 1956), priority has usually been given to fertility decline and mortality improvement, which have sometimes been presented as the primary drivers of long-term population ageing [15,16,17]. These demographic changes, especially the problem of progressive ageing, are considered some of the greatest future challenges of the European Union [18]. Demographic ageing is a topic of high importance in Europe and worldwide nowadays, in the context of concerns related to the impact of the rise in the ratio of the older adults on society’s functional organization [19]. Population ageing is foremost a demographic phenomenon and the most prominent demographic process in modern society [20], with consequences expanding much beyond the limits of demography. Demographic ageing is the process leading to increases in the representation of older adult people in the total population, being nowadays a predominant trend in Europe [21,22].
In the European countries population ageing is inevitable as a demographic transition, being characterized by a rapid increase of the older adults, aged 60–65+. In Europe, the percentage of people aged 65 and over is increasing at an unprecedented rate and is expected to account for over 30 per cent of the population by 2060 [23,24].
Eurostat projections indicate that the median age is expected to rise above 50.0 years in six countries: Poland (51.5 years), Malta (51.4 years), Italy (51.3 years), Finland (50.8 years), Croatia (50.5 years), and Spain (50.2 years) by 2100 [25]. The future paths of population ageing result from specific combinations of declining fertility and increasing life expectancies combined with changing rates of fertility, mortality, and migration rates in different parts of the continent [25,26,27].
In Romania, all demographic projections point to a rapid expansion of the older adult population in the coming decades. Specific projections vary. For example, the demographer Gheţău (2007) has suggested that the population aged 60 years and older will increase from 19.3% in 2005 to 33.3% in 2050 [28]. Eurostat projections indicate an increase in the 65+ population from 14.9% in 2008 to 30.9% in 2050 and to 35.0% in 2060 [29].
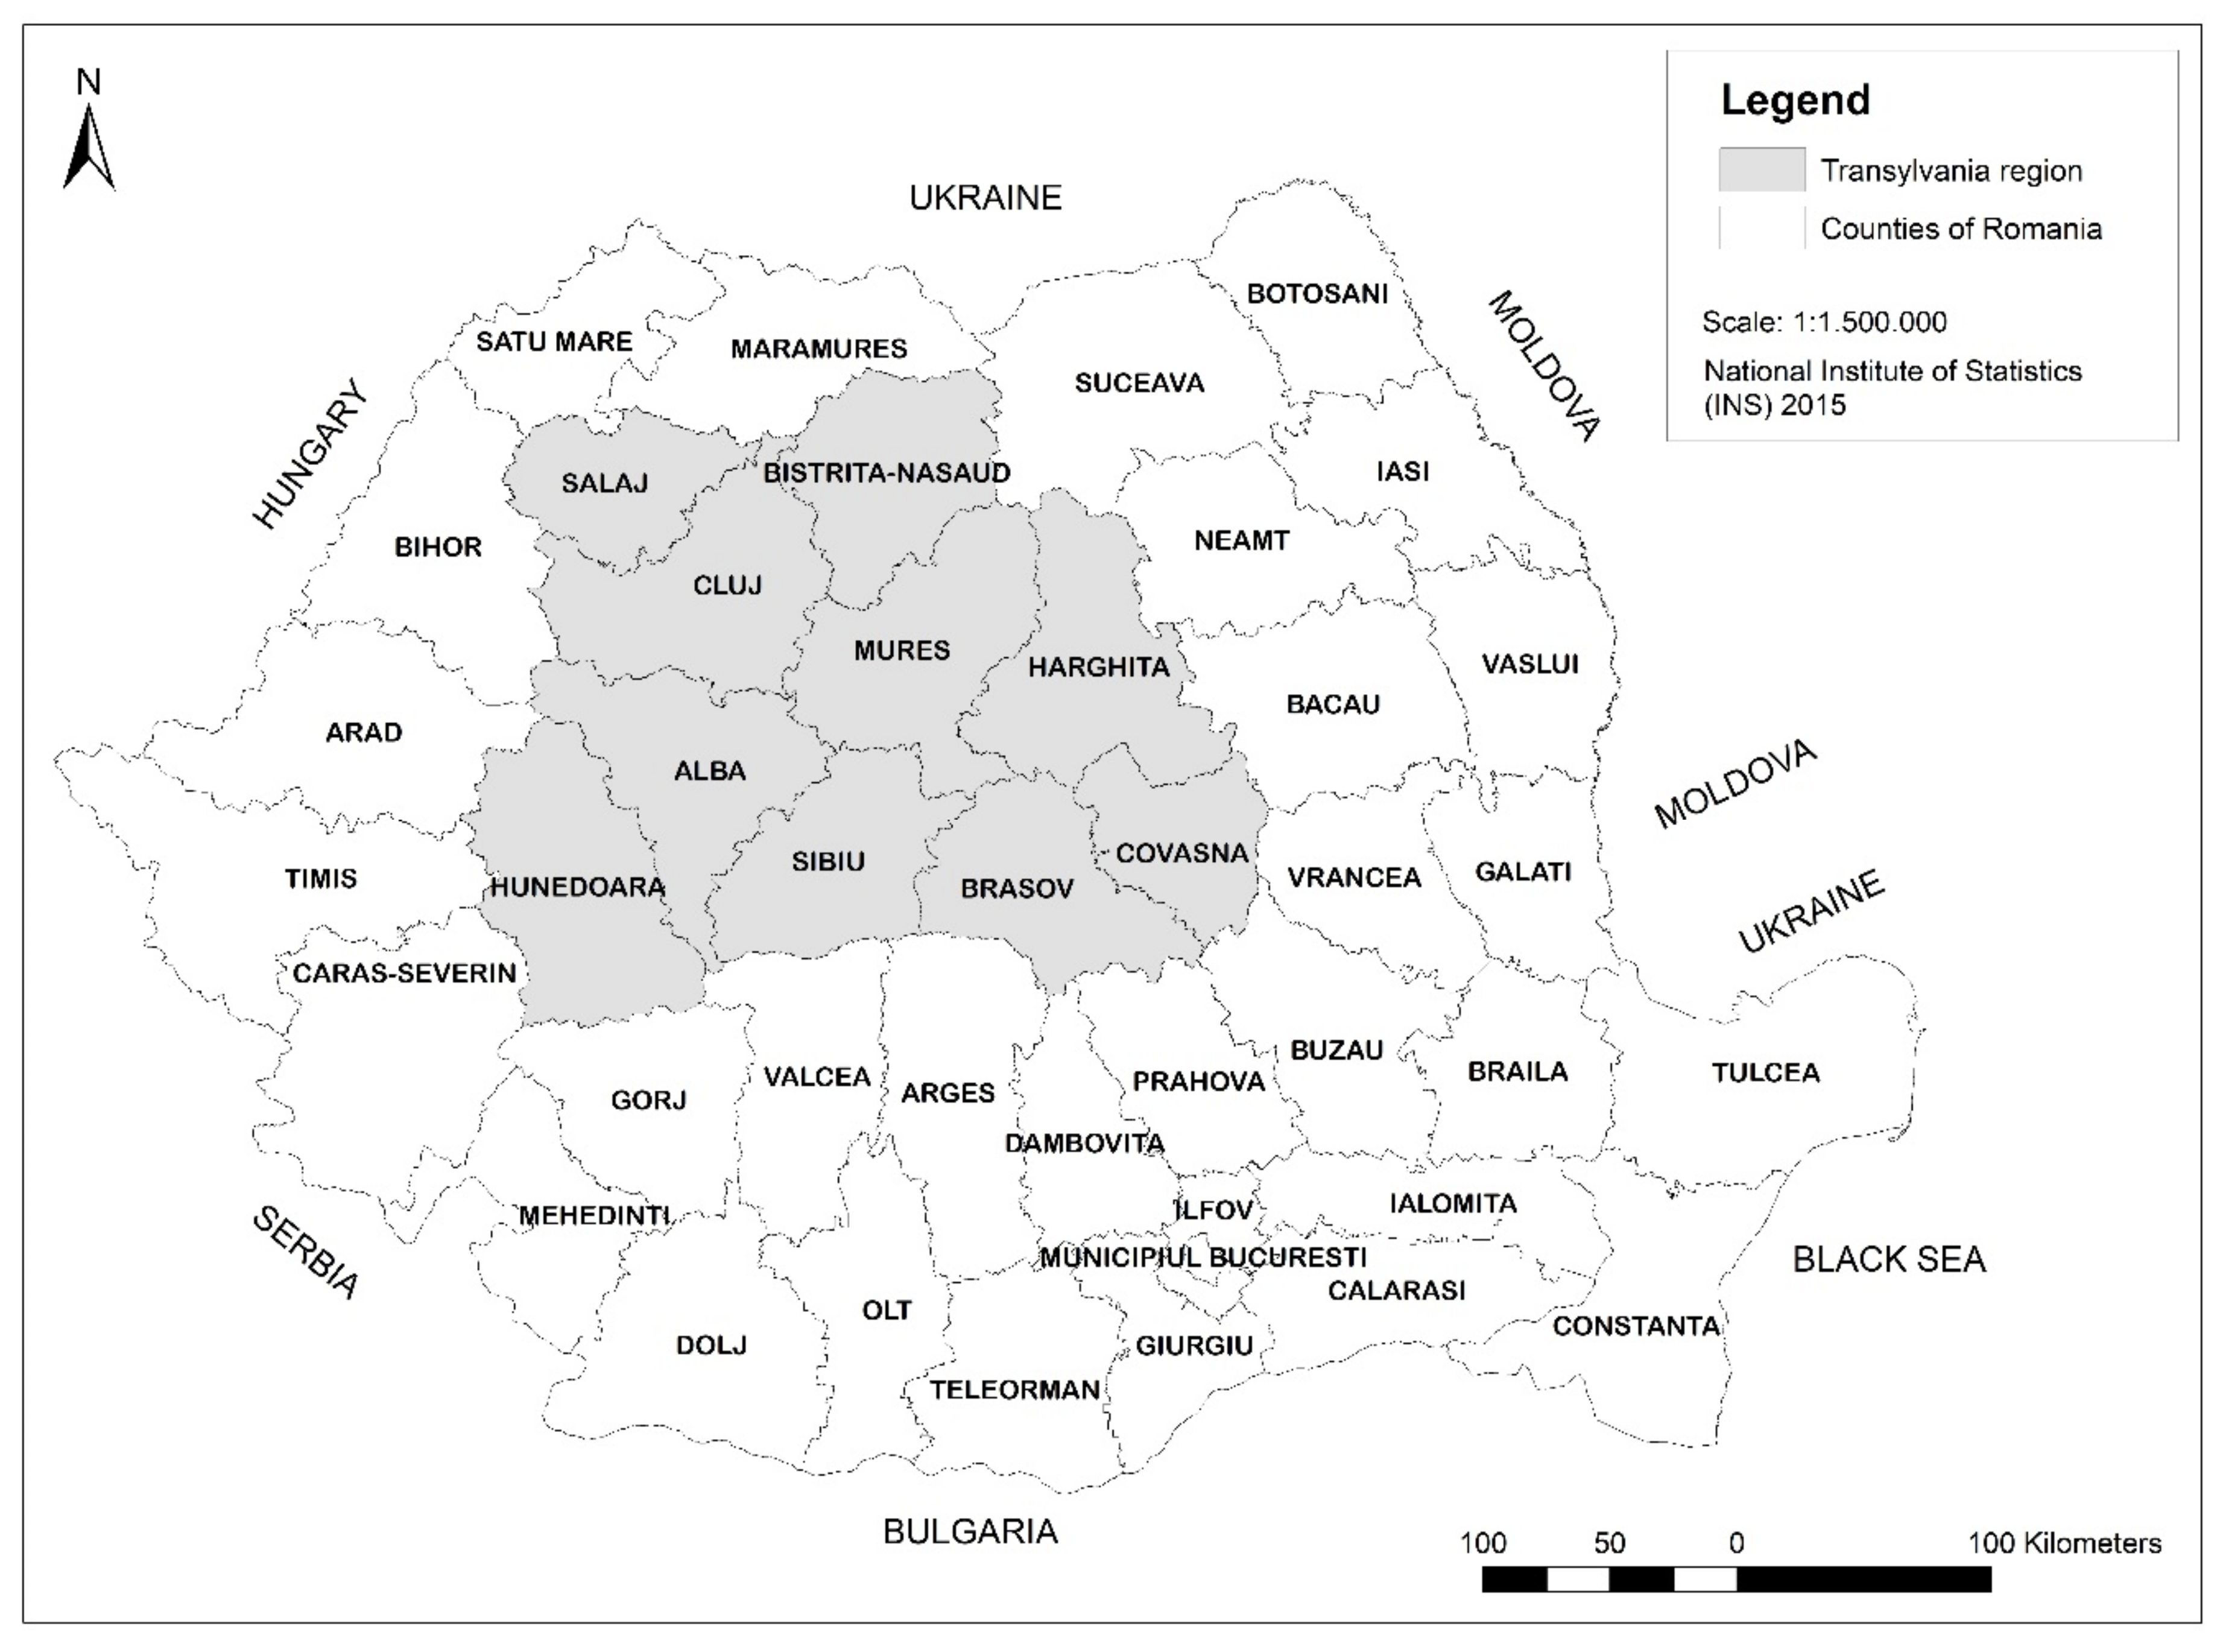
In Romania, especially in Transylvania region (see Figure 1), the urban population has ceased to grow in the last three decades and started to decrease slowly reaching the values of a demographic decline characterized by complex transformation in different population segments. Not only a gradual decrease of urban inhabitants, but the divergent evolution trajectories of the population segments indicate the manifestation of demographic decline [30,31,32]. In this context, more and more research publications are concentrated towards studying the various facets of this phenomenon, emphasizing its root causes, prognosis and policies adopted by each country in order to counter its long-term effects [27,33,34,35,36,37,38].
The very first signs of the demographic decline in Romania started at the same time with the collectivization and pre-industrialization communist period (the early 1950s–1960s), leading to an extensive rural exodus materialized in the migration of the population from rural areas to the urban areas [39,40].
During the communist period and after the fall of this regime, the demographic decline was accentuated by external migration, reaching high values in the 2000s, when a large rate of emigration within young and unemployed people was observed [41]. The rural exodus manifested in rural emigration was followed by an urban emigration outlined by the movement of target population groups from small to medium-sized towns, and finally to large cities with higher economic, social, and cultural benefits. On top of the internal population movements, an even larger impact was caused by external migration [41]. In the last thirty-one years, the population dynamics in Transylvania can be described by low birth rates and the increase of the older adult population, leading to progressive demographic decline. Additionally, the lack of proper social policies and the emigration of young people accentuated the phenomenon [42].
Generally, the population decrease is accompanied by two major tendencies, such as the behavioral aspect (fertility decline) and the structural aspect represented by population ageing [43,44]. These demographic characteristics can be considered as prominent trends at the urban level of Transylvania region, where there is an accentuated reduction of fertility and birth rates, having different origins and evolution depending on the aspects and locations studied and analyzed.
Population ageing signifies „the process of change in the population’s age group structure, in the sense of an increase in the older adult group’s ratio to the detriment of the young group, as a visible and long-term trend” [19].
It has been shown that the population age structure changing process comprising the increase of the older adult segment in detriment of the young segment can lead to a non-sustainable and uncompromising trend on the long term [45].
The issues discussed in this paper highlight the fact that demographic ageing has become a topic in social, economic, healthcare and even cultural debates because of the scale of its effects and its persistence. It is shown that specific combinations of declining fertility and mortality trends have resulted in an accelerating speed of population ageing in most societies including developing countries [27], with similar manifestation in the Transylvania region.
Studying the ageing prognosis can be a starting point for finding new practices to combat the influence of demographic ageing process and to reduce its progressive spread. In this sense, the approach regarding the ageing process is more visible on a local scale where urban areas are facing a severe demographic decline.
The research proposes to show the relation between statistical data and the demographic phenomena that can be illustrated by forecasted data, creating an overview regarding the evolution of the older adult group in the urban areas of Transylvania region. Our analysis covers the numerical distribution of the age structure evolution of older adults from urban settlements of Transylvania region. In the context of the demographic decline, this manuscript aims to present the ageing urban population prognostic in the Transylvania region of Romania, taking as reference the interval 2020–2050.
The aim of the present study is to predict the demographic evolution of ageing phenomenon in Transylvanian urban areas and its effects on population evolution, but also to present the change of age structure dynamics in order to raise awareness about the social impact of the treated subject.
2. Materials and Methods
2.1. Data Set
The present research depends on field investigation, bibliographical sources, and quantitative statistical analyses. In this regard, correlations can be established between the analyzed elements and the statistical data gathered from a prediction model.
Our case study is the urban settlements from Transylvania counties, a historical region known as “the land beyond the forest” located in the Central part of Romania, surrounded by the Carpathian Mountains. The field investigations focused on urban settlements from Transylvania counties, represented by the cities from 10 counties as follows: Alba, Bistrița-Năsăud, Brașov, Cluj, Covasna, Harghita, Hunedoara, Mureș, Sălaj, and Sibiu. The field investigations were based on the hypothesis of the Central Agency of Regional Development (ADRC 2010) according to which the ageing process of population is preeminent in the central part of the region [46].
The work methodology uses the available data from the period 2015–2019 for urban settlements that is collected and processed for the total urban areas at counties levels. The available data is collected from the Internet Platform Tempo Online of the National Institute of Statistics using as a reference date the 1st of January for the period 2015–2019 [47].
Our analysis uses available data for the period 2015–2019 and proposes a statistical model for the period of 30 years (the interval 2020–2050). Given that the work methodology proposes the forecast of future data, the statistical model proposed is a prediction model. The prediction model represents a demographic forecast of older adults age group (e.g., the total number of inhabitants in the older adults age group) in comparison with young age group and adult active age group using as a case study the counties level of central region Transylvania. Indeed, the field data gathered from all the urban areas at counties level reflect a general overview regarding the demographic trends in this central region of Romania. In this case we assume that characterizing the counties level of Transylvania as a case study is an adequate manner to show the demographic ageing trend at regional scale. The applicability of a prediction model based on 5 years observation (2015–2019) is justified by the demographic dynamics studied by the authors in previous research and by other studies. Analyzing the period of 1990 until 2000 and 2000 until 2010, we can conclude that the statistical data sets are not stable because of the consequences of social and political context of both post-communism period and transition period [28]. The choice for analyzing the interval 2015–2019 is adequate for this study since the population evolution manifests a steady trend given by the post-transition period in Romania. Other intervals were screened for potential application of a prediction model (e.g., 1990–2000, 2000–2010), however, since the total population is manifesting non-steady trends, they were found not adequate to apply a forecast or prediction model [48].
After collecting statistical data on the age group of older adult population 60–65+ years, a correlation was established between this age group and the demographic dynamics corresponding to population evolution.
2.2. Research Methods
In the present research regarding the ageing population process, we refer mainly to two types of methodological approaches: the first one represented by the selection path regarding causes that generate the effects and the second one represented by the deductive path where we already know the effects using a forecast model. The causes of population ageing can be prognosticated and explained by distinguishing two demographic trajectories: a positive one characterized by decrease of older adult people and increase of young people showing an equilibrium of total population composition and a negative one characterized by the increase of older adult people changing the age structure of the urban population.
On the background of the demographic decline persistent in the region, we deduce the tendencies regarding the evolution of ageing process in urban areas. To accomplish our research purpose, we divided the total population: the first cohort age 0–14 years, the second cohort 15–59 years, and the third one 60–65+ years. The aspects and trajectory of an ongoing ageing process are outlined in the third group represented by the older adult population (60–65+ years).
The core research method for outlining the ageing process is represented by the prediction of the older adult population in the interval 2020–2050, based on historical values from 2015–2019 for the same age cohort and the time-shifted historical and predicted values for the other cohorts. This approach ensures that the natural dependency of the older adults age cohort on the second cohort (15–59: the working age population) and the first cohort (0–14 years: the young population) is observed. Indeed, by taking a prediction delay of a number of years, the working age population will become older and fall under the older adult cohort, while the young population will in turn become adult. In this study, the prediction delay is considered 5 years.
The applicable research instruments for the above method are represented by time series regressions. Time series regressions are statistical methods for predicting future responses based on the response’s history (known as autoregressive dynamics) and the transfer of dynamics from relevant predictors. Time series regressions are used to study and predict the behavior of dynamic systems from experimental or observational data, being used for modeling and forecasting of economic, financial, and biological systems, among others [49].
By using a predictive regression model, we anticipate the numerical evolution of older adult people for the period 2020–2050.
The predictive regression model is implemented using a forecasting function in the Excel Forecast Tool. The pure forecasting function calculates or predicts a future value as a linear trend using the existing values. To these existing values known as variables xi (forecast argument) and y (historical trend) we will add a new differentiating regression factor coped as General Decline Factor. In our study, the forecast argument xi represents the year, while the historical trend y represents the population value for the age group in question.
The General Decline Factor represents a regressive weighting factor that captures the historical trend for the working age and young population into the older adults age group projection. This factor is used to realistically forecast the future evolution of the third age cohort (60–65+ years) in the context of sustained decrease of the total urban population. The General Decline Factor represent a key differentiator of our prediction model when compared to linear, quadratic, or other models, since it captures the intrinsic time series lags for the population evolution.
By using the General Decline Factor, we show that the predictive model generates trustworthy result at the end of 2050, emphasizing the decreasing trend of the share of older adult people, which cannot grow progressively beyond 100%—as suggested by other models. This idea has emerged from the lessons provided by the Japanese population shrinking [50].
The mathematical relationship of the predictive regression model, which includes the two variables x (the year) and y (the absolute population value), and the General Decline Factor (GDF) is presented as follows:
F(x) = Forecast (xi; known_y^s, known_x^s) × GDF (x)
Following the Equation (1) above, we define the General Decline Factor (GDF) for the older adults age group as:
We have also analyzed other prediction models (linear, quadratic, Bayesian inference); however, we concluded that the older adult population forecast using these models provide artifacts or irregular trajectories. In our study regarding the ageing process scenario, we cannot apply the prediction models listed before (linear, quadratic, Bayesian inference) because of the irregular trajectories of the older adult population age group (60–65+ years) and of the other groups that contribute to its trend.
The simple prediction model’s limitations are visible when we use prediction models purely based on historical data, with total population in the older adults age group increasing steadily to extreme values beyond 100%. In this case it is obvious that the simple prediction models do not express the reality since statistical data of the age group 0–14 years and 15–59 years show that the overall population is susceptible to a decreasing tendency that will be reflected later in the age group 60–65+ years. As a result, in the age group 60–65+ years we will observe over time a decreasing number of people that are getting older from the active adult age group and it cannot account for a constant increase, as predicted by a simple model.
To accurately reflect this irregular growth of the older adult population (60–65+) the General Decline Factor accounts for the regressive part of the model. As shown, we use this factor to draw a realistic prediction compared to the other two age groups mentioned above as the young population group and adult active population group. The number of older adult people depends directly on the number of active adults and to a lesser extent on the number of young people. This is because the higher end of the age group 15–59 years (for example, adults aged 50–59 years) will directly influence the tendency in the age group 60–65+ years as they become older. However, this tendency manifests with a delay of at least a few years, thus we introduce the General Decline Factor for the age group 60–65+ years with a delay of 5 years compared to the reference calculation based on the adult age group (as seen in Table 1, Table 2 and Table 3).
In a later stage, we analyze the ageing index to emphasize the tendency of the older adults group becoming a proportionally larger share of total population than young population. The ageing index is used to understand if the increasing share of older adult people consequently provokes an upward shift in the population age structure [49]. This would mean that the Romanian society is facing a decline in the share of young people along with the increase of older adults age group. The ageing index for the counties level of Transylvania region is computed using:
Ageing index (%) = (Older adult people (60 years and above))/(Young people (0–14 years)) × 100 [%]
Similar to the General Decline Factor, another important indicator according to Eurostat is the old-age dependency ratio defined as the ratio between the number of persons aged 65 and over (age when persons generally become economically inactive) and the number of persons aged between 15 and 64. The value is expressed per 100 persons of working age (15–64) [51] according to the next formula:
Old-age dependency ratio (%) = (Inactive population (65 years and over))/Active population (15–64 years)) × 100 [%]
3. Results
3.1. Older Adults Population Evolution between 2015 and 2019
The Transylvania region is currently facing the complex social and economic consequences of an ageing population process and deterioration of all demographic structures. The accelerated ageing process of the population refers to the numerical increase of the segment of the older adult population aged 60–65 years and above from the total population because of the decrease in the fertility and mortality rate conceded by the increase in life expectancy [52]. The population ageing reached high values after 1992, marking a demographic transition from the traditional reproduction model with a high birth and mortality rates to the post-communist model represented by low birth rates and moderate mortality rates [43].
The urban population of Transylvania region inevitably suffers a complicated ageing process illustrated even by the appearance of a new type of age group, as the oldest people of 80 years and older, the so-called “fourth group” of the population.
Meanwhile developed counties in the Transylvania region are experiencing a rapid shift by a decrease in the number of newborn children relatively to the number of employed population and older adult people.
In the analyzed period 2015–2019 the number of older adult people have recorded higher increases from one year to another suggesting a dynamic ageing population process present in urban areas. This tendency is illustrated comparatively in Table 1 for all Transylvania counties.
Meanwhile, the young and adult age groups manifested shrinking tendencies for the same analyzed period 2015–2019 (see Table 2 and Table 3).
In the analyzed period 2015–2019, we interfered with 3 scenarios regarding the evolution of the older adult population compared to the reference year 2015. The pessimistic scenario is visible in urban areas of Hunedoara County where the older adults age group shows a slow increase with 5.18% in 2019 compared to 7.80% registered in urban areas of the Mureș County in 2019.
In the urban areas of counties Cluj, Covasna, Sibiu, and Alba, in the interval 2015–2019 is notable a slightly optimistic scenario with an incipient growth of the older adult people ranging from 10.02% registered in Cluj in 2019 to 10.57% registered in county Alba in 2019 compared to 2015. An out-growth of the share of older adult people extended to 12% is counted in urban areas of Harghita County (11.07% in 2019) comparative to a rise of 12.62% counted in urban areas of Brașov County in 2019.
This intermediate area of growth (10–12%) of the older adult population is considered a constant growth which points to the intensification of the ageing process setting a range from 10.02–12.62% (in urban areas of counties Covasna, Sibiu, Alba, Harghita and Brașov).
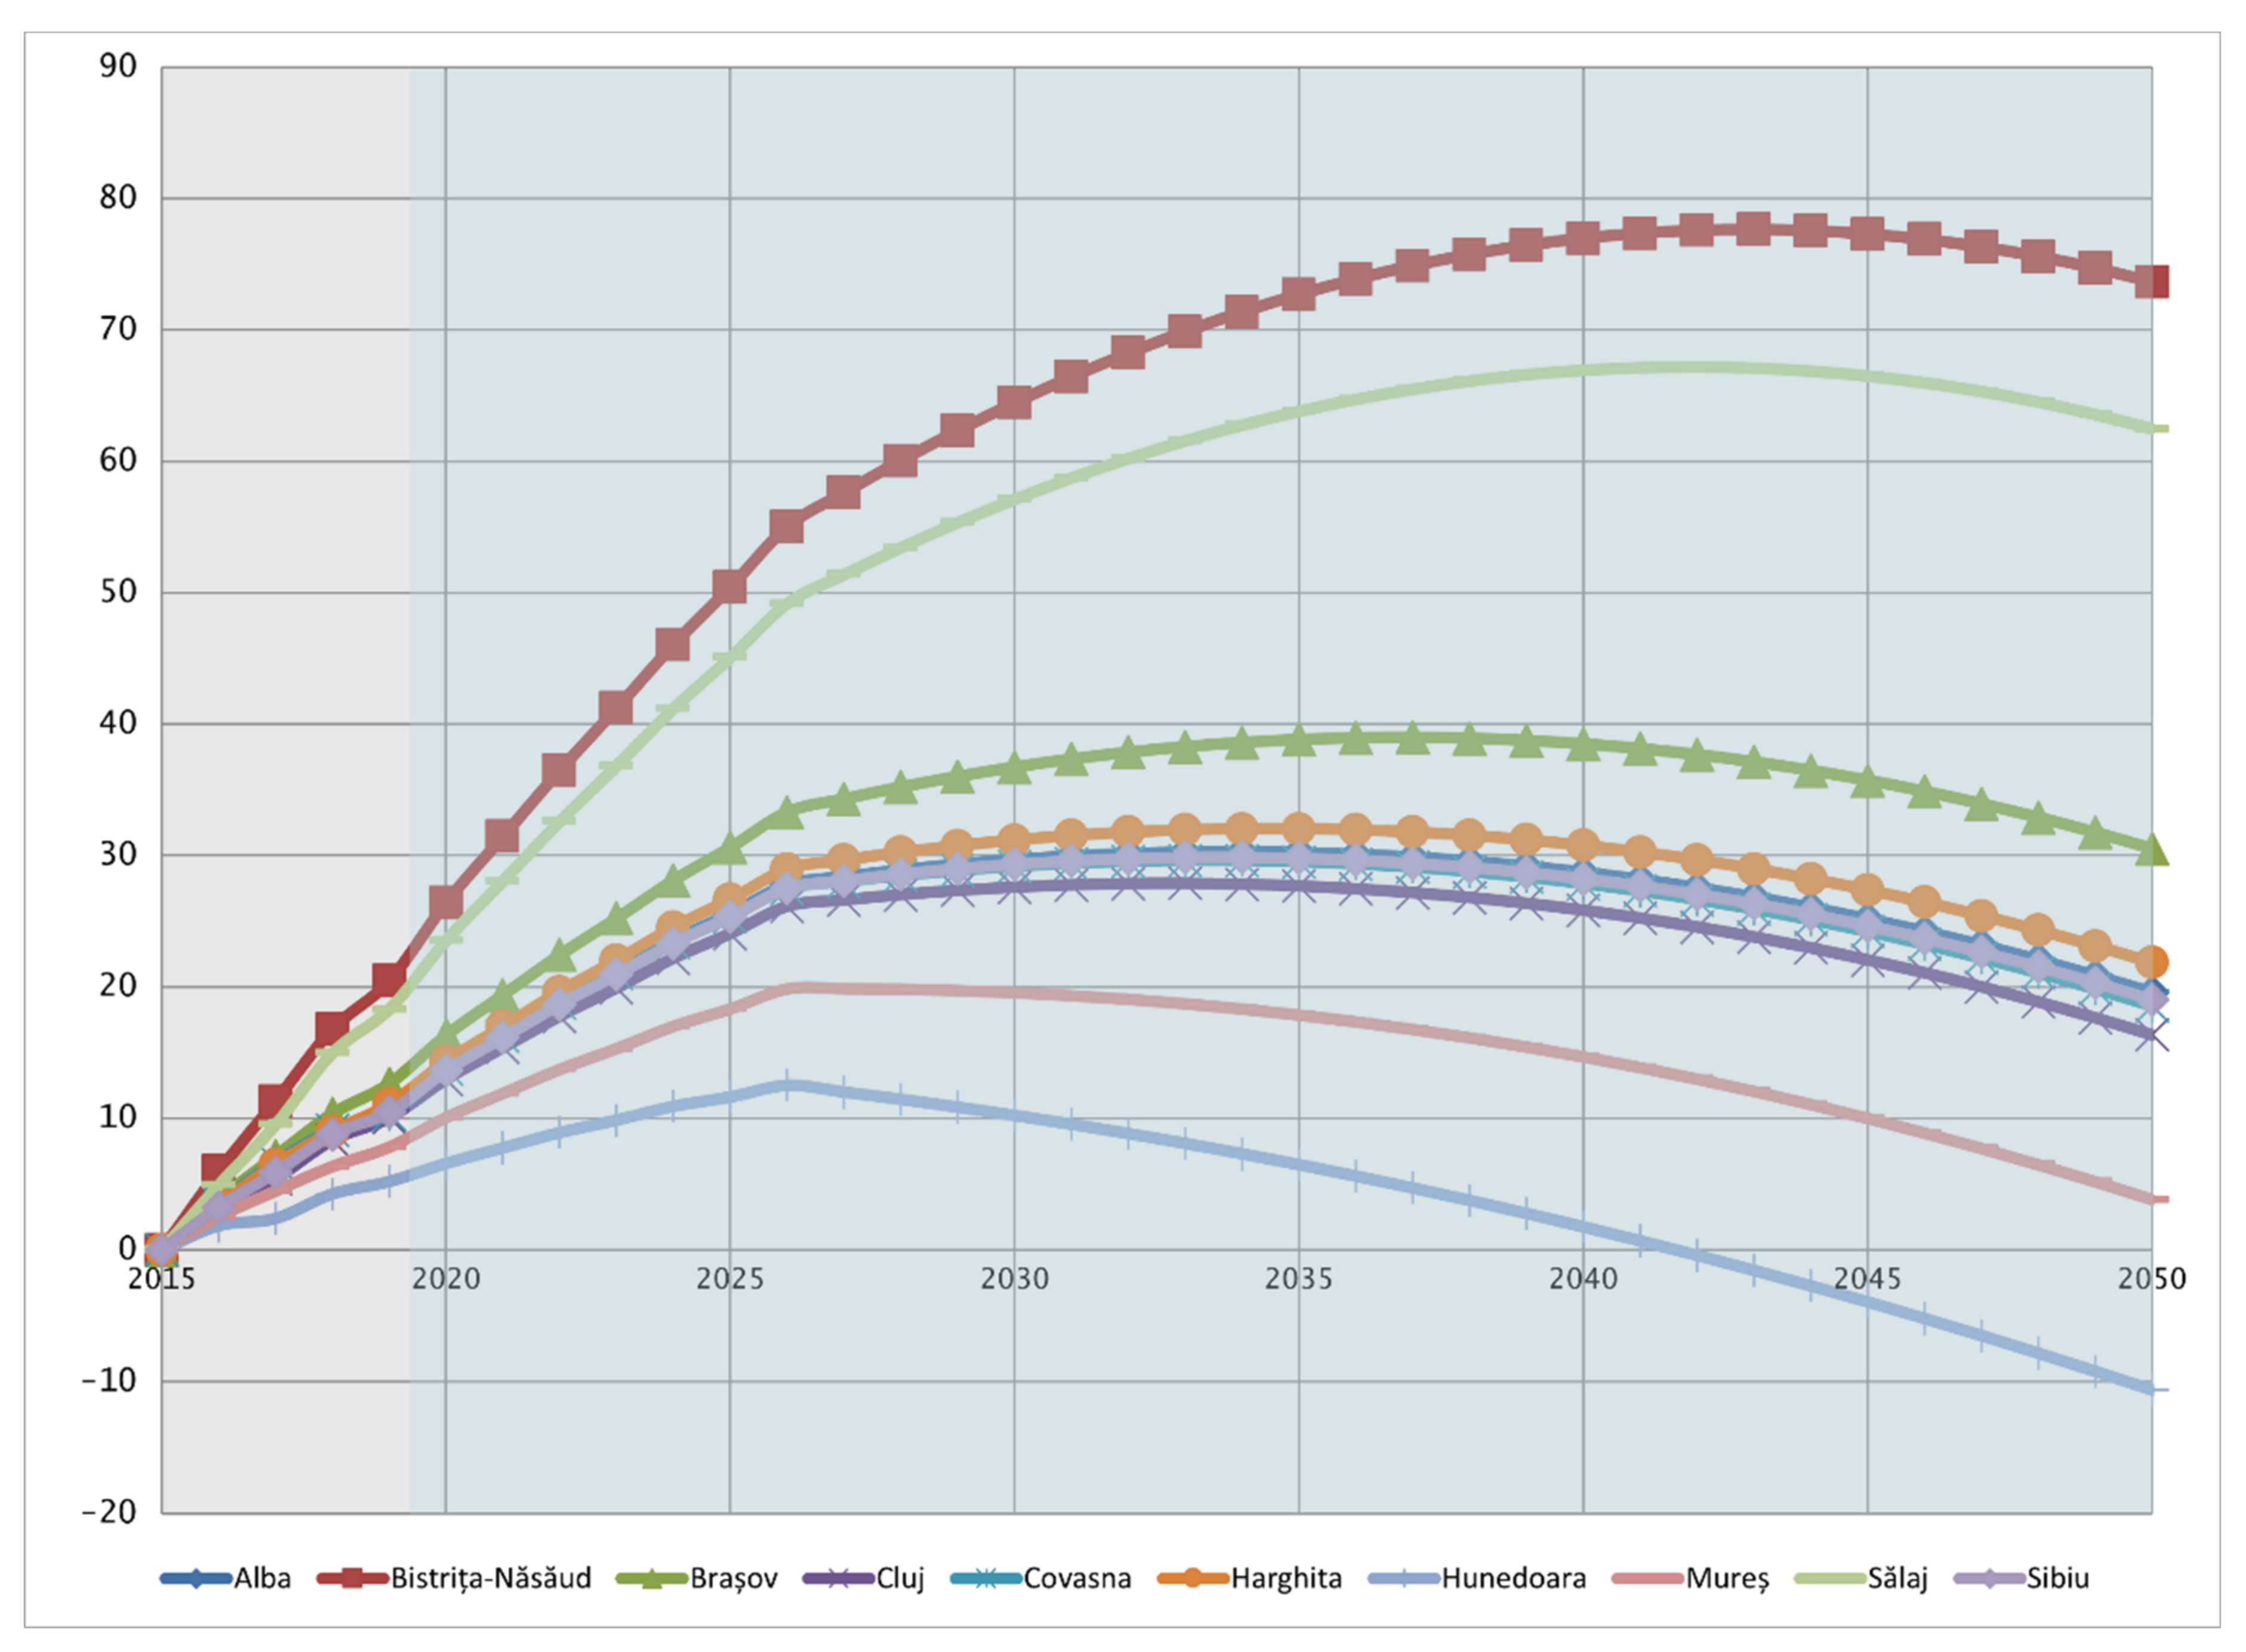
The most optimistic scenario according to the Figure 2 in the interval 2015–2019 is evident in urban areas of counties Sălaj and Bistrița-Năsăud where the increase of older adult people extends to 20%, meaning that only the ageing process is evident there, on a general population increase trend. In urban area of Sălaj County the share of older adult people rises to 18.28% in 2019 comparative to 20.45% registered in 2019 in urban area of Bistrița-Năsăud County.
3.2. Older Adults Population Prediction between 2020 and 2050
The prediction for the period 2020–2050 exposes the fact that the ageing phenomenon persistent in urban areas of Transylvania region has an accelerating increasing trend. In these circumstances, we can admit that in the future the society will become an ageing society. An ageing society represent a continuous ageing of the population when the median age of the world’s population increases from 26.6 years in 2000 to 37.3 years in 2050 and then to 45.6 years in 2100 [30].
The share of the population aged 60 and over is projected to increase in nearly every country in the world during 2015–2080 [53]. According to Eurostat (European Statistics) the median age in the EU-27 is projected to increase by 4.5 years between 2019 and 2050, to reach 48.2 years meaning that the proportion of people of working age in the EU is shrinking of the number of older people is expanding. This pattern will continue in the next couple of decades, as the post-war baby-boom generation completes its move into retirement [54]. The total population in Europe and North America is stabilizing having reached 1.11 billion in 2019 and projected to grow slowly just to 1.13 billion around the year 2050 and decline thereafter to about 1.12 billion in 2100 [55].
The total population in Romania is ageing and decreasing, whereby the median age is expected to grow from 40 years in 2015 to 48.8 years in 2050 according to United Nations Statistics [55].
The dynamic growth of elderly population is an irreversible process, modulated by the dynamic out-migration of working age population and the lower natality rates resulting in less young people. Thus, by introducing the General Decline Factor (GDF) we reduce the expanding of ageing phenomenon after the year 2050 to hypothesize an evident decreasing tendency sustained by the fact that the working age people will represent in the future the older adult people. The effects of the demographic decline process widely affect the young population and working age population so by using the General Decline Factor (GDF) we interfere with the raise of older adult population because of demographic structures deterioration. Thus, a realistic prediction model is derived for the older adult population, which is forecasted for the period 2020–2050 (see Table 4).
The GDF is a modulating factor that highlights the realistic aspect of the evolution of the older adult population, which cannot grow indefinitely. To draw a suitable prognosis, the GDF is introduced with a 5-year delay (see Table 5), considering for example that the active people that have 55 years in 2020 will be in the older adult group in 2025, thus influencing directly the statistics. Naturally, the young and adult age groups evolution is also forecasted between 2020–2050 based on the data available from 2015–2019, however, no GDF is used there.
The population prediction between 2020 and 2050 is illustrated also in Figure 2 (blue area) and Table 4 where the older adults population evolution is considered at counties level.
In the interval 2020–2050 in urban areas the share of older adult people increases up to the middle of the period, then it prominently reverses its tendency of decreasing trend due to the demographic shifting of age groups.
In the urban area of Hunedoara County, a decrease prognostic of −10.62% is visible in 2050 comparative to a slight increase (3.81%) in 2050 in urban area of Mureș County. This dramatic prognostic is the direct consequence of a low fertility rate, the less job offers and a massive out-migration of the active population. In these two counties, the older adult population, that normally increases due to the ageing process, in this situation it starts to decrease abruptly, which means that the demographic structures deterioration is striking.
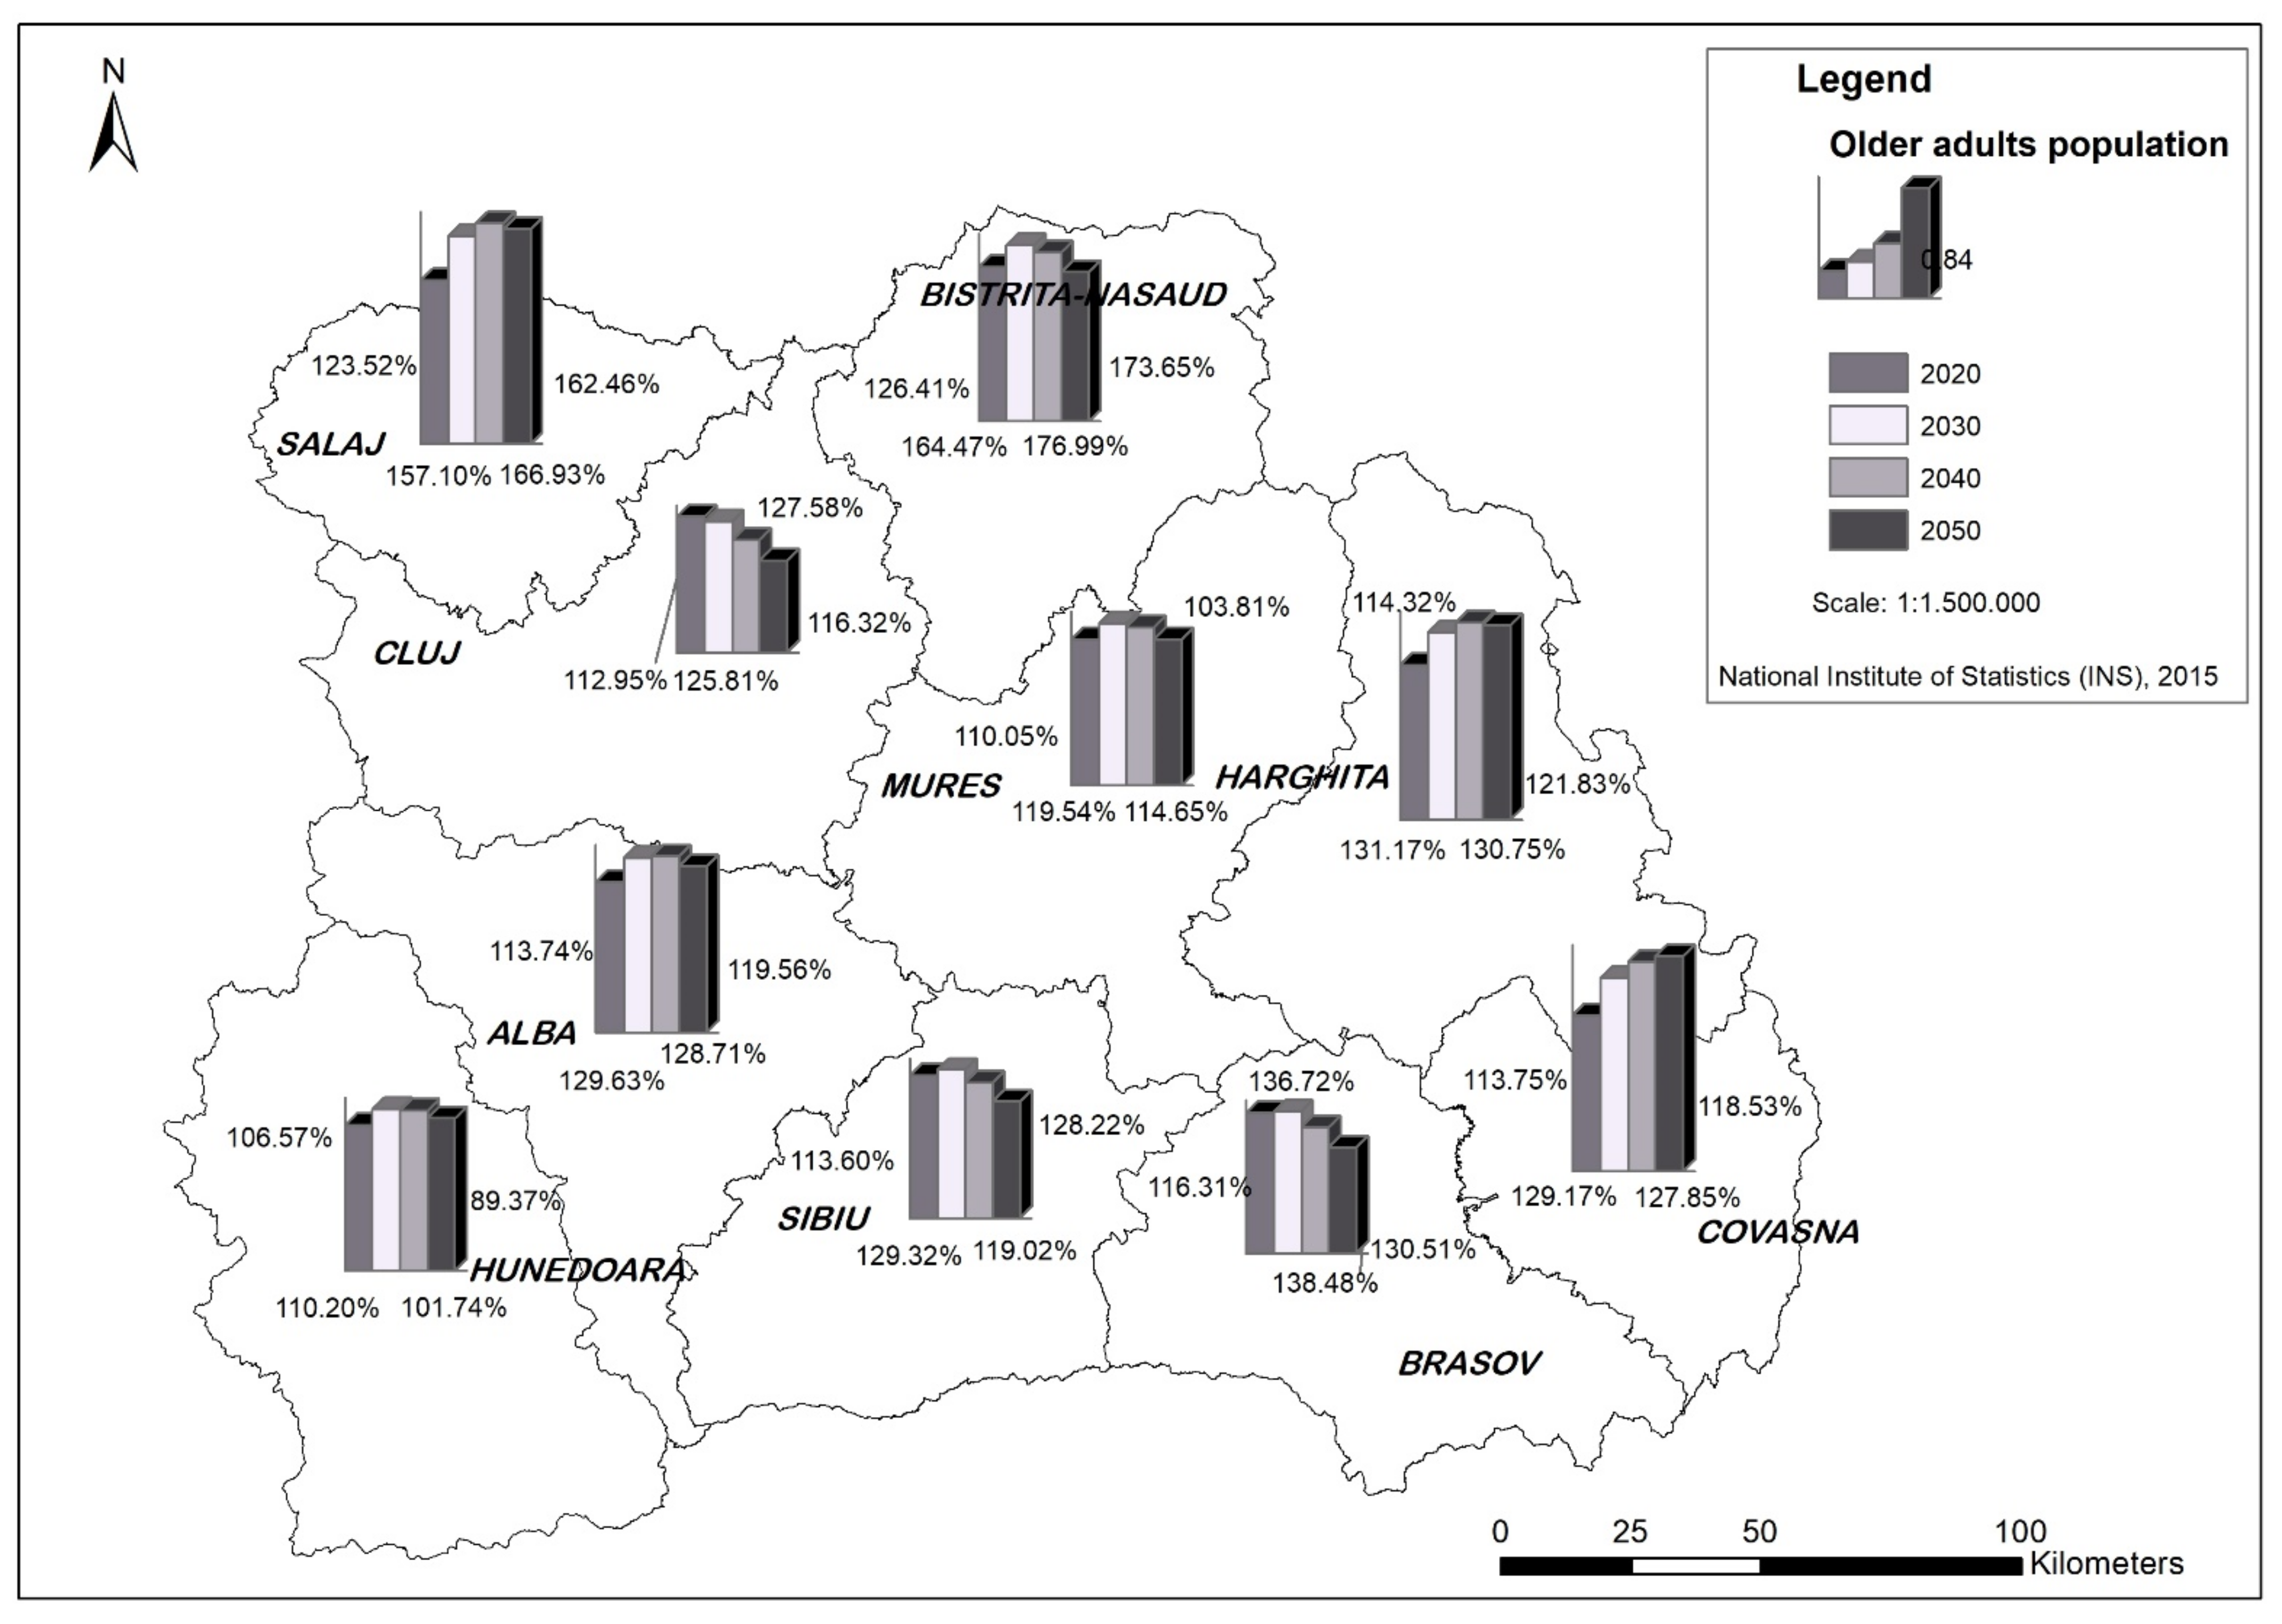
A more optimistic prognostic ranging from 20% and up to 40%, in the interval 2020–2050 is visible in urban areas of counties Covasna, Cluj, Sibiu, Alba, Harghita and Brașov. In urban area of Harghita the share of older adult people increases from 14.31% in 2020 up to 21.83% in 2050. Also, an important growth of older adult people from 16.30% in 2020 and up to 30.50% in 2050 is counted in urban area of Brașov County. This intermediate area of growth (20–40%) of the older adult population is considered a constant growth due to the extension of this age group segment.
In the interval of 2020–2050 a more optimistic prognostic is evident in urban areas of counties Sălaj and Bistrița-Năsăud where the share of older adult people will progressively increase up to 80%. This means that the young and adult age groups are still healthy increasing, however there is ageing tendency, resulting in the older adult population increase. In the urban area of Sălaj County the share of older adult people will increase from 23.52% in 2020 up to 62.46% in 2050. An outstanding growth of the older adult population is visible in urban area of Bistrița-Năsăud County where their growing number reports 26.41% in 2020 up to 73.65% in 2050. The increased trend of the older adult population raises the possibility to extend the pension age and the opportunity to actively involve the older adult people in the labor market.
The forecast regarding the ageing process in urban areas of Transylvania region underlines that probably this process is more evident in rural areas than in urban areas but around the year 2020 it is admitted that also the urban population in Transylvania region will present an approximate rise of 50% of the older adult population [56]. The general problem of ageing becomes a much wider issue, including the population age structure shifting.
The ageing process depends on a population’s transient evolution, either from a longitudinal trend of prolonged life expectancy and/or a sustained and regular decrease in fertility rate, or a combination of these, thus also suggesting the projection of the ageing population from Transylvania region [56].
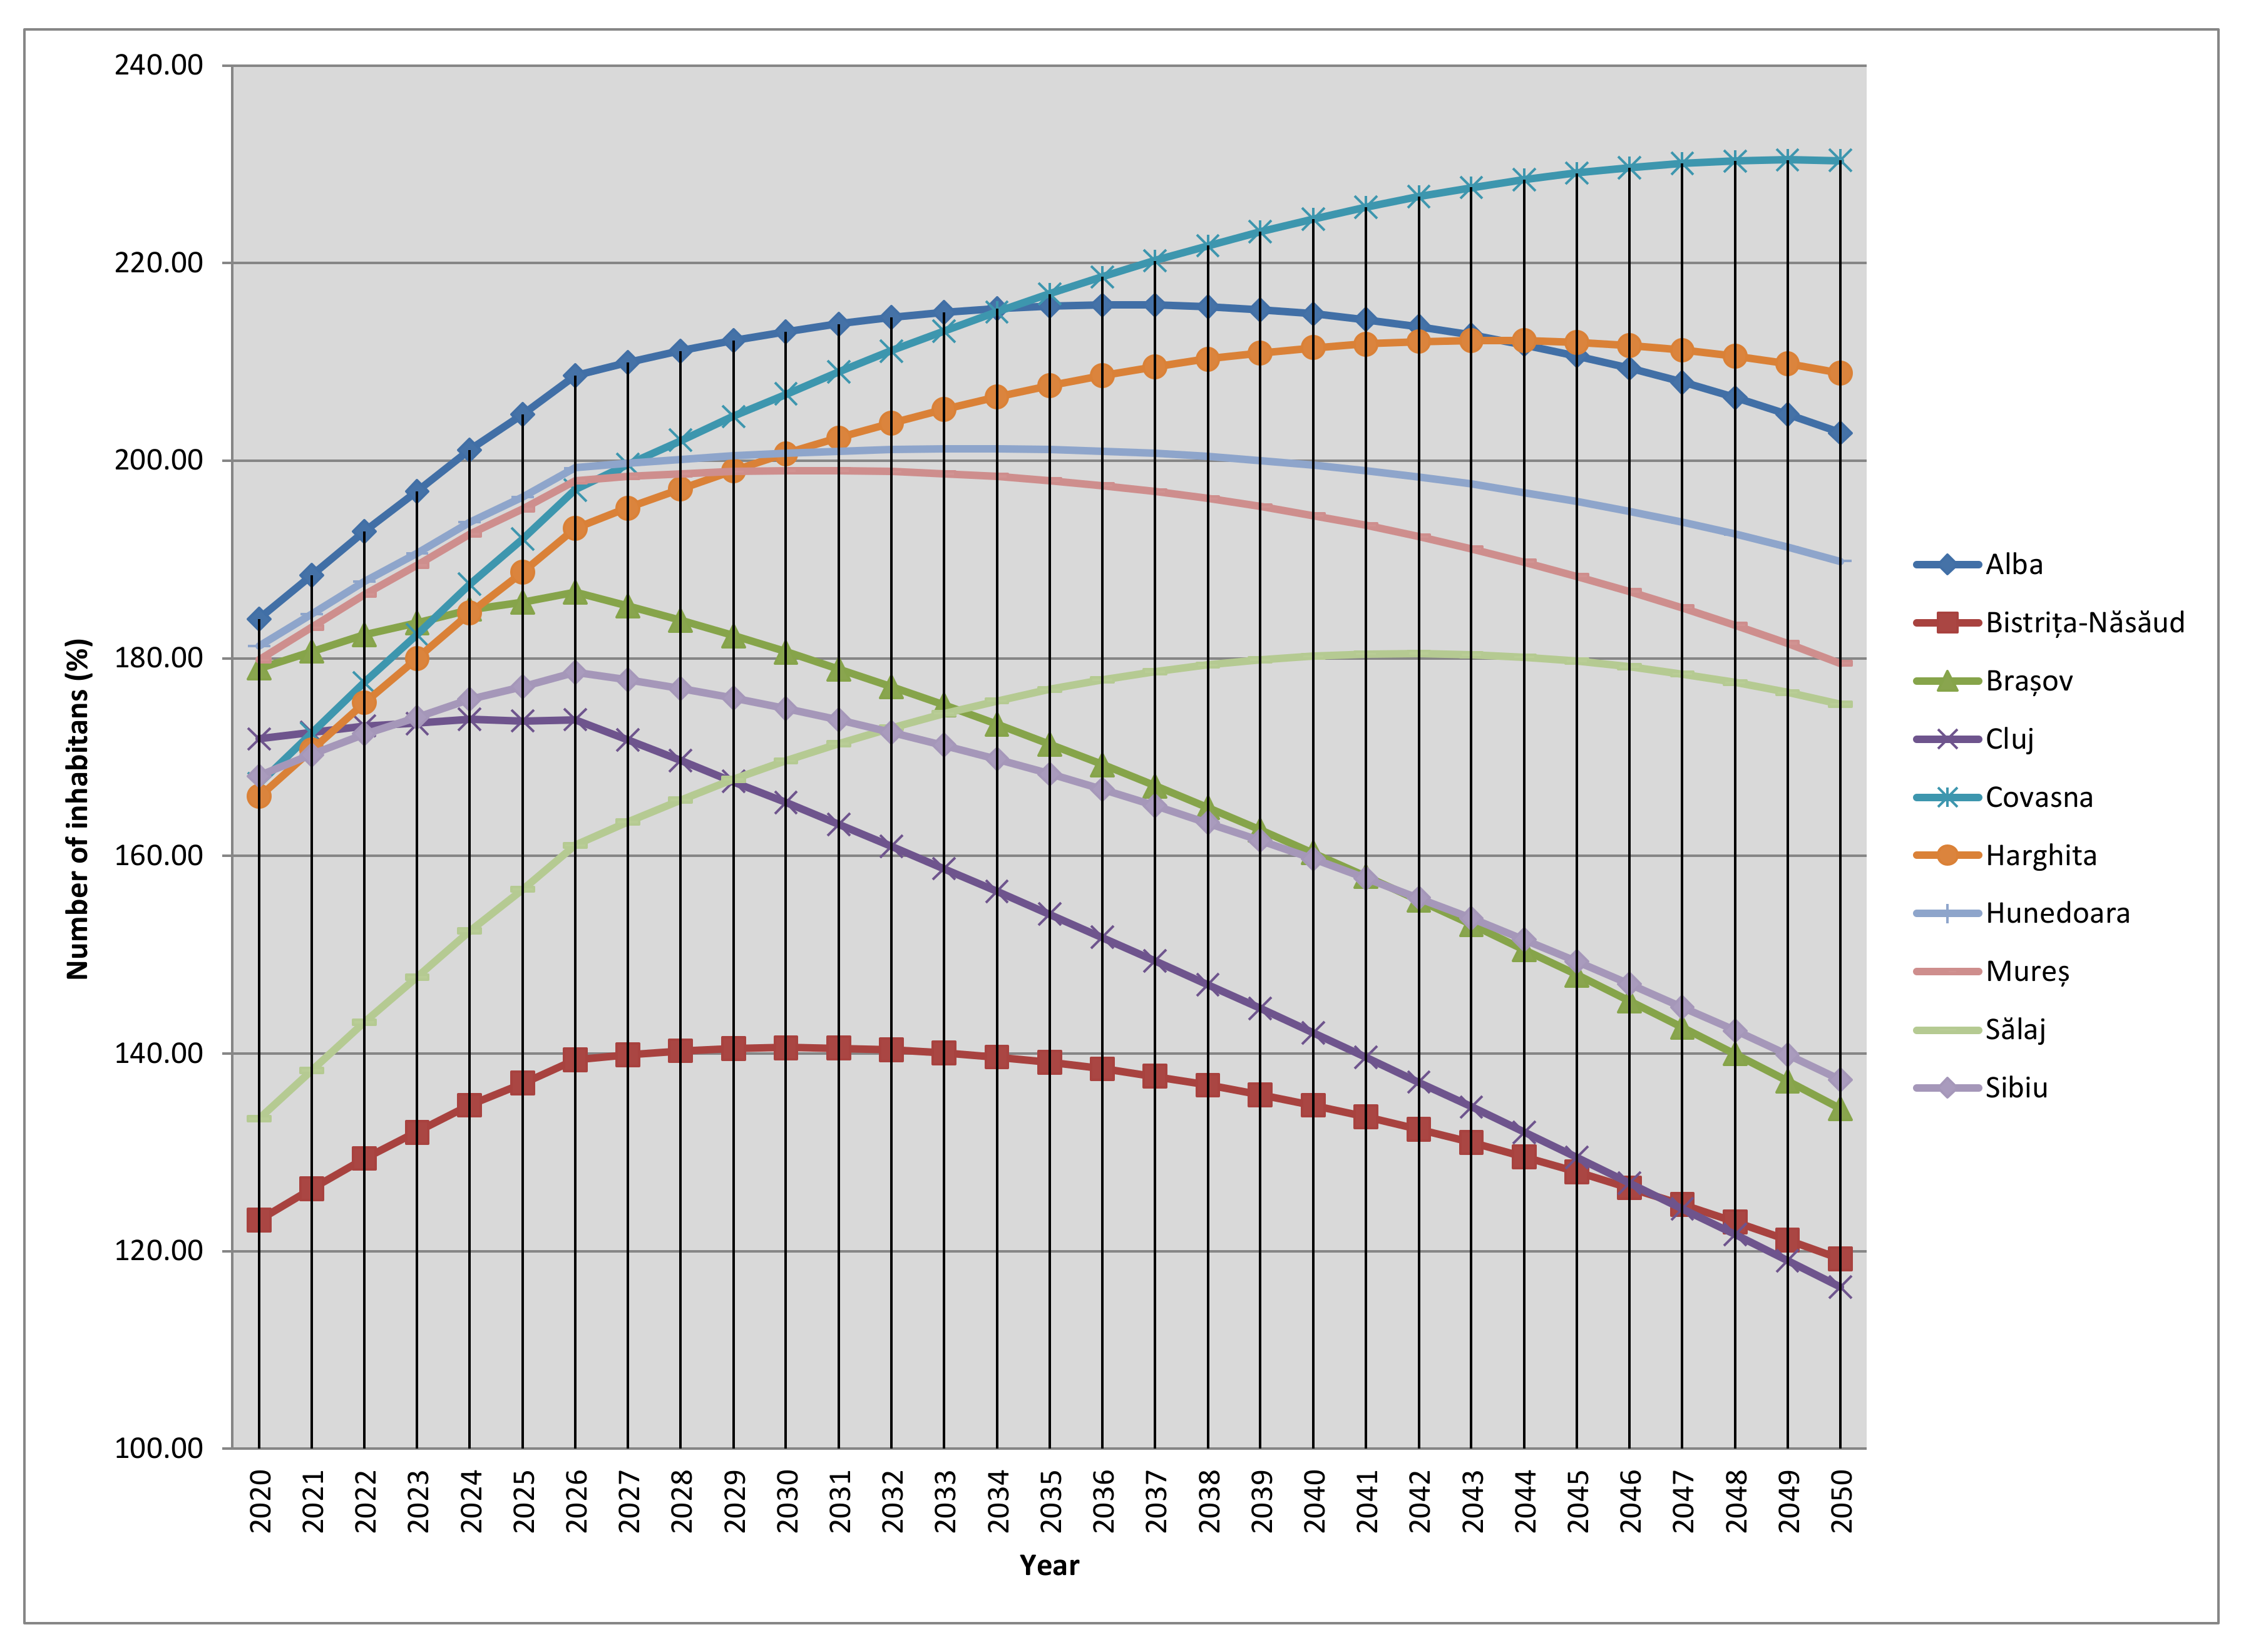
The older adult population evolution forecasted on the horizon of the period 2020–2050 reveals an accurate prediction based on two major tendencies.
The first one sustains the general increasing tendency regarding the older adult people due to the raise of life expectancy and spreading effects of ageing process since around 2025–2030. The prediction of the older adult population aged 60–65+ years has an outstanding growth trend for this first interval for a few counties as Alba, Cluj, Covasna, Harghita, and Brașov.
The second one sustains a decreasing tendency regarding older adults around the year 2050 in all counties because of the effects of demographic will decline, the less newborns, and an active out-migration of young and active people. In this order the number of older adult people start decreasing since fewer active people are becoming older. In this condition, the number of the older adult populations are not stationary anymore towards the end of the interval (see Figure 3).
For comparison with our analysis, the demographic forecast for Romania according to INS projects two scenarios (medium and intermediate) for NUTS regions regarding the number of older adult people (60 years and over). According to the intermediate scenario, the total share of older adults will increase between the interval 2015 and 2050 from 17.2% to 29.7% [57]. The NUTS regions of Romania do not include the entire central region Transylvania (our case study) but only six counties of the region as Alba, Brașov, Covasna, Harghita, Mureș, and Sibiu and the other counties as Bistrița-Năsăud, Cluj, and Sibiu are represented by the Nord-West Region, while the Hunedoara County is included in West Region. We take into consideration the forecast at the NUTS regions of Romania as our guidance forecast in comparison with our prediction model including the central region Transylvania with its six counties as mentioned above. According to the INS medium scenario forecast at NUTS Regions, the share of older adult people will increase in Transylvania from 26.5% in 2015 to 28.3% in 2060 [57]. The share of older adult people is growing in both scenarios as intermediate and medium scenario between 27.4 and 28.3% in 2060 [57].
The medium scenario of INS displays the fact that the number of older adult people aged 80 and over will increase from 24.2% in 2015 to 35.1% in 2060 while the intermediate scenario reports that this age cohort will increase to 37.1% in 2060 [57,58]. Indeed, when compared to these, our analysis regarding the forecast at counties level for Transylvania region is in line with the scenarios displayed by INS for Romania. As presented in Figure 2 and Table 4 in several counties (Brașov, Alba, Mureș, Cluj, Covasna, Harghita, Sibiu) the number of older adult people will increase on average between 15.12 and 34.88%.
The urban population is in a continuous change reshaping the age structure of population and inducing some irreversible aspects like a particular number of young and adult people, a lower labor market on the background of a diminishing total population and a growing number of older adult people. In this order, urban areas are condemned to become an ageing society. Despite these aspects, the population projection data displayed in this paper should be interpreted with caution as current estimates may well be altered as new statistical data becomes available. Nevertheless, a simple look at today’s age structure makes it already clear that these regions experience an unprecedented phenomenon in terms of ageing [14]. The share of older adults in the total population are higher in this time of history and their growth is accelerating.
Next, we will derive the ageing index and the prospective old-age dependency ratio, to observe the growing path of older adult people and to predict in real time the consequences of this growth. The ageing population process forecast allows us to elucidate the dramatic scenario of urban depopulation and the shifting of the age structure. Depopulation is a complex demographic and territorial phenomenon, referring to a chronic decrease in inhabitants and affecting the spatial distribution of population [59,60,61].
3.3. Ageing Index
The effects of ageing process affect the community and society. Its evolution can be derived also by knowing the active ageing outcomes reflected by the ageing index, which shows the extension of this process at the regional level.
The ageing index increases worldwide since 2020 in European Union the ageing index raised to 132.3%. According to Pordata (Statistical Base Data from Portugal) in 2018 these index reaches high values in countries as: Italy 171%; Germany 158.5%; Portugal 157.4%; Greece 152.5%, Bulgaria 148.1%, Hungary 131.6%, and 117.3% in Romania [62].
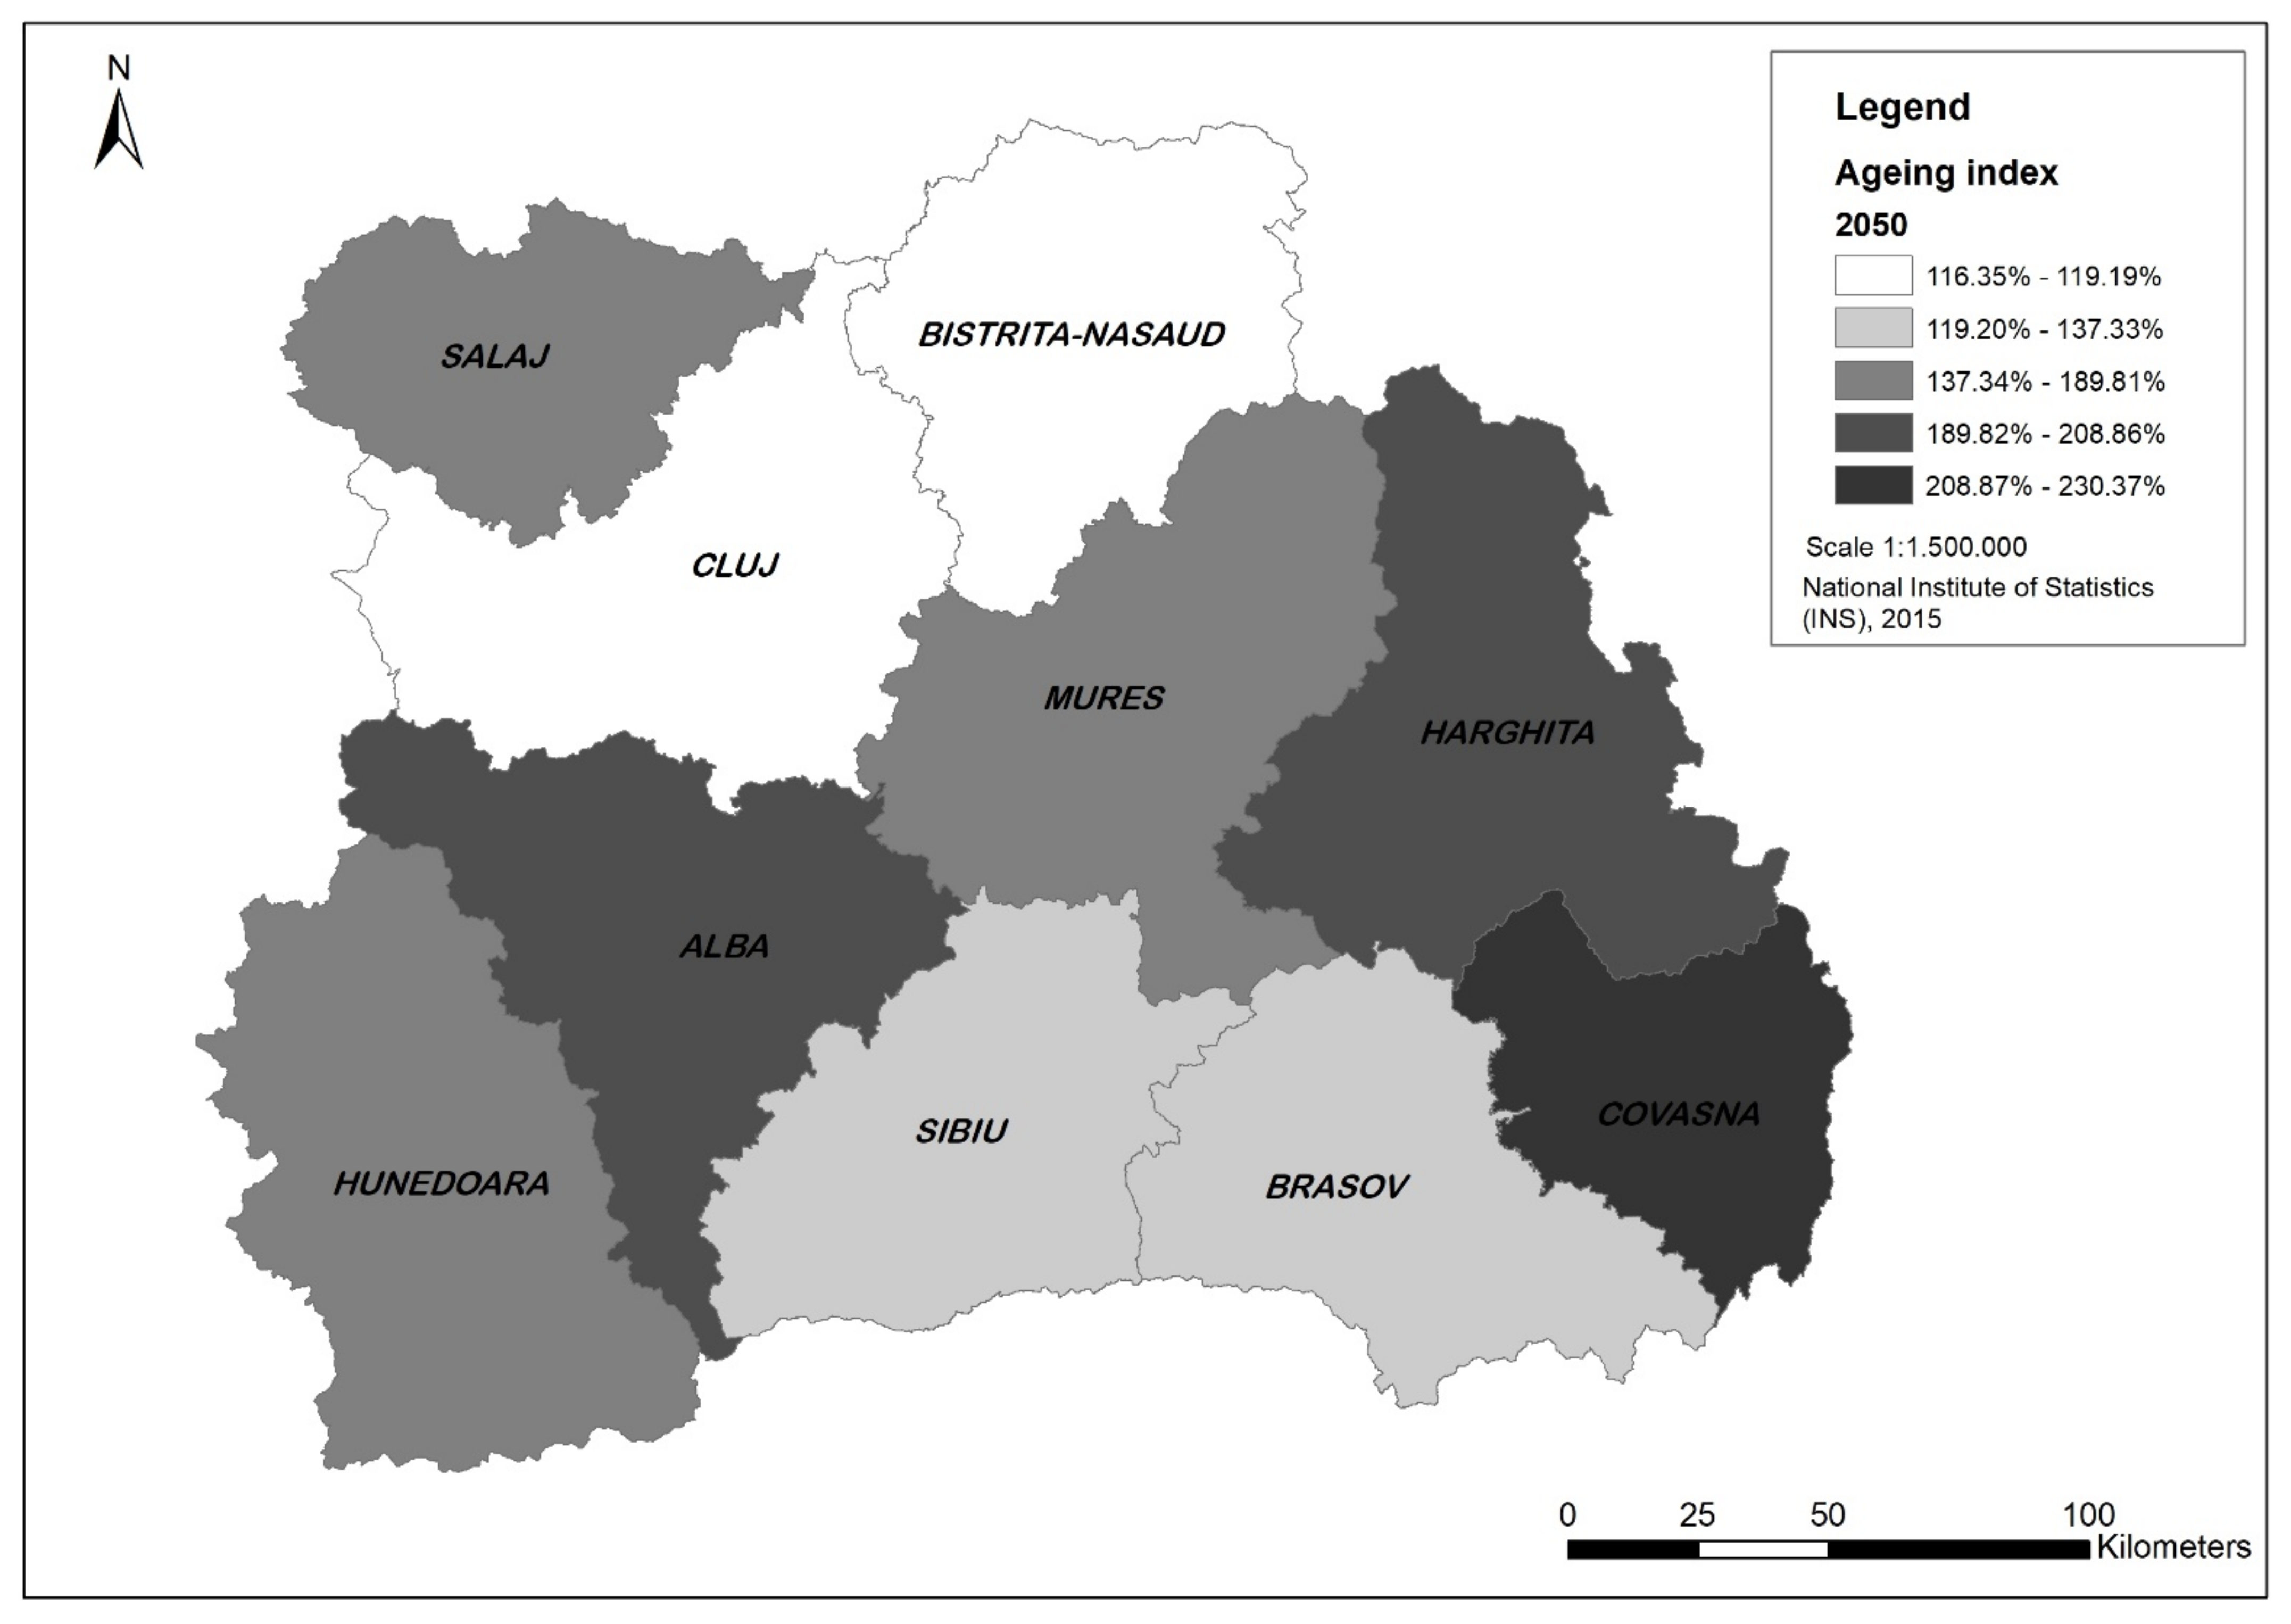
In Romania, we are facing a continuous process of degradation regarding the age structure as we have notice at regional level in urban areas from Transylvania the ageing index highlight a few nuanced tendencies. Figure 4 and Figure 5 shows these findings. The calculation of ageing index displays the proportion of older adult people at counties level which become a proportionally larger share of total population. An important demographic dynamic shows the ageing index at countries level regarding the share of older adults reported to the share of young people.
The top positions in ranking regarding age index up to 200% is visible in the urban areas of counties Covasna, Harghita, and Alba. The ageing index is ranked highest despite the shifting of age structure where the number of the young people will decrease significantly, while the number of older adult people will increase progressively above 200%, like the Alba County with 202.81%, Harghita County with 208.86%, and Covasna County with 230.37%. The proportion of older adult people raise progressive than reaches a decline stage, which will establish after 2050 a slow increase to the detriment of an increased ageing index. These urban areas will be the most affected of ageing shifting and express a major possibility to suffer from a massive depopulation. The behavior of the ageing index depends on population ages so when it increases the life expectancy led to grow.
The middle positions in rankings are found in urban areas of the counties Hunedoara, Mureș, and Sălaj where the ageing index will increase around the year 2030 than the growing path will approaches to the reference values as 189.90% in Hunedoara; 189.92% in Sălaj, and 179.45% in Mureș. The ageing process is more obvious until the year 2030 than due to moderate demographic decline of older adult population and the moderate grow expected from young population share the ageing index is settled to be stabilize around the year 2050 reaching values as 134.41% in urban areas of Brașov and 137.33% in urban areas of Sibiu County.
The bottom positions in ranking are persistent in urban areas from the counties Cluj and Bistrița-Năsăud.
The ageing phenomenon has an increased trend until 2030, since the rise expected from the young population share exceeds the increase in age group 60–65+ years, as a result the ageing index decreases accounting for the values of 119.19% in Bistrița-Năsăud and 116.35% in Cluj. The evolution of ageing index in these urban areas is encouraging giving the chance to reorganize the age structure and to increase the total number of populations contributing to repopulation of other urban areas.
By analyzing the ageing index, we underline the tendency of the older adult group to become a proportionally larger share of total population than young population. As shown previously, the evolution of the ageing index in the interval 2020–2050 clearly shows and increasing share of older adult people, consequently provoking an upward shift in the population age structure.
The ageing process is considered an inevitable process, which increases the share of older adult people changing the age structure of population and on the opposite side decreases the share of young population. This demographic projection is in line with our analysis for the urban areas of Transylvanian counties underling the increasing and decreasing aspect of the older adult population. Population ageing—the increasing share of older persons in the population—is poised to become one of the most significant social transformations of the twenty-first century, with implications for nearly all sectors of society [63]. The decreasing share of older adults is explained by the demographic structures’ deterioration, confirming the undeniable tendency around the year 2050 when the share of older adult people is starting to slowly decrease.
3.4. The Prospective Old-Age Dependency Ratio
Demographic changes in the Transylvania region are also facing the challenges raised by the population dynamics and by new trends in Romania and other European countries. Eurostat projections show that the ageing process, especially the longevity of older adults age group affects the situation of the labor market and forecasts a decline in professional activity in the future. Furthermore, the increase of retirement age demands a larger health service, a range of new social care services and improvement of the health conditions for the older adult people, all these potentially posing a range of economic challenges [64,65,66]. In the Romanian society, the growing number of older adult people and the growth of their social activity is linked on the assumption that the old-age dependency ratio will continue to rise. As this ratio increases, there is a decline in the size of the workforce that is potentially available to take care of the older generations and this has already led to an increased burden on government finances, changes to the statutory retirement age and in some cases even lower levels of pension provision [64].
On behalf of our forecast for ageing process at counties level for Transylvania region we derive the prospective old-age dependency ratio. Displaying the prospective old-age dependency ratio we interfere with an upward path where the share of working age people will decrease in comparison with a growing share of older adult people in the population structure.
In 2020, the old-age dependency ratio (65+ per 15–64) for Romania was 29.5%. The old-age dependency ratio (65+ per 15–64) of Romania increased from 25.1% in 2015 to 29.5% in 2020 [67]. In the Transylvania region (see Table 6) the old-age dependency ratio at the counties level reaches a total value of 26.83% in 2020 and is projected to achieve 73.73% in 2050, thus growing by 46.9%.
In the interval 2020–2030 the old-age dependency ratio is increasing between 21–45% (see Table 6). The possibility of such medium forecasted rates (e.g., 30.21% in Mureș County, 43.93% in Covasna County, 44.37% in Alba County and 45.14% in Brașov County) of old-age dependency ratio in the perspective of 2020 and 2030 shows a significant demographic change in the Transylvania region affected by a decreasing number of working-age people. The decreasing path of working age people is becoming accentuated in the year 2040 where the number of older adult people reaches higher rates as 59.32% in the county Harghita, 59.68% in Alba County, 61.83% in Covasna County, and 62.20% in Brașov County possibly raising the social pressure and stressing the social services. In light of these predicted results for the old-age dependency ratio, due to the steep decrease of the adult active people, we expect that there will be a growing pressure on the social security and pension systems. These will need new policies and different approaches in order to be able to cope with rates such as 87.25% in Brasov County, 91.94% in Covasna county, and 97.59% in Hunedoara County around the year 2050.
The old-age dependency ratio shows a synchronic picture in time, considering the population in different time points of our forecast reference interval 2020–2050. Meanwhile the General Decline Factor introduced in our prediction model shows an asynchronous display, where past demographic trends are introducing effects in the future.
4. Discussion
The Overview of Prediction Model and the Long-Term Effects of Demographic Ageing Process
The process of demographic ageing has an ascending trend and multiple effects being in correlation with other functional factors of a society. First, this demographic process affects the entire society, the mentality of the population, and especially the analyzed area. Therefore, the ageing process is not only a demographic process but also a social process that can be monitored and mitigated.
The demographic prediction used to outline the ageing process in Transylvania region is viable and accurate, based on a Table 5 year observation. The accuracy of the prediction model is established to 90% depending on the data set and 10% depending on regressive GDF. By using the GDF, we outlined the influence of young and working age population in ageing process of the older adult population.
Such methodologies using time series regressions with GDF are applicable to countries, which, as Romania, are facing a post-transition period (Poland, Czech Republic, Bulgaria, Hungary, etc.) and where the ageing process has a long-term effect in all regions of the countries facing a demographic decline.
A similar prediction regarding future population ageing is revealed by Lutz.W (2009) based on new indicators of age and population ageing (60+), the median age of population (MA) and its average age. These new projections clearly indicate that the speed of ageing is expected to accelerate significantly over the coming two decades in virtually all world regions and at the global level [68].
The spreading of the ageing population process will generate a few effects on the urban areas of Transylvania, which are more visible at the functional level of these urban areas.
In this order, according to results of our forecast analyses for the ageing process in Transylvania’s urban regions we can mention a few possible effects:
- The change of population composition structure where the number of older adult people on the long-term is higher compared to young people. The population ageing is not uniform and is influenced by general social process such as falling birth rates and increasing life expectancy, these being primarily the result of the spatial movement of the population [20,69].
- The shift of the young age group in detriment of growing older adults age group when the young people are constrained by social & economic needs to embrace out-migration.
- An ageing society has negative effects related to the total number of populations diming its composition by increasing the number of age group 60–65+ years and urges new changes in social-economic policies.
- Social-Economic adjustments which may refer mainly to older adult people as the raise of retirement age, a reduction of pension benefits, and the equality of retirement age between women and men, the increase of employment age of working people especially for women who have a life expectancy higher than men.
- Influence on internal economy, a lower BIP because of a reduction of the labor force contribution from older adult people. In this case, we can mention about a workforce deficit because the older adult people represent an inactive population. Although the policymakers sustain the undeveloped potential of older adult people to participate actively in economic and social life.
- Pressure on the economy and social policies regarding a higher cost for healthcare and social assistance services. A higher demand for health care and social services on the long-term by coping with new types of services suitable for older adult people.
- Increasing poverty risk for elderly households [52] that are more and more marginalized by the social institutions under pressure. The older adults should be able to remain in their home environment, if possible, where they would be capable of leading their lives as independently as possible with the best possible quality of life leveraging the concepts of “ageing at home” or “ageing in place” [70,71,72].
- Decreasing value for the elderly houses, which became empty and in time their value is depreciating, causing the phenomenon of abandonment, and shrinking.
- Changes due to ageing populations bring new challenges related to the provision of transportation services, mainly since the travel habits and needs of the older adults differ substantially from those of other age groups [72].
5. Conclusions
The ageing phenomenon is a continuous process that affects all active sectors of a society and especially affects the urban landscape, inducing shrinking process of the household, properties and then the shrinkage of the urban area. The phenomenon of shrinking is causing decrease in total number of urban population and deterioration of age structure, which leads to a strong demographic decline and depopulation.
In our study, we have shown that urban areas from Transylvania are undergoing an accelerating ageing process, which is predicted to lead to demographic decline and depopulation.
The predicted population evolution along with the ageing index demonstrate the existence of an upward trend of the older adult population, which increases in time, year by year. At the same time, the young population and active groups are shrinking. These are clear indicators of population ageing. The effects of population ageing are already observed and they in turn lead to the intensification of the ageing process in urban areas and rural areas of the region, in a vicious circle.
The increased number of older adults raises a set of social, economic, and cultural issues and at the same time a set of needs into a society. The healthcare services represent the most important need for older adults along with the social services.
The accentuate ageing process not only modifies the evolution of the total number of urban population but also influence the mentality of a society and induce deterioration of the urban areas which in most cases lead to depopulation.
Moreover, according to our research, the Transylvania region is facing the effects of a demographic decline pattern as the total population decreases, there is decrease in the birth rate, increase in the mortality rate, demographic ageing as shown in this paper, and a negative migration balance [73].
In the urban areas of the Transylvania region, the population ageing phenomenon has the potential to significantly evolve, which makes us believe that in the near future it can lead to “a society of risk” [74] where society is condemned to disappear if cohesive measures and social policies are not taken in time. Given that in Romania the life expectancy is lowering [75], when compared to the other European countries, in this case the ageing process is negatively influencing the already peculiar demographic situation.
However, given that in this stage it is possible already to observe the tendencies of demographic decline and to predict the ageing process and reshape of age population structure.
This demographic projection offers for policy makers the possibility to be able to anticipate the negative trends of the demographic phenomenon and its consequences, providing solid policies at national and regional level to curb its long-term negative effects. The policy makers should strongly emphasize the social and demographic challenges persistent in population dynamics to be able to cope with reliable policies for all the age cohorts.
Author Contributions
All authors, R.Ț., Ș.D. and F.P. contributed equally to the research presented in this paper and to the preparation of the final manuscript. All authors have read and agreed to the published version of the manuscript.
Funding
The present work was funded by the Babes-Bolyai University by using the third author’s (F.P.) doctoral studies grant.
Institutional Review Board Statement
Not applicable.
Informed Consent Statement
Not applicable.
Data Availability Statement
Not applicable.
Conflicts of Interest
The authors declare no conflict of interest.
References
- Kupiszewski, M.; Kupiszewska, D. Projection of Central and East European. In Gesellschaft und Bevolkerung in Mittelund Osteuropa im Umbruch; Fleischhacker, J., Munz, R., Eds.; Demographie Aktuell; Humboldt Universitat: Berlin, Germany, 1998; Volume 13, pp. 22–40. [Google Scholar]
- Kinsella, K.; Velkoff, V. An Ageing World; US Bureau of Census: Washington, DC, USA, 2001.
- Rees, P. Demographic Ageing: The Broad Context, Regional Diversity. In Proceedings of the Conference Paper for Regions for All Ages Conference, Age Concern England, London, UK, 31 March 2003. [Google Scholar]
- Baker, R. Ageing: It’s everyone business. Local Econ. 2003, 18, 284–290. [Google Scholar] [CrossRef]
- Bijak, J.; Kupiszewska, D.; Kupiszewski, M.; Saczuk, K.; Kicinger, A. Population and labour force projections for 27 European countries, 2002–2052: Impact of international migration on population ageing. Eur. J. Popul. Rev. Eur. Démogr. 2007, 23, 1. [Google Scholar] [CrossRef] [PubMed] [Green Version]
- Walford, N.S.; Kurek, S. A comparative analysis of population ageing in urban and rural areas of England and Wales, and Poland over the last three census intervals. Popul. Space Place 2008, 14, 365–386. [Google Scholar] [CrossRef] [Green Version]
- Ogawa, N. Population ageing and its impact upon health resource requirements at government and familial levels in Japan. Ageing Soc. 1989, 9, 383–405. [Google Scholar] [CrossRef]
- Stockdale, A. A review of demographic ageing in the UK: Opportunities for rural research. Popul. Space Place 2009, 17, 204–221. [Google Scholar] [CrossRef]
- Preston, S.H.; Stokes, A. Sources of population ageing in more and less developed countries. Popul. Dev. Rev. 2012, 38, 221–236. [Google Scholar] [CrossRef] [PubMed] [Green Version]
- Komp, K.; Johansson, S. Population ageing in a lifecourse perspective: Developing a conceptual framework. Ageing Soc. 2015, 36, 1937–1960. [Google Scholar] [CrossRef]
- Nagarajan, N.R.; Teixeira, A.A.C.; Silva, S.T. Ageing population: Identifying the determinants of ageing in the least developed countries. Popul. Res. Policy Rev. 2020, 40, 187–210. [Google Scholar] [CrossRef]
- Auer, P.; Fortuny, M. Ageing of the Labour Force in OECD Countries: Economic and Social Consequences; International Labour Office: Geneva, Switzerland, 2002. [Google Scholar]
- Ronald, L. The demographic transition: Three centuries of demographic change. J. Econ. Perspect. 2003, 17, 167–190. [Google Scholar]
- Bloom, D.E.; Canning, D.; Fink, G. Implications of population ageing for economic growth. Oxf. Rev. Econ. Policy 2010, 26, 583–612. [Google Scholar] [CrossRef] [Green Version]
- Hashimoto, K.; Tabata, K. Population ageing, health care, and growth. J. Popul. Econ. 2008, 23, 571–593. [Google Scholar] [CrossRef]
- Harper, S.; Leeson, G. Introducing the journal of population ageing. J. Popul. Ageing 2009, 1, 1–5. [Google Scholar] [CrossRef] [Green Version]
- Murphy, M.J. Demographic determinants of population ageing in Europe since 1850. Popul. Dev. Rev. 2017, 43, 257–283. [Google Scholar] [CrossRef] [Green Version]
- Heffner, K.; Klemens, B.; Solga, B. Challenges of regional development in the context of population ageing. Analysis based on the example of opolskie voivodeship. Sustainability 2019, 11, 5207. [Google Scholar] [CrossRef] [Green Version]
- Stoica, I.-V. The Effects of population ageing on rural areas. Case study: The Sărățele Hydrographic Basin (Buzău Subcarpathians). Ann. Univ. Oradea Ser. Geogr. 2011, 21, 294–302. [Google Scholar]
- Kerbler, B. Population ageing in Slovenia: A spatial perspective. Acta Geogr. Slov. 2015, 55, 303–317. [Google Scholar] [CrossRef] [Green Version]
- Michel, J.-P.; Beattie, B.L.; Finbarr, C.M.; Walston, D.J. Population ageing in Europe. In Geriatric Medicine; Oxford University Press: New York, NY, USA, 2018; pp. 11–17. [Google Scholar]
- Sobczak, E.; Bartniczak, B.; Raszkowski, A. Ageing society and the selected aspects of environmental threats: Evidence from Poland. Sustainability 2020, 12, 4648. [Google Scholar] [CrossRef]
- European Commission. The 2015 Ageing Report; European Commission: Brussels, Belgium, 2015. [Google Scholar]
- Pani-Harreman, K.E.; Bours, G.J.J.W.; Zander, I.; Kempen, G.I.J.M.; van Duren, J.M.A. Definitions, key themes and aspects of “ageing in place”: A scoping review. Ageing Soc. 2020, 41, 2026–2059. [Google Scholar] [CrossRef] [Green Version]
- Demeny, P. A Clouded View of Europe’s Demographic Future. In Vienna Yearbook of Population Research; Austrian Academy of Sciences: Vienna, Austria, 2007. [Google Scholar]
- Steinfuhrer, A.; Haase, A. Demographic change as a future challenge for cities in East Central Europe. Geogr. Ann. Ser. B Hum. Geogr. 2007, 89, 183–195. [Google Scholar] [CrossRef]
- Lutz, W.; Sanderson, W.; Scherbov, S. Global and Regional Population Ageing: How Certain Are We of Its Dimensions? IIASA Interim Report; IIASA: Laxemburg, Austria, 2008. [Google Scholar]
- Ghețău, V. Declinul Demografic Și Viitorul Populației României—O Perspectivă Din 2007 Asupra Populației României Din Secolul 21/the Demographic Decline and the Demographic Future of the Romanian Population. A Perspective from 2007 on Romania’s Population in the 21st Century; Alpha MDN, Centrul de Cercetări Demografice Vladimir Trebici, Institutul Național de Cercetări Economice: Buzău, Romania, 2007.
- Bodogai, S.I.; Cutler, J.S. Ageing in Romania: Research and public policy. Gerontologist 2014, 54, 147–152. [Google Scholar] [CrossRef]
- Lutz, W.; Sanderson, W.; Scherbov, S. The coming acceleration of global population ageing. Nature 2008, 451, 716–719. [Google Scholar] [CrossRef]
- Salvia, R.; Salvati, L.; Quaranta, G. Beyond the transition: Long-term population trends in a disadvantaged region of Southern Europe, 1861–2017. Sustainability 2021, 13, 6636. [Google Scholar] [CrossRef]
- Miyauchi, T.; Setoguchi, S.; Ito, T. Quantitative estimation method for urban areas to develop compact cities in view of unprecedented population decline. Cities 2021, 114, 103151. [Google Scholar] [CrossRef]
- Mykhnenko, V.; Turok, I. East European cities: Patterns of growth and decline. Int. Plan. Stud. 2008, 13, 311–342. [Google Scholar] [CrossRef]
- Steinfuhrer, A.; Bierzynski, A.; Grossmann, K.; Haase, A.; Kabisch, S.; Klusacek, P. Population decline in polish and czech cities during post-socialism? Looking behind the official statistics. Urban Stud. 2010, 47, 2325–2346. [Google Scholar] [CrossRef]
- Verwest, F. Demographic Decline and Local Government Strategies: A Study of Policy Change in the Netherlands. Ph.D. Thesis, Radboud University, Nijmegen, The Netherlands, 2011. [Google Scholar]
- Hospers, G.-J. Coping with shrinkage in Europe’s cities and towns. Urban Des. Int. 2013, 18, 78–89. [Google Scholar] [CrossRef]
- Kvist, J. A framework for social investment strategies: Integrating generational, life course and gender perspectives in the EU social investment strategy. Comp. Eur. Polit. 2015, 13, 131–149. [Google Scholar] [CrossRef]
- Beunena, R.; Meijer, M.; de Vriesc, J. Planning strategies for dealing with population decline: Experiences from the Netherlands. Land Use Policy 2019, 93, 104107. [Google Scholar] [CrossRef]
- Jadwiga, G.; Warych-Juras, A. Suburbanization and migration in Polish metropolitan areas during political transition. Acta Geogr. Slov. 2018, 58, 63–72. [Google Scholar]
- Liu, H.; Ma, L. Spatial pattern and effects of urban coordinated development in China’s urbanization. Sustainability 2021, 12, 2389. [Google Scholar] [CrossRef] [Green Version]
- Dumont, G.-F. Pourquoi s’interesser a la demographie. In Les Enjeux de la Demographie Europenne; Les Publications de la Fondation Guile: Zurich, Switzerland, 2001; pp. 34–46. [Google Scholar]
- Zborowski, A.; Soja, M.; Lobodzinska, A. Population trends in Polish cities—Stagnation, depopulation, or shrinkage? Pr. Geogr. 2012, 130, 7–28. [Google Scholar]
- Nancu, D.V.; Guran-Nica, L.; Persu, M. Demographic ageing in Romanian’s rural area. Hum. Geogr. 2010, 4, 33–42. [Google Scholar]
- Coleman, D.; Rowthorn, R. Who’s afraid of population decline? A critical examination of its consequences. Popul. Dev. Rev. 2011, 37, 217–248. [Google Scholar] [CrossRef] [PubMed]
- Ghețău, V. Drama Noastră Demografică: Populația României la Recensământul din octombrie 2011/Our Demographic Drama: Population of Romania at the Census of 2011; Compania: București, Romania, 2012. [Google Scholar]
- A.D.R.C.—Analiza Demografică a Regiunii Centru. Disparități Geodemografice. Tendințe Și Prognoze, Programul Operațional Regional Centru, Alba Iulia, Romania/Demographic Analysis of the Center Region. Geodemographic Disparities. Trends and Forecasts, Central Regional Operational Program, Alba Iulia, Romania. Available online: http://www.adrcentru.ro/Document_Files/ADStudiiRegionale/00000075/31ycx_Analiza%20si%20prognoza%20demografica.pdf (accessed on 20 June 2020).
- I.N.S.—Institutul Național de Statistică/National Institute of Statistics. Available online: http://statistici.insse.ro:8077/tempo-online/#/pages/tables/insse-table (accessed on 15 June 2020).
- I.N.S.—Institutul Național de Statistică/National Institute of Statistics. Available online: https://insse.ro/cms/files/Publicatii_2017/82.Repere_economice_si_sociale_regionale_Statistica_teritoriala/Repere_economice_si_sociale_regionale_Statistica_teritoriala_2017.pdf (accessed on 20 June 2020).
- Hyndman, R.J.; Athanasopoulos, G. Forecasting: Principles and Practice, 2nd ed.; OTexts: Melbourne, VIC, Australia, 2018; Available online: https://otexts.com/fpp2/ (accessed on 29 June 2020).
- Hong, H.G.; Schneider, T. Shrinkonomics: Lessons from Japan. Financ. Dev. 2020, 57, 20–23. [Google Scholar]
- Eurostat—European Statistics. Available online: https://ec.europa.eu/eurostat/databrowser/view/tps00198/default/table?lang=en (accessed on 4 August 2021).
- Rotariu, T. Îmbătrânirea Demografică și Unele Efecte Sociale ale ei/The Ageing Population and Some Social Effects of It. Sociol. Românească 2006, 4, 76–93. [Google Scholar]
- Maresova, P.; Mohelska, H.; Kuca, K. Economics aspects of ageing population. Proc. Econ. Financ. 2015, 23, 534–538. [Google Scholar] [CrossRef] [Green Version]
- Eurostat—European Statistics. Ageing Europe—Statistics on Population Developments. Available online: https://ec.europa.eu/eurostat/statistics-explained/index.php?title=Ageing_Europe_-_statistics_on_population_developments (accessed on 15 June 2020).
- Population Division, Department of Economic and Social Affairs, United Nations. World Population Prospects 2019: Highlights; United Nations: New York, NY, USA, 2019. [Google Scholar]
- Barthelemy, P.; Granier, R.; Martine, R. Demography and Society; Institutul European: Iași, România, 2009. [Google Scholar]
- I.N.S.—Institutul Național de Statistică/National Institute of Statistics. Proiectarea Populației României în Profil Teritorial La Orizontul Anului 2060/Projection of the Romanian Population in Territorial Profile at the Horizon of 2060. Available online: https://insse.ro/cms/sites/default/files/field/publicatii/proiectarea_populatiei_romaniei_in_profil_teritorial_la_orizotul_2060.pdf (accessed on 4 August 2021).
- C.N.P.V.—Consilul Național al Persoanelor Vârstnice/National Council of the Older Adult People. Îmbătrânirea Populației în Context European și în România-Perspective/Ageing Population in the European Context and in Romania-Perspectives. Available online: http://cnpv.ro/wp-content/uploads/2020/03/Imbatranire.pdf (accessed on 4 August 2021).
- Carchano, M.; Carrasco, I.; Castillo, S.; Garcia-Cortijo, M.C. The social economy as a factor of economic development and resilience of population in rural areas. A study of mediating effects in Castilla-La Mancha (Spain). Sustainability 2021, 13, 5544. [Google Scholar] [CrossRef]
- Johnson, K.M.; Field, L.M.; Poston, D.L., Jr. More deaths than births: Subnational natural decrease in Europe and the United States. Popul. Dev. Rev. 2015, 41, 651–680. [Google Scholar] [CrossRef]
- Haub, C.; Toshino, K. World Population Data Sheet; Population Reference Bureau: Washington, DC, USA, 2014. [Google Scholar]
- B.D.P.—Base de Datos Portugal Contenporaneo. Available online: https://www.pordata.pt/en/Europe/Ageing+index-1609 (accessed on 26 June 2020).
- United Nations. World Population Ageing; Department of Economic and Social Affairs: New York, NY, USA, 2015. [Google Scholar]
- Eurostat. Ageing Europe. Looking at the Lives of Older People in the EU 2020. Available online: https://ec.europa.eu/eurostat/documents/3217494/11478057/KS-02-20-655-EN-N.pdf/9b09606c-d4e8-4c33-63d2-3b20d5c19c91?t=1604055531000 (accessed on 5 August 2021).
- Stjernberg, M.; Penje, O. Prospective Old-Age Dependency Ratio (POADR) in Nordic Municipalities 2019. Available online: https://nordregio.org/maps/prospective-old-age-dependency-ratio-2019/ (accessed on 4 August 2021).
- Litra, A. Economic Effects of demographic Ageing. Bull. Transylv. Univ. Brașov Ser. V Econ. Sci. 2014, 7, 229–234. [Google Scholar]
- World Data Atlas. Romania Old-Age Dependency Ratio (65+ Per 15–64), 1950–2020. Available online: https://knoema.com/atlas/Romania/topics/Demographics/Dependency-Ratios/Old-age-dependency-ratio-65-per-15-64 (accessed on 5 August 2021).
- Lutz, W. The demography of future global population ageing: Indicators, uncertainty, and educational composition. Popul. Dev. Rev. 2009, 35, 357–365. [Google Scholar] [CrossRef]
- Wichowska, A. Economic aspects of shrinking cities in Poland in the context of regional sustainable development. Sustainability 2021, 13, 3104. [Google Scholar] [CrossRef]
- Costa-Font, J.; David, E.; Mascarilla-Miro, O. Ageing in place’? Exploring older adults’ housing preferences in Spain. Urban Stud. 2009, 46, 295–316. [Google Scholar] [CrossRef]
- Kerbler, B. Ageing at home with the help of information and communication technologies. Acta Geogr. Slov. 2012, 52, 165–188. [Google Scholar] [CrossRef] [Green Version]
- Borowska-Stefanska, M.; Wisniewski, S.; Kowalski, M. Daily mobility of the elderly: An example from Lodz, Poland. Acta Geogr. Slov. 2020, 60, 57–70. [Google Scholar] [CrossRef]
- Jemna, D.; Pintilescu, C.; Turturean, C. Population in Romania within the United Europe. An. Științifice Univ. “Alexandru Ioan Cuza”—Știinte Econ. (1954–2015) 2010, 57, 329–340. [Google Scholar]
- Ulrich, B. The Risk Society: Towards a New Modernity; Paidos: Barcelona, Spain, 2006. [Google Scholar]
- Eurostat—European Statistics. Available online: https://ec.europa.eu/eurostat/databrowser/view/demo_mlexpec/default/table?lang=en (accessed on 10 August 2021).
Figure 1.
Geographical position of Transylvania region.

Figure 2.
Older adults population evolution between 2015 and 2050 (% compared to 2015).

Figure 3.
Older adults population evolution between 2020 and 2050.

Figure 4.
Ageing index between 2020–2050 in Transylvania region.

Figure 5.
Ageing index 2050 in Transylvania region.


Table 1.
Older adults age group (60–65+ years) evolution between 2015 and 2019.
| County Name | 2015 (No. of Inhabitants) | 2016 (No. of Inhabitants) | 2017 (No. of Inhabitants) | 2018 (No. of Inhabitants) | 2019 (No. of Inhabitants) |
|---|---|---|---|---|---|
| Alba | 47.294 | 49.114 | 50.817 | 52.421 | 53.714 |
| Bistrița-Năsăud | 20.184 | 21.514 | 22.809 | 23.995 | 24.994 |
| Brașov | 99.419 | 103.896 | 108.125 | 111.842 | 115.122 |
| Cluj | 103.520 | 107.019 | 110.226 | 113.215 | 115.636 |
| Covasna | 23.410 | 24.424 | 25.316 | 26.058 | 26.597 |
| Harghita | 30.504 | 31.746 | 32.840 | 33.755 | 34.591 |
| Hunedoara | 76.901 | 78.706 | 80.170 | 81.619 | 82.898 |
| Mureș | 69.247 | 71.335 | 73.208 | 74.885 | 76.288 |
| Sălaj | 16.775 | 17.728 | 18.719 | 19.620 | 20.356 |
| Sibiu | 65.969 | 68.515 | 70.848 | 73.068 | 74.785 |
| Total | 553.223 | 573.997 | 593.078 | 610.478 | 624.981 |
Table 2.
Young age group (0–14 years) evolution between 2015 and 2019.
| County Name | 2015 (No. of Inhabitants) | 2016 (No. of Inhabitants) | 2017 (No. of Inhabitants) | 2018 (No. of Inhabitants) | 2019 (No. of Inhabitants) |
|---|---|---|---|---|---|
| Alba | 28.858 | 28.807 | 28.627 | 28.744 | 28.668 |
| Bistrița-Năsăud | 18.265 | 18.621 | 18.791 | 19.137 | 19.381 |
| Brașov | 55.340 | 56.270 | 57.253 | 58.246 | 59.313 |
| Cluj | 57.657 | 58.656 | 59.615 | 60.855 | 62.031 |
| Covasna | 15.522 | 15.348 | 15.146 | 15.102 | 15.042 |
| Harghita | 20.282 | 20.123 | 19.989 | 19.968 | 19.856 |
| Hunedoara | 43.114 | 42.690 | 42.280 | 42.191 | 41.982 |
| Mureș | 40.189 | 39.995 | 39.988 | 39.947 | 39.849 |
| Sălaj | 14.357 | 14.297 | 14.262 | 14.267 | 14.373 |
| Sibiu | 38.349 | 38.661 | 38.946 | 39.480 | 39.830 |
| Total | 331.933 | 333.468 | 334.897 | 337.937 | 340.325 |
Table 3.
Adult age group (15–59 years) evolution between 2015 and 2019.
| County Name | 2015 (No. of Inhabitants) | 2016 (No. of Inhabitants) | 2017 (No. of Inhabitants) | 2018 (No. of Inhabitants) | 2019 (No. of Inhabitants) |
|---|---|---|---|---|---|
| Alba | 120.627 | 117.977 | 114.988 | 113.050 | 111.095 |
| Bistrița-Năsăud | 69.329 | 68.430 | 66.978 | 66.115 | 65.411 |
| Brașov | 246.043 | 240.094 | 233.293 | 229.192 | 225.514 |
| Cluj | 308.972 | 303.607 | 298.073 | 294.466 | 291.836 |
| Covasna | 61.030 | 59.743 | 58.142 | 56.993 | 55.986 |
| Harghita | 82.505 | 80.676 | 78.678 | 77.181 | 75.750 |
| Hunedoara | 187.313 | 182.544 | 176.876 | 173.499 | 169.358 |
| Mureș | 166.976 | 163.399 | 159.575 | 156.352 | 153.259 |
| Sălaj | 56.718 | 55.459 | 53.592 | 52.929 | 51.778 |
| Sibiu | 165.548 | 162.562 | 159.384 | 157.073 | 155.637 |
| Total | 1.465.061 | 1.434.491 | 1.399.579 | 1.376.850 | 1.355.624 |
Table 4.
Older adults population evolution between 2020–2050 based on General Decline Factor.
| County Name | 2020% | 2025% | 2030% | 2035% | 2040% | 2045% | 2050% |
|---|---|---|---|---|---|---|---|
| Alba | 13.73 | 25.56 | 26.67 | 30.21 | 28.70 | 25.15 | 19.55 |
| Bistrița-Năsăud | 26.41 | 50.43 | 64.46 | 72.70 | 76.98 | 77.30 | 73.65 |
| Brașov | 16.30 | 30.59 | 36.71 | 38.81 | 38.47 | 35.70 | 30.05 |
| Cluj | 12.95 | 24.05 | 27.57 | 27.66 | 25.81 | 22.03 | 16.32 |
| Covasna | 13.75 | 25.29 | 29.16 | 29.51 | 27.85 | 24.19 | 18.52 |
| Harghita | 14.32 | 26.64 | 31.16 | 32.01 | 30.74 | 27.35 | 21.83 |
| Hunedoara | 6.56 | 11.59 | 10.19 | 6.45 | 1.74 | 3.95 | −10.62 |
| Mureș | 10.05 | 18.32 | 19.54 | 17.84 | 14.65 | 9.97 | 3.81 |
| Sălaj | 23.52 | 45.05 | 57.10 | 63.79 | 66.92 | 66.47 | 62.46 |
| Sibiu | 13.60 | 25.30 | 29.31 | 29.78 | 28.21 | 24.63 | 19.01 |
| Average (%) | 15.12 | 28.28 | 33.19 | 34.88 | 34.01 | 31.67 | 25.46 |
Table 5.
General Decline Factor defined for the older adult age group.
| GDF Value | Years |
|---|---|
| 2020 ÷ 2024 | |
| 2025 ÷ 2050 |
Table 6.
The prospective old-age dependency ratio for 2020–2050.
| County Name | 2020% | 2030% | 2040% | 2050% |
|---|---|---|---|---|
| Alba | 29.65 | 44.37 | 59.68 | 81.54 |
| Bistrița-Năsăud | 21.26 | 32.22 | 40.12 | 45.93 |
| Brașov | 29.23 | 45.14 | 62.20 | 87.25 |
| Cluj | 23.93 | 31.98 | 37.65 | 42.44 |
| Covasna | 28.44 | 43.93 | 61.83 | 91.94 |
| Harghita | 27.94 | 42.79 | 59.32 | 85.36 |
| Hunedoara | 28.92 | 41.13 | 57.60 | 97.59 |
| Mureș | 30.21 | 42.63 | 55.86 | 76.73 |
| Sălaj | 21.59 | 36.29 | 52.46 | 76.01 |
| Sibiu | 27.15 | 37.38 | 45.21 | 52.52 |
| Average | 26.83 | 39.79 | 53.19 | 73.73 |
Publisher’s Note: MDPI stays neutral with regard to jurisdictional claims in published maps and institutional affiliations. |
© 2021 by the authors. Licensee MDPI, Basel, Switzerland. This article is an open access article distributed under the terms and conditions of the Creative Commons Attribution (CC BY) license (https://creativecommons.org/licenses/by/4.0/).
Share and Cite
MDPI and ACS Style
Țăruș, R.; Dezsi, Ș.; Pop, F. Ageing Urban Population Prognostic between 2020 and 2050 in Transylvania Region (Romania). Sustainability 2021, 13, 9940. https://0-doi-org.brum.beds.ac.uk/10.3390/su13179940
AMA Style
Țăruș R, Dezsi Ș, Pop F. Ageing Urban Population Prognostic between 2020 and 2050 in Transylvania Region (Romania). Sustainability. 2021; 13(17):9940. https://0-doi-org.brum.beds.ac.uk/10.3390/su13179940
Chicago/Turabian StyleȚăruș, Raisa, Ștefan Dezsi, and Florin Pop. 2021. "Ageing Urban Population Prognostic between 2020 and 2050 in Transylvania Region (Romania)" Sustainability 13, no. 17: 9940. https://0-doi-org.brum.beds.ac.uk/10.3390/su13179940
Note that from the first issue of 2016, this journal uses article numbers instead of page numbers. See further details here.