
Integrated Assessments of Meteorological Hazards across the Qinghai-Tibet Plateau of China


1
Laboratory for Climate Studies, National Climate Center, China Meteorological Administration, Beijing 100081, China
2
Key Laboratory of Environmental Change and Natural Disasters, Ministry of Education, Beijing Normal University, Beijing 100875, China
3
Faculty of Geographical Science, Academy of Disaster Reduction and Emergency Management, Beijing Normal University, Beijing 100875, China
4
State Key Laboratory of Earth Surface Processes and Resource Ecology, Beijing Normal University, Beijing 100875, China
5
Key Laboratory of Drought-Flood Disasters in Plateau and Basin of Sichuan Province, Sichuan Climate Center, Chengdu 610072, China
*
Author to whom correspondence should be addressed.
Sustainability 2021, 13(18), 10402; https://0-doi-org.brum.beds.ac.uk/10.3390/su131810402
Submission received: 21 August 2021
/
Revised: 9 September 2021
/
Accepted: 10 September 2021
/
Published: 17 September 2021
(This article belongs to the Special Issue Sustainability with Changing Climate and Extremes)
Abstract
:Recent decades have witnessed accelerated climate changes across the Qinghai-Tibet Plateau (QTP) and elevated socioeconomic exposure to meteorological hazards. The QTP is called the “the third pole”, exerting remarkable impact on environmental changes in its surrounding regions. While few reports are available for addressing multi-hazard risks over the QTP, we develop an integrated indicator system involving multiple meteorological hazards, i.e., droughts, rainstorms, snowstorms and hailstorms, investigating the spatiotemporal patterns of major hazards over the QTP. The hazard zones of droughts and rainstorms are identified in the southern Gangdise Mountains, the South Tibet Valley, the eastern Nyenchen-Tanglha Mountains, the Hengduan Mountains and West Sichuan Basin. Snowstorm hazard zones distribute in the Himalayas, the Bayan Har Mountains and the central Nyenchen-Tanglha Mountains, while hailstorm hazard zones cluster in central part of the QTP. Since the 21st century, intensified rainstorms are detectable in the densely populated cities of Xining and Lhasa and their adjacent areas, while amplified droughts are observed in grain production areas of the South Tibet Valley and the Hengduan Mountains. Snowstorm hazards show large interannual variations and an increase in pastoral areas, although the overall trend is declining slightly. The frequency of hailstorms gradually decreases in human settlements due to thermal and landscape effects. Mapping meteorological hazards regionalization could help to understand climate risks in the QTP, and provide scientific reference for human adaptation to climate changes in highly sensitive areas.
1. Introduction
Due to drastic climate change and the expansion of socioeconomic exposure, the disaster-related losses due to meteorological hazards have been increasing rapidly in recent decades [1,2]. The Qinghai-Tibet Plateau (QTP) is known as the “third pole”, a region highly sensitive to global warming. Over the past 50 years, warming magnitude of the QTP is twice as high as the global average [3,4]. A warming climate has changed the thermodynamic and kinetic conditions of the QTP [5], triggering an increase in the intensity, frequency and duration of meteorological hazards [6,7,8]. Snowstorms, along with low temperatures and strong winds, become one of the major hazards in the QTP that could have serious negative impacts on animal husbandry, industry, agriculture and transportation [9,10,11,12]. Climate projections indicate that snowstorms will continue to intensify with uncertainties and fluctuations throughout the decades to come [13,14]. Meteorological droughts directly affect the growth of plants, forests and crops in the QTP [15,16], causing decreased productivity and environmental degradation [17,18,19]. Rainstorms, as well as relevant geological hazards, pose a serious threat to human life, transportation and infrastructure, leading to serious casualties and traffic disruptions. Hailstorms are common disastrous hazards in the plateau and cause serious damages to buildings and crops [20]. Although the occurrence frequency of hailstorms decreases in the QTP [21,22], the overall intensity and economic losses are still increasing remarkably [23,24,25].
Previous studies indicate that single hazard assessment tends to underestimate the actual hazard intensity [26], which confirms the necessity and significance for multi-hazard risk assessment. In order to quantify the combined effects of the compound meteorological hazards in both space and time, a range of assessment methods have been developed, such as Bayesian networks and information diffusion theory [27,28], as well as some numerical and statistical analysis methods [29]. It should be noted that the standing studies about natural hazards over the QTP mainly focus on the mechanisms behind an individual hazard [30,31,32,33]. Therefore, an integrated assessment of multiple hazards and their potential risks are of great significance for disaster reduction and climate risk management in the coming decades.
In this study, we focus on the spatial patterns of major meteorological hazards in the QTP, i.e., droughts, rainstorms, snowstorms and hailstorms. By identifying the changes in the spatial extent of hazard zones, we analyze the historical evolution of the population exposure, and further estimate the potential trends of climate risks across the QTP. We attempt to address the following three scientific issues: (1) What is the spatial pattern of the major meteorological hazards across the QTP? (2) How do we evaluate the integrated intensity and socioeconomic impacts of meteorological hazards? (3) Where will be the hotspots of climate risks in the QTP?
2. Data and Methods
2.1. The Study Region
The QTP is known as the “third pole” and the highest plateau of the world, spanning 31 longitudes and 13 latitudes with a total area of 2.6 million km2. The QTP could be subdivided into six geomorphic regions, i.e., the Northern Tibet Plateau, the South Tibet Valley, the Qaidam Basin, the Qilian Mountains, the Qinghai Plateau and the West Sichuan Basin, covering the entire Tibet province and parts of Qinghai, Xinjiang, Gansu, Sichuan and Yunnan Provinces (Figure 1). The population of the QTP is mainly distributed in the South Tibet Valley, the West Sichuan Plateau, and Xining city as well as its surrounding areas. With an average elevation of more than 4000 m, the QTP has a low population density and an undeveloped regional economy. Human activities are mainly in the valley areas and are highly sensitive to meteorological hazards. In the backdrop of climate warming, the frequency and intensity of meteorological hazards are rising over the QTP, posing serious threats to local people, primary industries and vulnerable infrastructures.
The historical disaster database covering the period from 2001 to 2019 is sourced from the China Meteorological Administration. The dataset contains about 4000 disaster records in the QTP at county level. These meteorological disasters have significant negative impacts on human well-being, causing a total of 36.8 million victims and direct economic losses of RMB 36.1 billion yuan. Droughts cause the largest affected population with an annual average of 783,000 people, accounting for 40.5% of the total victims. The population affected by hailstorms, rainstorms and snowstorms accounts for 21.2%, 19.4% and 18.9% of the total, respectively. In terms of direct economic losses, rainstorms cause the largest number, accounting for 38.7% of the total. The economic losses caused by droughts, snowstorms and hailstorms account for 29.4%, 16.2% and 15.7% of the total, respectively.
2.2. Data
The data applied in the research include meteorological observation data, geographic information data, meteorological disaster records and socioeconomic data. Meteorological data include daily temperature, precipitation, weather phenomena, snow depth, wind speed, and evaporation at 246 meteorological stations in QTP, covering the period from 2001–2019. The meteorological data are sourced from the China Meteorological Administration (CMA), available online: http://data.cma.cn/ (accessed on 21 August 2021).
Geographic information data of the QTP is sourced from the National Geomatics Center of China (NGCC). The dataset contains the basic geographic information of the QTP, including administrative boundaries, hydrographic network, land cover, and topographic data. Available online: http://www.ngcc.cn/ (accessed on 21 August 2021).
The meteorological disaster records are extracted from the China Meteorological Disaster Yearbook from 2001 to 2019 released by CMA, containing the records of droughts, rainstorms and floods, typhoon, hailstorms, chilling damage and their socioeconomic impacts.
The gridded datasets of population and GDP of China are released by the Institute of Geographic Sciences and Natural Resources Research, CAS, with a spatial resolution of 1 km. Available online: https://www.resdc.cn/ (accessed on 21 August 2021).
2.3. Methods
2.3.1. Indicator System of Hazard Assessments
Hazard assessments refer to a comprehensive analysis of the natural characteristics such as intensity, frequency and duration of each hazard. The evaluation steps include indicator system development, data normalization, weight coefficient determination, integrated assessment modeling, and geographic mapping.
An indicator system for hazard assessment in the QTP is designed based on the annual expected value of various indices (Table 1). The classification criteria of specific indicators are listed in Table 1. The assessment of meteorological droughts selects drought days, the longest duration of drought, and the accumulated intensity as indices. Rainstorm assessment selects rainstorm days (daily rainfall >20 mm), accumulated rainfall, and maximum 24-h rainfall as indices. Snowstorm assessment selects accumulated snowfall, snow days, and maximum snow depth as indices. Hailstorm assessment selects gale days and hail days as indices. The hazard levels are designated by referring to the spatial average and standard deviation of each index in QTP.
For meteorological droughts, we apply a sliding 30-day SPI to identify drought days as well as its intensity in the growing season, as detailed in Section 2.3.2. For rainstorms, these indices are commonly applied in the daily operations of hazard monitoring. The reason why the threshold of a rainstorm day is defined as 20 mm is that daily precipitation of 20 mm could trigger geological hazards in mountain areas, according to the historical disaster records of the QTP. For snowstorms, the indices selected are major contributors to socioeconomic impacts, in which the snow cover days and maximum snow depth seriously threaten local transportation, livestock and infrastructures. For hailstorms, due to the lack of hailstone and lightning observation, the number of gale days and hail days are selected as two simple indicators to identify hazard zones.
2.3.2. Calculation of Meteorological Droughts
The precipitation in the QTP is subject to significant spatial heterogeneity. The annual precipitation in the northern part of the Kunlun Mountains is less than 100 mm, while in the Hengduan Mountains region is more than 800 mm. According to the climatic characteristics of the QTP, the region with annual precipitation less than 200 mm is defined as permanent arid region, which lacks the possibility of meteorological droughts. Additionally, the QTP has distinct dry and wet seasons, and the growing period of crops, forage grass and vegetation are concentrated in the rainy season. Hence, the hazard assessment of meteorological droughts mainly focuses on the period from April to October, and the annual expected drought days and other indices specifically refer to the rainy season.
The daily drought index is defined as the standardized precipitation index (SPI) of the last 30 days, which is calculated based on a sliding 30-day window of historical daily precipitation data. Daily SPI ≤ −0.5 has been set as the threshold of meteorological drought, and the indices of drought days, the longest consecutive drought days and accumulated drought intensity are calculated accordingly.
2.3.3. Calculation of Single Hazard Index
An assessment model of hazard index is designed based on the deviation of each index, so as to evaluate the intensity level of a meteorological hazard. The formula is shown in Equation (1).
wherein, stands for hazard value, is the normalized value of each index. is the standard deviation of . stands for hazard index whose initial value is set as 5, and take the multiple of standard deviation (STD) as steps. For instance, H = 6.0 denotes 1 STD above the mean, while H = 4.5 denotes 0.5 STD less than the mean.
A hazard index above 6.0 is set to represent a high hazard level, a hazard index between 5.0 to 6 represents a moderate hazard level, a hazard index between 4.0 to 5.0 represents a low hazard level, and a hazard index below 4.0 represents a very low hazard level. In this way, the hazard level of rainstorms, droughts, snowstorms and hailstorms across the QTP are evaluated, respectively.
2.3.4. Calculation of Multi-Hazard Index
The historical affected population and economic losses of meteorological hazards are applied to determine the weight coefficients, then a multi-hazard index is developed on each hazard index and its weight coefficients, shown in Equation (2). The index indicates the integrated hazard level of four major meteorological hazards across the QTP. denotes multi-hazard index, denotes drought hazard index, denotes rainstorm hazard index, denotes snowstorm hazard index, and denotes hailstorm hazard index. The weight coefficients of a, b, c and d are determined by the percentage of total affected population and economic losses of each hazard in the QTP from 2001 to 2019 (shown in Section 2.1). For example, the total population affected by droughts accounts for 40.5% of all hazards, while the total economic losses accounts for 29.4% of all hazards. Then the average value of 35% is taken as the weight coefficient of drought hazard index. According to this rule, the weight coefficients of drought, rainstorm, snowstorm and hailstorm are 0.35, 0.29, 0.18 and 0.18, respectively.
3. Results
3.1. Meteorological Droughts
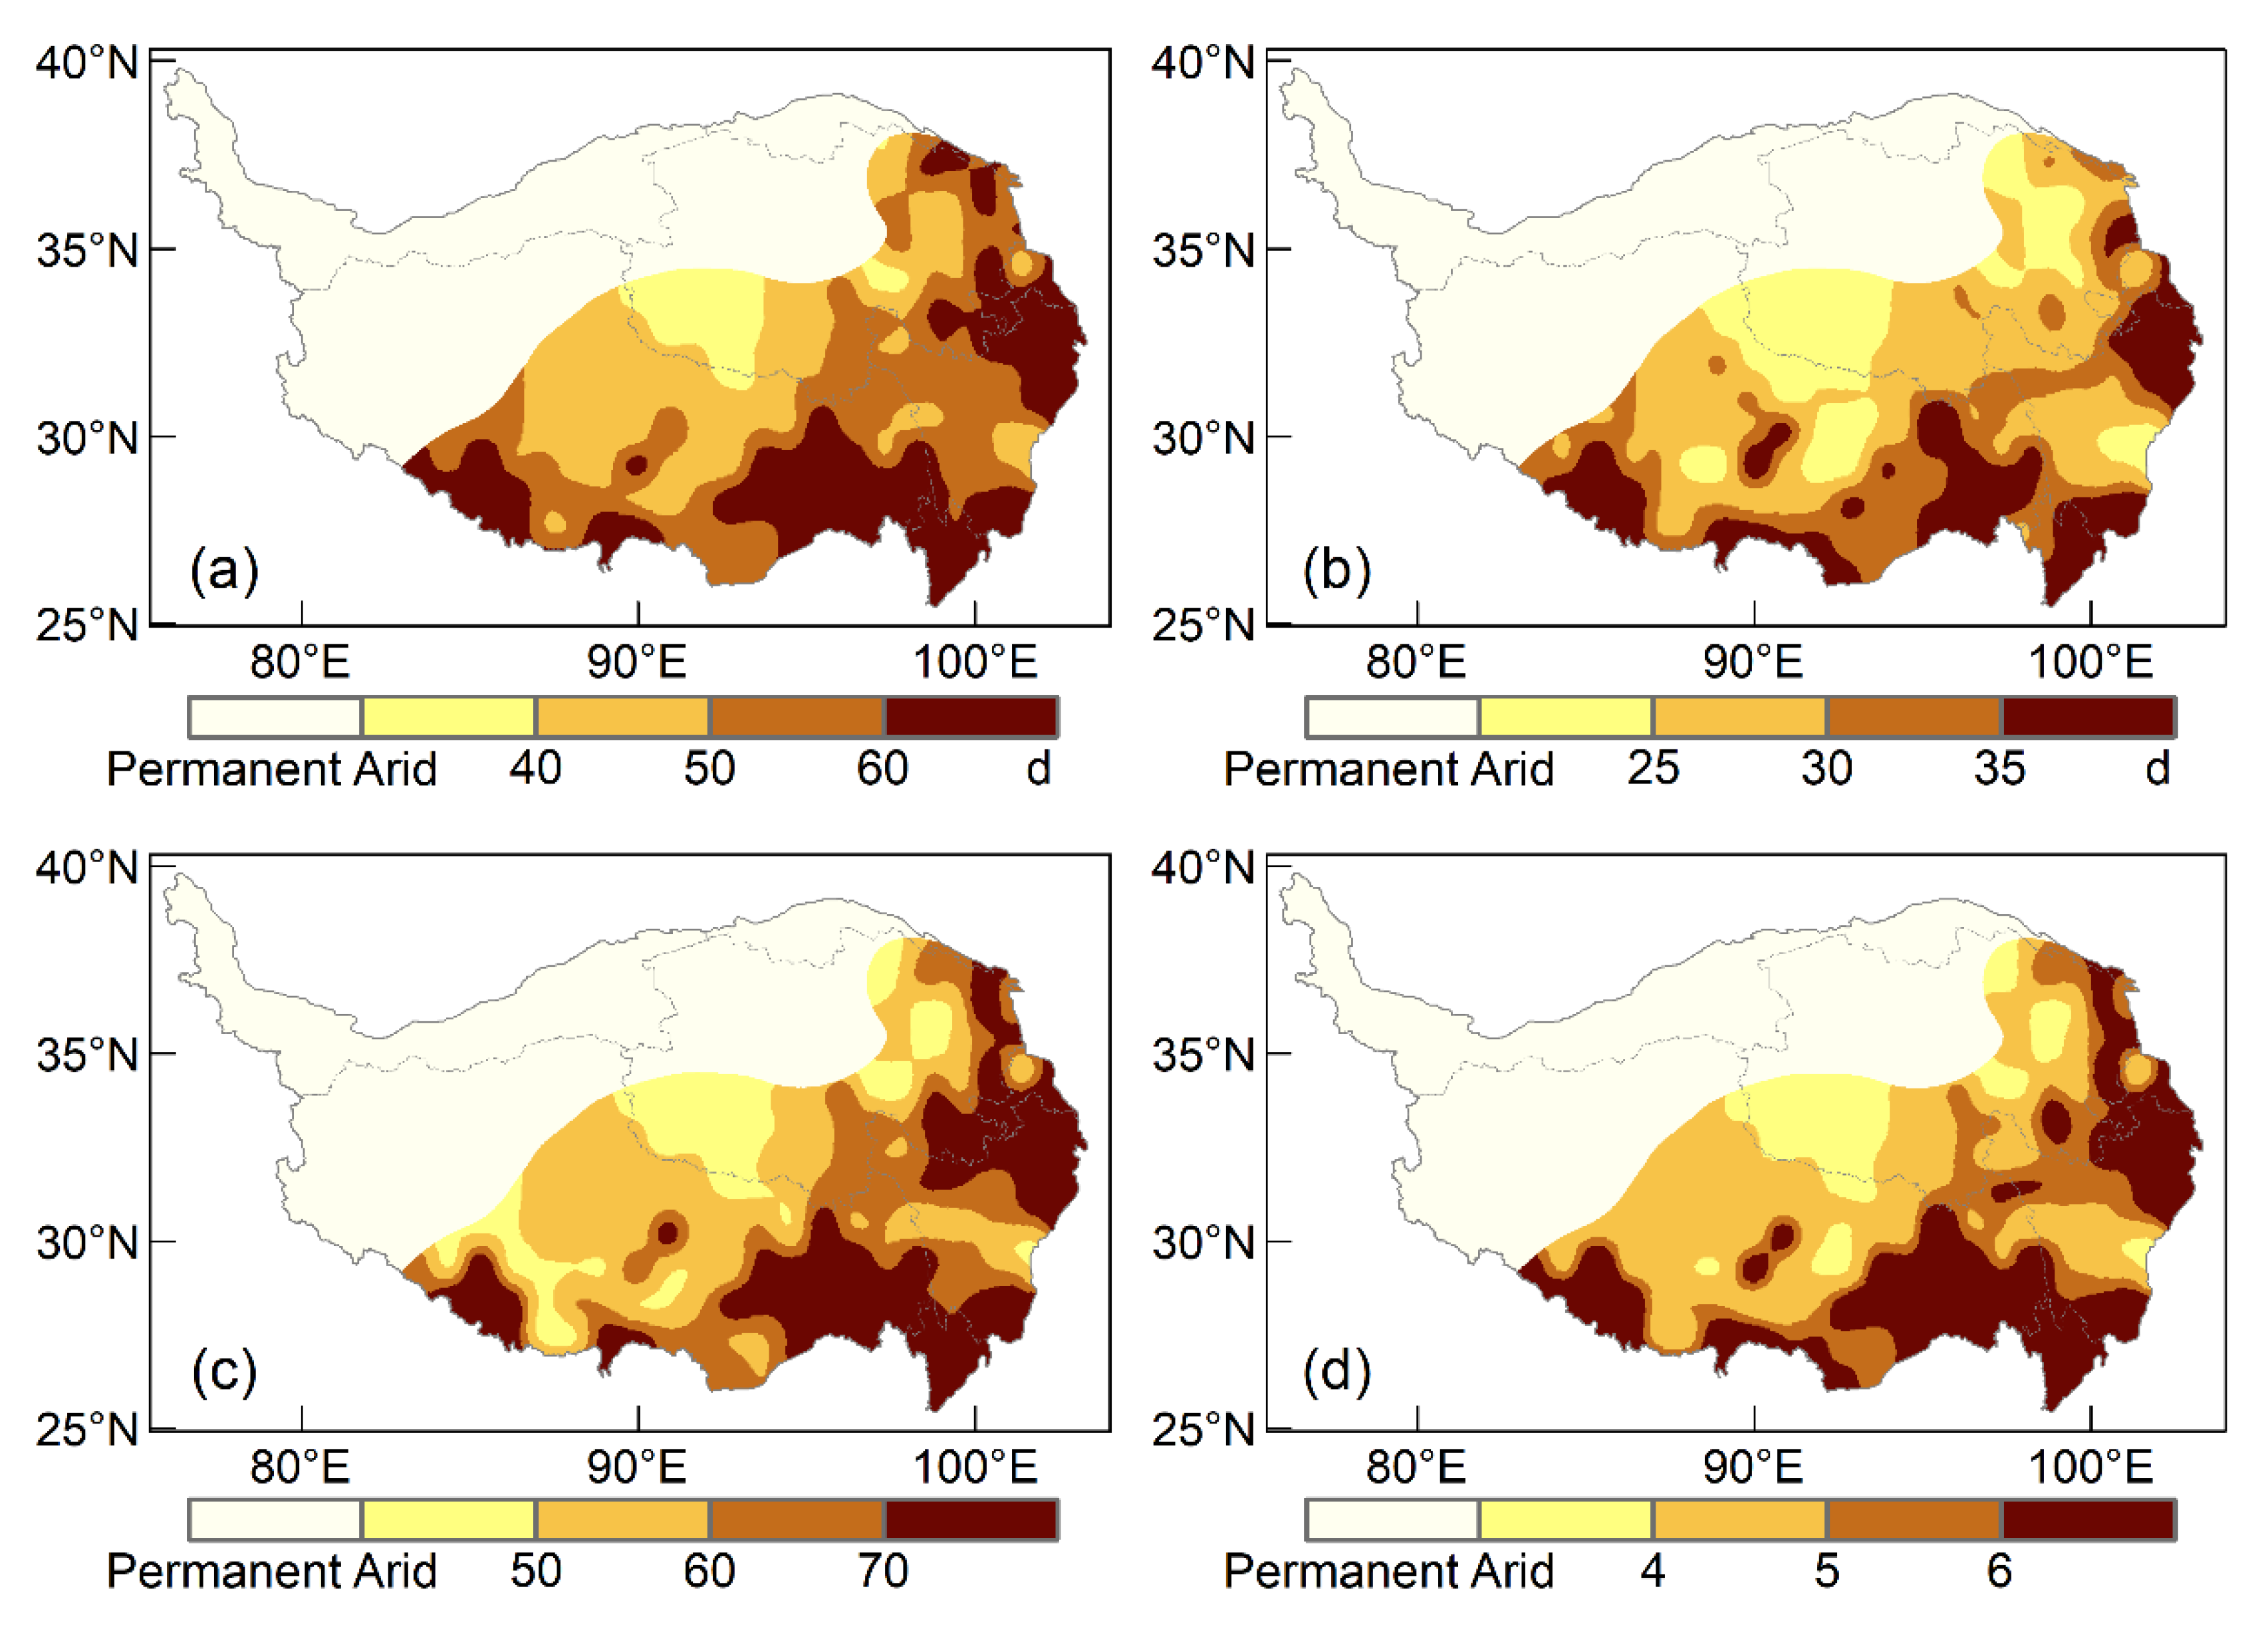
Historical observations suggest that the drought hazard zones are mainly distributed in the South Tibet Valley, the Nianqing-Tanggula Mountains, the Hengduan Mountains, Western Sichuan Plateau and Songpan Plateau, among which the prefectures of Xigaze, Nyingchi, Diqing, Nujiang and Aba are expected to have drought days >60 d per year (Figure 2a). In terms of the longest consecutive drought days, the observations indicate consecutive drought days >30 d in the South Tibet Valley, Hengduan Mountain Area and Songpan Plateau at annual expected (Figure 2b). The accumulated drought intensity is the sum of the absolute value of the daily SPI index during drought days, and represents the total intensity of meteorological droughts. The areas with high drought intensity mainly distribute in the Nianqing-Tanggula Mountains, the Hengduan Mountains and SongPan Plateau (Figure 2c). Drought hazard index (DHI) is an integrated index based on the above three indices. The areas with DHI ≥ 6 (1 STD above the average) are identified as hazard zones, and totally account for 17.9% of the QTP and specifically include western Xigaze, eastern Nyingchi, southern Qamdo, Diqing, Nujiang and Aba (Figure 2d).
3.2. Rainstorms
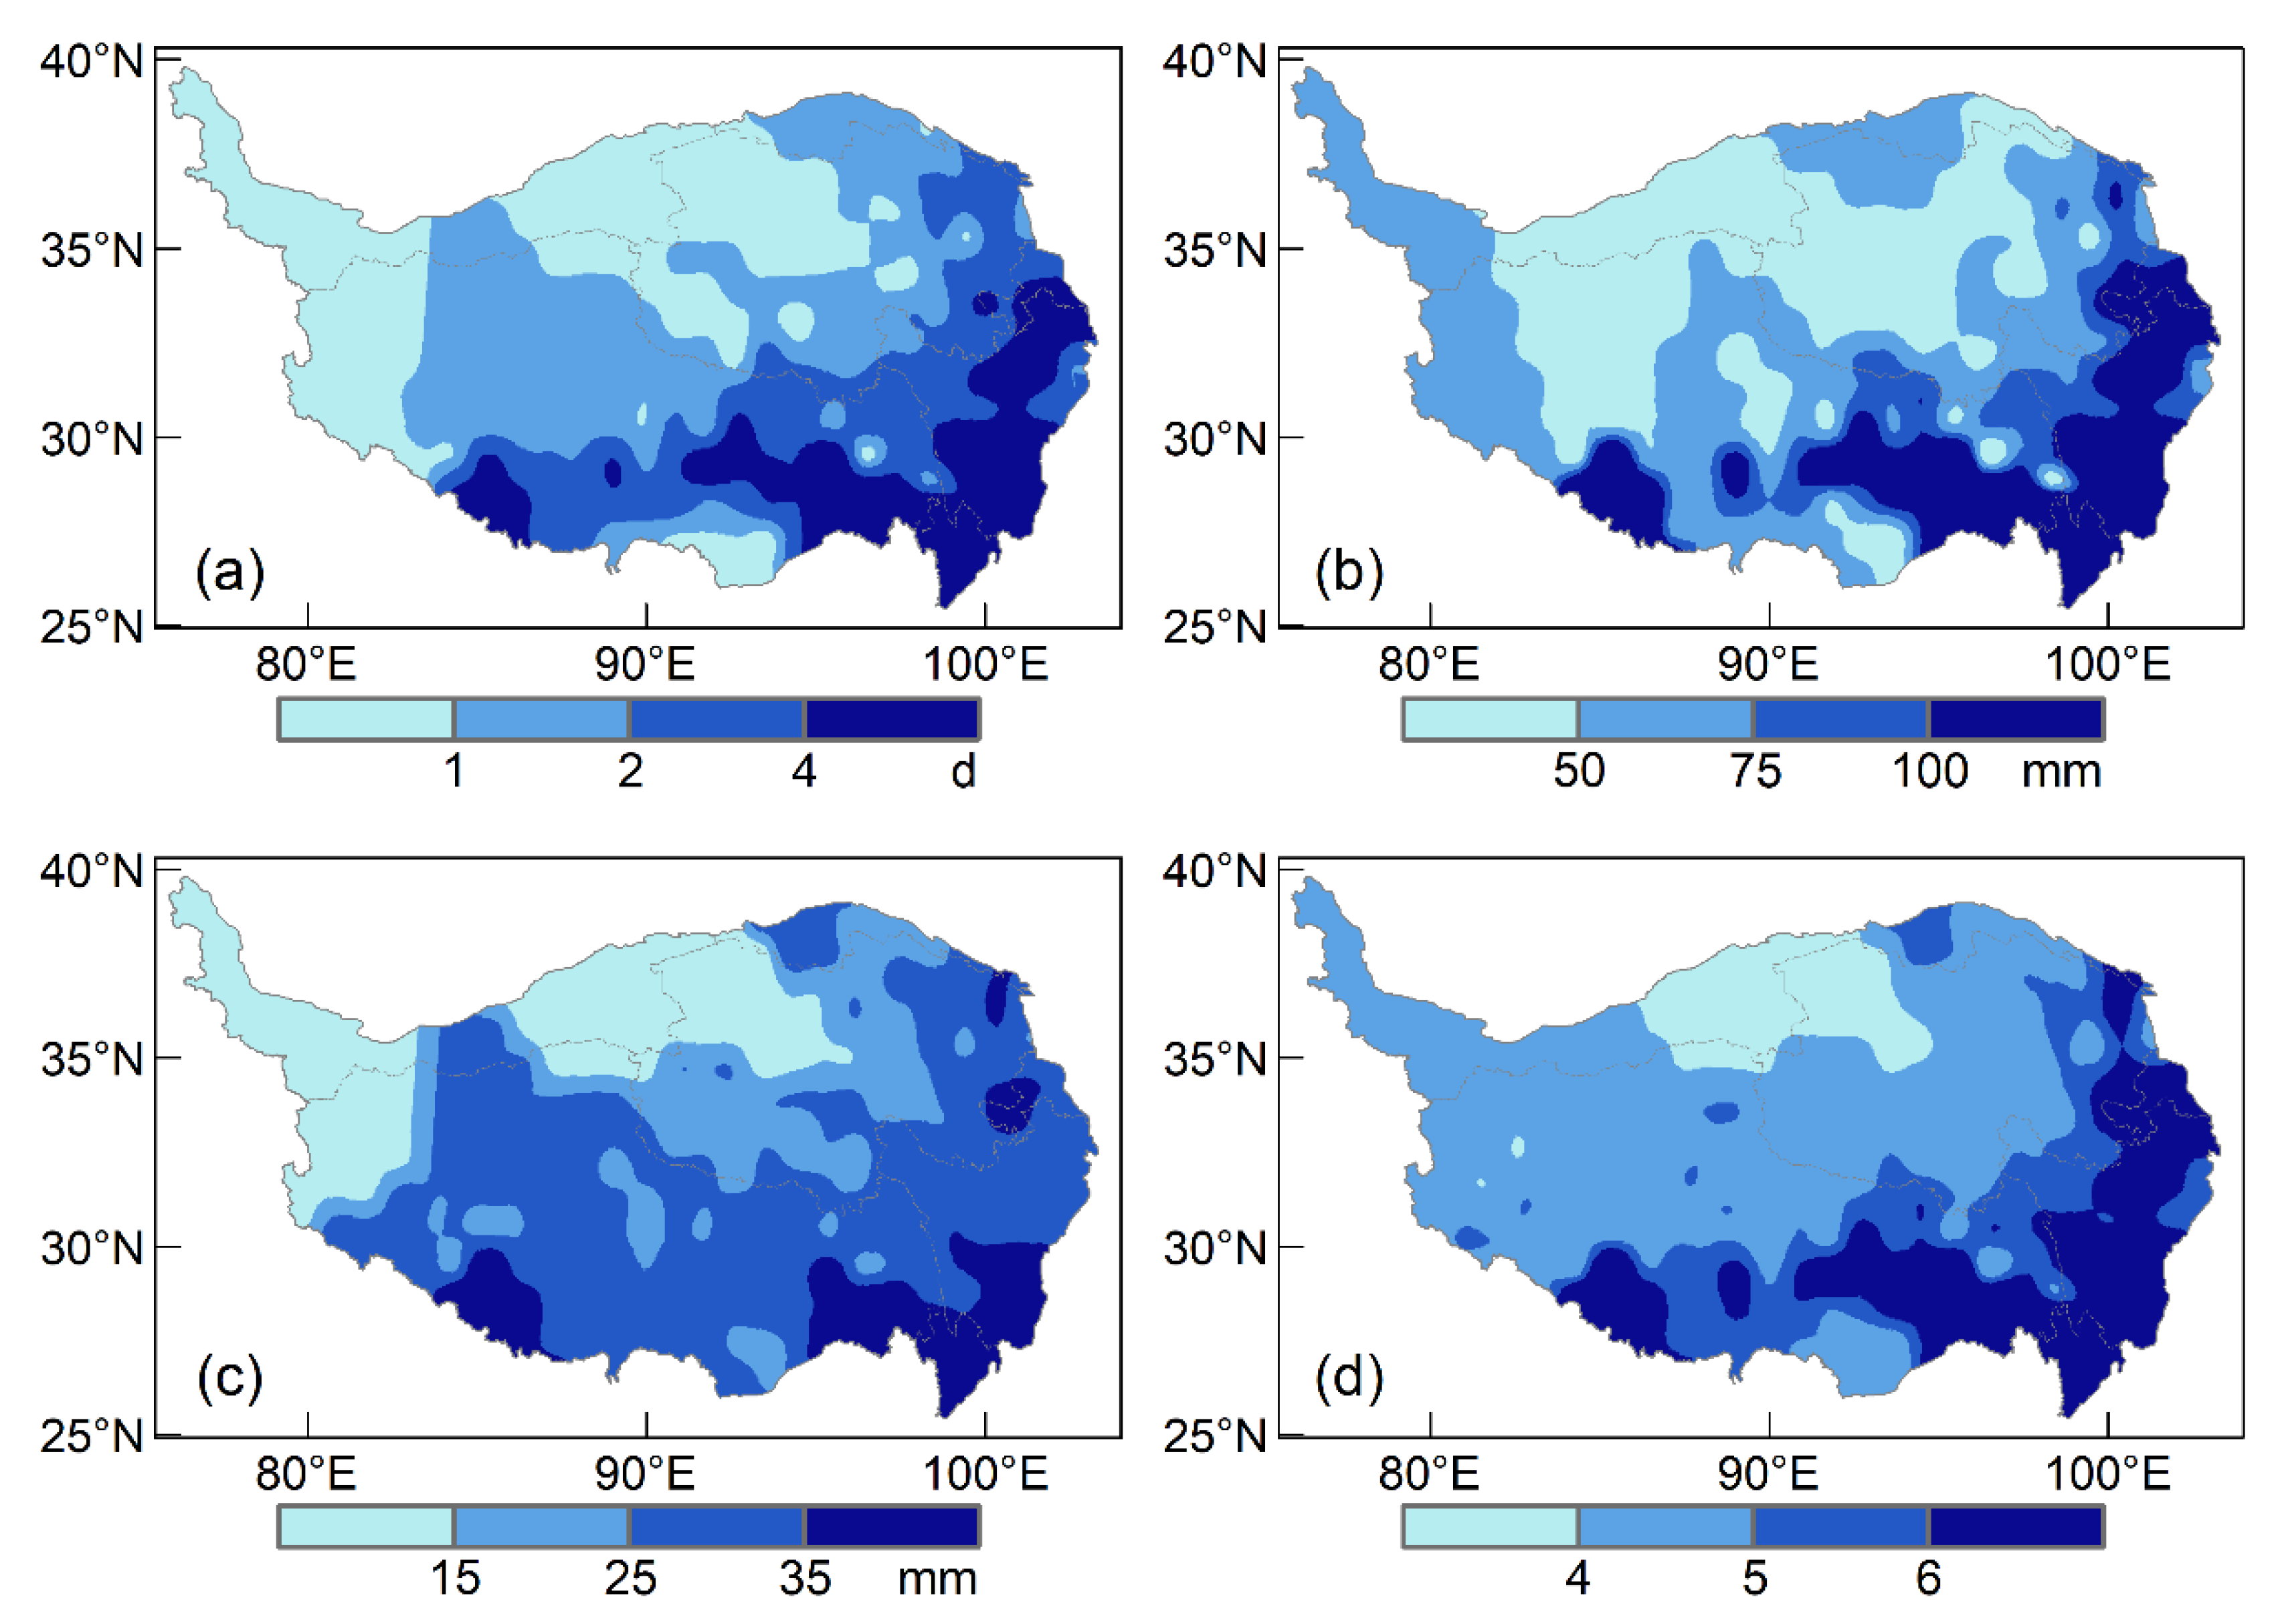
The criterion for rainstorm events in China is generally defined by the China Meteorological Administration as a daily precipitation amount >50 mm. Due to the special geographic and climatic conditions in the QTP, a rainstorm with daily precipitation >20 mm could trigger natural disasters like flash floods and debris flows. Hence, a daily precipitation amount >20 mm is taken as the threshold to identify rainstorms in the QTP. A hazard assessment system of rainstorms in the QTP contains three indices, i.e., rainstorm days, accumulated rainstorm rainfall, and maximum daily precipitation, at annual expected value. Historical observations indicate that the spatial pattern of rainstorm days and accumulated rainstorm rainfall show a gradual decrease from southeastern to northwestern QTP. The Nyenchen-Tanglha Mountains and Western Sichuan Plateau are observed with rainstorm days >4 d and an accumulated rainstorm rainfall >100 mm at annual expected (Figure 3a,b). The spatial average of annual maximum daily precipitation in the QTP is 25 mm, and the areas above the average include the north Tibet plateau, the Gangdise Mountains, the South Tibet Valley, the Nyenchen-Tanglha Mountains, Hengduan mountains and western Sichuan plateau (Figure 3c). Therein, the maximum daily precipitation in the South Tibet Valley and the Hengduan Mountains exceeds 35 mm. Hazard assessment indicates that hazard zones (HI > 6) cover the prefectures of western Xigaze, Lhasa, Nyingchi, Nujiang, Diqing, Ganzi, Aba, Gannan, Huangnan and Xining (Figure 3d), totally accounting for 20.1% of the QTP.
3.3. Snowstorms
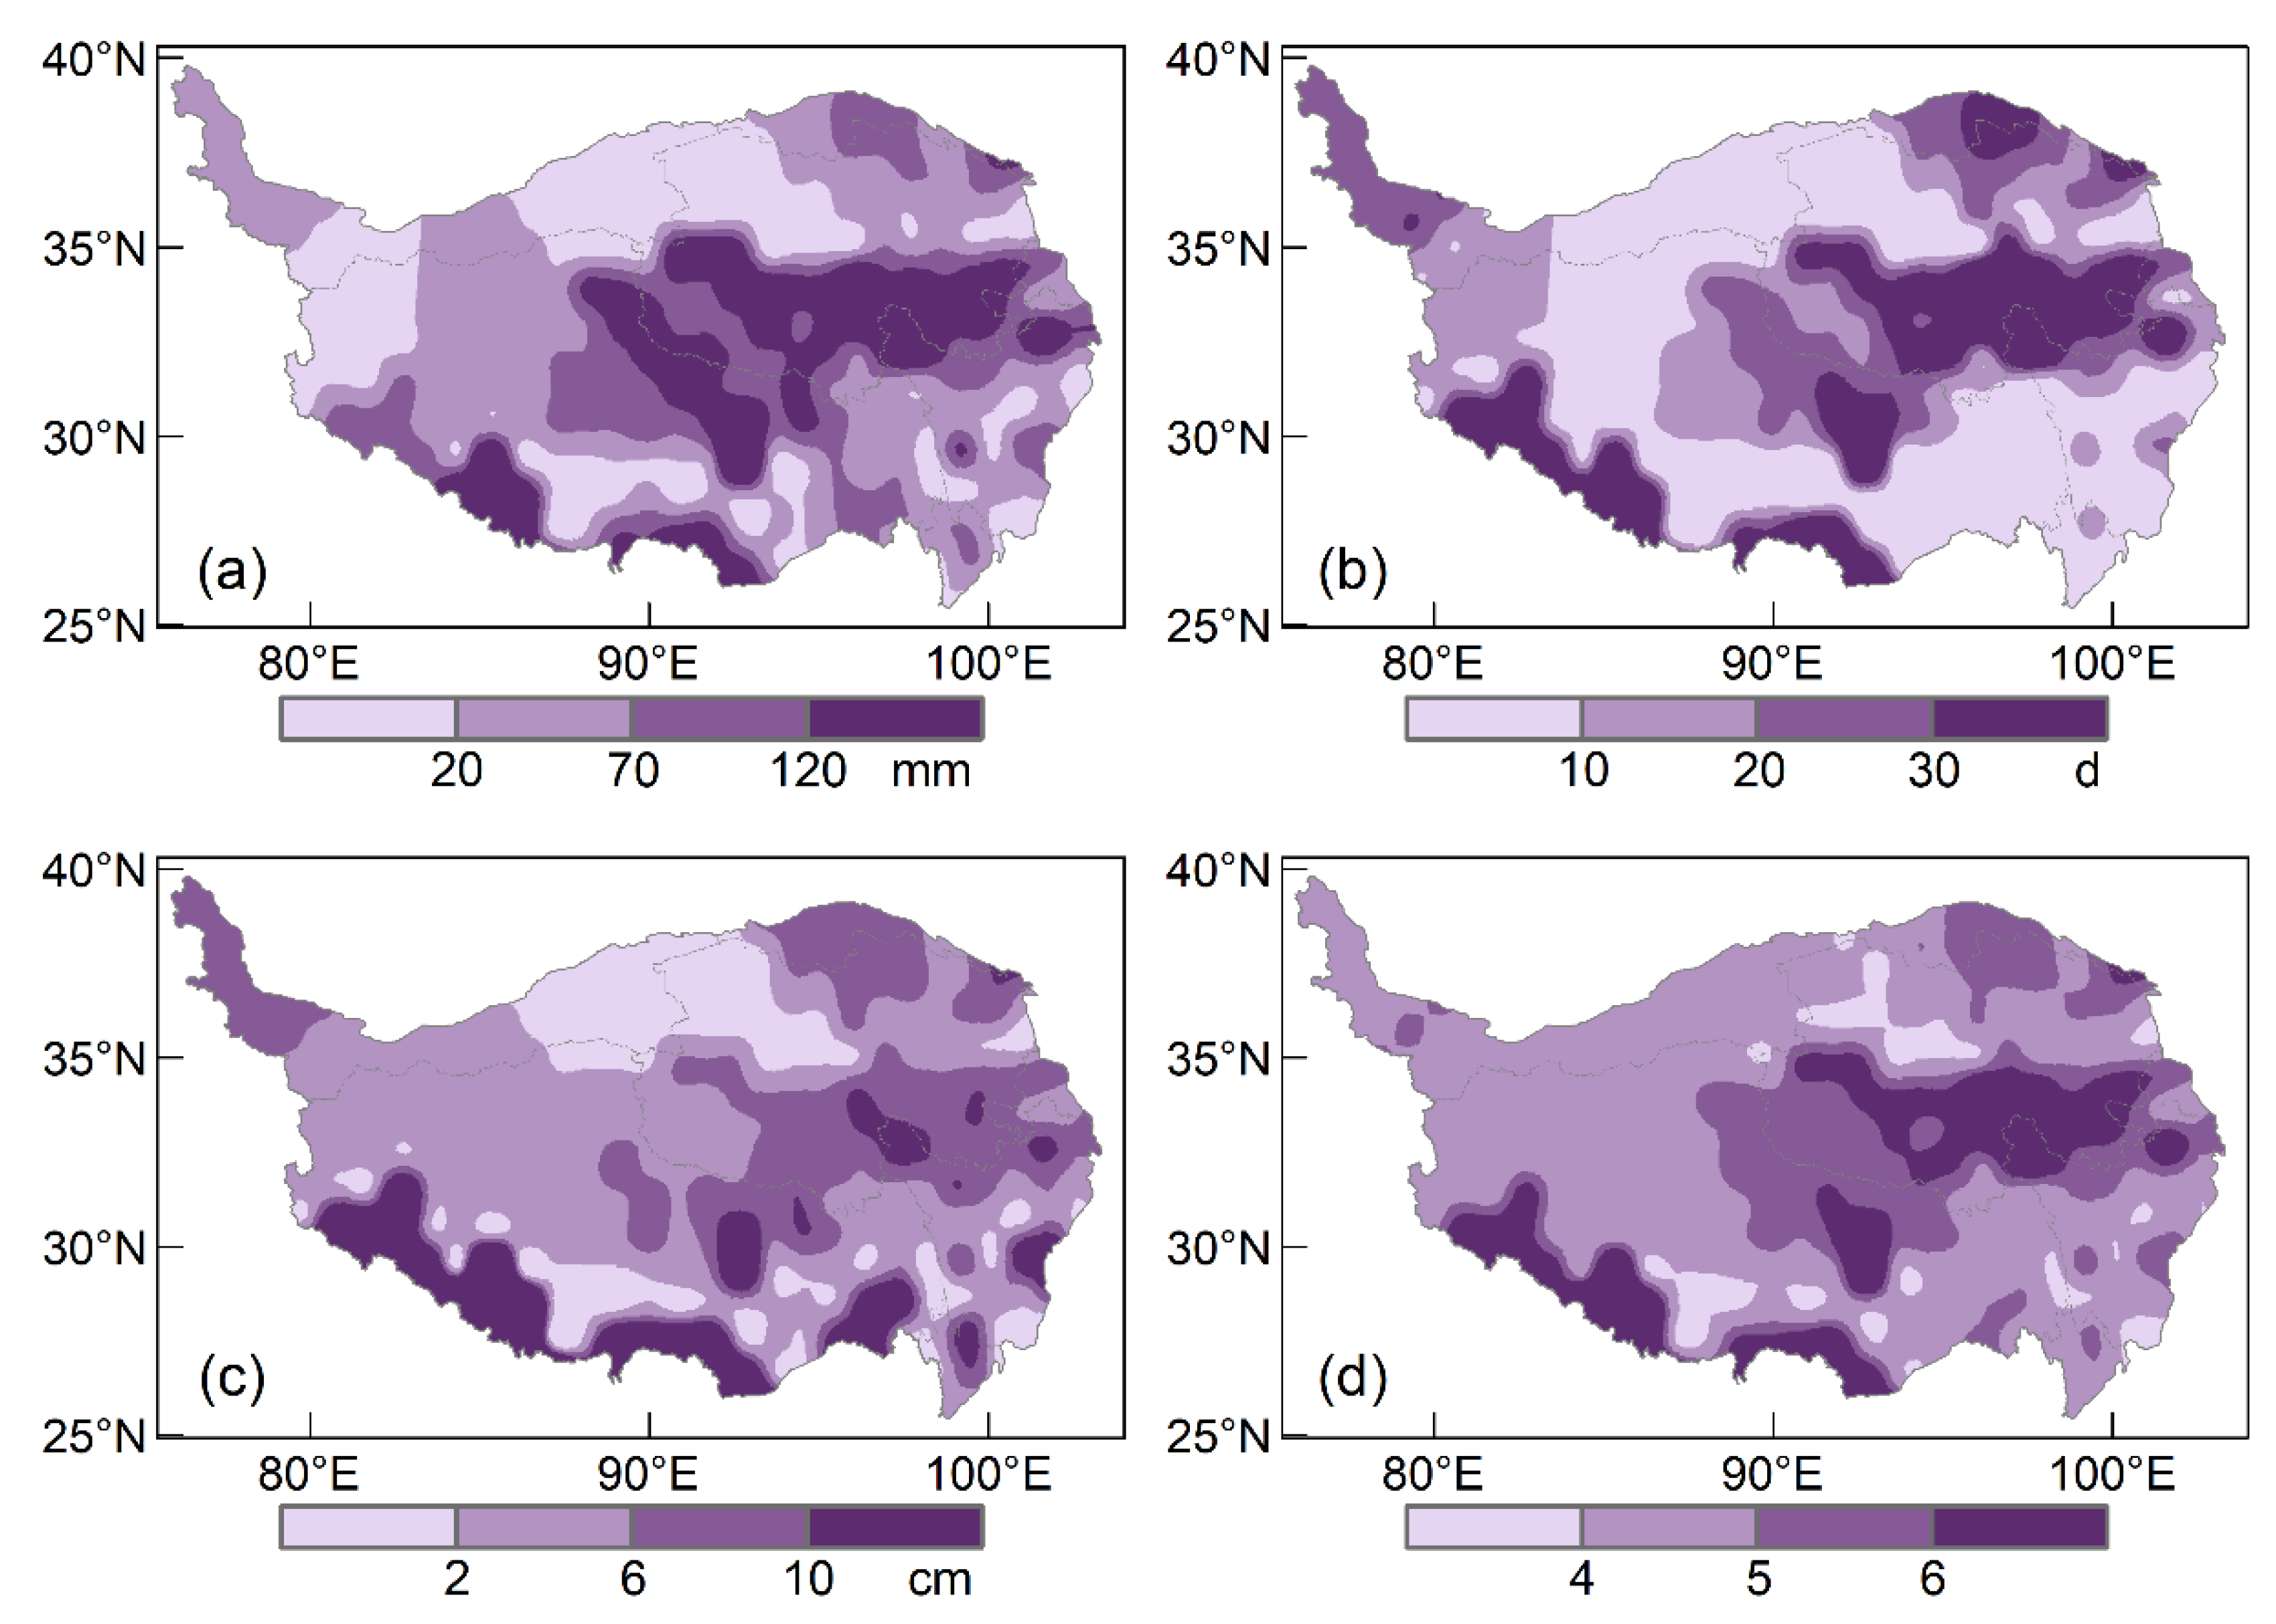
The QTP is an important livestock husbandry base in China, and also the largest region with snow cover in China. Snowstorms usually occur in autumn and winter, which are the most widespread and disastrous hazards in pastoral areas of the QTP and pose a serious threat to the production of local herders. The snowstorm hazard index is developed with three indices of accumulated snowfall, snow cover days, and maximum snow depth, at the annual expected value. The average of annual accumulated snowfall in the QTP is 67.3 mm, and the areas with heavy snowfall are mainly distributed in the Himalayas, Tanggula Mountains and Qinghai Plateau (Figure 4a). Therein, annual snowfall >120 mm is observed in the central Xigaze, southern Shannan, eastern Naqu, western Haixi, Yushu, Guoluo and southern Huangnan. The spatial average of annual snow cover days is 18.4 d in the QTP, and reaches more than 30 d in the Himalayas and Qinghai Plateau regions (Figure 4b). The spatial average of maximum snow depth in QTP is 6.5 mm, therein the snow depth reaches 6–10 cm in Bayankela and the Nyenchen-Tanglha Mountains, and exceeds 10 cm in the Himalayas (Figure 4c). The hazard assessment of snowstorms indicates that hazard zone (HI > 6) cover the prefectures of southern Ali, western Xigaze, southern Shannan, eastern Naqu, Yushu, Guoluo, southern Huangshan and northern Aba, totally accounting for 13.5% of the QTP (Figure 4d).
3.4. Hailstorms
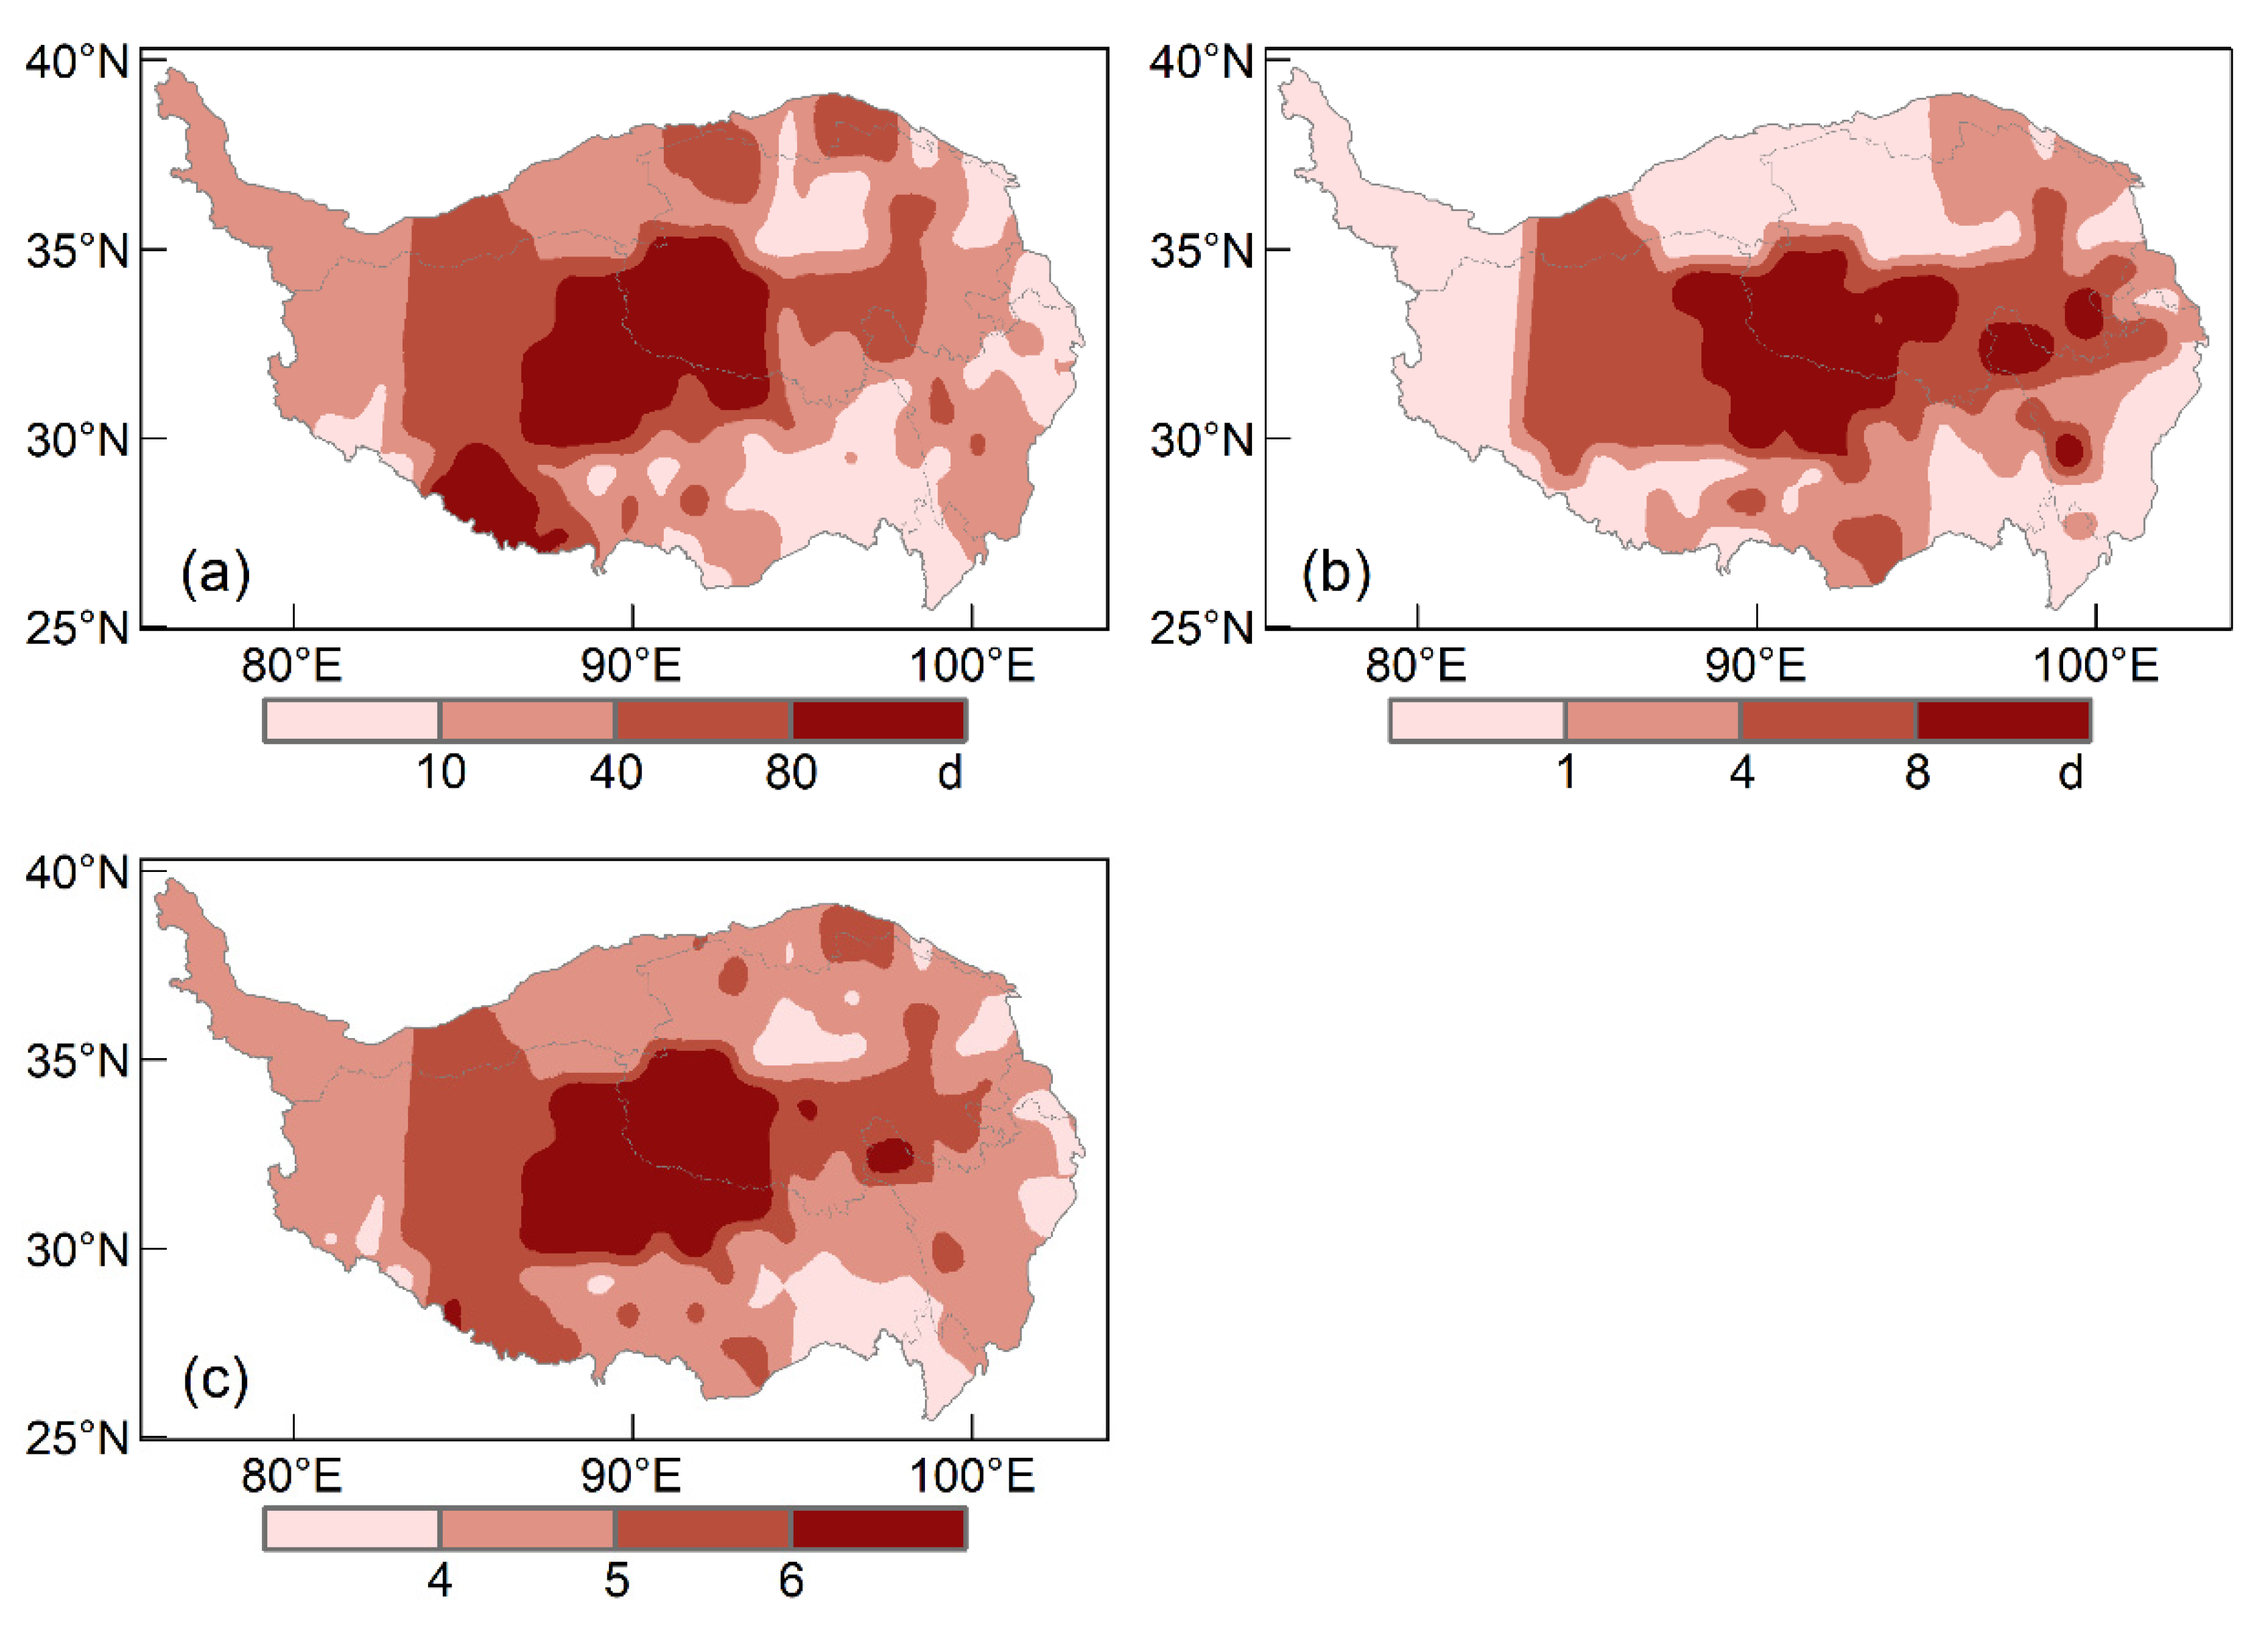
Hailstorm refers to mesoscale or microscale catastrophic weather caused by the strong atmospheric convection, which mostly occurs in the mid-latitude mountainous areas and fragile ecological environment. Under the special thermal conditions induced by plateau topography, hailstorms become common hazards on the QTP in summer. The hailstorm hazard index is composed of annual expected gale days and annual expected hail days. Historical observations indicate that the average of annual gale days over the QTP is 43.1 d, and the areas above average are concentrated in the north Tibetan Plateau, Tanggula Mountains, Qinghai Plateau and the Gangdese Mountains. Wherein, the number of gale days in the prefectures of central Xigaze, Naqu, Haixi, and western Yushu exceeds 80 d (Figure 5a). Annual expected hail days in the QTP is 4.1 d at spatial average and show similar distribution as gale days. The prefectures of eastern Naqu, western Hernia, western Yushu and southern Guoluo have annual hail days > 8 d, as expected (Figure 5b). According to hailstorm hazard assessment, the hazard zones (HI > 6) account for 14.4% and are concentrated in the central part of the QTP, including the prefectures of Naqu, Haixi and western Yushu (Figure 5c).
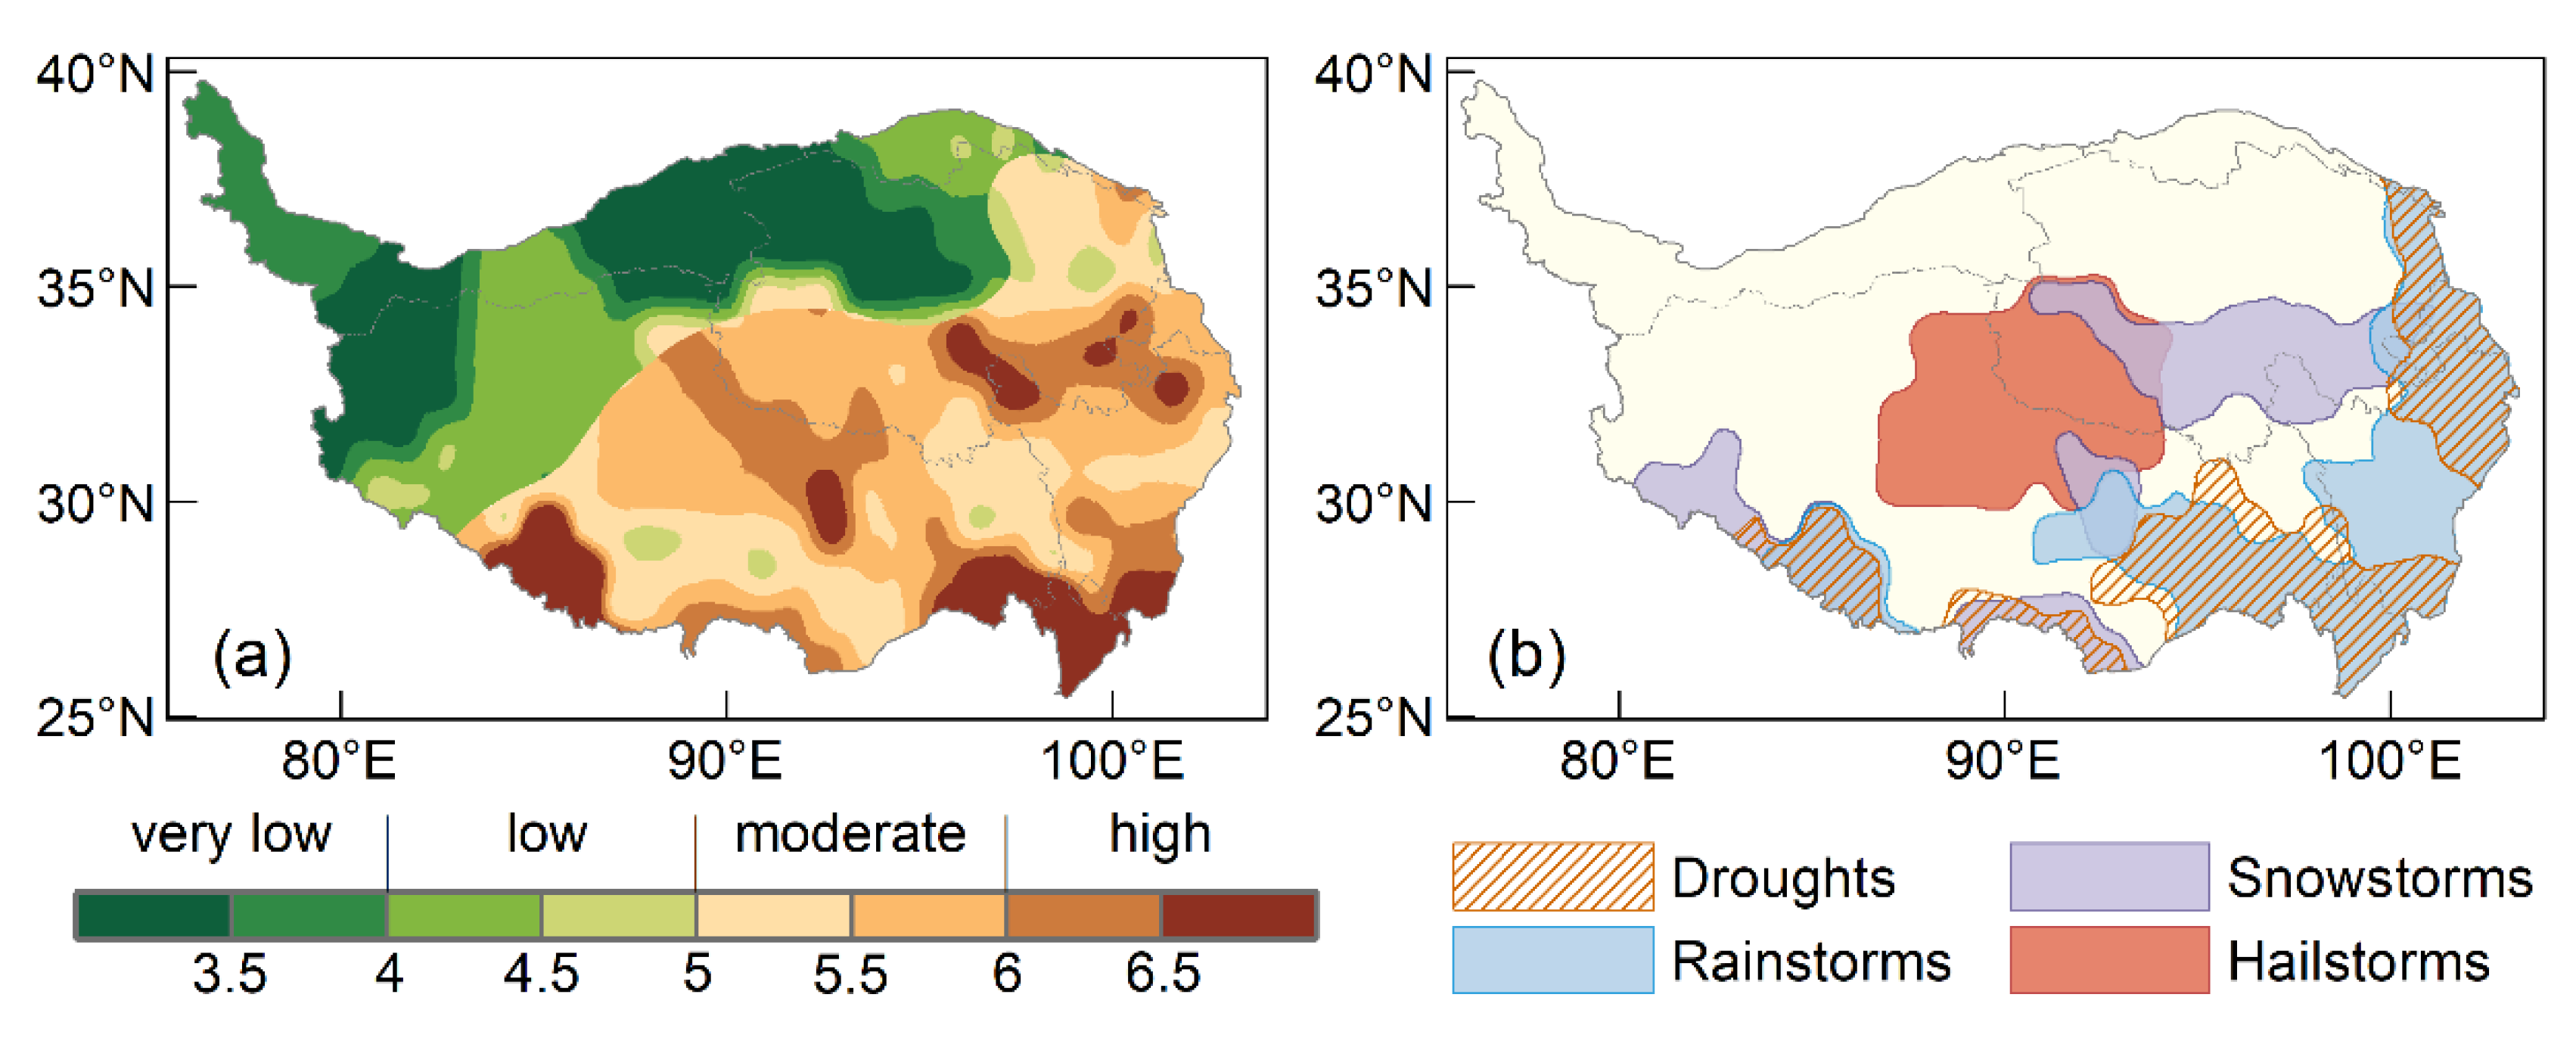
3.5. Multi-Hazard Assessments and Mapping
A multi-hazard index is developed to integrate the intensity of multiple meteorological hazards in the QTP, and the spatial pattern of multi-hazard levels is shown in Figure 6a, namely very low, low, moderate and high levels. The areas with high hazard level (HI > 6) account for 19.2% of the QTP and cover the prefectures of central Xigaze, southern Shannan, eastern Naqu, Nyingchi, Diqing, Nujiang, Liangshan, northwestern Aba, southern Huangnan, central Goluo, northern Ganzi and eastern Yushu (Figure 6a). Wherein, central Xigaze and southern Huangnan are severely affected by compound hazards of snowstorms, droughts and rainstorms. The Hengduan Mountains and Aba are affected by droughts and rainstorms, eastern Naqu is affected by snowstorms and hailstorms, central Guoluo and western Yushu are affected by snowstorms. All the areas mentioned above have been affected by high-level hazards in the past decades. The multi-hazard intensities in the northern and northwestern parts of QTP, including the Kunlun Mountains, Qaidam Basin, western Tibet Plateau and Ngari Plateau are relatively low (HI < 5). Most of these places belong to the classification of permanent arid region with no possibility of meteorological droughts, and have relatively low frequency of rainstorms, snowstorms and hailstorms as well.
Based on the identified hazard zones (HI > 6) of droughts, rainstorms, snowstorms and hailstorms in the QTP, the meteorological hazards regionalization in the QTP is mapped (Figure 6b). Drought hazard zones tend to overlay those of rainstorms due to the fact that rainstorm hazard zone is dominated by remarkable precipitation fluctuations and, hence, frequent occurrence of meteorological droughts. Three snowstorm hazard zones are identified in the map: the Himalayas Mountains, the Nyenchen-Tanglha Mountains and Qinghai Plateau. The snowfall amount, snow cover days and maximum snow depth in the hazard zones are significantly higher than the rest parts of the QTP. Hailstorm hazard zones distribute in the eastern Qiangtang Plateau and the Tanglha Mountains, and characterized by notable frequencies of gale and hail in the QTP.
4. Evolution of Population Exposure to Meteorological Hazards
Recent decades witness accelerated changes in global climate, and the spatial extent of meteorological hazards in the QTP also shows interannual variations. According to the indicator system for meteorological hazards assessment (Table 1), the hazard zones are identified when the grids in them meet the high-level criterion of all indices for a certain hazard. In this way, the spatial evolution of hazard zones for the period of 2001–2019 is analyzed. The population exposure to meteorological hazards is further adopted to reveal the historical changes in potential population risks of the QTP.
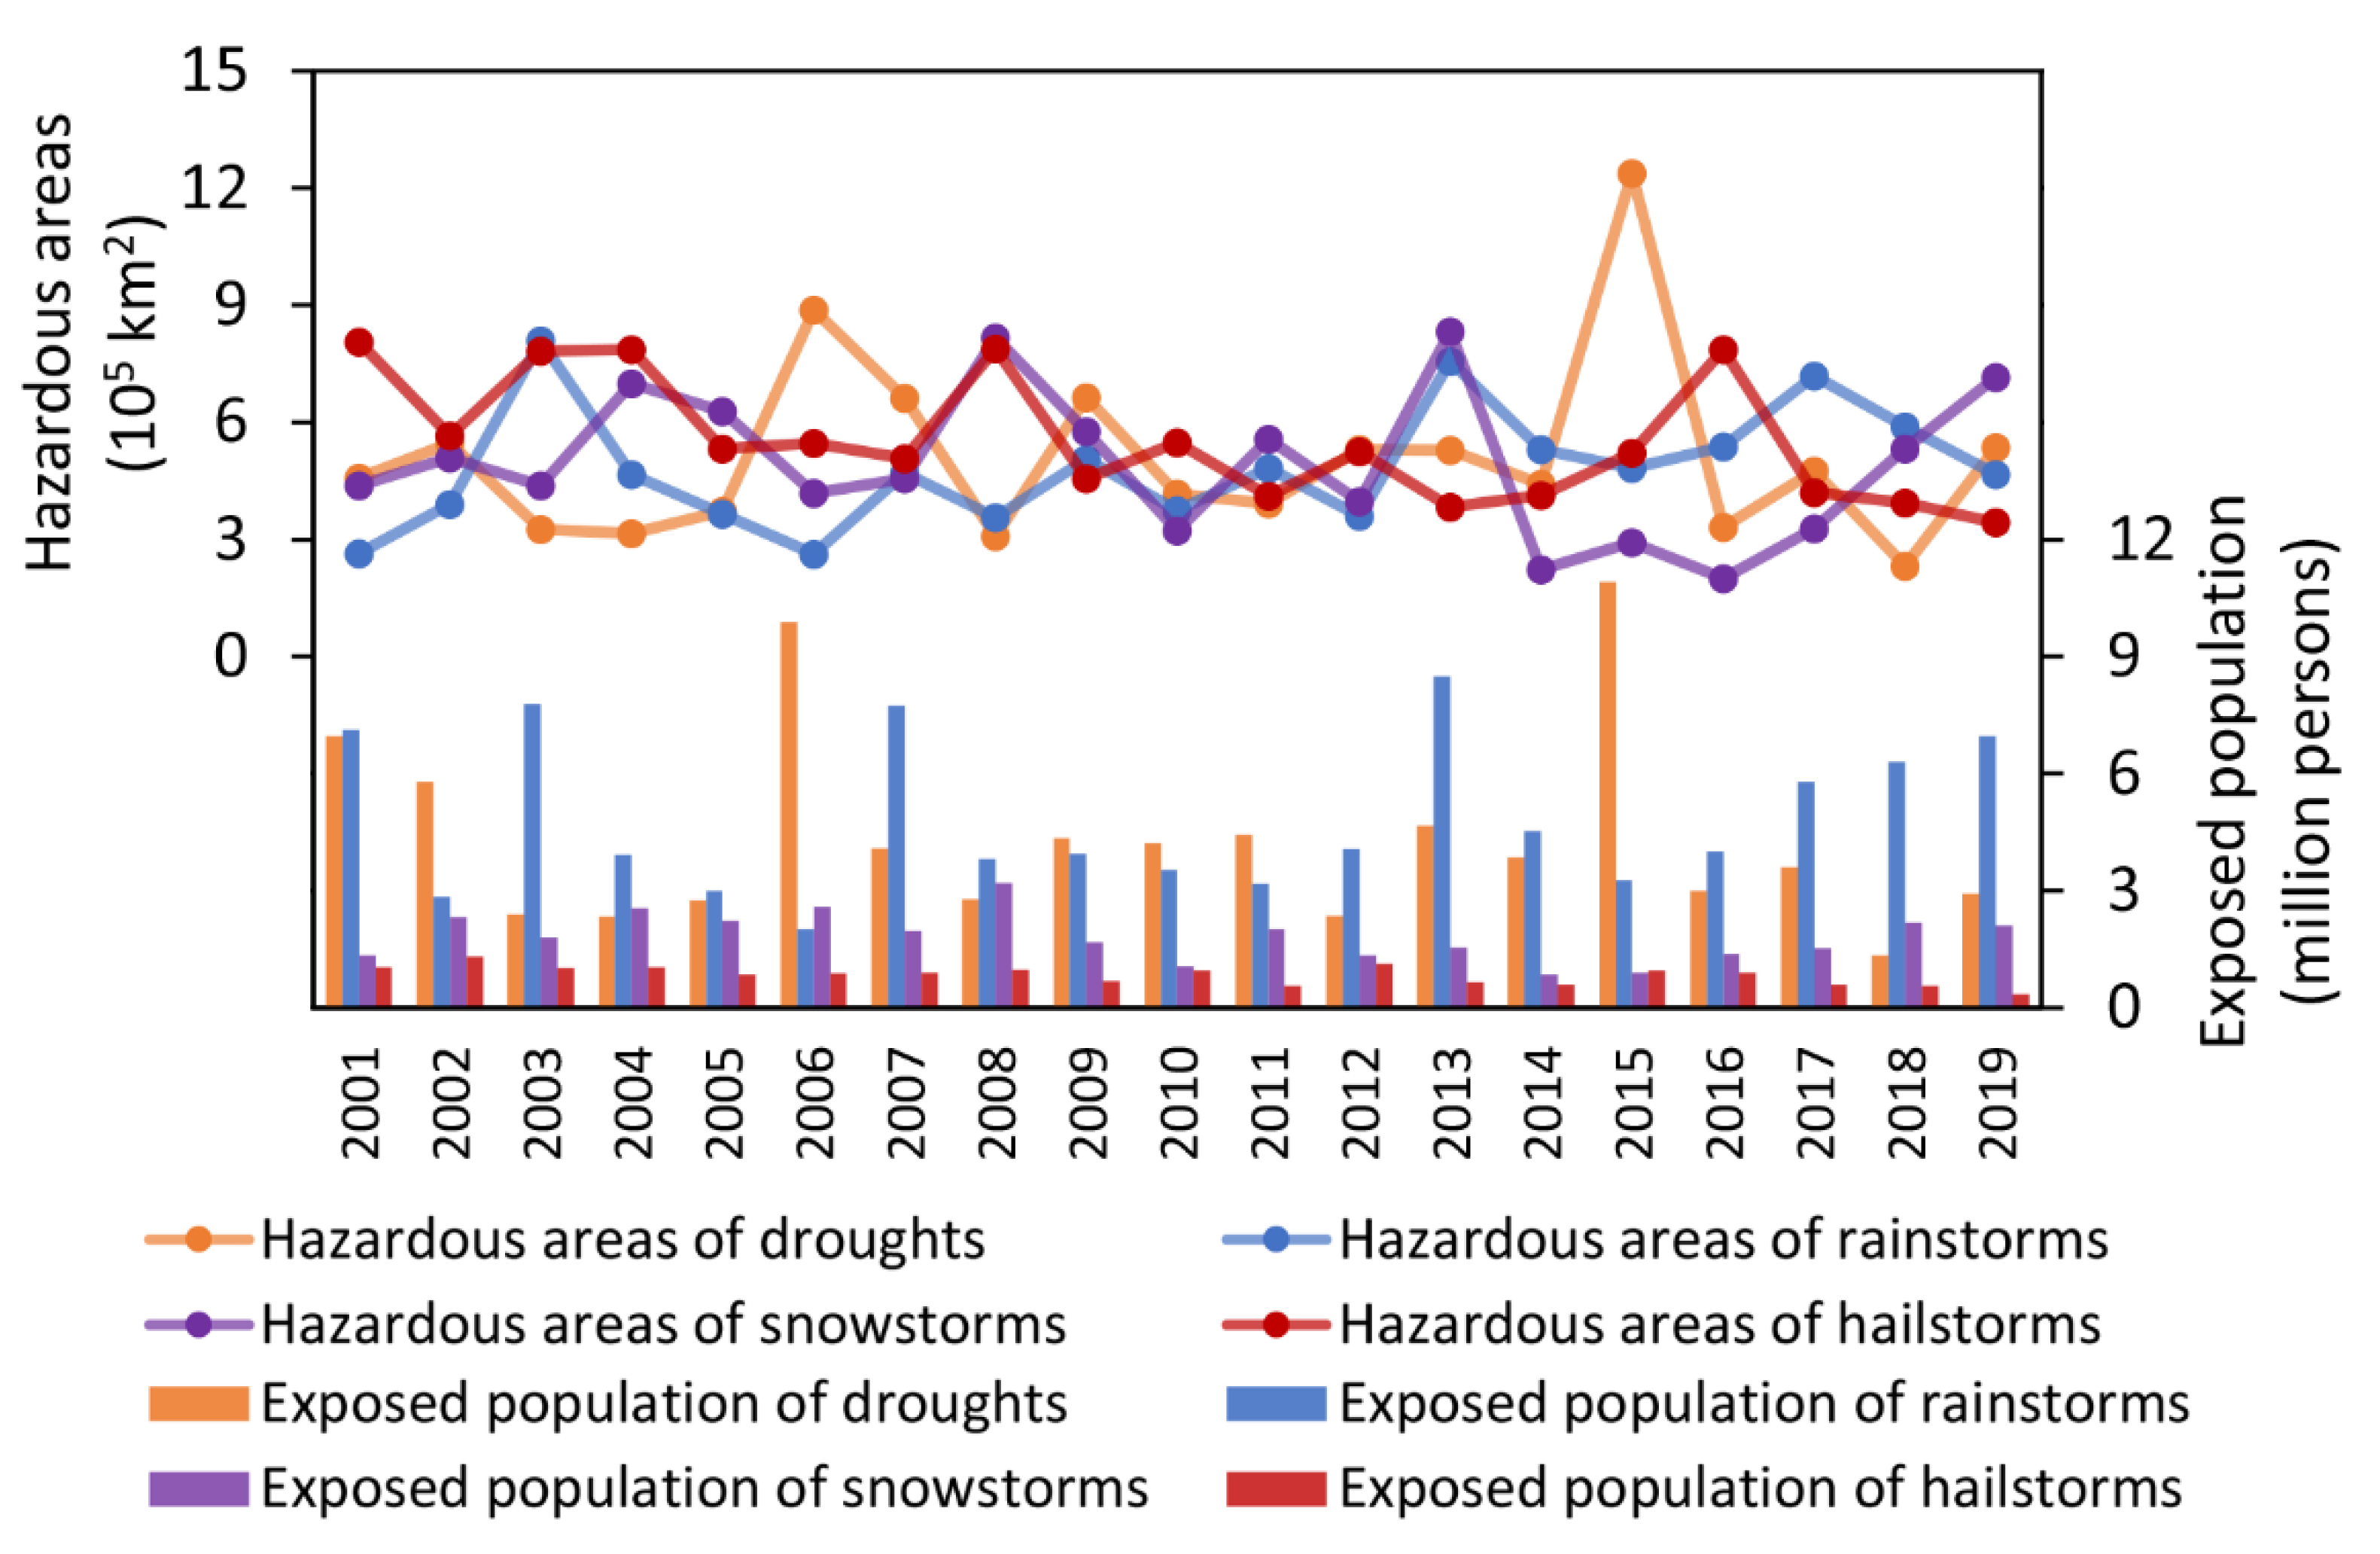
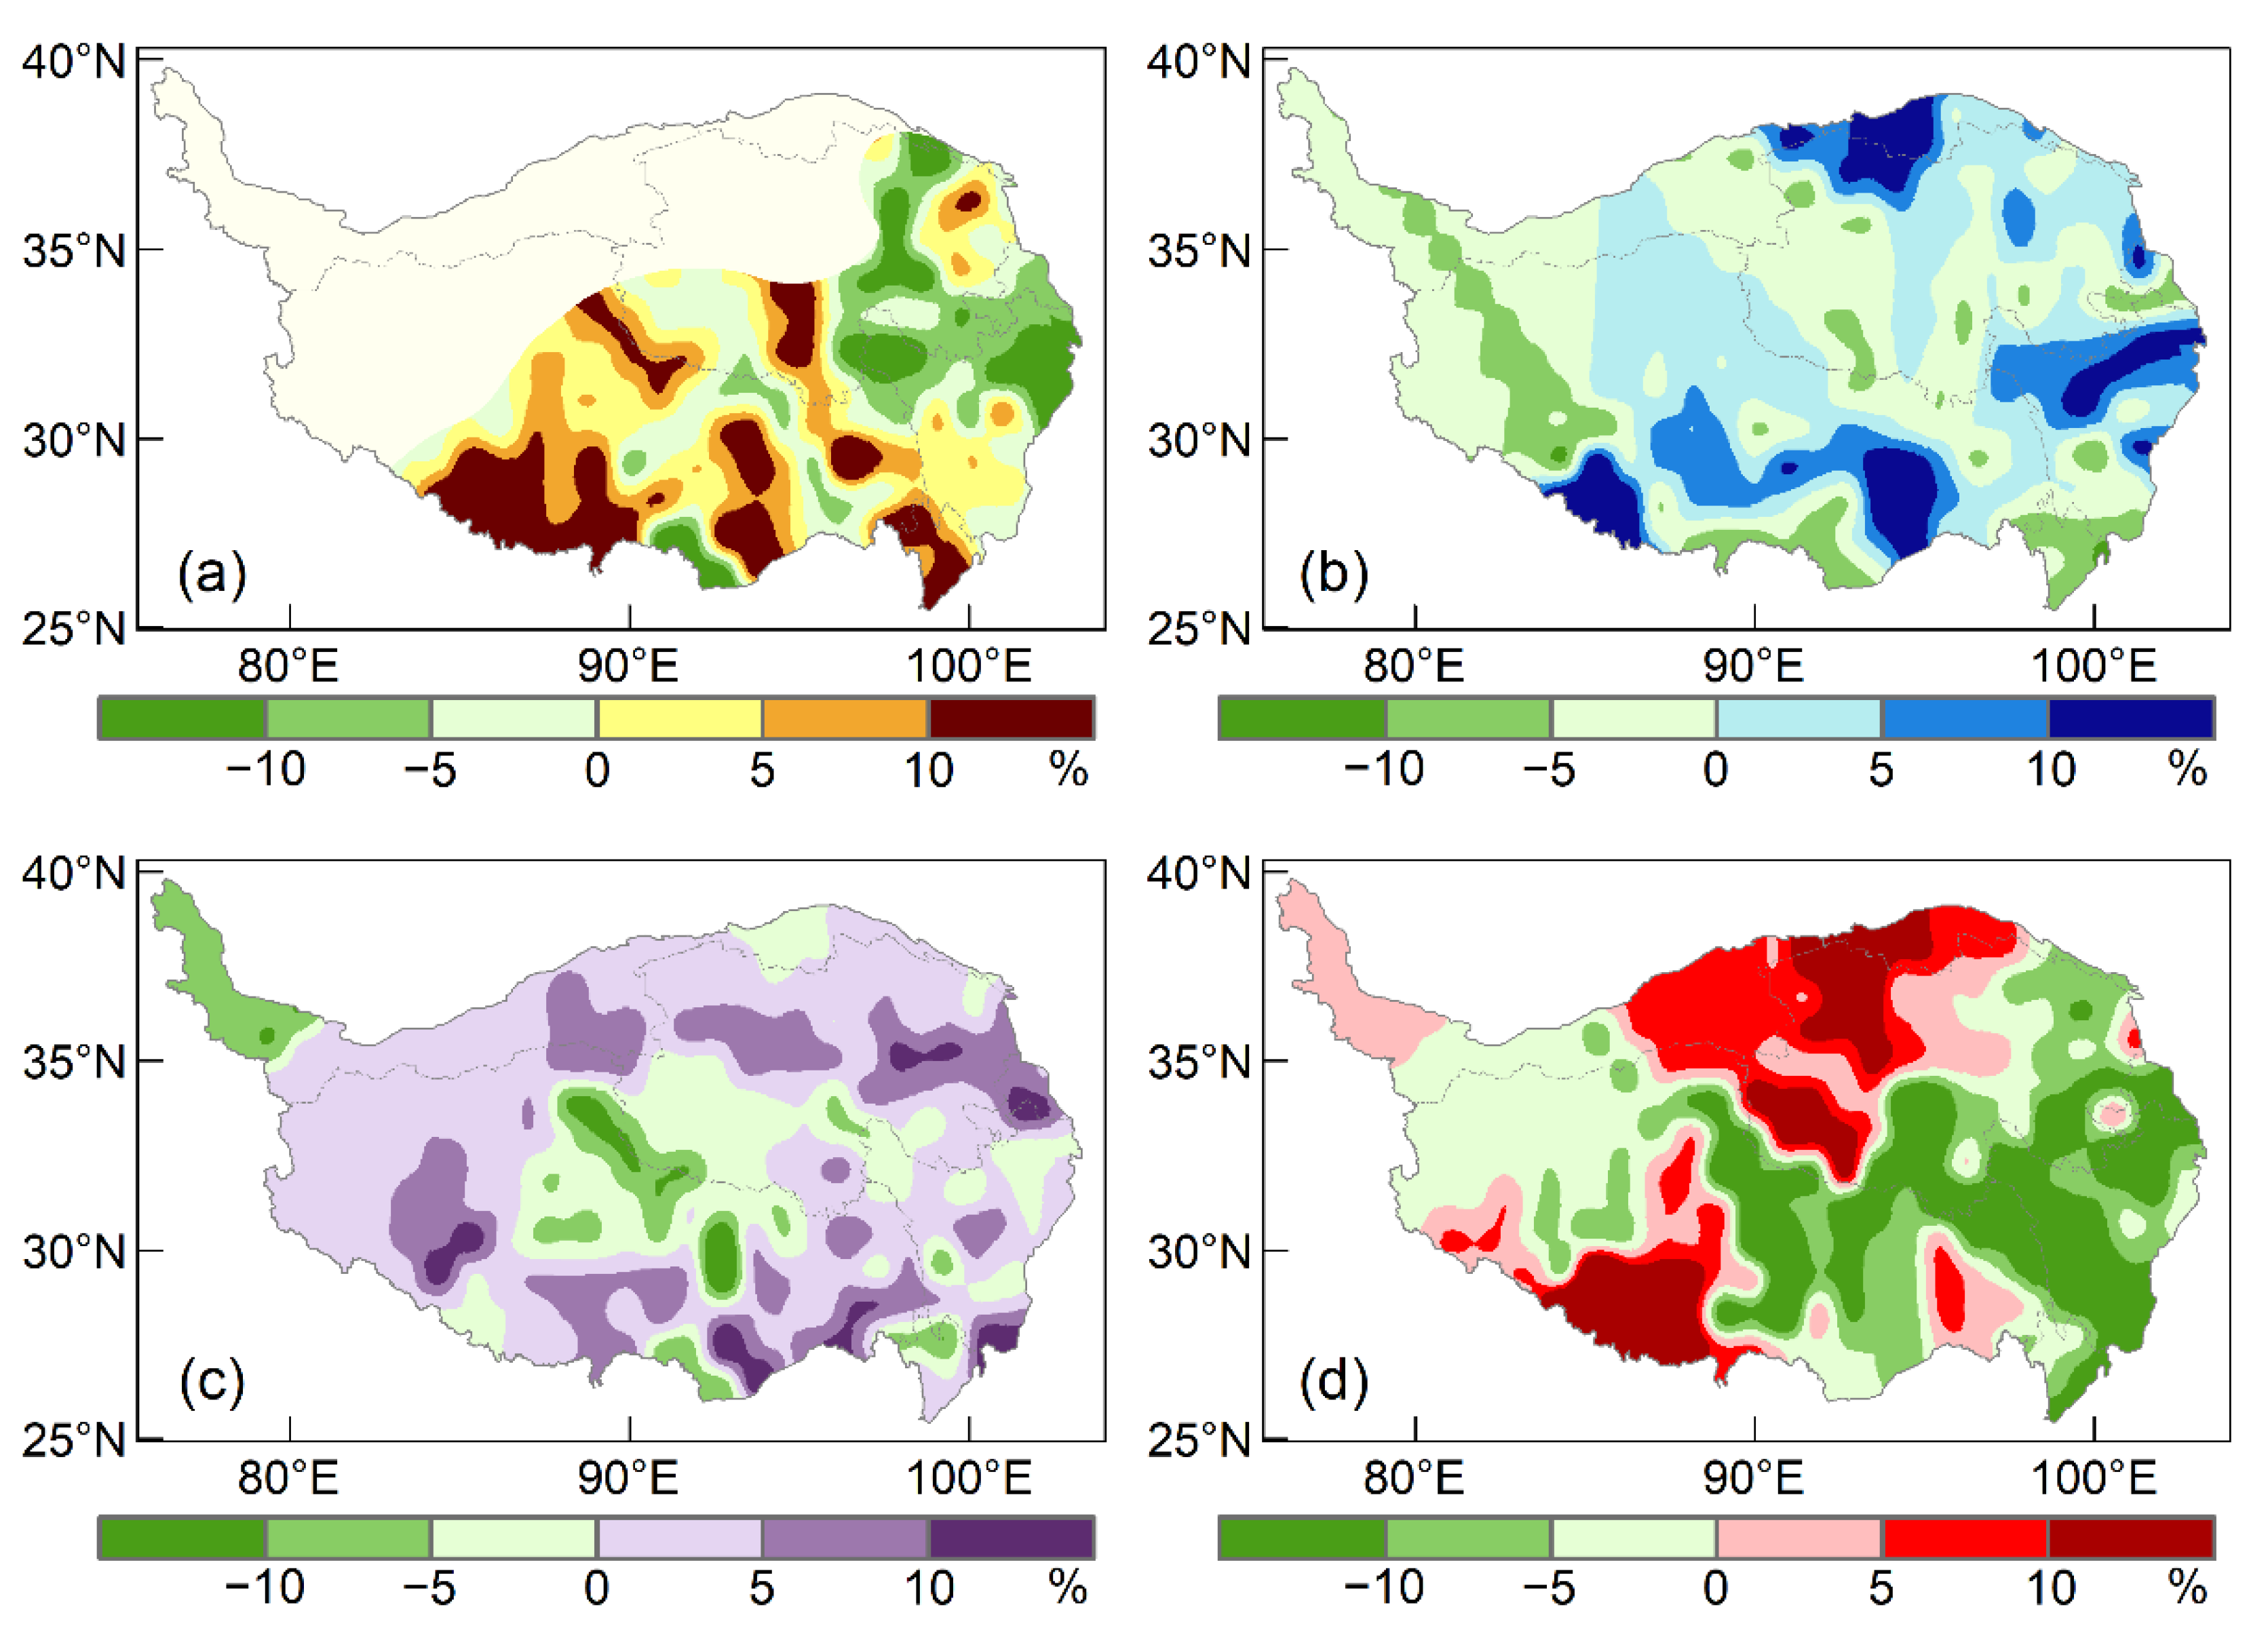
The maximum extent of drought hazard zones reaches 1.24 million km2 in 2015, approximately half of the QTP, and the exposed population is estimated at 10.9 million people (Figure 7). The minimum extent of drought hazard zones is 0.23 million km2 in 2018, accounting for 8.9% of the QTP, with 1.3 million people as the exposed population. Comparing the 2010s with the 2000s, it is found that the hazard zones expand by 5.4%, whereas the exposed population fell by 10%. The main reason is that the ascending trend of precipitation in the QTP weakens the frequency and intensity of meteorological droughts, especially in the densely populated areas of Western Sichuan Plateau, Songpan Plateau and the Bayan Har Mountains, and hence reduces the total affected population (Figure 8a). However, it is notable that the hazard zones are expanding in the South Tibet Valley and the Hengduan Mountains, posing a great threat to local agricultural and livestock industry. Hence, it is necessary to further improve the drought risk prevention in these areas.
In terms of rainstorms, the maximum extent of hazard zones reaches 0.81 million km2 in 2003, whereas the largest exposed population is 8.5 million people in 2013 (Figure 7). The minimum hazard zones of rainstorms appears in 2006, at 0.26 million km2, and the exposed population is about 2.0 million people. Comparing the second half to the first half period, we find that the hazard zones expands by 28.4% in 2010s, and the exposed population also increases by 13.1%. The spatial pattern indicates a notable increment of the rainstorms hazard index in the Qilian Mountains, the western Sichuan plateau and the northern Shannan (Figure 8b), resulting in the expansion of hazard zones. A particular concern is that rainstorm risk in Xining and Lhasa, two densely populated cities in the QTP, has increased significantly due to the combined effect of aggravated hazard and elevated exposure.
Snowstorms have always been one of the dominant meteorological hazards in the QTP. The maximum extent of snowstorm hazard zones reaches 0.83 million km2 in 2013, whereas the maximum exposed population is nominated at 3.2 million people in 2008 (Figure 7). The minimum extent of hazard zones appears in 2016 at 0.20 million km2, and the minimum exposed population is 0.8 million people in 2014. Comparing the second half to the first half period, we find that the hazard intensity reduces by 14.5% in 2010s, and the exposed population decreases by 26.0% as well. The spatial pattern indicates larger areas with intensified hazard in the QTP but are mainly distributed in low-hazard areas (Figure 8c). Moreover, two of the three snowstorm hazard zones, i.e., the Tanglha Mountains and Qinghai Plateau, decrease significantly in snowstorm hazard, resulting in an overall declining trend in exposed population. Nevertheless, from 2016 to 2019, the hazard zones of snowstorms are constantly expanding, suggesting the possibility of extreme events within the general trend. It is still necessary to strengthen the ability of monitoring and forecasting snow cover in pasturing areas, and improve the measures of forage storage and management, so as to reduce the impact of extreme snowstorms on livestock production in the future.
The maximum extent of hailstorm hazard zones reaches 0.81 million km2 in 2001, whereas the maximum exposed population is nominated as 1.3 million people in 2002 (Figure 7). The minimum extent of hazard zones appears in 2019, at 0.34 million km2, and the exposed population is about 0.4 million people. Comparing the second half to the first half period, we find that the hazard zones reduces by 26.1% in 2010s, and the exposed population decreases by 27.3% as well. The spatial pattern indicates that hailstorm hazard decreases in the Nyenchen-Tanglha Mountains, the Hengduan Mountains, western Sichuan plateau and the Bayan Har Mountains, whereas increases in Qaidam Basin, western Qinghai plateau and the Gangdise Mountains (Figure 8d). As for the climatological hazard zones of hailstorms, the hazard intensifies in western Qinghai plateau, whereas it weakens in the other parts, thus the exposed population of hailstorms in the QTP shows a downward trend.
5. Discussion and Conclusions
5.1. Discussion
Meteorological hazard research is highly dependent on long-term historical observations. At present, studies on meteorological hazards in the QTP are very limited due to the lack of observation data. Herein, we collect data from 246 meteorological stations in the QTP and attempt to carry out a multi-hazard assessment. It should be noted that the spatial distribution of meteorological stations is uneven, especially the limitation of observations in the northern Tibetan Plateau and the Kunlun Mountains increases uncertainty in hazard analysis. Future studies could study the applicability of remote sensing datasets in the QTP to improve the accuracy of hazard assessments.
The period from 2001 to 2019 is selected to analyze climate hazards over the QTP under the following two considerations. Firstly, climate variables such as temperature, precipitation and wind speed in the QTP are changing dramatically in recent decades due to accelerated global warming, thus the observations in the recent two decades are more likely to describe the current situation. Secondly, the weight coefficients in the assessment model are determined by historical disaster records. With the rapid growth of social wealth, the exposure decades ago is definitely different from the present, leading to low comparability of disaster losses over a long-time series. Therefore, the period of 2001–2019 is selected as a compromise between the robustness of climate conditions and the comparability in the disaster losses.
Current warning signals for meteorological hazard implemented by the China Meteorological Administration specifies the graded thresholds of multiple kinds of hazardous weather, which is applicable to the whole country. However, due to the special geographical conditions in the QTP, these thresholds could not be directly applied to the QTP. Hence, the relative thresholds are determined by standard deviation method in order to identify hazard zones in which the hazard intensity is at least 1 STD higher than the spatial mean of the QTP.
In comparison with previous studies on meteorological hazards, the hazard zone of droughts shows a similar pattern with existing works in the Tibet region [19,34]. Permanent arid zone is proposed for the first time in this paper to present the necessary conditions of meteorological droughts, which could provide reference for future research. The identification of rainstorm hazard zone has made certain progress in spatial resolution compared with previous studies [6]. We have also tried to use precipitation remote sensing datasets, but found many errors in plateau areas. This problem is expected to be solved as technology improves in the future. Studies on the snowfall over the QTP have been investigated by scholars in recent years [35]. On their basis, we further identify three hazard zones of snowstorms in the QTP, and reveal a downward trend in hazard intensity. As for hailstorms, there are few works that could be referenced in the QTP. However, a declining trend in hail days is also detected in another work by Zou et al. [23], thus we tend to believe that hailstorm risks would be moderated in a warming climate.
Monitoring changes in meteorological hazards and their effect on population in the QTP is exploratory work; it is an attempt aimed to reveal the evolutionary trends of socioeconomic exposure. Future studies may adopt climate models to simulate hazard intensities under radiative-forcing scenarios, and the population exposure could be estimated under socioeconomic scenarios. In this way, we could quantitatively assess the population risks of meteorological hazards in the future, and establish a solid scientific basis for meteorological risk management of the QTP.
5.2. Conclusions
Since the 21st century, the hazard intensity of meteorological droughts has been increasing in the South Tibet Valley and the Hengduan Mountains, leading to the expansion of drought hazard zone in the QTP. It is suggested that meteorological monitoring and early warning systems should be further improved in these areas, meanwhile the drought prevention capacity in grain producing areas and pastoral areas should be strengthened.
Rainstorm hazard zone has expanded by 28.4% and the exposed population has increased by 13.1% in the last 20 years. Intensified rainstorm hazard is detectable in the densely populated prefectures of Xining and Lhasa; hence, the technical standard of urban infrastructures should be improved to address climate risks. Rainstorm-induced geological hazards such as landslides, collapses and debris flows should also be taken precautions in mountain areas.
Due to the reduction in snowstorm intensity in the Tanglha Mountains and Qinghai Plateau, snowstorm hazard zone has reduced by 14.5% in the last two decades but the area fluctuates greatly on an inter-annual scale. Therefore, it is still necessary to improve the management of livestock industry in snow seasons of the QTP.
Hailstorm hazard zone distributes in the central part of the QTP, including the prefectures of Nagqu, Haixi and the western part of Yushu. Hailstorms show an overall descending trend since the 21st century but ascend in the western part of Qinghai Plateau. Improvements in weather forecast capacity is the key to mitigate losses of hailstorms.
Based on an integrated assessment model, we quantified the integrated intensity of multiple meteorological hazards, and further developed a multi-hazard regionalization map that could be referenced for territorial planning and disaster risk management in the QTP.
Author Contributions
Conceptualization, S.S. and Q.Z.; methodology, S.S.; validation, Q.Z. and R.Y.; formal analysis, S.S.; investigation, Y.X. and R.Y.; resources, Q.Z.; data curation, S.S. and Y.X.; writing—original draft preparation, S.S. and Y.X.; writing—review and editing, Q.Z. and R.Y.; visualization, S.S.; supervision, Q.Z.; project administration, R.Y.; funding acquisition, Q.Z. All authors have read and agreed to the published version of the manuscript.
Funding
This research has been financially supported by the China National Key R&D Program (Grant No. 2019YFA0606904 and 2018YFC1509003), the National Natural Science Foundation of China (Grant No. 41701103 and 41771536), the Major Research and Development Program of China Railway Group (P2018T006), and the UK-China Cooperation on Climate Change Risk Assessment.
Conflicts of Interest
The authors declare no conflict of interest.
References
- Xu, W.; Zhuo, L.; Zheng, J.; Ge, Y.; Gu, Z.; Tian, Y. Assessment of the casualty risk of multiple meteorological hazards in China. Int. J. Environ. Res. Public Health 2016, 13, 222. [Google Scholar] [CrossRef] [PubMed] [Green Version]
- Aksha, S.K.; Resler, L.M.; Juran, L.; Carstensen, L. A geospatial analysis of multi-hazard risk in Dharan, Nepal. Geomat. Nat. Hazards Risk 2020, 11, 88–111. [Google Scholar] [CrossRef] [Green Version]
- Duan, A.; Xiao, Z. Does the climate warming hiatus exist over the Tibetan Plateau? Sci. Rep. 2015, 5, 13711. [Google Scholar] [CrossRef] [PubMed]
- Liu, X.; Chen, B. Climatic warming in the Tibetan Plateau during recent decades. Int. J. Climatol. 2000, 20, 1729–1742. [Google Scholar] [CrossRef]
- Song, C.; Pei, T.; Zhou, C. The role of changing multiscale temperature variability in extreme temperature events on the eastern and central Tibetan Plateau during 1960–2008. Int. J. Climatol. 2014, 34, 3683–3701. [Google Scholar] [CrossRef]
- Yang, T.; Hao, X.; Shao, Q.; Xu, C.; Zhao, C.; Chen, X.; Wang, W. Multi-model ensemble projections in temperature and precipitation extremes of the Tibetan Plateau in the 21st century. Glob. Planet. Chang. 2012, 80–81, 1–13. [Google Scholar] [CrossRef]
- Yin, H.; Sun, Y.; Donat, M. Changes in temperature extremes on the Tibetan Plateau and their attribution. Environ. Res. Lett. 2019, 14, 124015. [Google Scholar] [CrossRef]
- You, Q.; Wu, F.; Shen, L.; Pepin, N.; Jiang, Z.; Kang, S. Tibetan Plateau amplification of climate extremes under global warming of 1.5 °C, 2 °C and 3 °C. Glob. Planet. Chang. 2020, 192, 103261. [Google Scholar] [CrossRef]
- Fang, Y.; Zhao, C.; Ding, Y.; Qin, D.; Huang, J. Impacts of snow disaster on meat production and adaptation: An empirical analysis in the yellow river source region. Sustain. Sci. 2016, 11, 249–260. [Google Scholar] [CrossRef]
- Gao, J.; Huang, X.; Ma, X.; Feng, Q.; Liang, T.; Xie, H. Snow disaster early warning in pastoral areas of Qinghai Province, China. Remote Sens. 2017, 9, 475. [Google Scholar] [CrossRef] [Green Version]
- Li, Y.; Ye, T.; Liu, W.; Gao, Y. Linking livestock snow disaster mortality and environmental stressors in the Qinghai-Tibetan Plateau: Quantification based on generalized additive models. Sci. Total Environ. 2018, 625, 87–95. [Google Scholar] [CrossRef]
- Wang, W.; Liang, T.; Huang, X.; Feng, Q.; Xie, H.; Liu, X.; Chen, M.; Wang, X. Early warning of snow-caused disasters in pastoral areas on the Tibetan Plateau. Nat. Hazards Earth Syst. Sci. 2013, 13, 1411–1425. [Google Scholar] [CrossRef]
- IPCC. Climate Change: Impacts, Adaptation, and Vulnerability; Cambridge University Press: Cambridge, UK; New York, NY, USA, 2014. [Google Scholar]
- Wang, J.; Wang, Y.; Wang, S. Biophysical and socioeconomic drivers of the dynamics in snow hazard impacts across scales and over heterogeneous landscape in Northern Tibet. Nat. Hazards 2016, 81, 1499–1514. [Google Scholar] [CrossRef]
- Anderegg, W.; Kane, J.; Anderegg, L. Consequences of widespread tree mortality triggered by drought and temperature stress. Nat. Clim. Chang. 2013, 3, 30–36. [Google Scholar] [CrossRef]
- Bartletta, M.; Klein, T.; Jansen, S.; Choat, B.; Sack, L. The correlations and sequence of plant stomatal, hydraulic, and wilting responses to drought. Proc. Natl. Acad. Sci. USA 2016, 113, 13098–13103. [Google Scholar] [CrossRef] [Green Version]
- Asner, G.; Brodrick, P.; Anderson, C.; Vaughn, N.; Knapp, D.; Martin, R. Progressive forest canopy water loss during the 2012-2015 California drought. Proc. Natl. Acad. Sci. USA 2016, 113, 249–255. [Google Scholar] [CrossRef] [PubMed] [Green Version]
- Sperry, J.; Love, D. What plant hydraulics can tell us about responses to climate-change droughts. New Phytol. 2015, 207, 14–27. [Google Scholar] [CrossRef]
- Li, S.; Yao, Z.; Liu, Z.; Rui, W.; Adam, J. The spatio-temporal characteristics of drought across Tibet, china: Derived from meteorological and agricultural drought indexes. Theor. Appl. Climatol. 2019, 137, 1–16. [Google Scholar] [CrossRef]
- Yin, J.; Gentine, P.; Zhou, S.; Sullivan, S.; Wang, R.; Zhang, Y.; Guo, S. Large increase in global storm runoff extremes driven by climate and anthropogenic changes. Nat. Commun. 2018, 9, 4389. [Google Scholar] [CrossRef] [Green Version]
- Hohl, R.; Schiesser, H.; Aller, D. Hailfall: The relationship between radar-derived hail kinetic energy and hail damage to buildings. Atmos. Res. 2002, 63, 177–207. [Google Scholar] [CrossRef]
- Li, M.; Zhang, Q.; Zhang, F. Hail day frequency trends and associated atmospheric circulation patterns over China during 1960-2012. J. Clim. 2016, 29, 7027–7044. [Google Scholar] [CrossRef]
- Zou, T.; Zhang, Q.; Li, W.; Li, J. Responses of Hail and Storm Days to Climate Chang. in the Tibetan Plateau. Geophys. Res. Lett. 2018, 45, 4485–4493. [Google Scholar] [CrossRef]
- Changnon, S. Increasing major hail losses in the U.S. Clim. Chang. 2009, 96, 161–166. [Google Scholar] [CrossRef]
- Púcik, T.; Castellano, C.; Groenemeijer, P.; Kühne, T.; Rädler, A.; Antonescu, B.; Faust, E. Large hail incidence and its economic and societal impacts across Europe. Mon. Weather Rev. 2019, 147, 3901–3916. [Google Scholar] [CrossRef]
- Zscheischler, J.; Westra, S.; Van Den Hurk, B.; Seneviratne, S.; Ward, P.; Pitman, A.; AghaKouchak, A.; Bresch, D.; Leonard, M.; Wahl, T.; et al. Future climate risk from compound events. Nat. Clim. Chang. 2018, 8, 469–477. [Google Scholar] [CrossRef]
- Liu, B.; Siu, Y.; Mitchell, G. A quantitative model for estimating risk from multiple interacting natural hazards: An application to northeast Zhejiang, China. Stoch. Environ. Res. Risk Assess. 2017, 31, 1319–1340. [Google Scholar] [CrossRef] [Green Version]
- Liu, B.; Siu, Y.; Mitchell, G.; Xu, W. Exceedance probability of multiple natural hazards: Risk assessment in China’s Yangtze River Delta. Nat. Hazards 2013, 69, 2039–2055. [Google Scholar] [CrossRef]
- Kong, J.; Simonovic, S. Probabilistic Multiple Hazard Resilience Model of an Interdependent Infrastructure System. Risk Anal. 2019, 39, 1843–1863. [Google Scholar] [CrossRef]
- Yin, H.; Cao, C.; Xu, M.; Chen, W.; Ni, X.; Chen, X. Long-term snow disasters during 1982–2012 in the Tibetan Plateau using satellite data. Geomat. Nat. Hazards Risk 2017, 8, 466–477. [Google Scholar] [CrossRef] [Green Version]
- Huang, W.; Qiu, T.; Yang, Z.; Lin, D.; Wright, J.; Wang, B.; He, X. On the Formation Mechanism for Wintertime Extreme Precipitation Events Over the Southeastern Tibetan Plateau. J. Geophys. Res. Atmos. 2018, 123, 12692–12714. [Google Scholar] [CrossRef]
- Yao, T.; Xue, Y.; Chen, D.; Chen, F.; Thompson, L.; Cui, P.; Li, Q. Recent third pole’s rapid warming accompanies cryospheric melt and water cycle intensification and interactions between monsoon and environment: Multidisciplinary approach with observations, modeling, and analysis. Bull. Am. Meteorol. Soc. 2019, 100, 423–444. [Google Scholar] [CrossRef]
- Wang, S.; Zhou, L.; Wei, Y. Integrated risk assessment of snow disaster over the Qinghai-Tibet Plateau. Geomat. Nat. Hazards Risk 2019, 10, 740–757. [Google Scholar]
- Chen, Q.; Liu, F.; Chen, R.; Zhao, Z.; Zhang, Y.; Cui, P.; Zheng, D. Trends and risk evolution of drought disasters in Tibet Region, China. J. Geogr. Sci. 2019, 29, 1859–1875. [Google Scholar] [CrossRef] [Green Version]
- Zhang, A.; Wang, J.; Jiang, Y.; Chen, Y.; Shi, P. Spatiotemporal changes of hazard intensity-adjusted population exposure to multiple hazards in Tibet during 1982–2015. Int. J. Dis. Risk Sci. 2018, 9, 541–554. [Google Scholar] [CrossRef] [Green Version]
Figure 1.
Topographic characteristics and meteorological station distribution in the QTP.

Figure 2.
The spatial patterns of meteorological drought hazard across the QTP. (a) annual drought days; (b) the longest consecutive drought days; (c) annual accumulated drought intensity; (d) drought hazard index.
Figure 2.
The spatial patterns of meteorological drought hazard across the QTP. (a) annual drought days; (b) the longest consecutive drought days; (c) annual accumulated drought intensity; (d) drought hazard index.

Figure 3.
The spatial patterns of rainstorm hazard across the QTP. (a) annual rainstorm days; (b) annual accumulated rainstorm precipitation; (c) maximum daily precipitation; (d) rainstorm hazard index.
Figure 3.
The spatial patterns of rainstorm hazard across the QTP. (a) annual rainstorm days; (b) annual accumulated rainstorm precipitation; (c) maximum daily precipitation; (d) rainstorm hazard index.

Figure 4.
The spatial patterns of snowstorm hazard across the QTP. (a) annual accumulated snowfall; (b) annual snow cover days; (c) maximum snow depth; (d) snowstorm hazard index.
Figure 4.
The spatial patterns of snowstorm hazard across the QTP. (a) annual accumulated snowfall; (b) annual snow cover days; (c) maximum snow depth; (d) snowstorm hazard index.

Figure 5.
The spatial patterns of hailstorm hazard across the QTP. (a) annual gale days; (b) annual hail days; (c) hailstorm hazard index.
Figure 5.
The spatial patterns of hailstorm hazard across the QTP. (a) annual gale days; (b) annual hail days; (c) hailstorm hazard index.

Figure 6.
Mapping of (a) multi-hazard index and (b) meteorological hazards regionalization in the QTP.
Figure 6.
Mapping of (a) multi-hazard index and (b) meteorological hazards regionalization in the QTP.

Figure 7.
Temporal evolution in the spatial extent of hazard zones and exposed population of droughts, rainstorms, snowstorms and hailstorms for 2001–2019 in the QTP.
Figure 7.
Temporal evolution in the spatial extent of hazard zones and exposed population of droughts, rainstorms, snowstorms and hailstorms for 2001–2019 in the QTP.

Figure 8.
Spatial differences in (a) droughts hazard index, (b) rainstorms hazard index, (c) snowstorms hazard index, and (d) hailstorms hazard index, between 2010s and 2000s as percentages in the QTP.
Figure 8.
Spatial differences in (a) droughts hazard index, (b) rainstorms hazard index, (c) snowstorms hazard index, and (d) hailstorms hazard index, between 2010s and 2000s as percentages in the QTP.


Table 1.
The indicator system of meteorological hazards assessment over the QTP.
| Hazard | Index | Hazard Level | |||
|---|---|---|---|---|---|
| High | Moderate | Low | Very Low | ||
| Drought | Drought Days (d) | ≥60 | 50~60 | 40~50 | <40 |
| Maximum Consecutive Drought Days (d) | ≥35 | 30~35 | 25~30 | <25 | |
| Accumulated Intensity of Drought | ≥70 | 60~70 | 50~60 | <50 | |
| Rainstorm | Rainstorm Days (d) | ≥4 | 2~4 | 1~2 | <1 |
| Accumulated Rainfall (mm) | ≥100 | 75~100 | 50~75 | <50 | |
| Maximum 24-h Rainfall (mm) | ≥35 | 25~35 | 15~25 | <15 | |
| Snowstorm | Accumulated Snowfall (mm) | ≥120 | 70~120 | 20~70 | <20 |
| Snow Cover Days (d) | ≥30 | 20~30 | 10~20 | <10 | |
| Maximum Snow Depth (cm) | ≥8 | 5~8 | 2~5 | <2 | |
| Hailstorm | Gale Days (d) | ≥80 | 40~80 | 10~40 | <10 |
| Hail Days (d) | ≥8 | 4~8 | 1~4 | <1 | |
Publisher’s Note: MDPI stays neutral with regard to jurisdictional claims in published maps and institutional affiliations. |
© 2021 by the authors. Licensee MDPI, Basel, Switzerland. This article is an open access article distributed under the terms and conditions of the Creative Commons Attribution (CC BY) license (https://creativecommons.org/licenses/by/4.0/).
Share and Cite
MDPI and ACS Style
Sun, S.; Zhang, Q.; Xu, Y.; Yuan, R. Integrated Assessments of Meteorological Hazards across the Qinghai-Tibet Plateau of China. Sustainability 2021, 13, 10402. https://0-doi-org.brum.beds.ac.uk/10.3390/su131810402
AMA Style
Sun S, Zhang Q, Xu Y, Yuan R. Integrated Assessments of Meteorological Hazards across the Qinghai-Tibet Plateau of China. Sustainability. 2021; 13(18):10402. https://0-doi-org.brum.beds.ac.uk/10.3390/su131810402
Chicago/Turabian StyleSun, Shao, Qiang Zhang, Yuanxin Xu, and Ruyue Yuan. 2021. "Integrated Assessments of Meteorological Hazards across the Qinghai-Tibet Plateau of China" Sustainability 13, no. 18: 10402. https://0-doi-org.brum.beds.ac.uk/10.3390/su131810402
Note that from the first issue of 2016, this journal uses article numbers instead of page numbers. See further details here.