
Assessing the Availability of Global Metals and Minerals for the Sustainable Century: From Aluminium to Zirconium


Environmental Engineering, School of Engineering, RMIT University, Melbourne 3000, Australia
Sustainability 2021, 13(19), 10855; https://0-doi-org.brum.beds.ac.uk/10.3390/su131910855
Submission received: 24 August 2021
/
Revised: 21 September 2021
/
Accepted: 27 September 2021
/
Published: 29 September 2021
(This article belongs to the Special Issue Criticality Versus Geological Scarcity: Different Concepts, Which May Need Tuning)
Abstract
:Mining supplies metals and minerals to meet the material and energy needs of the modern world. Typically, mineral resources are widely considered to be ‘finite’ in nature, yet, paradoxically, global production and reported reserves and resources continue to grow. This paper synthesizes an extensive array of data on the long-term trends in cumulative mine production, reserves and resources at a global level as well detailed case studies of Australia, a global leader in many sectors of mining, and lithium, a new metal with rapidly growing demand. Overall, the paper shows that growing mine production has been clearly matched by growing reserves and resources, although there are numerous complex social, environmental and governance factors which are already affecting mines and are expected to increasingly affect mining into the future. Thus it is not possible at present to determine the ‘ultimately recoverable resource’, especially as this is a dynamic quantity dependent on a variety of inter-related factors (e.g., exploration, social issues, technology, market dynamics, environmental risks, governance aspects, etc.). This finding reinforces the need for continuing detailed studies of all metals and minerals to understand their individual supply and use dynamics to help modern society meet its needs and sustainable development goals.
1. Background: Metallic and Mineral Needs for Society
“But even in our modern world, with its diverse sources of foods and textile materials, man’s unit consumptive capacity for these products does not greatly change from one year to another. On the other hand, his consumption of metals grows with the increasing complexity of civilization and it seems now as if his appetite would never be satisfied”.(page 67, Hewett, 1929).
The Anthropocene is widely viewed as an unofficial age of geology to indicate the widespread impact that humanity is now having on our planet. That is, our growing population and increasing consumption are now causing discernible changes and impacts across ecosystems and geology all over the world [1,2]. These impacts are driven by activities such as agriculture, urbanisation, energy, chemicals, transport and mining. In simple terms, to support societies, we either grow things (e.g., food, fibre, fuels) or we extract and mine them (e.g., metals, minerals, fossil fuels) to provide materials and energy.
Although agriculture is typically considered to be renewable (sustainable is a different issue), historically it has been involved with significant to severe landscape and ecosystems impacts (e.g., loss of forests and biodiversity, nutrient pollution, greenhouse gas emissions from stock, pesticides), impacts which continue today at an increasing pace in many parts of the world [3]. In contrast, the mining of metals and minerals is typically considered non-renewable and therefore unsustainable [4]. The two primary approaches used to explore the supply of metals and minerals are the ‘fixed stock’ or ‘opportunity cost’ paradigms, noting that metals and minerals are generally not consumed when used but remain available for recycling (unlike food and energy resources) [5]. The fixed stock paradigm asserts that metal and mineral stocks are finite within our planet and that extracting them is therefore intrinsically unsustainable. In contrast, the opportunity cost paradigm uses market price to assess the availability of a resource, meaning that as one resource is depleted the price would increase to allow the extraction of a different, perhaps more expensive resource.
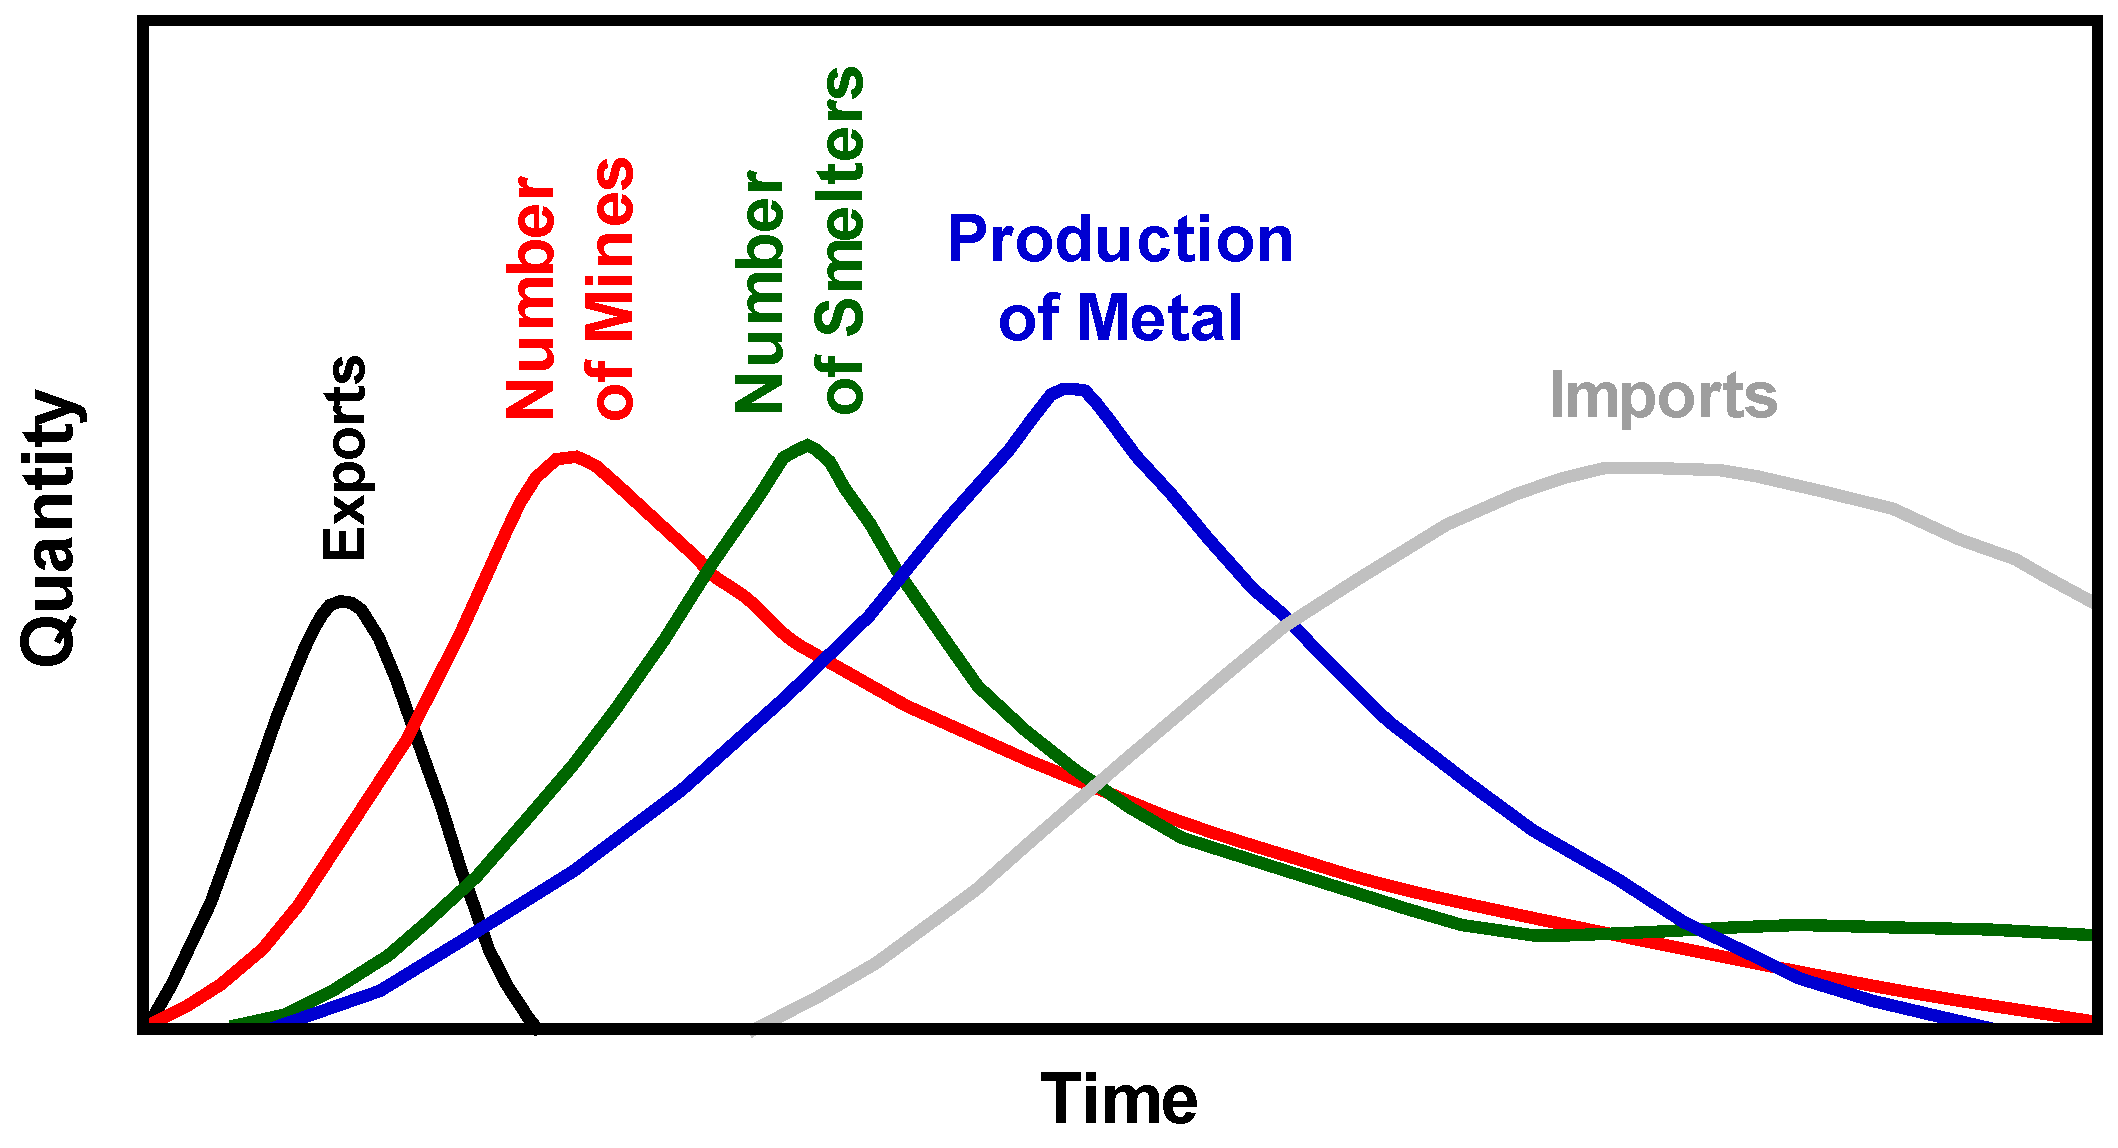
A way of visualising the ‘finite’ nature of metal and mineral resources was published by Hewett [6]. Hewett noted that the typical pattern of mining across Europe and the USA, shown in Figure 1, started with a rapid rise in exports, followed closely by an increasing number of mines and smelters, which reach a peak and then decline. Total production also rises to a peak and then declines, eventually meaning demand is met by imports instead. Mining was influenced primarily by geology, technology, economics and political factors. The overall rise-and-fall pattern was controlled by the finite size of mineable metal deposits as much as market prices versus mining costs, technological options and socio-political issues such as wars, labour and legal or governance aspects (especially government vs. private ownership, itself a complex quagmire to unravel).
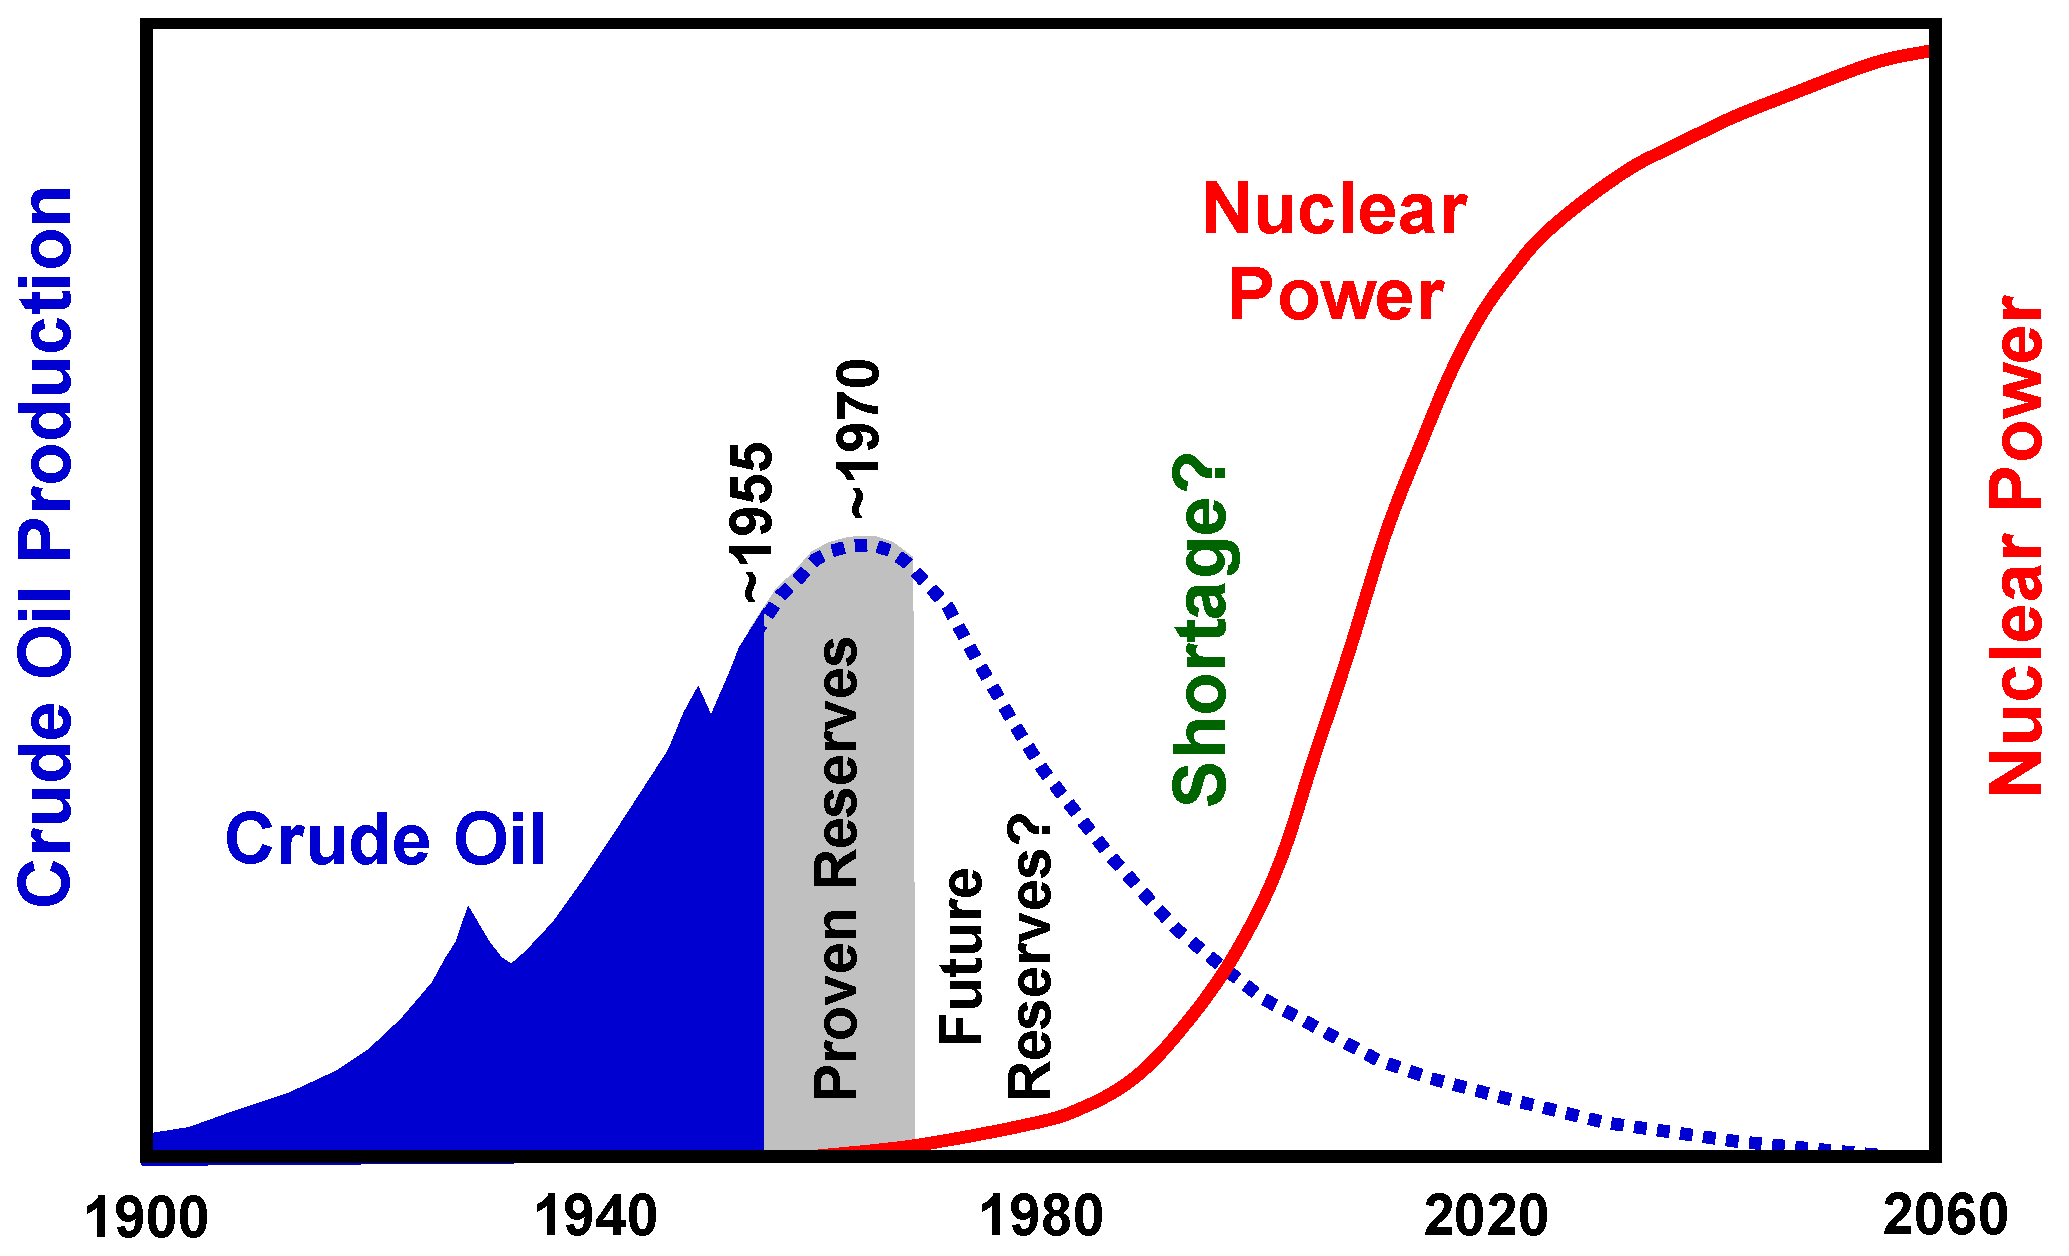
Hubbert [7] first began to examine petroleum production from the same kind of thinking as Hewett had carried out for metals, proposing that a ‘peak’ curve could be similarly adopted for oil. Hubbert based his theory of ‘peak oil’ on the rise and fall of historical oil fields, known reserves and likely additional reserves yet to be found. A major concern of Hubbert’s was not merely the timing and magnitude of any specific peak but the consequences of running out for American society and the need to import oil—a critical issue which is often overlooked [8]. Given that nuclear energy was the new energy source being strongly promoted in the mid-1950s (leaving aside the obvious difference between electricity and liquid transport fuels), Hubbert explored the transition from oil to nuclear, shown in Figure 2. The primary challenge Hubbert foresaw was the gap after the peak in oil production before nuclear energy rose to replace it—in others words, a significant potential energy shortage during this unplanned transition. Thus, despite misunderstandings about Hubbert and his life’s work, he was not worried about ‘running out’—rather what we do about it. Put simply, it was about transitions from one resource to the next and how to govern and manage that transition effectively—what we now think of as sustainable resource use [8].
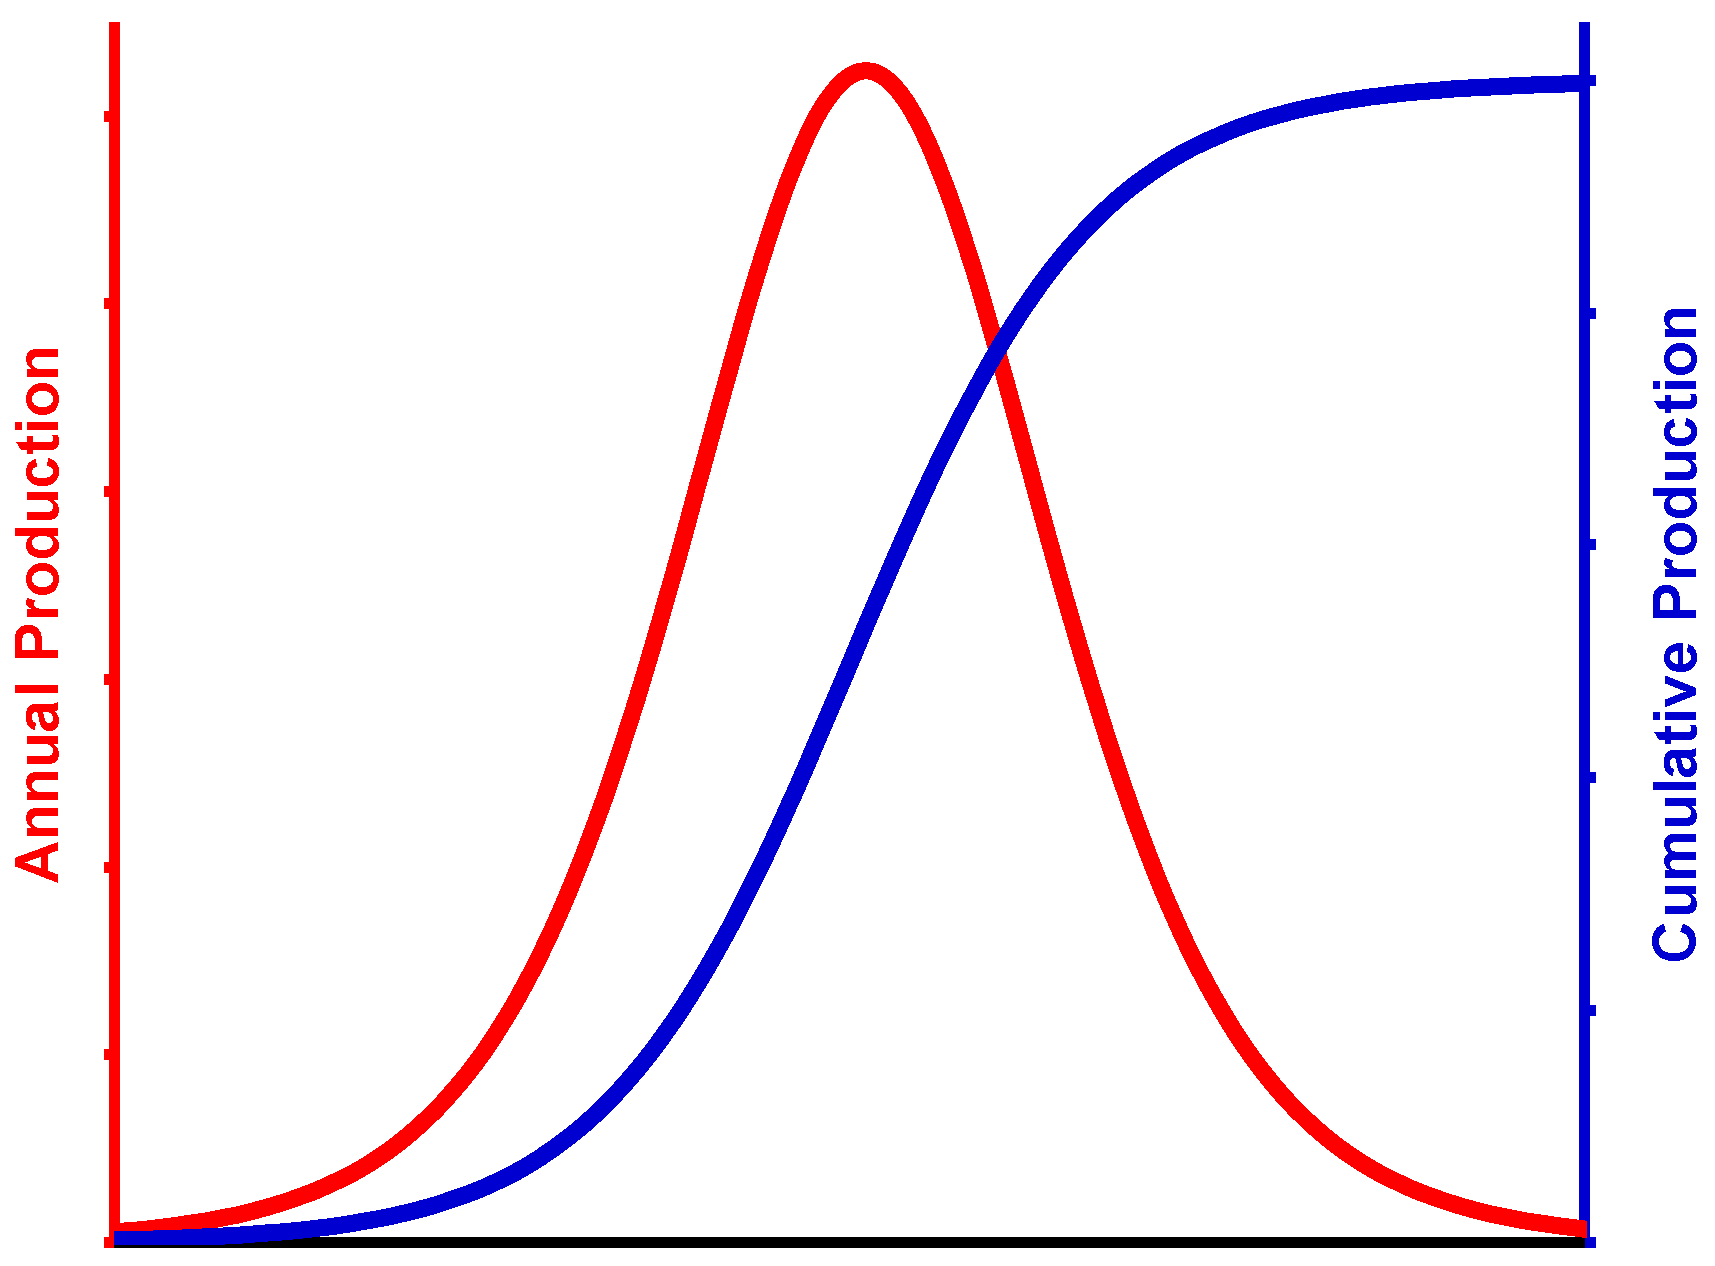
An important aspect of Hubbert’s peak is its simplified mathematical basis, whereby production rises and falls in a bell-shaped curve, meaning cumulative production follows a sigmoidal curve, as shown in Figure 3. Whilst there are many approaches to mathematically verifying the exact bell shape for different commodities, there is still a need to account for changes in market prices, technology and new discoveries, all of which can expand the ‘ultimately recoverable resources’ and change the timing and magnitude of the production peak. Furthermore, it is not always obvious at what point metals and minerals may be on their respective peak curve. These curves can, however, be used in a simple manner to visually compare to actual data for metals and minerals and assess their most likely position on Hubbert’s peak.
In the mining industry there are strict codes or guidelines which govern the assessment and reporting of mineral deposits which could be mined. There are two types of categories used to assess mining potential, namely ore (or mineral) reserves and mineral resources, as used in codes in Australia (JORC), Canada (NI43-101), South Africa (SAMREC), Europe (PERC) and the USA (IG7) (amongst others; see [9]). Reserves represent short-term mine plans and are expected to be profitable, whereas resources are longer-term potential and geologically well understood but have less certainty on their economics or other aspects. Resources can be stated as including or excluding reserves. Over time, it is common for a mining project to show resources being upgraded to reserves and then become production, with total endowment increasing concurrently (i.e., cumulative production plus remaining reserves and resources). Whilst this growing endowment pattern is now well established for many mining projects around the world (e.g., [10,11,12,13], there are exceedingly few studies of national endowments over time (especially other than common metals such as copper, gold, iron ore).
A mine is typically focussed on extracting a single metal or mineral (e.g., gold, iron ore, manganese ore), or sometimes a few metals or minerals. For some elements, they are only extracted at a smelter or refinery with credit rarely being given to the mine which extracted it. This is driven by elements which are predominantly substitute elements in primary host minerals, such as indium or germanium in sphalerite or gallium in alumina. For such substitute elements, this means that mines do not focus or optimise for their recovery (instead focussing on the primary metals or minerals which drive revenue and profitability), with extraction at a smelter or refinery dependent on whether that facility has the requisite process circuits for extraction of that particular metal. Although these many of these metals are increasingly sought after and useful for modern technology, they still represent very minor sources of revenue for mines and smelters-refineries. For example, indium recovery often represents about 0.5–1% of the revenue associated with zinc refinery [14,15]. The resource codes used across the mining industry do not have specific definitions of primary products versus possible co- or by-products, meaning that it is up to an individual mining, smelting or refining company to choose to report such minor products (or not, as is typically the case). The lack of reported extraction data at a mine and smelter-refinery can often be confused with a lack of sufficient resources or reserves, yet given the dependence on a primary host metal, it is reasonable to expect that the substitute element is sufficiently abundant if the host metal is also similarly abundant [9].
The several billion people now inhabiting our planet require energy, food, water, metals and minerals to provide for a reasonable standard of living. Over time, the growing material complexity of modern technology has seen an increase in the number of elements now in active use. Until the mid-twentieth century, society used just 12 materials, but now a computer chip requires at least 60 elements to function [16,17]. This means that society now makes use of most of the Periodic Table of the Elements—effectively from aluminium (Al) to zirconium (Zr). Given the grand challenges of climate change and sustainable development (e.g., [3]), this also means that the shift to renewable energy, energy storage batteries and electric vehicles (EVs) will necessitate a different mix of metals and minerals needed for the coming decades. For example, the quantities of lithium, nickel, cobalt, manganese and graphite needed for batteries used in EVs, home systems and electrical utility grids could mean up to an order of magnitude increase in battery metal demand alone by 2040 [18,19]. In parallel, there is a rapidly growing demand for rare earth elements (REE or oxides as REOas this is the most common form used for manufacturing) for numerous technologies, especially neodymium, dysprosium and terbium used in permanent magnets for wind turbines and EVs [20]. The two primary frameworks which are continuing to support and drive these changes in modern technology are the 2015 Paris Agreement on climate change (i.e., the shift to renewable energy and EVs) and the United Nations Sustainable Development Goals (SDGs), which combined are helping to transform the mix of metals demanded by modern society.
An important area of concern around metals and minerals is the reliability and concentration of supply as well as the vulnerability of technology to disruptions in supply. Various metals or minerals are now commonly labelled as ‘critical’ since any disruption to their supply could have significant environmental and economic consequences. For example, in 2019, mine production of platinum group elements dominated by South Africa (58.7%) [21], where concerns focus on socio-economic stability and governance due to the importance of platinum group elements in autocatalysts used in pollution control for vehicles. The rare earth elements (or oxides) are crucial for permanent magnets used in wind turbines, electronics, batteries, specialty alloys, all of which are crucial in the energy and transport transitions underway to address climate change and sustainable development needs globally. In 2019, mine production of rare earth oxides was dominated by China (71.4%) [21], noting that restriction of rare earth exports from 2010 to 2015 highlighted the critical nature of this group of elements.
All of this means that it is more important than ever before to understand the available data on mining and longer-term metals and minerals supply potential, especially those needed for the energy and transport transition. In other words, when looking at time horizons to say 2050 or 2100, are we likely to approach resource limits in this time which could impact climate or sustainable development goals? This paper therefore presents a synthesis of long-term data on reported global reserves and production, long-term resource-reserve-cumulative production data for Australia, and a global review of lithium mining. In this way, the extensive data addresses concerns about the availability of metal and mineral resources to meet rapidly growing demands—especially whether we are approaching peak production and limits in resource availability. Overall, the paper is a detailed exploration of the reserves and mining of numerous metals and minerals ranging from aluminium to zirconium.
2. Approach and Methodology
The primary approach adopted for this paper is to synthesize long-term data sets on reserves, resources and cumulative mine production, focussing on the global scale as well as Australia and lithium as detailed case studies. The primary data sources include:
- Lithium—global mine production synthesized from [21].
It should be noted that the definition and technical approach to quantifying reserves and resources has evolved over time [31], meaning that the data compiled herein is synthesized as is and effectively represents a meta-study. For the purposes of examining trends at decadal scales, this is a reasonable approach.
3. Results: Key Trends in Global Reserves and Mine Production
To provide context for the current scale of global mining, Table 1 shows 2020 world mine production, the leading world producer, Australia’s share, prices and world and Australian market value. The results show that coal is the largest global mining sector, followed by iron ore, gold and copper. The next most important sectors are still the traditional metals or minerals, such as alumina (aka aluminium), potash (K2O), nickel, zinc and manganese, although silicon is curiously at 10th place. Curiously, many of the metals of increasing importance to modern technology, such as cobalt, rare earths and lithium are placed 20th, 22nd and 31st in value, demonstrating their relatively modest scale compared to their traditional cousins. This also places in stark contrast the scale of the economic transition underway—moving from coal at USD 602.8 billion to a combined lithium-cobalt-rare earth value of USD 8.5 billion. Even with the predicted order of magnitude increases in the latter sectors, it will still fall short of the value of coal by almost an order of magnitude. Whilst this is arguably quite beneficial from a climate change and sustainable development perspective, it does lay bare the scale of the socioeconomic transition which is needed for the coal sector as it declines to give way to more renewable energy, batteries and EVs.
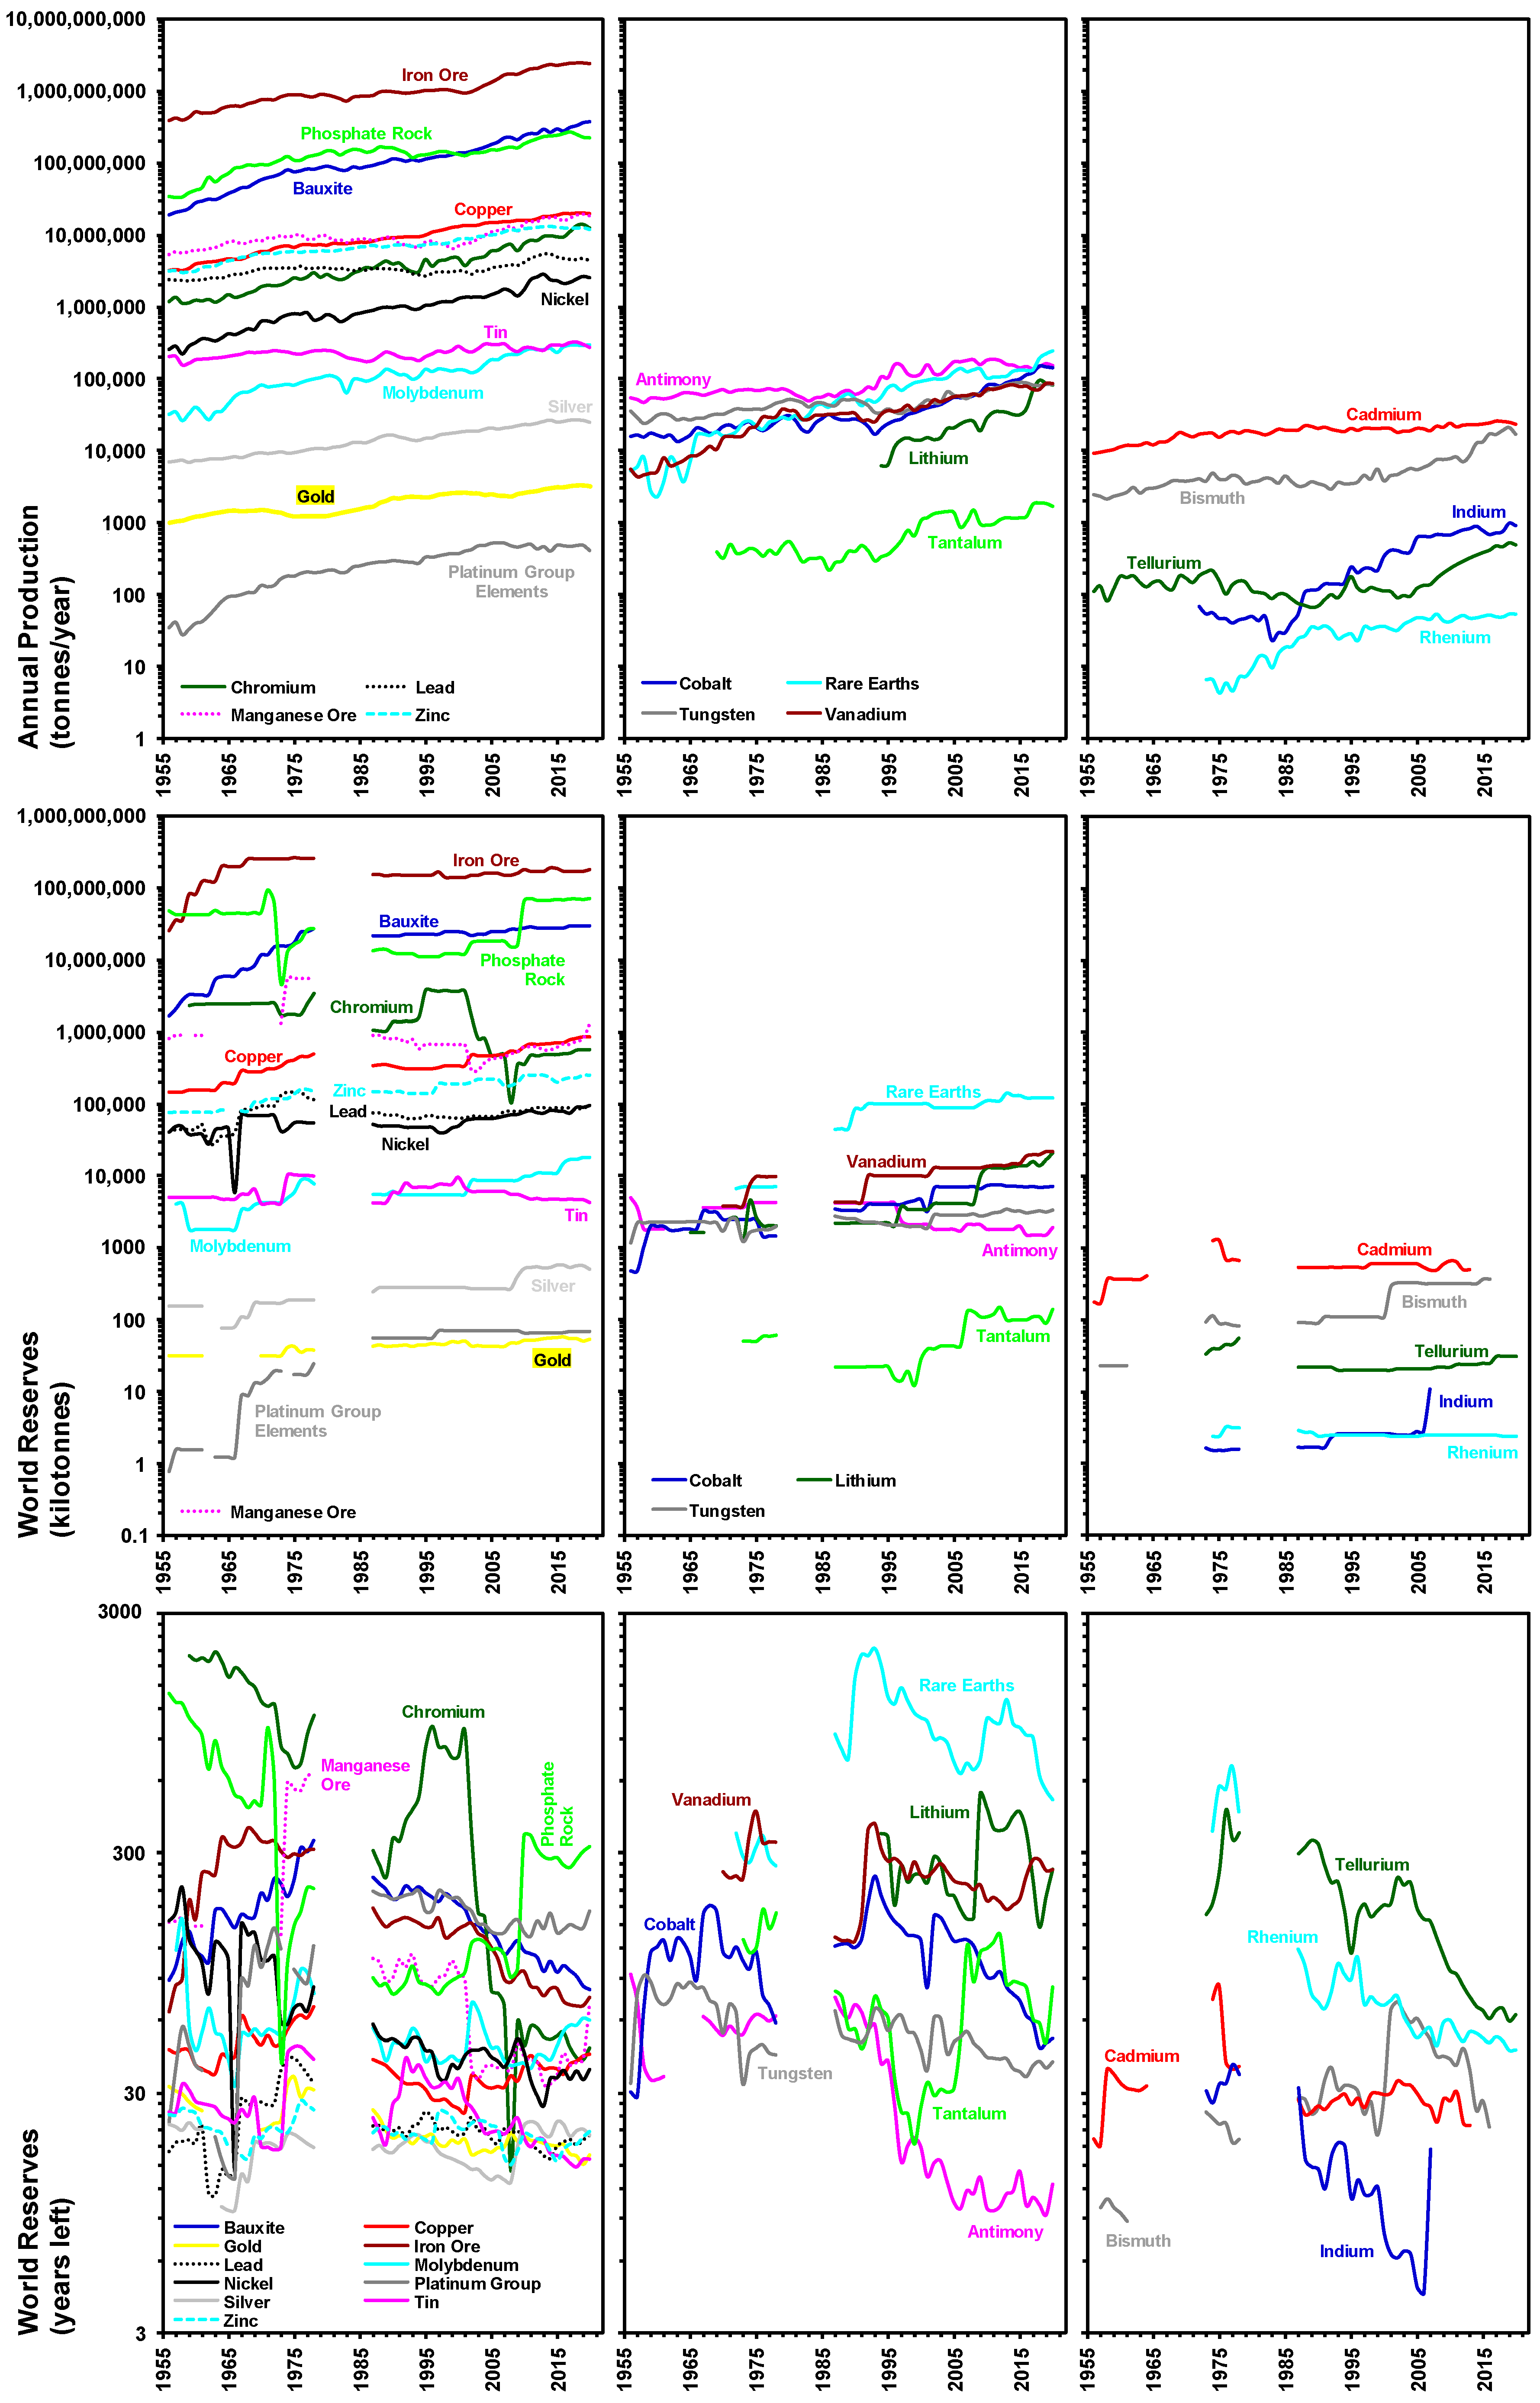
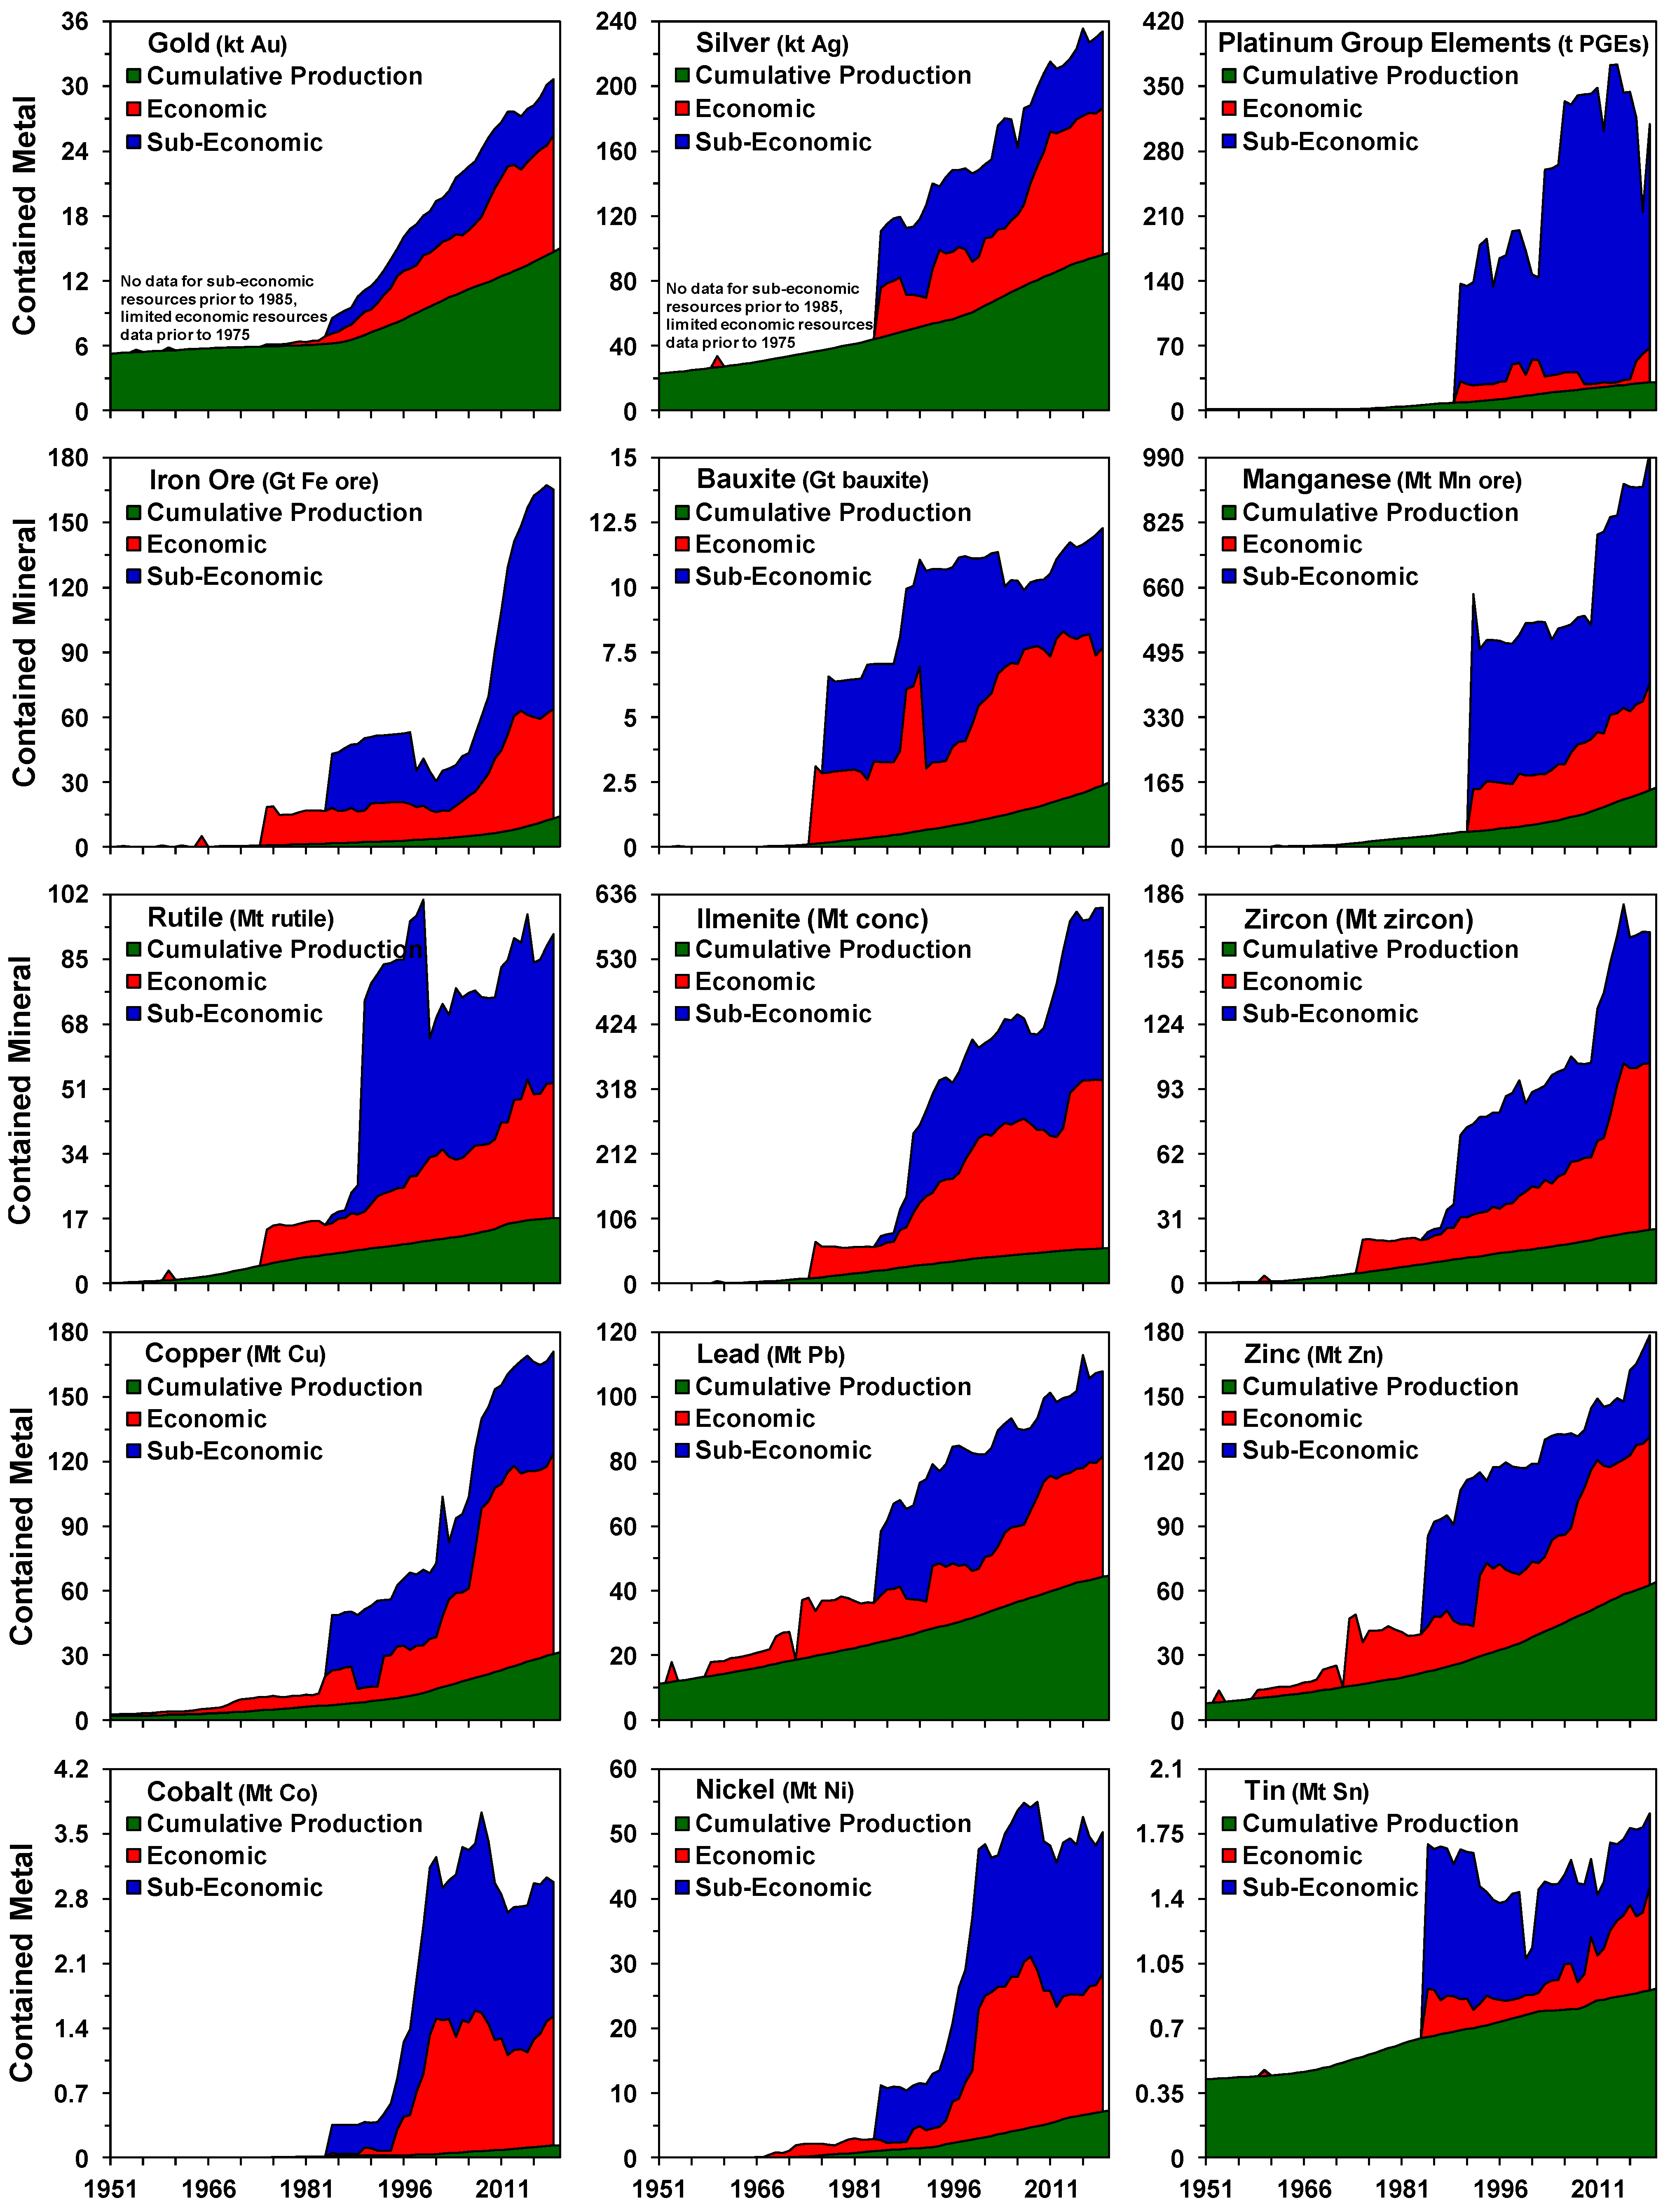
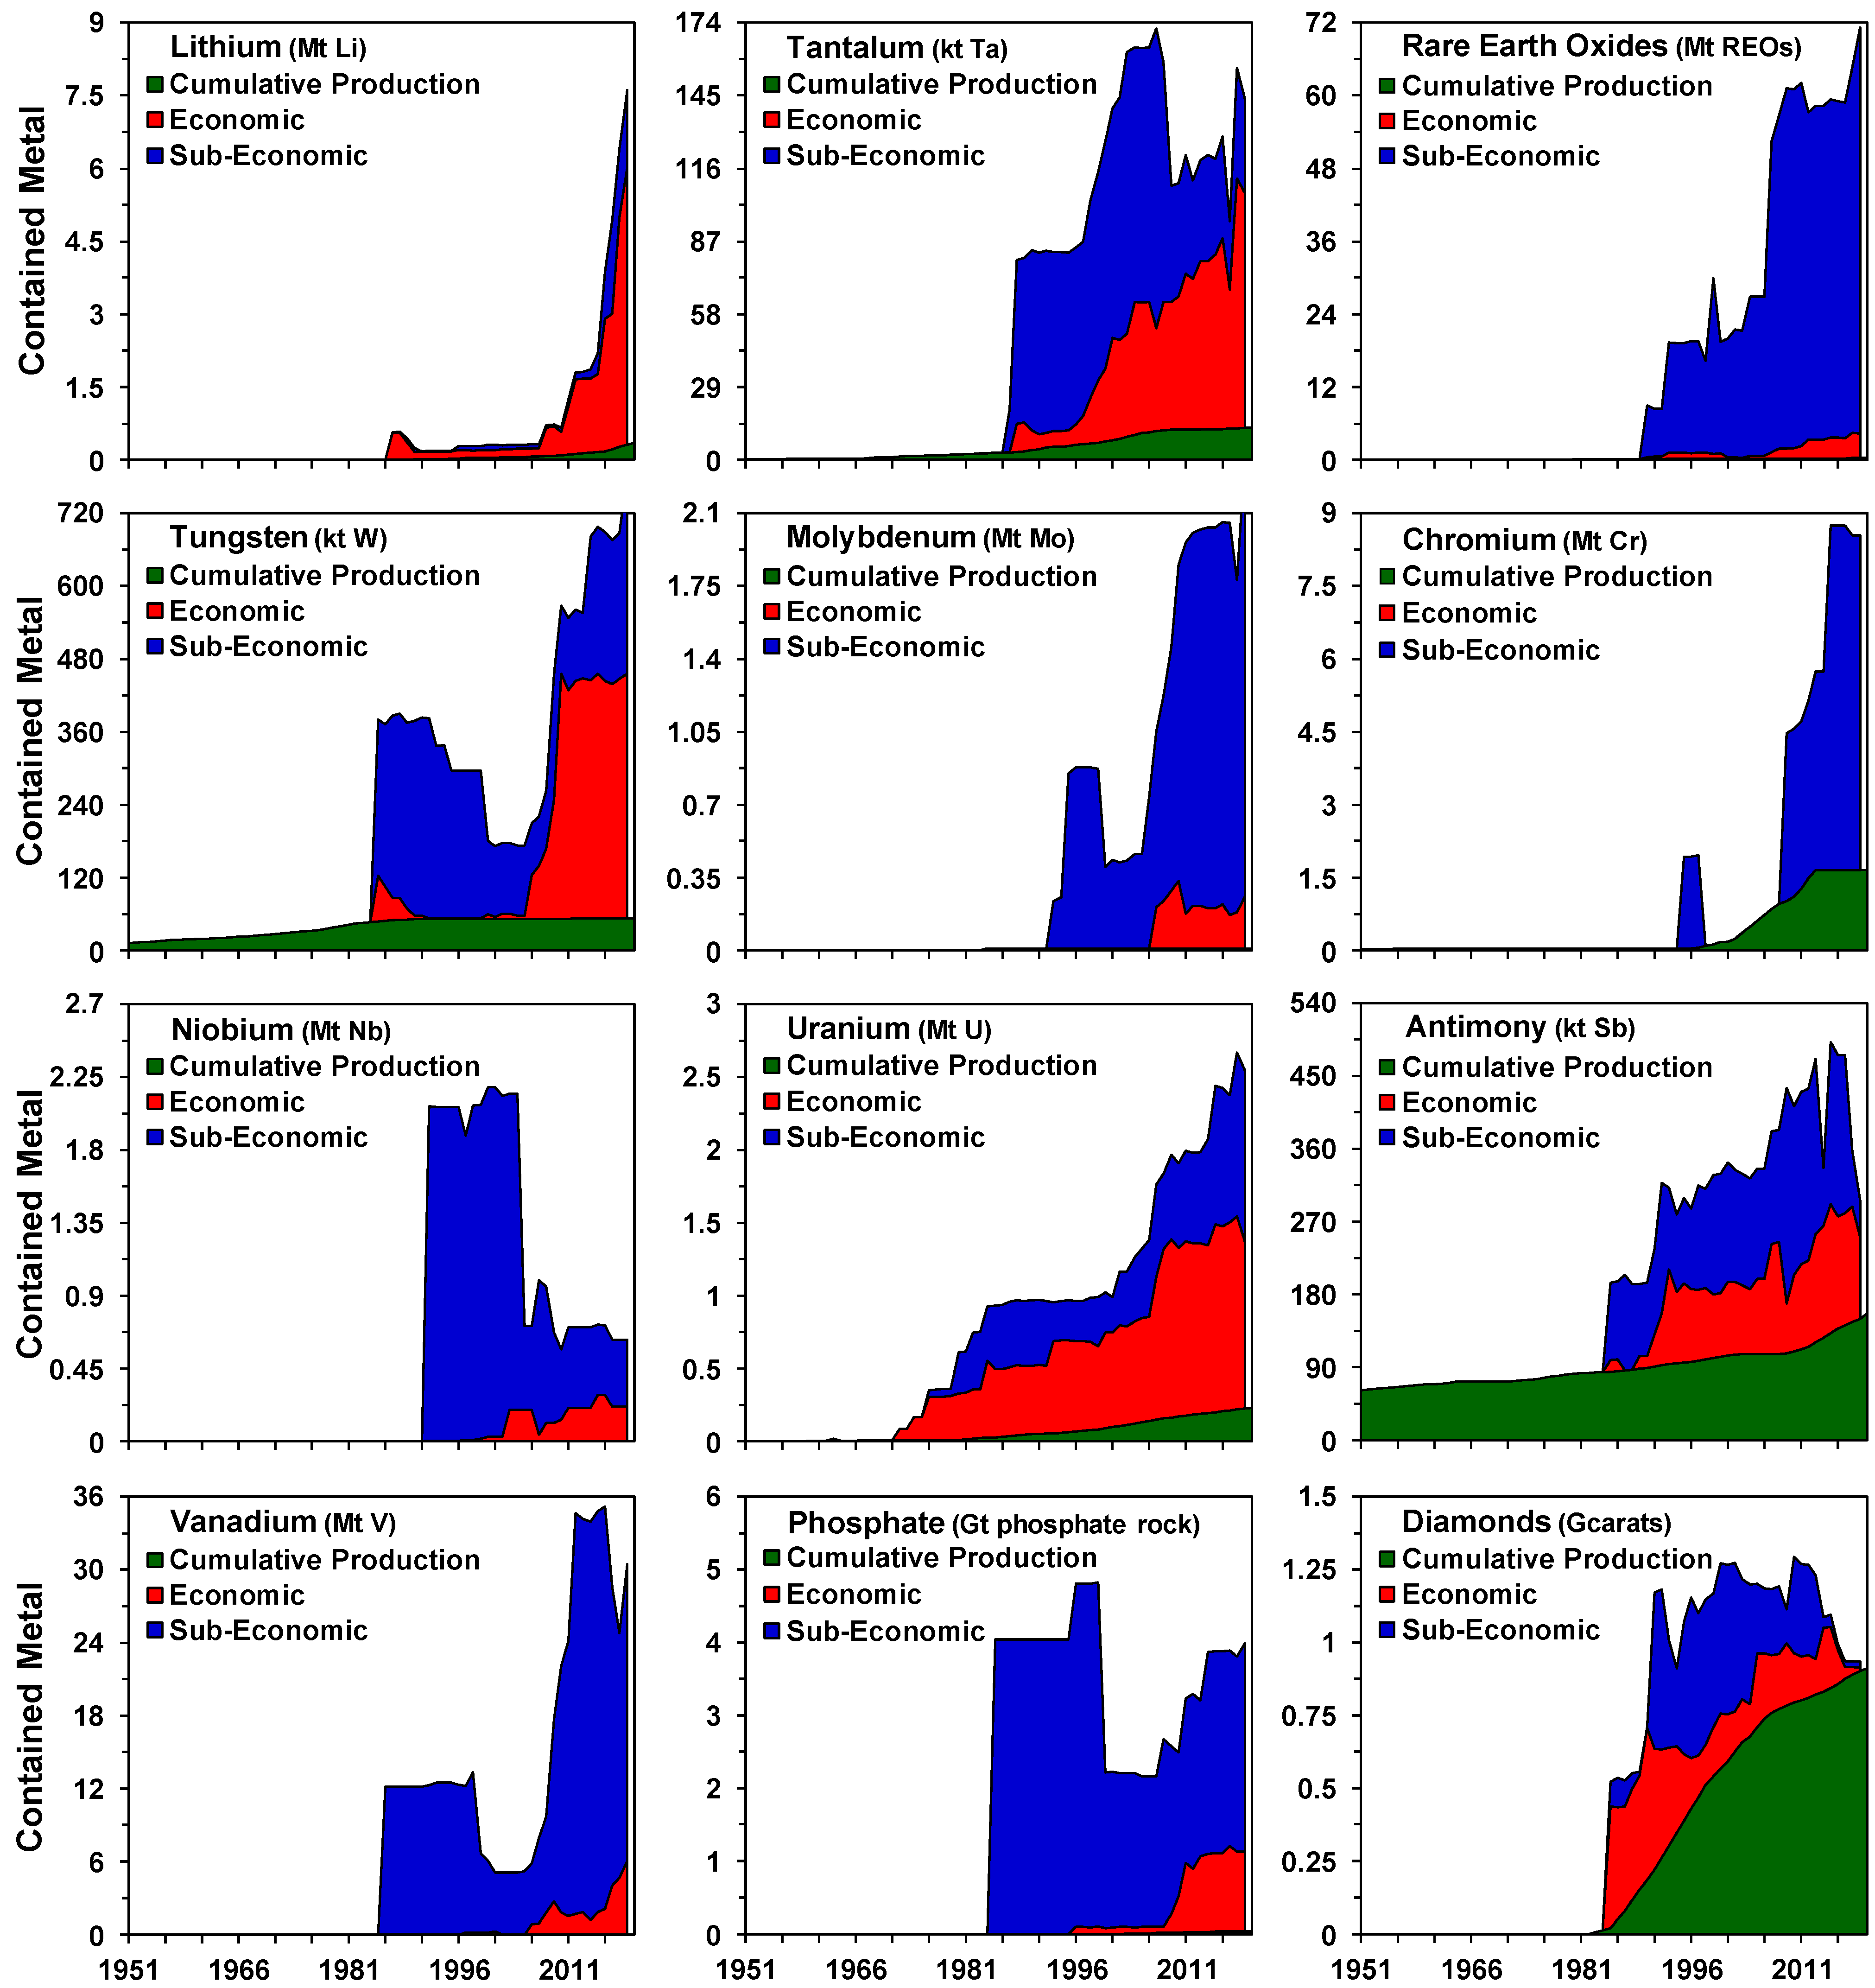
The long-term trends in world metal and mineral production, reserves and years remaining are shown in Figure 4. The results are grouped as common metals and minerals (e.g., iron ore, gold, copper, zinc, etc.), specialty metals which are mostly mined as primary products (e.g., tantalum, tungsten, lithium) or important by-products (e.g., antimony, cobalt) or metals only extracted as smelter-refinery by-products (e.g., tellurium, cadmium, indium, rhenium, bismuth). The intention is not to provide a detailed, explicit view of each individual metal or mineral, nor to develop a statistical assessment or narrative, but rather show the relative scales of the main groupings used as well as the bulk overall patterns. Over time, there is a gradual increase in production of almost all metals and minerals, allowing for shorter term reductions due mainly to market volatility. For reserves, most metals and minerals show either a gradual increase over time (e.g., copper, gold, zinc, bauxite) or a somewhat steady pattern (e.g., iron ore, platinum group elements). Some metals and minerals, however, do show a gradual decline over time (e.g., tin, antimony), most likely related to the small nature of these particular sectors and the lack of investment in exploration to find new or additional reserves. There is certainly no clear evidence in reserves over time that any specific metal or mineral commodity is approaching a trend which could be described as depletion. This finding is further demonstrated by the trends in ‘years remaining’ (reserves divided by annual production), which often remain similar over the decades shown for some metals (e.g., tin, vanadium, tungsten, platinum group elements), highly variable (e.g., phosphate rock, chromium, manganese ore) or a very gradual decline for numerous metals, especially in the past few decades (e.g., bauxite, iron ore, antimony, tellurium). The declines often represent rapid increases in annual production or the smaller market size of that sector (meaning less interest in exploration and mine development) but given the continuity of the magnitude of reserves over time, it is hard to be definitive in interpretation. In reality, there are many factors which give rise to estimates of reserves, of which exploration, market size and prices, technology, demand profile and mining costs are but some aspects—others can include environmental regulation, social issues, governance policies at the corporate, national government and intergovernmental level as well as consumer choices and preferences. Examples include cobalt from the Congo in central Africa and all of its complex issues, tantalum from Rwanda, the ‘lithium triangle’ in South America or rare earths from China. These and many other similar contexts are beyond the scope of this paper to explore in detail but highlight that the assessment of reserves in the mining industry is a complex endeavour and subject to numerous multifaceted and often competing factors and issues (see [31,40]).
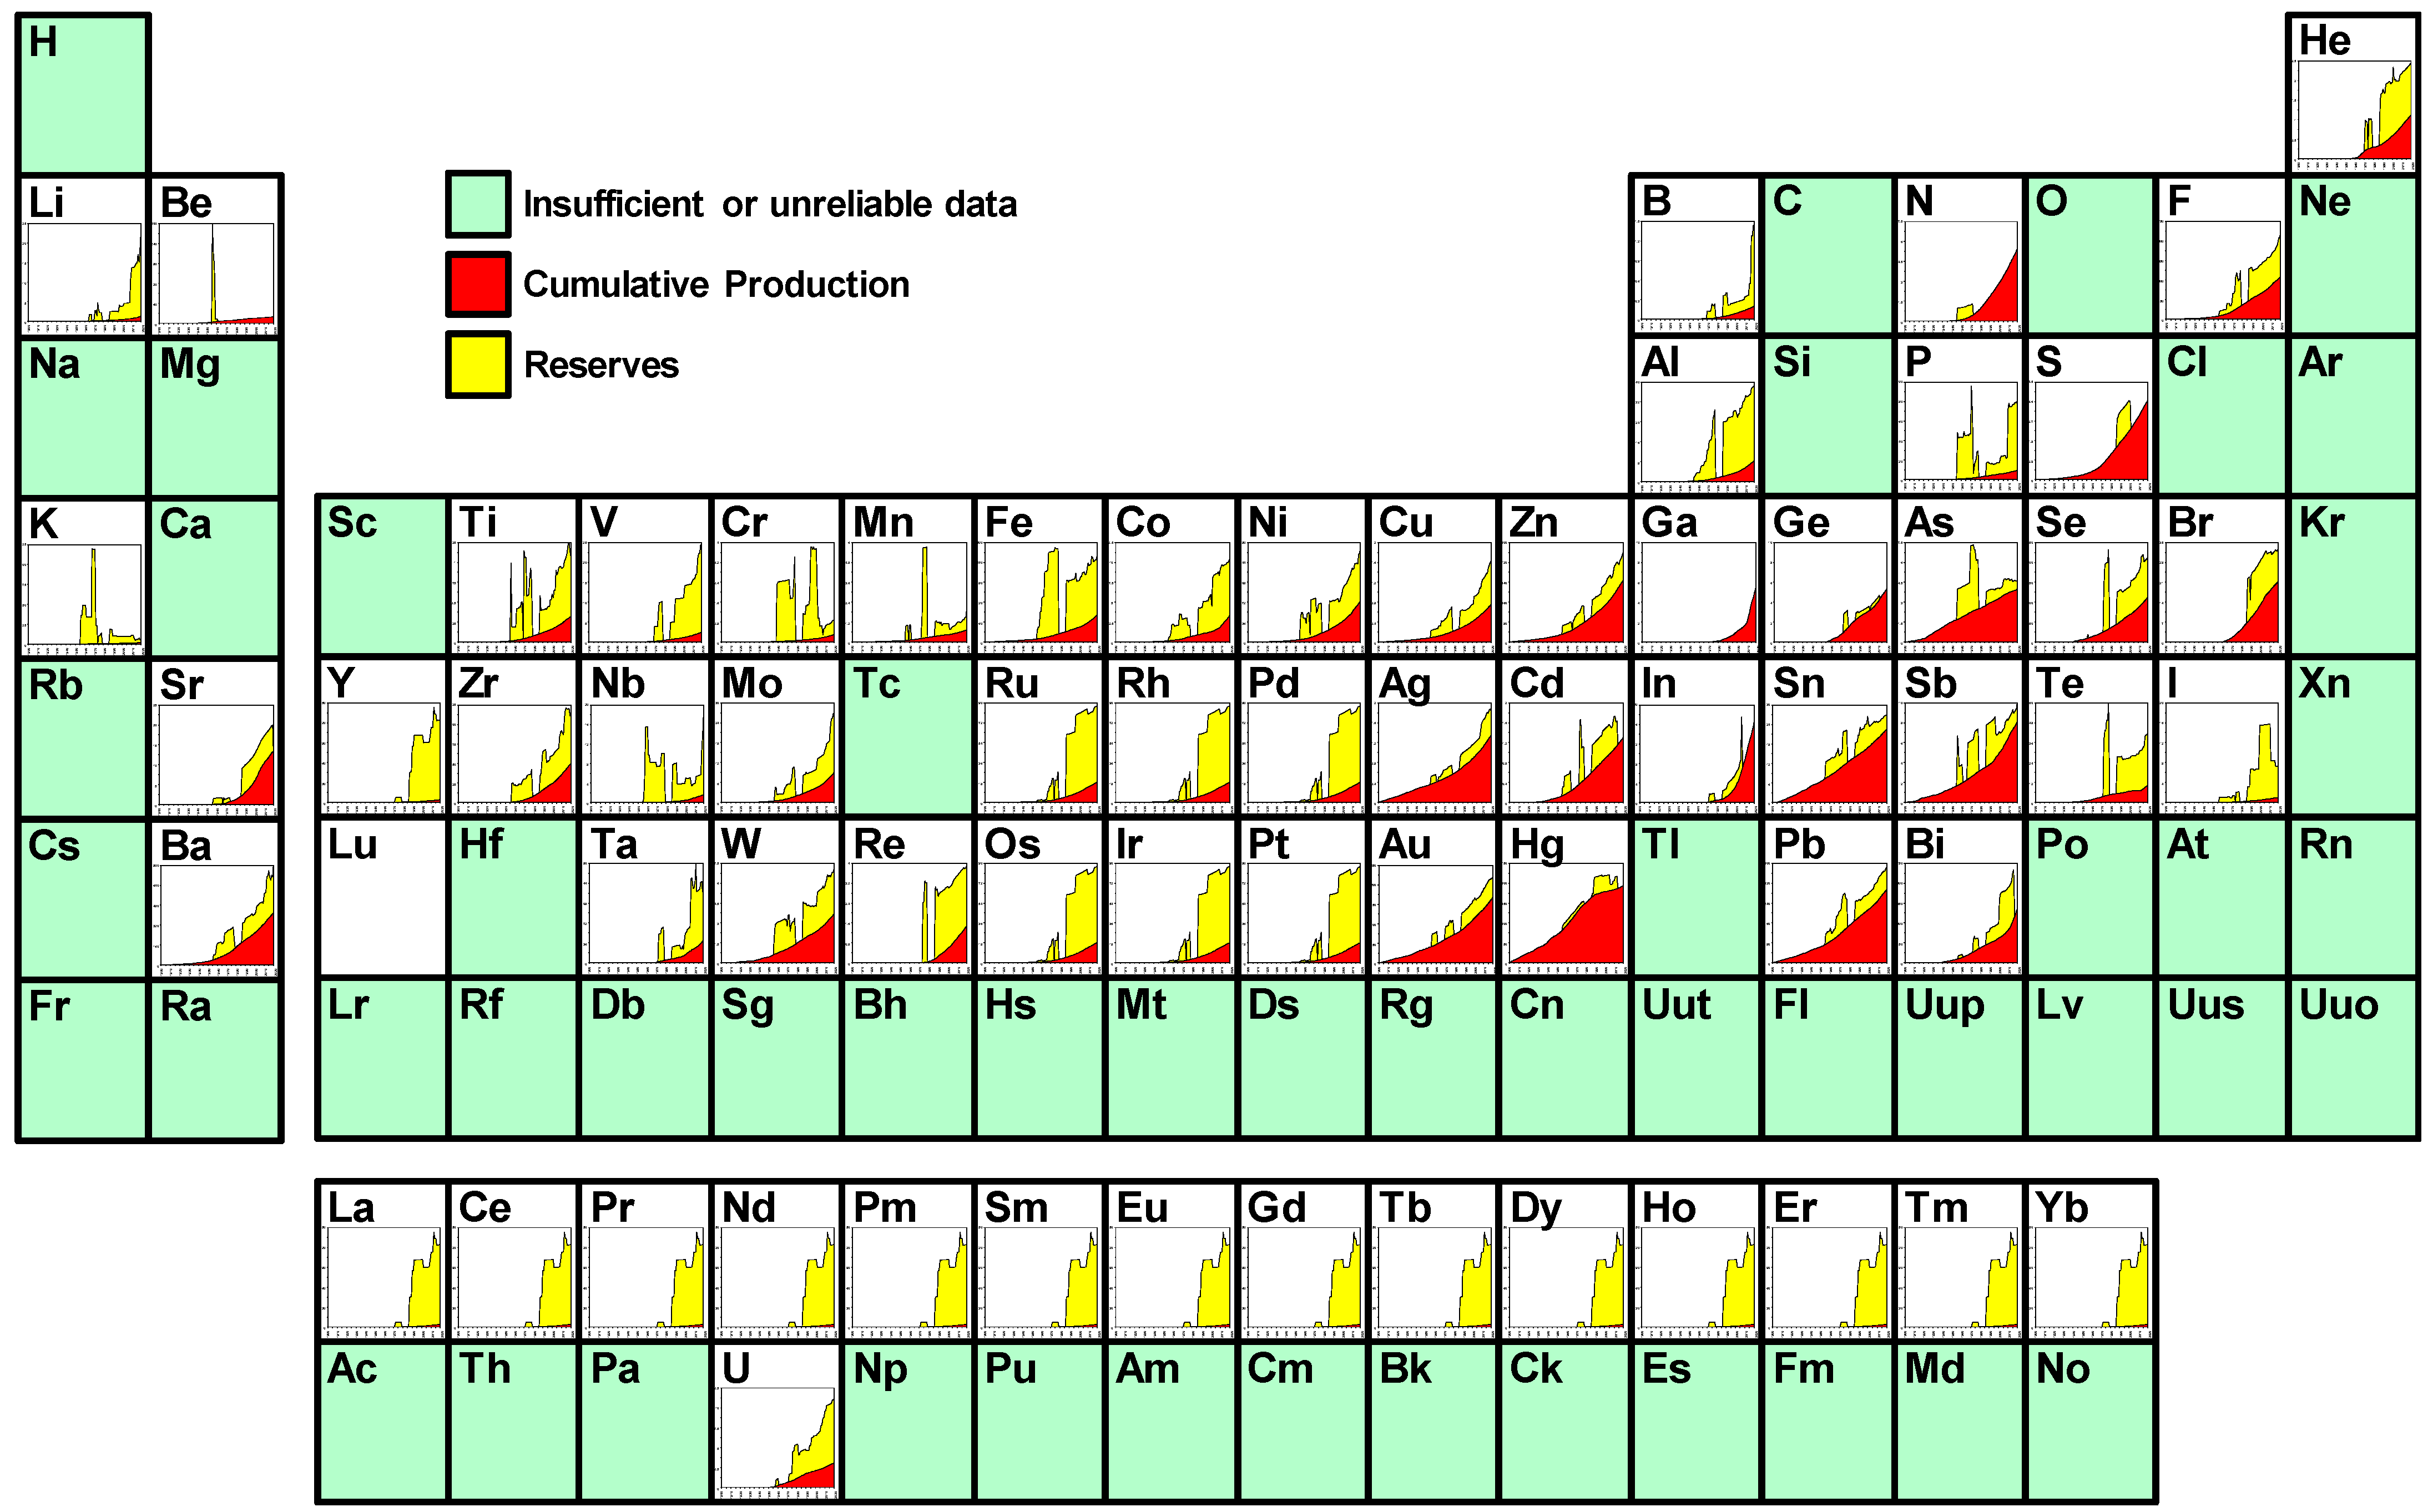
A different presentation of the global metals and minerals is developed in Figure 5, where cumulative production plus reserves over time (i.e., endowment) are shown for each individual element within the Periodic Table of the Elements. For most elements the data is contained metal, whilst for a minority the data represents the most common mineral form which is extracted (e.g., barite, bauxite, oxides). Each element could be explored in great detail to unpack details around the trends in its production and reserves over time, assessing the role of new discoveries, mining technology, market dynamics or policy aspects. Although the USGS reserves data are generally comprehensive, there are some important caveats, such as major countries missing or changes in methodology over time. As such, the reserves data shown should be considered a bare minimum, with the ‘true’ global reserves being greater than the USGS data implies. Whilst there are often unique stories for each element, it is the overarching pattern which is fundamentally important: almost every element shows a continually increasing cumulative production with significant reserves remaining (albeit with variable ratios between cumulative production by 2020 and remaining reserves). The only arguable exception would be mercury, where cumulative production appears to have plateaued recently, although this most likely a result of mercury’s high toxicity and limited uses dampening demand more than ‘running out’. With respect to Hubbert-style curves, the extensive presentation of metals and minerals in Figure 5 does not suggest that any element is fast approaching a peak or plateau in cumulative production, highlighting that exploration, technology and market dynamics have been sufficient in growing endowments to date.
Ultimately, it would be ideal to develop a comprehensive systems dynamics model of mining and metal-mineral use which incorporates all of the above factors and their complex social, environmental, technological and economic interactions, allowing an exploration of future scenarios of resource use (especially potential recycling or circular economy strategies). The earliest examples of this include the famous ‘Limits to Growth’ studies [41,42] and others (e.g., [43,44]), although there are invariably many assumptions made within these studies which still do not account for the full complexity noted herein (see [45]).
4. Results: Key Trends in Australia’s Resources and Mining
Australia has a long history of mining across most metal and mineral commodities [46,47] and is therefore a great choice for a detailed case study which examines long-term trends in cumulative mine production, reserves and additional resources. It should be noted that Geoscience Australia adopts the concept of economic resources, which is similar to reserves, and sub-economic resources, which is akin to additional mineral resources. The long-term trends for common metal and mineral commodities are shown in Figure 6, with critical and other metals or minerals shown in Figure 7. The obvious overall pattern is one of growing endowment over time (i.e., cumulative production plus economic and sub-economic resources), allowing for short-term variability driven by fluctuating market prices. The production of some commodities appears to have stagnated in the past decade or two, such as cobalt, nickel, tin and phosphate rock, whilst only diamonds and niobium have declined. Specific observations include:
- Gold—by the 1970s the gold sector in Australia was a distant shadow of its glory days from the 1850s to the 1910s (the ‘gold rush’ era), hence the cumulative production appears somewhat flat in the 1950s–60s with negligible economic resources. The strong and continuing rise in the gold price in the 1970s combined with new cyanide-based process technology (namely carbon-in-pulp, carbon-in-leach) led to a resurgence in gold mining allowed to Australia to triple its cumulative production between 1975 to 2020, with as much gold still known in economic and sub-economic resources. Gold is the classic case study of the intersection of exploration, market prices and technology combining to facilitate a mining boom.
- Iron Ore—Australia is now the world’s largest miner of iron ore, with almost all exported. This is based almost entirely on the Pilbara region of northern Western Australia, where vast mineral deposits occur. The industrialisation of China led to a boom in iron ore prices and mine development in the 2000s, which coincides with exploration adding substantial quantities of economic and sub-economic resources. Iron ore is a case of strong markets driving exploration and mine development. Indeed, it is hard to believe that Australia banned iron ore exports in 1938 to protect its own industrial development given the vast scale of its iron ore sector in 2020.
- Lead-Zinc-Silver—Australia has a long history in lead-zinc-silver mining, whereby the Broken Hill field in western New South Wales gave rise to mining giant BHP Group Ltd. and was instrumental in a large part of Rio Tinto’s corporate history. All three metals show continuing increases over time in cumulative production, economic and sub-economic resources. This is influenced by major new discoveries (e.g., Century, Cannington, McArthur River) as well as brownfields expansion of operating mines (e.g., Broken Hill, Mount Isa, Rosebery). There have been no new major discoveries since Century and Cannington (both 1990), leaving current resources as driving the future of the sector for the foreseeable future. It should be noted that the giant McArthur River zinc project took four decades to develop due to the fine-grained nature of the mineralisation, meaning new grinding and process technology had to be invented first, highlighting the role of technology in facilitating new mining projects.
- Copper—although Australia has a long history of copper mining back to the 1840s, it is only since the 1950s and especially the 1990s that production has grown to be globally significant. This is mainly the result of exploration and the discovery and development of numerous major deposits (e.g., Mount Isa, Olympic Dam, Ernest Henry, Northparkes, Prominent Hill), as well as important contributions from gold-copper deposits (e.g., Cadia, Boddington, Telfer). It should be noted that Australia’s copper resources are dominated by Olympic Dam, which contains 77.7 out of 140.7 Mt Cu of national resources. Olympic Dam also contains gold, silver, uranium, rare earths, cobalt and tellurium, although to date only copper, gold, silver and uranium have been extracted (despite the high value of rare earths and growing need for cobalt and tellurium).
- Heavy Mineral Sands—the minerals rutile, ilmenite and zircon are all extracted from heavy mineral sands. Despite concerns in the 1970s about the lack of new discoveries, depletion of some fields (e.g., coastal New South Wales) and some major deposits being excluded from development for environmental protection (e.g., Fraser Island), a range of new deposits and provinces have since been discovered from the mid-1980s (e.g., Murray, Eucla and Gippsland Basins). These discoveries have facilitated continuing growth in cumulative production, economic and sub-economic resources, highlighting the crucial role of exploration.
- Critical and Other Metals and Minerals—despite substantial resources, Australia typically has not been a significant producer of most critical metals (e.g., gallium, tellurium, niobium) due to the lack of such process circuits at the few smelters and refineries across Australia (e.g., both zinc refineries have no process circuits for indium, gallium, germanium). Australia has produced tungsten, tantalum and antimony, with significant resources but these sectors often face difficult markets and economics (e.g., Chinese market power). The abundant resources (e.g., vanadium, molybdenum, rare earths) demonstrate that there is significant potential but the challenges remain market conditions as well as mine economics, technical issues (e.g., viable processing routes) and addressing environmental and social concerns (e.g., radioactive waste issues from the thorium and uranium involved in rare earth mining).
- Diamonds—diamonds are the only mineral which shows a classic depletion pattern. That is, the cumulative production rises and then plateaus with minimal resources remaining. This finding is simply due to the sheer dominance of the former Argyle diamond mine, which operated from 1983 to 2020 and produced 903.2 million carats (Australia’s cumulative production to 2020 was 911.4 million carats). There have been no significant diamond deposits discovered recently, meaning no new diamond mines, with the projects in care and maintenance unlikely to re-open due to poor economics (namely Merlin, Ellendale).
- Tungsten—the somewhat flat cumulative production curve might suggest depletion of Australia’s tungsten resources, although there are still significant economic and sub-economic resources (some 15 times cumulative production). Currently, the global tungsten market is almost monopolised by China (69 of 84 kt W in 2020; 2021 Edition, [24]), making it extremely difficult for other mines to compete, reinforcing the criticality of tungsten and the role of markets.
- Nickel—Australia is major global producer, showing continuing growth in cumulative production and economic and sub-economic resources. There have been important new discoveries of nickel deposits, such as Cosmos, Spotted Quoll, Nova-Bollinger and Julimar, highlighting that exploration is still able to discover additional nickel. The great challenge for Australia, however, is that 70.5% of its nickel is found in laterite-type deposits, which are more difficult to process [11]. There have been several nickel laterite projects developed in Australia, with the majority failing to achieve technical and financial success. The only operating project at present, Murrin Murrin, uses high pressure acid leach (HPAL) process technology, allowing the production of nickel metal directly as well as cobalt metal as a by-product.
- Cobalt—Australia produces cobalt exclusively as a co/by-product mostly from nickel mines and a minor amount from zinc refineries. The vast majority of currently reported cobalt resources are similarly found in nickel deposits, with significant amounts also found in some copper deposits. There are deposits where cobalt is also found but is not formally reported in resources (e.g., Olympic Dam). There are only two deposits where cobalt is the primary commodity (e.g., Thackaringa-Railway Hill, Mount Oxide cobalt-only lode). All of this means that although Australia is almost as well endowed with cobalt as the Democratic Republic of the Congo (the world’s largest producer; [11,48]), production remains subservient to a primary metal such as nickel or potentially copper.
Overall, Australia is an excellent case study in the confluence of exploration (finding new deposits), mine development in favourable markets (especially gold, iron ore, copper), as well as new technology making previously uneconomic deposits able to be developed (e.g., gold, McArthur River, Murrin Murrin). Based on reported economic and sub-economic resources, Australia still maintains a rich and commonly growing endowment of metals and minerals from aluminium to zirconium, although there are several which remain difficult to advance due to market issues or technical challenges. Australia is certainly far from resource depletion (with the exception of diamonds) but needs to navigate environmental and social issues, governance challenges and especially global markets.
5. Lithium Case Study
Lithium has become an important symbol of the changing metal and mineral needs of the modern world due to its importance in certain types of energy storage batteries. The lithium-ion battery can include cobalt, iron, phosphate, nickel, manganese or aluminium, depending on the design [49]. Until the invention and commercialisation of lithium-based batteries from the 1980s, lithium was mostly used in specialty glass and ceramics and a variety of minor uses (e.g., psychiatric-related pharmaceuticals, specialty lubricants, aluminium production) [50]. Since the 1990s there has been growing demand for lithium use in batteries, which has accelerated significantly in the 2010s due to the rapid growth in the electric vehicle sector. This demand growth has led to a major boom in lithium mining around the world, led in particular by Australia.
Lithium can be found broadly in two types of mineral deposits—brines or hard rock [50]. Brines are saline-rich waters which can be in salt lakes (or salars), oil fields and geothermal systems, often containing more than one element of potential economic interest (e.g., potassium). Hard rock deposits contain lithium in silicate minerals (e.g., spodumene, amblygonite, jadarite, petalite) or clays (e.g., hectorite). The mining and extraction processes are very different, leading to either a concentrate (such as spodumene at ~3% lithium) or a chemical grade product (e.g., lithium carbonate at ~19% lithium, lithium chloride at ~%16 lithium).
There were concerns emerging in the late 2000s that global lithium resources were insufficient to meet demand if electric replaced combustion vehicles, although as shown by Mohr et al. [50], there was clearly an abundance of potential lithium—the critical issues were what was economically recoverable and comparing the relative social and environmental impacts of brines versus hard rock mines. The rise of electric vehicles, however, began in earnest in the mid-2010s, again leading to concerns about global lithium resources and supplies.
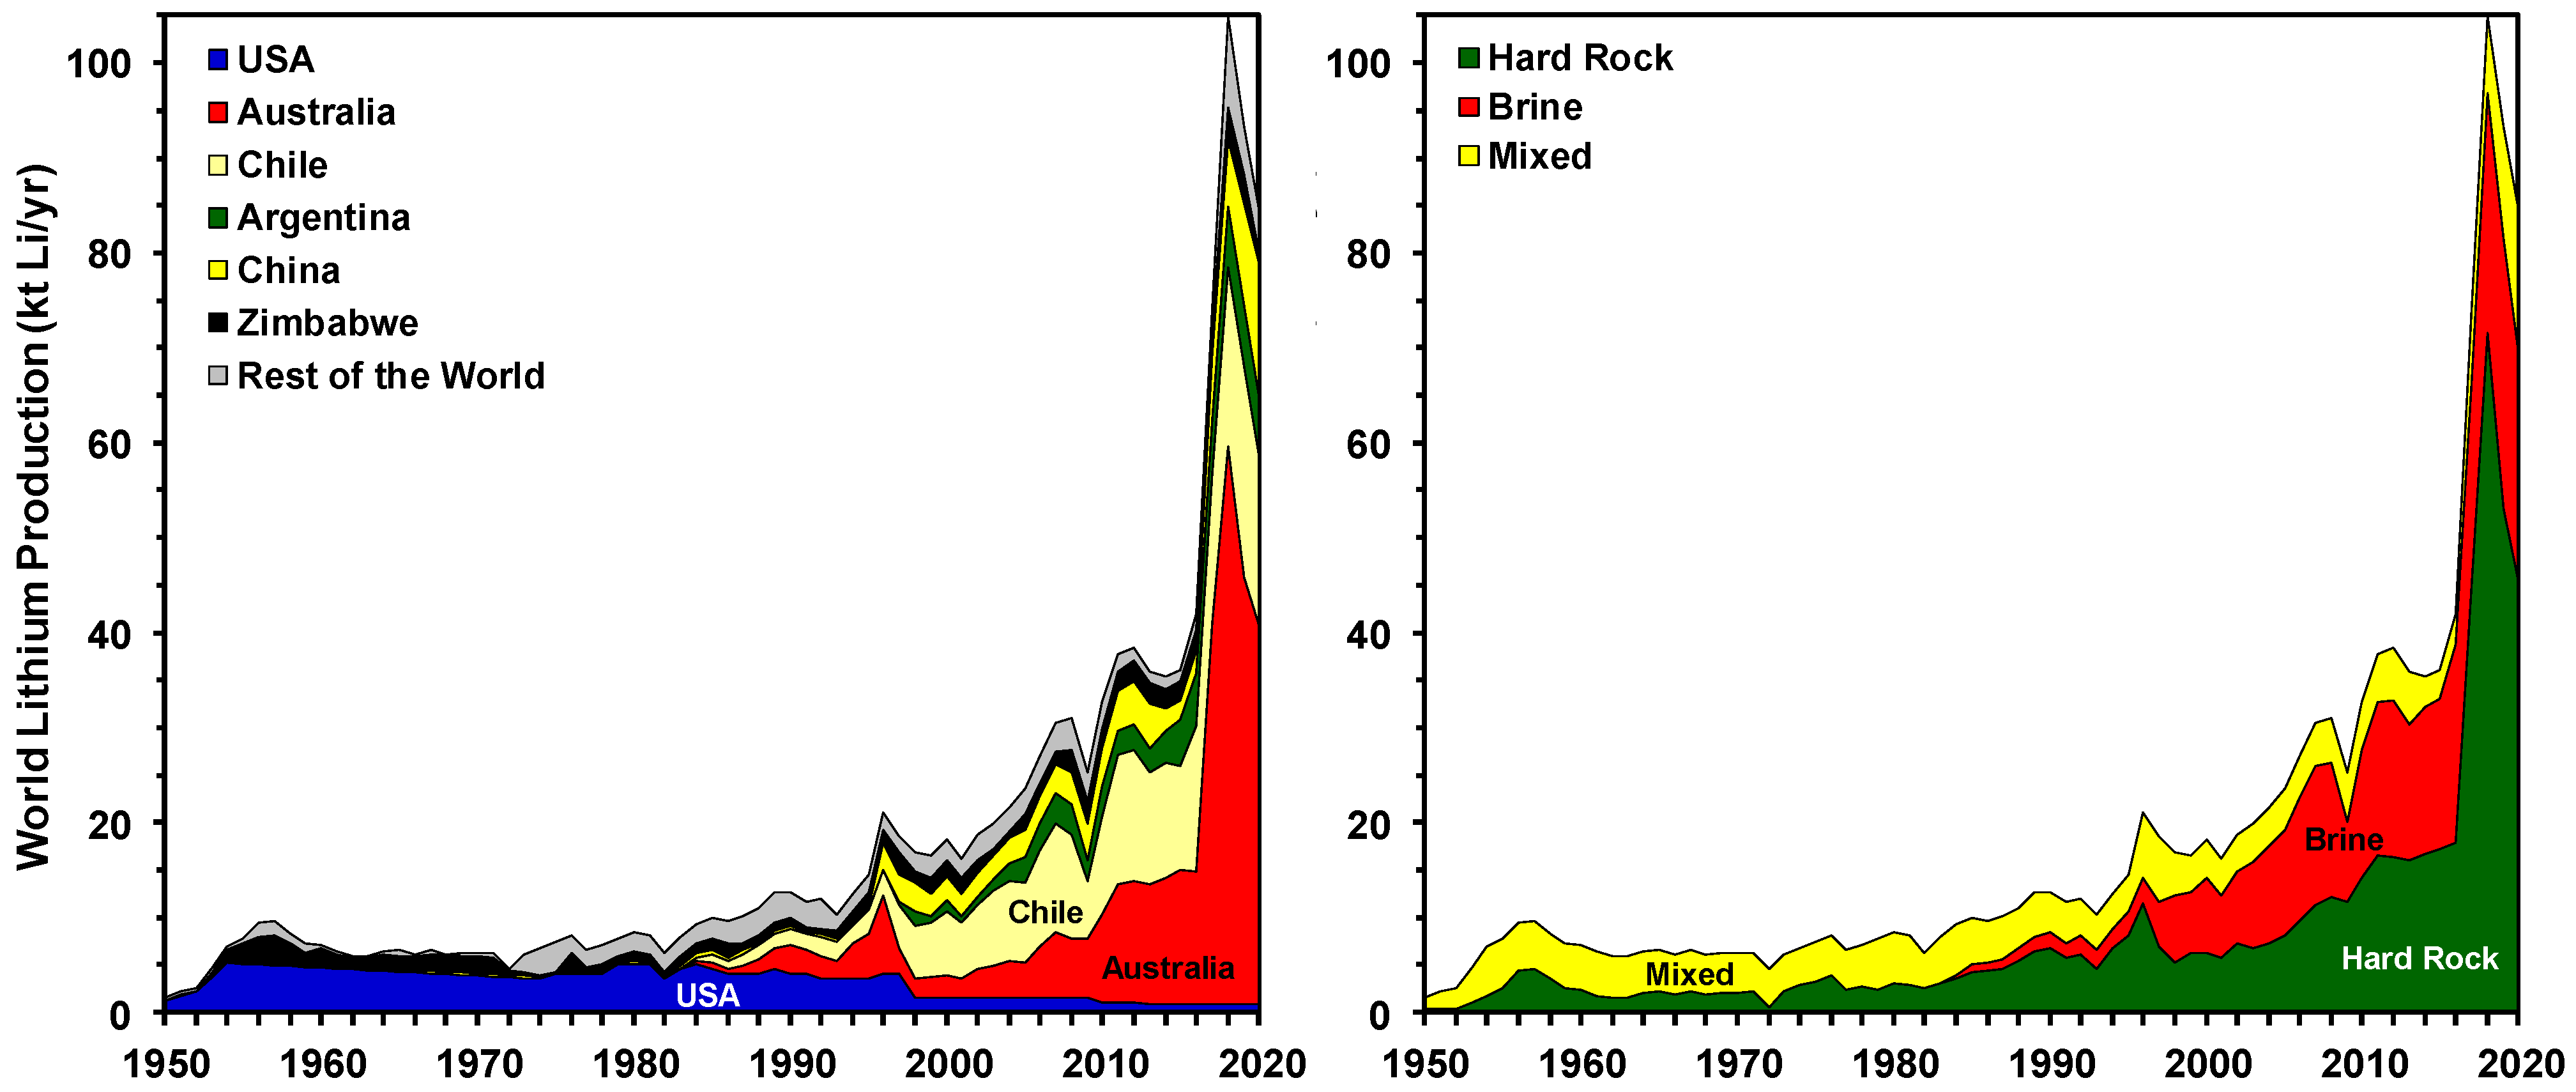
Global lithium production data are compiled and shown in Figure 8 by country and source (brine, hard rock and mixed/unreported), synthesized from [21,22,23,51], and USGS [24,52] by converting all data sources to tonnes lithium (production prior to 1950 was negligible and not shown). Production began to grow from the early 1980s, accelerating in the mid-1990s until the 2008 global financial crisis led to a short-term decline. Following the inexorable rise in electric vehicles, lithium production began to surge from 2017, led dominantly by Australian spodumene-derived production. This outcome was arguably unexpected, as the larger resources are brines (especially the lithium triangle of central South America), suggesting that hard rock (especially spodumene) deposits are quicker and easier to find, develop and finance relative to the complexity of brine projects.
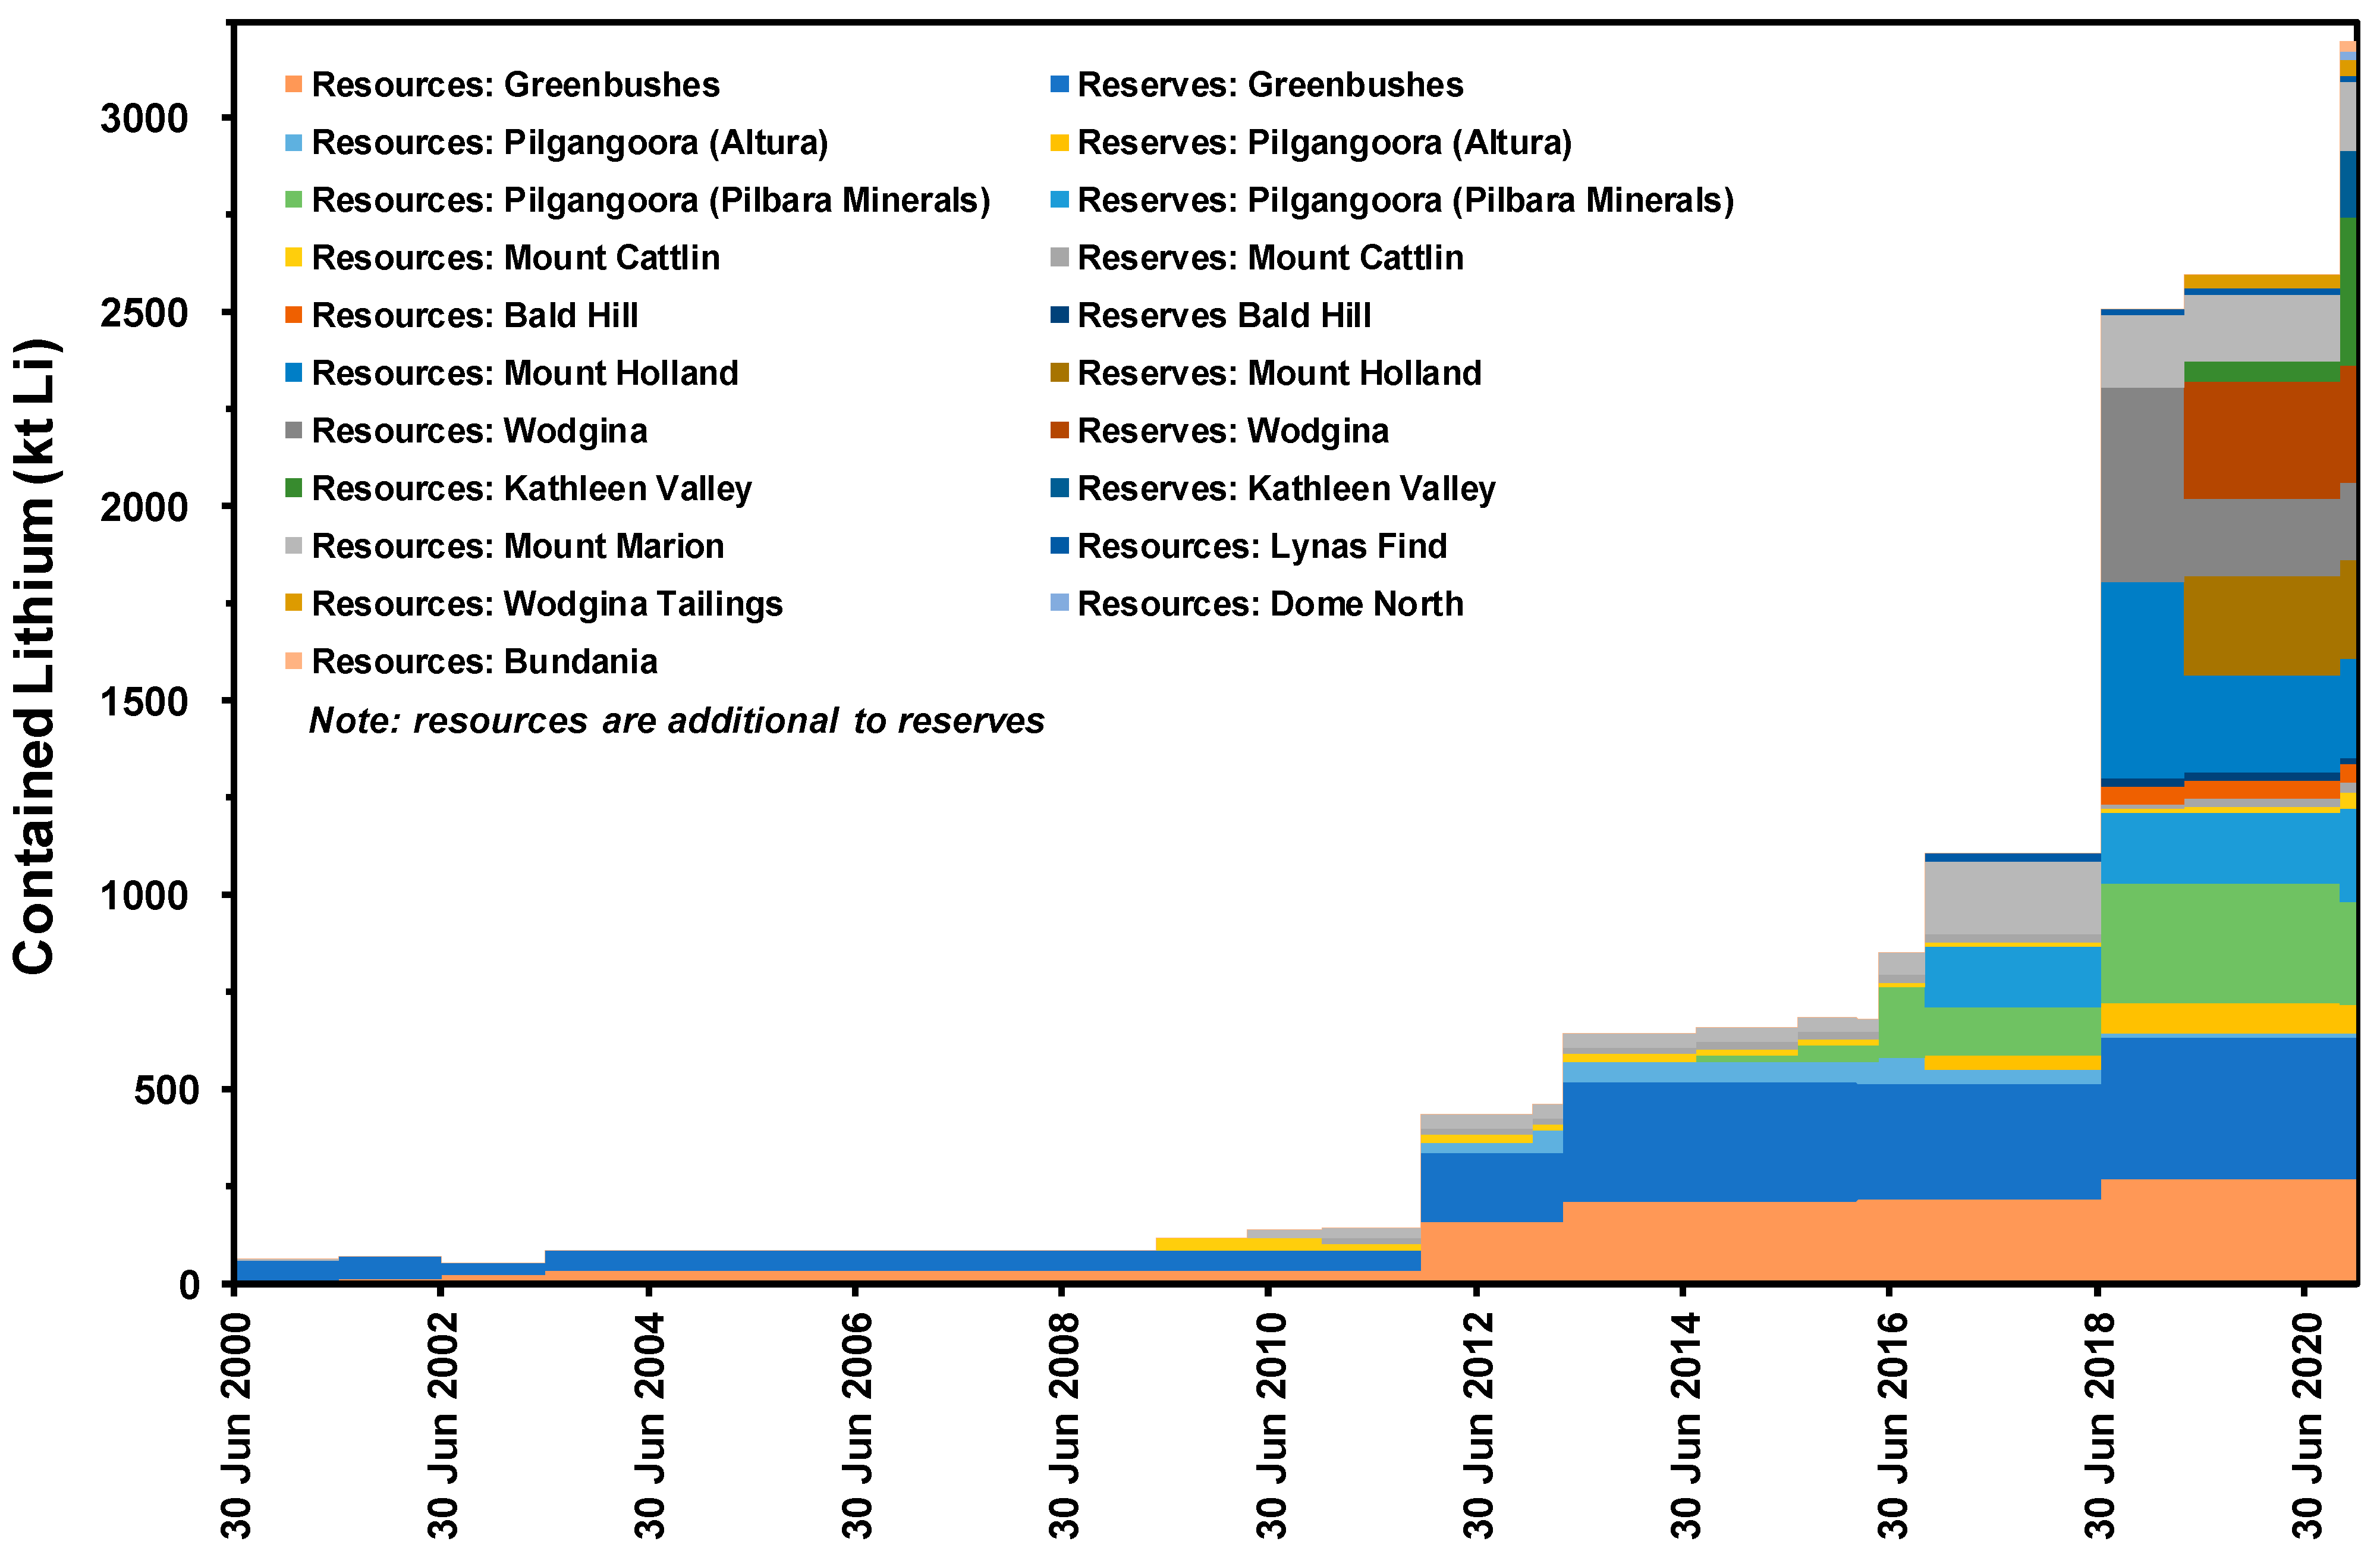
Given that Western Australia is home to almost all of Australia’s lithium deposits, a detailed analysis of reported reserves and additional resources by individual deposit over time is shown in Figure 9 (all data from regular extracts from the MINEDEX database system; [53]). Until ~2010, the lithium sector was represented only by Greenbushes, with numerous deposits now discovered and developed since this time (e.g., Mount Cattlin, Mount Marion, Bald Hill, Mount Dove, two mines at Pilgangoora and the re-purposing of the closed Wodgina tantalum operation into a lithium producer). Over time, the substantial increase in reserves and additional resources clearly correlates with increased Australian production, where lithium now exceeds the export value of uranium by 3–4 times (data from [34]). Another interesting aspect of these results is that the old tantalum tailings at Wodgina are now reported as a lithium resource. Based on the geology of Western Australia, it is highly likely that success will continue in finding new lithium deposits and expanding known ones, demonstrating the role that exploration plays in resource endowments.
Overall, it is clear from the assessment of global lithium production, and Western Australia in particular, that there is no clear evidence of resource depletion looming. Indeed, the strong success in discovering new deposits and mine development shows that rapid responses can occur in the mining industry when market conditions support such speed (e.g., as the case has been for lithium demands for electric vehicle, energy storage and consumer batteries).
6. Discussion
The key focus of this paper is the key trends in reserves and mining of numerous metals and minerals, especially with respect to emerging evidence of or trends towards resource depletion. The framework used by Hewett, Hubbert and others starts with the proposition that metal and mineral resources are inherently finite on our planet, meaning that mining is intrinsically unsustainable. As the evidence synthesized in this paper shows, global, Australian and lithium trends do not show any clear long-term evidence of resource depletion (noting the recent gradual declines in years left for several commodities, albeit within historic variations). Instead, the evidence suggests that we have maintained sufficient mineable reserves for decades with the years left often ranging from a decade (e.g., antimony) to millennia (e.g., rare earths; Figure 4). The reasons for this can vary but are widely considered to include a complex mix of growing demand and markets, economic conditions, new mining and process technology as well as discovery of new deposits (e.g., [31,40,46,54,55]). Over time, this combination of factors leads to growing endowments, sometimes substantially so (e.g., Australia and iron ore, lithium, nickel). The ultimate question is therefore how long can these factors continue to combine to grow endowment before other factors limit such growth? In other words, what factors could begin to affect and slow down primary mining supply of metals and minerals? The ability to explore and assess these questions is beyond the scope of this paper, although the following areas are already influential to critical:
- Mine Waste—modern mining is facing declining ore grades and increasing tailings and waste rock, especially on a per metal/mineral basis combined with ever larger project scales [46,56]. (This is placing a continuously increasing burden of managing such mine wastes on companies, governments and local communities. Mine waste management needs to address physical stability to avoid catastrophic failures (such as tailings dam failures), erosion, land use impacts, acid and metalliferous drainage (aka acid mine drainage or ‘AMD’), water resource impacts (including surface water-groundwater interactions), water quality risks and greater rehabilitation efforts let alone social impacts and long-term economic liabilities [56].
- Mine Rehabilitation—after a mine closes there are normally requirements (let alone community expectations and industry promises) for some form of site rehabilitation, with the extent varying according to jurisdictional requirements. The primary points of focus are on making a former mine suitable for future land use (such as agriculture, tourism, conservation, heritage, etc) and ensuring ecological, physical, chemical and sometimes radiological stability and minimising or preventing any residual economic liability. Although some mines may practice progressive rehabilitation during operations, most of the major works are left for closure. There are rarely long-term follow-up studies on the success (or otherwise) of mine rehabilitation, whereby monitoring was maintained for at least a decade and key success criteria have been met (e.g., ecological condition, acid and metalliferous drainage, erosion, biodiversity, etc). There are examples from around the world where mine rehabilitation has not been successful, ranging from modest to extreme failure. In Australia, significant failures include Rum Jungle, Brukunga and Mary Kathleen, with modest failures at Nabarlek, Kidston, Tabletop and many others. Unfortunately, it is rare that environmental monitoring is continued for more than a few years, meaning that the ability to properly assess the success or failure of mine rehabilitation is extremely limited. This raises questions of credibility on industry and government claims about successful rehabilitation, a concern often deeply echoed by communities facing existing, expanding or new mining projects.
- Energy-Climate Change Nexus—it takes a considerable amount of energy to mine various metals and minerals, increasing on a per metal/mineral basis as ore grades decline (e.g., [57,58,59]). Given that ore grades are in gradual decline globally (with few exceptions), this means that the supply of metals and minerals will need ever more energy. In some parts of the world there are large investments to build renewable energy systems to supply the electricity required (which is typically used in the process plant and underground mining), such as large scale solar photovoltaic farms in Chile or combined wind-solar-battery systems at the Agnew gold mine in Western Australia. There are also innovative new developments emerging to fully electrify mining machinery (e.g., Borden gold mine, Ontario, Canada), thereby removing diesel from mining. Combined, it is critical to understand the amount of energy required in mining but also its carbon cost (e.g., [60])—a nexus which will increasingly be applied to future mining from both a climate, environmental, cost and investment perspective.
- Circular Economy and Recycling—in general, it is less energy-intensive to recycle metals (and sometimes minerals) than primary mining [61], although it is often more expensive (depending on logistics and regulatory settings). In addition, the recycling of metals can provide a reliable or predictable supply, helping to reduce reliance on primary supplies. At present, the extent of recycling for numerous metals remains poor to modest (e.g., copper, aluminium, iron, zinc), with only lead arguably approaching a ‘circular economy’ [62,63]. It is also important to recognise that some uses of metals or minerals have long residence times whilst others have very short in-use lives. For example, iron used in steel in multi-story buildings will be in-use for several decades compared to steel used in vehicles which might last between 10 to 20 years before they are recycled, leading to differing availabilities for recycling [63]. Furthermore, it may take some time to build-up stocks of metals in urban systems before sufficient metals could be supplied from recycling—an issue which is certainly a problem for many of the critical metals (e.g., rare earths, indium, lithium). There are an increasing array of policy initiatives around the world to promote a circular economy (e.g., European Union, China, Japan), meaning that it can be expected that a greater share of metals will be supplied from recycling over time (although the details will vary enormously depending on the metal and geographic focus). It should be noted that most minerals are not readily recyclable (based on current uses and recycling technology), such as rutile, manganese concentrate, zircon or phosphate rock, another challenge which remains poorly recognised and assessed in the industrial ecology community.
- Critical Metals and Smelters-Refineries—many of the metals repeatedly assessed as critical are only extracted as small value by-products at smelters and refineries, such as cadmium, tellurium, indium, gallium, germanium, bismuth and rhenium. This is principally due to the fact that they are almost exclusively substitute elements in primary economic minerals (e.g., indium in sphalerite), meaning that where such concentrates are processed to produce the primary metals, there can be sufficient concentrations to warrant extraction of these substitute elements. The implication of this is that to meet rapidly growing demands for these specific metals means continued mining of the primary metals, although complex models and scenarios of these future supply–demand scenarios remain a major gap in the literature. In theory, many of the applications where such metals are used could be recycled (e.g., solar photovoltaic panels), but these technologies are still being adopted, leaving little stocks available for recycling supplies. Australian smelters and refineries are not equipped with the circuits to extract such metals, forcing imports of high value manufactured products instead of primary supply. Globally the issue of downstream processing at smelters and refineries remains a very challenging area in metals supply chains.
- Social and Governance Issues—modern mining is increasingly expected to be able to demonstrate its commitment to improved social outcomes, especially in developing countries. The SDGs are also helping to drive focus on social impacts and benefits, although mining companies can find themselves in the awkward position of providing for development due to the lack of capacity (or failure) of governments to deliver such outcomes. Furthermore, mining in regions of poor governance can increase the risks of severe social impacts, epitomised by ‘conflict minerals’ in central Africa where mining can fund guerrilla warlords, armies and insurrection. There are regions with long histories of mining where significant fractions of these communities are increasingly hostile to existing and/or new mining projects (e.g., Hunter Valley, Australia), as well as regions where communities with no history of mining remain staunchly opposed to mining developments—often driven by understanding of the social and environmental impacts of mining elsewhere (e.g., Ecuador). The concept of ‘social licence to operate’, or perhaps better termed ‘social acceptance to operate’, has evolved in the past decade to explore the ways that communities interact with mines and mining companies [64], though it remains difficult to apply across the vast array of mines around the world. Finally, it must be recognised that failure to recognise and address social issues, especially those linked to governance and approvals processes, can lead to lengthy and costly projects delays, epitomised by failed projects such as Pascua Lama (Argentina/Chile), Pebble (Alaska, USA), New Prosperity and Kemess North (British Columbia, Canada), Conga (Peru) and Reko Diq (Balochistan, Pakistan), amongst many others [40,65].
In reality, the ability of primary mining to continue to supply the metals and minerals demanded by the modern world is continually evolving. As reviewed briefly herein, there are many complex factors and issues which either already materially affect mines and the mining sector, or those that will continue to assert greater effect in the future. It is very difficult to integrate all of these into a ‘model’ or even scenario for future supply, let alone predict which future mining projects may face substantial social, environmental or governance issues. Indeed, there are no academic studies which have ever achieved this—a level of complexity which goes far beyond the simplified theoretical basis used in the Limits to Growth studies. These findings reinforce the view that the ‘ultimately recoverable resource’ for all metals and minerals remains elusive precisely because it is a very dynamic quantity subject to an enormous array of complex factors—no approach has yet been able to integrate them all. It all points to mining becoming more complex and challenging, perhaps even placing pressure on the costs of mining to fund stronger social and environmental operating standards.
7. Summary and Conclusions
This paper has explored the evidence on metal and mineral resources and synthesized an extensive array of data at the global scale and a detailed case study of Australia as a mining-dependent nation and lithium as a new global mining sector. Whilst the concept of ‘finite’ metal and mineral resources has always been appealing, as epitomised by Hubbert’s peak curve, it remains difficult to demonstrate in practice due to growing economies of scale, new mining and ore processing technologies, favourable geology, successful mineral exploration finding new deposits and an ability to permit and develop new mines. In theory, metals should also be able to be recycled, further reinforcing the long-term availability of metals, but many minerals on the other hand are rarely used in ways which can be readily recycled. As shown by the substantial body of data in this paper for cumulative production, reserves and resources, we are yet to approach any tangible limits to the supply of metals and minerals but there are an increasing array of complexities facing their supply. The ultimate question remains the extent to which the patterns of past and present mining success can continue into the future, especially given the increasingly complex social, environmental and governance landscape which modern mining has to navigate its way through. At present, the glass remains at 50%, although it remains to be seen whether Hewett and Hubbert may yet be proven right in decades to come or success towards a circular economy changes the conceptualisation of resources.
Funding
This research received no external funding.
Institutional Review Board Statement
Not Applicable.
Informed Consent Statement
Not Applicable.
Data Availability Statement
All data is available from the references cited or the author can help if required.
Acknowledgments
The research work presented herein is synthesized from data sets developed over many years. Although there was no direct funding for this paper, I acknowledge past sources of relevant funding support from CSIRO and Geoscience Australia. I wish to thank Nedal Nassar (USGS) for providing access to the historic Mineral Commodity Summaries reports, as well as my colleagues Simon Jowitt (UNLV), Daniel Franks (UQ) and Damien Giurco (UTS) who have helped to frame the ideas which underpin this paper.
Conflicts of Interest
The authors declare no conflict of interest.
References
- Chin, A.; Fu, R.; Harbor, J.; Taylor, M.P.; Vanacker, V. Anthropocene: Human interactions with earth systems. Anthropocene 2013, 1, 1–2. [Google Scholar] [CrossRef]
- Conceição, P. Human Development Report 2020—The Next Frontier: Human Development and the Anthropocene; United Nations Development Programme (UNDP): New York, NY, USA, 2020. [Google Scholar]
- UNE. Global Environment Outlook–GEO-6: Healthy Planet, Healthy People; United Nations Environment (UNE): Nairobi, Kenya, 2019; 745p. [Google Scholar]
- Gordon, R.B.; Bertram, M.; Graedel, T.E. Metal Stocks and Sustainability. Proc. Natl. Acad. Sci. USA 2006, 103, 1209–1214. [Google Scholar] [CrossRef] [Green Version]
- Northey, S.A.; Mudd, G.M.; Werner, T.T. Unresolved Complexity in Assessments of Mineral Resource Depletion and Avail-ability. Nat. Resour. Res. 2018, 27, 241–255. [Google Scholar] [CrossRef]
- Hewett, D.F. Cycles in Metal Production. Am. Inst. Min. Metall. Eng. Trans. 1929, 85, 65–93. [Google Scholar]
- Hubbert, M.K. Nuclear Energy and the Fossil Fuels. Drill. Prod. Pract. 1956, 95, 1–57. [Google Scholar]
- Inman, M. The Oracle of Oil: A Maverick Geologist’s Quest for a Sustainable Future; W.W. Norton & Company: New York, NY, USA; London, UK, 2016; 428p. [Google Scholar]
- Mudd, G.M.; Jowitt, S.M.; Werner, T.T. The World’s By-Product and Critical Metal Resources Part I: Uncertainties, Current Reporting Practices, Implications and Grounds for Optimism. Ore Geol. Rev. 2017, 86, 924–938. [Google Scholar] [CrossRef]
- Mudd, G.M.; Jowitt, S.M. Growing Global Copper Resources, Reserves and Production: Discovery is not the Only Control on Supply. Econ. Geol. 2018, 113, 1235–1267. [Google Scholar] [CrossRef]
- Mudd, G.M.; Jowitt, S.M. The New Century for Nickel Resources, Reserves and Mining: Reassessing the Sustainability of the Devil’s Metal. Econ. Geol. 2021. [Google Scholar]
- Mudd, G.M.; Jowitt, S.M.; Werner, T.T. The World’s Lead-Zinc Mineral Resources: Scarcity, Data, Issues and Opportunities. Ore Geol. Rev. 2017, 80, 1160–1190. [Google Scholar] [CrossRef]
- Mudd, G.M.; Roche, C.; Northey, S.; Jowitt, S.M.; Gamato, G. Mining in Papua New Guinea: A complex story of trends, impacts and governance. Sci. Total. Environ. 2020, 741, 140375. [Google Scholar] [CrossRef] [PubMed]
- Werner, T.T.; Mudd, G.; Jowitt, S.M. The world’s by-product and critical metal resources part II: A method for quantifying the resources of rarely reported metals. Ore Geol. Rev. 2017, 80, 658–675. [Google Scholar] [CrossRef]
- Werner, T.T.; Mudd, G.M.; Jowitt, S.M. The World’s By-Product and Critical Metal Resources Part III: Indium. Ore Geol. Rev. 2017, 86, 939–956. [Google Scholar] [CrossRef]
- Graedel, T.E.; Harper, E.M.; Nassar, N.T.; Reck, B.K. On the Materials Basis of Modern Society. Proc. Natl. Acad. Sci. USA 2015, 112, 6295–6300. [Google Scholar] [CrossRef] [PubMed] [Green Version]
- Greenfield, A.; Graedel, T. The omnivorous diet of modern technology. Resour. Conserv. Recycl. 2013, 74, 1–7. [Google Scholar] [CrossRef]
- Drexhage, J.; La Porta, D.; Hund, K.; McCormick, M.; Ningthoujam, J. The Growing Role of Minerals and Metals for a Low Carbon Future; World Bank: Washington, DC, USA, 2017; 112p. [Google Scholar]
- IEA. World Energy Outlook 2018; International Energy Agency (IEA): Paris, France, 2018; 661p. [Google Scholar]
- Goodenough, K.M.; Wall, F.; Merriman, D. The Rare Earth Elements: Demand, Global Resources, and Challenges for Resourcing Future Generations. Nat. Resour. Res. 2018, 27, 201–216. [Google Scholar] [CrossRef] [Green Version]
- BGS. World Mineral Production; including predecessor reports; British Geological Survey (BGS): Nottingham, UK, 1922–2019. [Google Scholar]
- USBoM. Commodity Data Summaries; US Bureau of Mines (USBoM): Washington, DC, USA, 1957–1977.
- USBoM. Mineral Commodity Summaries; US Bureau of Mines (USBoM): Washington, DC, USA, 1978–1995.
- USGS. Mineral Commodity Summaries; US Geological Survey (USGS): Reston, VA, USA, 2021.
- ABS. Mineral Account, Australia, 1996; Australian Bureau of Statistics (ABS): Canberra, ACT, Australia, 1998; 115p, ABS 4608.
- BMR. Annual Mineral Industry Review; Commonwealth Bureau of Mineral Resources, Geology and Geophysics (BMR): Canberra, ACT, Australia, 1948–1987.
- GA. Australia’s Identified Mineral Resources; Geoscience Australia (GA): Canberra, ACT, Australia, 1992–2020.
- Kalix, Z.; Fraser, L.M.; Rawson, R.I. Australian Mineral Industry: Production and Trade, 1842–1964; Bulletin 81; Commonwealth Bureau of Mineral Resources, Geology and Geophysics (BMR): Canberra, ACT, Australia, 1966; 482p.
- Mudd, G.M. The Sustainability of Mining in Australia: Key Production Trends and Their Environmental Implications for the Future; Monash University and Mineral Policy Institute: Melbourne, Australia, 2007; p. 277. [Google Scholar]
- Mudd, G.M.; Jowitt, S.M. Key Trends in Australian Mineral Resources and Production. In Australian Ore Deposits; Phillips, G.N., Ed.; Monograph 32; Australasian Institute of Mining & Metallurgy (AusIMM): Parkville, VIC, Australia, 2018; pp. 7–12. [Google Scholar]
- Meinert, L.D.; Robinson, G.R.; Nassar, N.T. Mineral Resources: Reserves, Peak Production and the Future. Resources 2016, 5, 14. [Google Scholar] [CrossRef]
- USGS. var.-a, Mineral Commodity Summaries; US Geological Survey (USGS): Reston, VA, USA, 2021.
- EIA. International Energy Statistics-Coal and Coke Production; Energy Information Administration (EIA): Washington, DC, USA, 2021. Available online: https://www.eia.gov/international/data/world#/? (accessed on 27 June 2021).
- OCE. Resources and Energy Quarterly-March 2021; Office of the Chief Economist (OCE), Department of Industry, Innovation & Science, Australian Government: Canberra, ACT, Australia, 2021; 171p. Available online: publica-tions.industry.gov.au/publications/resourcesandenergyquarterlymarch2019/index.html (accessed on 19 July 2021).
- JM. PGM Market Report May 2021; Johnson Matthey plc (JM): Hertfordshire, UK, 2021; 60p. [Google Scholar]
- WADMIRS. Western Australia Mineral and Petroleum Statistics Digest; WA Department of Mines, Industry Regulation and Safety (WADMIRS; formerly Department of Mines): Perth, WA, Australia, 1984–2019.
- ISE. Rare Earth Prices in December 2020; Institut für Seltene Erden und Strategische Metalle (ISE) (Institute for Rare Earths and Metals AG): Zug, Switzerland, 2021; Available online: https://en.institut-seltene-erden.de/rare-earth-prices-in-december-2020/ (accessed on 27 June 2021).
- Weng, Z.; Jowitt, S.M.; Mudd, G.; Haque, N. A Detailed Assessment of Global Rare Earth Element Resources: Opportunities and Challenges. Econ. Geol. 2015, 110, 1925–1952. [Google Scholar] [CrossRef]
- MGB. Mineral Production 2019–2020; Mines and Geosciences Bureau (MGB): Manila, Philippines, 2021; p. 4. Available online: https://mgb.gov.ph/2015-05-13-01-44-56/2015-05-13-01-47-51 (accessed on 27 June 2021).
- Jowitt, S.M.; Mudd, G.M.; Thompson, J.F.H. Future availability of non-renewable metal resources and the influence of environmental, social, and governance conflicts on metal production. Commun. Earth Environ. 2020, 1, 13. [Google Scholar] [CrossRef]
- Meadows, D.H.; Meadows, D.L.; Randers, J. The Limits to Growth: The 30-Year Update; Chelsea Green: White River Junction, VT, USA, 2004; 338p. [Google Scholar]
- Meadows, D.H.; Meadows, D.L.; Randers, J.; Behrens, W.W. The Limits to Growth: A Report for the Club of Rome’s Project on the Predicament of Mankind; Potomac-Earth Island: London, UK, 1972. [Google Scholar]
- Bradley, J. The Future of Nickel in a Transitioning World: Exploratory System Dynamics Modelling and Analysis of the Global Nickel Supply Chain and Its Nexus with the Energy System; M Sc (Industrial Ecology), Leiden University: Leiden, The Netherlands; TU Delft: Delft, The Netherlands, 2021; 231p. [Google Scholar]
- Van Vuuren, D.; Strengers, B.; De Vries, H. Long-term perspectives on world metal use—A system-dynamics model. Resour. Policy 1999, 25, 239–255. [Google Scholar] [CrossRef]
- Mudd, G. The limits to growth and ’finite’ mineral resources: Revisiting the assumptions and drinking from that half-capacity glass. Int. J. Sustain. Dev. 2013, 16, 204–220. [Google Scholar] [CrossRef] [Green Version]
- Mudd, G.M. The Environmental sustainability of mining in Australia: Key megatrends and looming constraints. Resour. Policy 2010, 35, 98–115. [Google Scholar] [CrossRef]
- Raggatt, H.G. Mountains of Ore: Mining and Minerals in Australia; Lansdowne Press: Melbourne, VIC, Australia, 1968; 416p. [Google Scholar]
- Mudd, G.; Weng, Z.; Jowitt, S.; Turnbull, I.; Graedel, T. Quantifying the recoverable resources of by-product metals: The case of cobalt. Ore Geol. Rev. 2013, 55, 87–98. [Google Scholar] [CrossRef]
- Vetter, M.; Lux, S.; Wüllner, J. The Use of Batteries in Storing Electricity. In Future Energy: Improved, Sustainable and Clean Options for Our Planet; Letcher, T.M., Ed.; Academic Press (Elsevier): London, UK, 2020; pp. 247–261. [Google Scholar]
- Mohr, S.H.; Mudd, G.; Giurco, D. Lithium Resources and Production: Critical Assessment and Global Projections. Minerals 2012, 2, 65–84. [Google Scholar] [CrossRef]
- USBoM. Minerals Yearbook; US Bureau of Mines (USBoM): Washington, DC, USA, 1932–1993.
- USGS. Minerals Yearbook; US Geological Survey (USGS): Reston, VA, USA, 1994–2016.
- WADMIRS. MINEDEX-Online Mining Database for Western Australia; WA Department of Mines, Industry Safety and Regulation (WADMIRS): Perth, WA, Australia, 2020. Available online: minedexext.dmp.wa.gov.au/ (accessed on 2 November 2020).
- Cook, E. Limits to Exploitation of Nonrenewable Resources. Science 1976, 191, 677–682. [Google Scholar]
- Skinner, B.J. A Second Iron Age Ahead? Am. Sci. 1976, 64, 258–269. [Google Scholar]
- Mudd, G.M. Sustainable/Responsible Mining and Ethical Issues related to the Sustainable Development Goals (SDGs). In Ge-oethics: Status and Future Perspectives; di Capua, G., Bobrowsky, P.T., Kieffer, S.W., Palinkas, C., Eds.; Special Publications 508; Geological Society of London: London, UK, 2020; 13p. [Google Scholar]
- Norgate, T.E.; Jahanshahi, S. Low Grade Ores–Smelt, Leach or Concentrate? Miner. Eng. 2010, 23, 65–73. [Google Scholar] [CrossRef]
- Norgate, T.; Jahanshahi, S.; Rankin, W. Assessing the environmental impact of metal production processes. J. Clean. Prod. 2007, 15, 838–848. [Google Scholar] [CrossRef]
- Nuss, P.; Eckelman, M.J. Life Cycle Assessment of Metals: A Scientific Synthesis. PLoS ONE 2014, 9, e101298. [Google Scholar] [CrossRef] [PubMed]
- Van der Voet, E.; Kleijn, R.; Mudd, G.M. The Energy-Materials Nexus-The Case of Metals. In Routledge Handbook of the Resource Nexus; Bleischwitz, R., Hoff, H., Spataru, C., van der Voet, E., van Deveer, S.D., Eds.; Routledge: Oxford, UK, 2018; pp. 368–379. [Google Scholar]
- Rankin, W.J. Minerals, Metals and Sustainability-Meeting Future Material Needs; CSIRO Publishing and CRC Press: Melbourne, VIC, Australia, 2011; 439p. [Google Scholar]
- Graedel, T.E. Grand Challenges in Metal Life Cycles. Nat. Resour. Res. 2018, 27, 181–190. [Google Scholar] [CrossRef]
- IRP (Ed.) Metal Recycling: Opportunities, Limits, Infrastructure—A Report of the Working Group on the Global Metal Flows to the International Resource Panel, International Resource Panel (IRP); United Nations Environment Programme (UNEP): Paris, France, 2013; 320p. [Google Scholar]
- Moffat, K.; Zhang, A. The Paths to Social Licence to Operate: An Integrative Model Explaining Community Acceptance of Mining. Resour. Policy 2014, 39, 61–70. [Google Scholar] [CrossRef] [Green Version]
- Franks, D.M.; Davis, R.; Bebbington, A.J.; Ali, S.; Kemp, D.; Scurrah, M. Conflict translates environmental and social risk into business costs. Proc. Natl. Acad. Sci. USA 2014, 111, 7576–7581. [Google Scholar] [CrossRef] [PubMed] [Green Version]
Figure 1.
Hewett’s cycles in metal production (redrawn from Hewett, [6]).
Figure 1.
Hewett’s cycles in metal production (redrawn from Hewett, [6]).

Figure 2.
Hubbert peak curve for US crude oil production to ~1955, proven reserves to support future production and the potential transition to nuclear power (units excluded to keep figure conceptual; adapted from [7]).
Figure 2.
Hubbert peak curve for US crude oil production to ~1955, proven reserves to support future production and the potential transition to nuclear power (units excluded to keep figure conceptual; adapted from [7]).

Figure 3.
Representation of Hubbert’s conceptual peak and cumulative production curves.

Figure 4.
World production (top row), reserves (middle row) and years left (bottom row) of numerous metal and mineral commodities since 1955, grouped as common commodities (left column), critical minerals (centre column) and refinery by-products (right column) (note: graphs are for relative visual comparison only).

Figure 5.
Hubbert-style curves of cumulative production (red shading) and reserves (yellow shading) for numerous elements inserted within the Periodic Table of the Elements.
Figure 5.
Hubbert-style curves of cumulative production (red shading) and reserves (yellow shading) for numerous elements inserted within the Periodic Table of the Elements.

Figure 6.
Cumulative production, economic and additional sub-economic resources over time for primary metals and minerals in Australia (data updated from [30]).
Figure 6.
Cumulative production, economic and additional sub-economic resources over time for primary metals and minerals in Australia (data updated from [30]).

Figure 7.
(continued): Cumulative production, economic and additional sub-economic resources over time for critical and other metals and minerals in Australia (data updated from [30]).
Figure 7.
(continued): Cumulative production, economic and additional sub-economic resources over time for critical and other metals and minerals in Australia (data updated from [30]).

Figure 8.
World lithium production by country (left) and primary resource type (right) (Note: 2020 data is preliminary).
Figure 8.
World lithium production by country (left) and primary resource type (right) (Note: 2020 data is preliminary).

Figure 9.
Reported lithium reserves and additional resources by individual deposit for Western Australia (data synthesized from [53]).
Figure 9.
Reported lithium reserves and additional resources by individual deposit for Western Australia (data synthesized from [53]).


Table 1.
World mine production, leading producer, Australian mine production, prices and world and Australian sector value (2020 data, sorted by world value; references below).
Table 1.
World mine production, leading producer, Australian mine production, prices and world and Australian sector value (2020 data, sorted by world value; references below).
| No. | Element | Symbol | Units | World A | Leader A | Australia A | Price (USD/t) A | Sector Value (USDmill) | |
|---|---|---|---|---|---|---|---|---|---|
| World | Australia | ||||||||
| 1 | Coal | coal | Mt coal | 8834 B | 4280 China B | 418.3 C | 68.2 C | 602,778.4 | 57,959.5 |
| 2 | Iron Ore | Fe | Mt Fe ore | 2400 | 900 Australia | 900 | 108 | 259,200.0 | 97,200.0 |
| 3 | Gold | Au | t Au | 3200 | 380 China | 320 | 56,913,183 | 182,122.2 | 18,212.2 |
| 4 | Copper | Cu | Mt Cu | 20 | 5.7 Chile | 0.87 | 5952 | 119,048.4 | 5178.6 |
| 5 | Alumina | Al2O3 | Mt alumina | 136 | 74 China | 21 | 370 | 50,320.0 | 7770.0 |
| 6 | Potash | K2O | Mt K2O | 43 | 14 Canada | - | 830 | 35,690.0 | - |
| 7 | Nickel | Ni | Mt Ni | 2.5 | 0.76 Indonesia | 0.17 | 14,000 | 35,000.0 | 2380.0 |
| 8 | Zinc | Zn | Mt Zn | 12 | 4.2 China | 1.4 | 2403 | 28,836.2 | 3364.2 |
| 9 | Manganese | Mn | Mt Mn ore | 18.5 | 5.2 South Africa | 3.3 | 1073 | 19,845.5 | 3540.0 |
| 10 | Silicon | Si | Mt Si | 8.0 | 5.4 China | - | 2116 | 16,931.3 | - |
| 11 | Silver | Ag | kt Ag | 25 | 5.6 Mexico | 1.3 | 643,087 | 16,077.2 | 836.0 |
| 12 | Phosphate | PO4 | Mt PO4 rock | 223 | 90 China | 2.7 | 70 | 15,610.0 | 189.0 |
| 13 | Palladium | Pd | t Pd | 191.6 D | 82.0 Russia D | 0.31 E | 67,524,116 | 12,937.6 | 21.1 |
| 14 | Bauxite | - | Mt bauxite | 371 | 110 Australia | 110 | 27 | 10,017.0 | 2970.0 |
| 15 | Lead | Pb | Mt Pb | 4.4 | 1.9 China | 0.48 | 1980 | 8710.8 | 950.3 |
| 16 | Chromium | Cr | Mt Cr ore | 40 | 16 South Africa | - | 180 | 7200.0 | - |
| 17 | Molybdenum | Mo | kt Mo | 300 | 120 China | - | 20,000 | 6000.0 | - |
| 18 | Rhodium | Rh | t Rh | 18.9 D | 14.9 South Africa D | - | 295,819,936 | 5591.0 | - |
| 19 | Tin | Sn | kt Sn | 270 | 81 China | 6.8 | 17,416 | 4702.4 | 118.4 |
| 20 | Cobalt | Co | kt Co | 140 | 95 DRC | 5.7 | 33,069 | 4629.7 | 188.5 |
| 21 | Platinum | Pt | t Pt | 153.8 D | 100.2 South Africa D | 0.21 E | 27,331,190 | 4203.5 | 5.7 |
| 22 | Rare Earths | REO | kt REO | 240 | 140 China | 17 | 12,852 F | 3084.4 | 218.5 |
| 23 | Uranium | U | kt U | 54.7 C | 22.7 Kazakhstan C | 5.4 C | 56,103 | 3068.9 | 303.0 |
| 24 | Zircon | ZrSiO4 | Mt zircon | 1.4 | 0.48 Australia | 0.48 | 1500 | 2100.0 | 720.0 |
| 25 | Niobium | Nb | kt Nb | 78 | 71 Brazil | - | 24,000 | 1872.0 | - |
| 26 | Tungsten | W | kt W | 84 | 29 China | - | 21,409 | 1798.4 | - |
| 27 | Ilmenite | FeTiO3 | Mt ilmenite | 7.6 | 2.3 China | 0.8 | 210 | 1596.0 | 168.0 |
| 28 | Graphite | - | Mt graphite | 1.1 | 0.65 China | - | 1400 | 1540.0 | - |
| 29 | Antimony | Sb | kt Sb | 153 | 80 China | 2 | 8774 | 1342.5 | 17.5 |
| 30 | Vanadium | V | kt V | 86 | 53 China | - | 14,771 | 1270.3 | - |
| 31 | Lithium | Li | kt Li | 82 | 40 Australia | 40 | 9612 | 788.2 | 384.5 |
| 32 | Rutile | TiO2 | kt rutile | 630 | 200 Australia | 200 | 1200 | 756.0 | 240.0 |
| 33 | Iridium | Ir | t Ir | 7.4 D | nd South Africa D | - | 51,446,945 | 380.7 | - |
| 34 | Indium | In | t In | 900 | 500 China | - | 400,000 | 360.0 | - |
| 35 | Garnet | - | Mt garnet | 1.1 | 0.36 Australia | 0.36 | 270 | 297.0 | 97.2 |
| 36 | Ruthenium | Ru | t Ru | 30.5 D | nd South Africa D | - | 8360,129 | 255.0 | - |
| 37 | Tantalum | Ta | t Ta | 1700 | 670 DRC | 30 | 129,390 | 220.0 | 3.9 |
| 38 | Gallium | Ga | t Ga | 300 | 290 China | - | 570,000 | 171.0 | - |
| 39 | Germanium | Ge | t Ge | 130 | 86 China | - | 1,000,000 | 130.0 | - |
| 40 | Selenium | Se | kt Se | 2.9 | 1.1 China | - | 44,092 | 127.9 | - |
| 41 | Bismuth | Bi | kt Bi | 17 | 14 China | - | 5952 | 101.2 | - |
| 42 | Scandium | Sc | t Sc | 15 | 1.1 Philippines G | - | 6164,290 G | 92.5 | - |
| 43 | Rhenium | Re | t Re | 53 | 30 China | - | 1,000,000 | 53.0 | - |
| 44 | Cadmium | Cd | kt Cd | 23 | 8.2 China | nd | 2300 | 52.9 | nd |
| 45 | Tellurium | Te | t Te | 490 | 300 China | - | 55,000 | 27.0 | - |
| 46 | Strontium | Sr | kt Sr | 210 | 86 Spain | - | 66 | 13.9 | - |
Publisher’s Note: MDPI stays neutral with regard to jurisdictional claims in published maps and institutional affiliations. |
© 2021 by the author. Licensee MDPI, Basel, Switzerland. This article is an open access article distributed under the terms and conditions of the Creative Commons Attribution (CC BY) license (https://creativecommons.org/licenses/by/4.0/).
Share and Cite
MDPI and ACS Style
Mudd, G.M. Assessing the Availability of Global Metals and Minerals for the Sustainable Century: From Aluminium to Zirconium. Sustainability 2021, 13, 10855. https://0-doi-org.brum.beds.ac.uk/10.3390/su131910855
AMA Style
Mudd GM. Assessing the Availability of Global Metals and Minerals for the Sustainable Century: From Aluminium to Zirconium. Sustainability. 2021; 13(19):10855. https://0-doi-org.brum.beds.ac.uk/10.3390/su131910855
Chicago/Turabian StyleMudd, Gavin M. 2021. "Assessing the Availability of Global Metals and Minerals for the Sustainable Century: From Aluminium to Zirconium" Sustainability 13, no. 19: 10855. https://0-doi-org.brum.beds.ac.uk/10.3390/su131910855
Note that from the first issue of 2016, this journal uses article numbers instead of page numbers. See further details here.