
Effect of Adding Emotion Recognition to Film Teaching—Impact of Emotion Feedback on Learning through Puzzle Films

Department of Information and Learning Technology, National University of Tainan, Tainan City 70005, Taiwan
*
Author to whom correspondence should be addressed.
Sustainability 2021, 13(19), 11107; https://0-doi-org.brum.beds.ac.uk/10.3390/su131911107
Submission received: 20 August 2021
/
Revised: 30 September 2021
/
Accepted: 4 October 2021
/
Published: 8 October 2021
(This article belongs to the Special Issue Sustainable E-learning and Education with Intelligence)
Abstract
:In this study, the scientific puzzle film, “Story of the Comet”, is taken as a case to implement scientific teaching to guide students to find correct answers, through which it can train their learning and judging abilities. The students in the experimental group received the scientific teaching guiding system of the puzzle film “Story of the Comet” with a facial emotion recognition system to recognize the emotional reaction of the subjects at the moment. According to their facial expressions of “disgust”, “sadness”, or “joy” appearing in the moment, the system presented differently captioned positive encouragement cards particularly designed for four different levels, for when the subjects answered the questions incorrectly at different levels and their emotions were detected at the same time. Furthermore, the positive encouragement cards encouraged the subjects to complete the puzzle film learning process. The subjects were students in the higher grades of Grade 5 and Grade 6 in elementary school. A total of 130 students participated in this experiment and were randomly divided into two groups. Both the control group (i.e., the group without emotion recognition) and the experiment group (i.e., the group with emotion recognition) received a before-watching test of learning effectiveness. After implementing the scientific teaching of the puzzle film “Story of the Comet”, both the control group and the experimental group also received an after-watching test of learning effectiveness. Finally, the subjects filled out a “learning satisfaction” questionnaire, “system availability” questionnaire, and “system satisfaction” questionnaire. The analysis of the results of the two groups’ tests and questionnaires: a comparative analysis of learning effectiveness indicates that there is a statistically significant difference between the choice answers of the two groups after the interactive teaching; for the experimental group, the average correct answers in the after-watching test was 5.86, which is 2.48 more than the before-watching test; that of the control group was 4.74, which is 1.47 more than the before -watching test. For comparative analysis of questionnaires for “learning satisfaction” and “system satisfaction”, the statistical data analysis indicates that the experimental group was more satisfied than the control group.
1. Introduction
In this era, in public and private universities in Taiwan, despite teachers’ great flow of speech on the podium, students in their seats usually mind their own business, chatting, sleeping, eating bento, playing mobile phones and video games, and watching movies; few students listen to teachers attentively [1]. The inattention of students at different levels, including elementary, junior high, and senior high schools, should not vary much. According to the concentration survey of Parenting magazine, more than 90% of teachers from elementary and middle schools believe that students do not concentrate enough, while “cannot understand contents in class”, “teaching methods cannot attract students”, and “teaching contents are too simple, which they have learned in continuation class and daycare centers” are the three major reasons for their inattention [2]. Therefore, learning effectiveness is very poor. How to raise students’ interest in learning and guide them to study attentively is an important topic of the education circle. As positive emotion improves students’ learning interest and motivation [3], by using the function of emotion detection and adding emotional feedback through encouragement cards, this study explored whether the addition of timely encouragement cards can improve the learning effectiveness of students.
Research Question
- Explore the relationship between emotional feedback and learning effectiveness when watching films with emotion detection added for learning.
- Explore the relationship between emotion detection and learning satisfaction when using film teaching.
- Explore the relationship between the availability of the teaching system and emotion detection when using film teaching.
- Explore the relationship between the satisfaction of the teaching system and emotion detection when using film teaching.
2. Literature Review
With the rapid development of science and technology and the innovation of teaching aids, the narrative teaching method in the classroom is no longer favored by students, and the visualization of an image is better than purely text description in cognition [4,5]; in the following four teaching methods—(1) digital learning by an interactive film; (2) digital learning by a non-interactive film; (3) digital learning without using film; (4) traditional teaching in class—comparing learning achievements based on the four different learning environments and learning equipment, results confirmed that students viewing interactive films in a digital learning environment achieved significantly better learning results and higher satisfaction [6]. With both sound and light effects, films are an excellent instrument to attract students’ attention. The audio–visual experience of film can improve students’ awareness and encourage critical thinking skills [7]. On the other hand, in addition to the function of an oral account, films allow the teacher to replay and pause, which makes them a good medium to promote learning [8,9,10]. Learning effectiveness is an indicator for judging students’ learning outcomes. The purpose of evaluating effectiveness is to let students become aware of their own learning situation and to serve as a basis for teachers to improve teaching and students to improve learning. [11] Learning effectiveness is a measure of the performance indicators or a behavior change after a student participates in a learning activity [11,12]. Generally, we can use two data to measure the effect of learning. The first is academic achievement, such as semester grade or test score [13,14], and the second is learning satisfaction [15,16,17]. Correspondingly, Huang et al. [18], they also use academic achievement and learning satisfaction as the two criteria to measure the learning effect of students. Learning satisfaction can be regarded as the learner’s feelings about learning activities [19,20], or the learner’s attitude [19] or sense of pleasure [21]. Piccoli et al. [17] and Maki et al. [16] believe that learning satisfaction expresses learners’ satisfaction with the learning process and learning results. Therefore, learning satisfaction is a very suitable criterion for evaluating learners’ satisfaction with classroom learning. As a result, we can further understand the learning effect of students based on academic achievement and learning satisfaction [22].
With the rapid changes of the times, it is more important to use effective ways to enable learners to quickly absorb the information they have learned in this fast-developing environment. Because of this, digital learning has stood out from the digitization of traditional methods. So far, it has evolved from inefficient computer-aided teaching to intelligent guidance learning through intelligent classrooms and mobile devices (digital learning by mobile equipment) [23]. In addition, studies found that observation and recognition of the learners’ emotional status enable teachers to adopt actions of significant impact on teaching quality and execution to a large extent and interact with students in more humanized ways. Therefore, an intelligent teaching system should consider relations among emotions, perceptions, and behaviors in the learning environment [24]. It is very important to explore students’ emotions, as there are inextricably connections between emotion and perception, which facilitates effective learning. The study also found that perception plays a role in emotion generation. Positive emotions can actually improve students’ learning interest and motivation [3]. Therefore, an emotion recognition system can help teachers interact fully and accurately so as to encourage students to learn actively. In this way, teachers will have the opportunity to monitor and propose appropriate expression models, especially when dealing with students’ negative emotions. Therefore, “effective emotion detection” allows the design of modular and reusable activities suitable for students’ learning styles, which can provide stronger and powerful educational activity planning [25]. According to the studies of Elias and Weissberg [26]; and Payton, Wardlaw, Graczyk, Bloody, Trompsett, and Weissberg [27], if children can use emotional intelligence in class, they can achieve better results in tests or other forms of academic performance. In addition, the study finds the relationship between emotional factors and students’ academic performance, which believes that students with healthy emotions have the opportunity to succeed in college, and one of the basic mechanisms of learning is students’ active participation. To be more exact, when a student begins to actually engage in the learning process, the student will usually be more active rather than assume passivity or total acceptance. In view of this, how to help students speed up their learning and obtain better learning results have always been the research topic of many researchers who are concerned about this issue.
Film teaching materials integrate various media materials such as images, pictures, music, sounds, and words to present information in an appropriate way and appearance. Therefore, it is normal to use films as a teaching aid in school teaching or in the daily work of industry, commerce, and society. As a cognitive theory, dual coding theory was proposed by Allan Paivio of the University of Western Ontario in 1971. Paivio believed that the “formation of imagery is beneficial to learning”. According to Paivio, people can use “verbal association” and “visual imagery” to further remember what they have learned [28]. Dual coding theory proposes that both visual information and verbal information are the way to express information, which is different in their processing methods. They are processed in different blocks of the brain, and information processed by each channel creates its own unique representation. When learning information, if people use visual code and verbal code at the same time, that is, generate a relevant image in visual code and link it with a verbal code, such an ability to use the two different codes improves the chances of remembering the item [29]. In addition, some people like to receive information through visual modes such as charts and illustrations, while others like to obtain information by reading or listening to verbal information; Richardson [30] called the former a “visualizer”, while the latter is a “verbalizer”. Through the study, Richardson found that there are obvious differences between visualizers and verbalizers in many characteristics; visualizers tend to think specifically, while verbalizers tend to think with more abstract symbols; visualizers like to think with physical images or mental images. Their thinking mode is subjective and self-oriented, while the thinking mode of verbalizers is objective and task-oriented.
According to the Cognitive Theory of Multimedia Learning of Mayer [31,32,33], there are two separate channels (auditory and visual) for processing information; there is limited channel capacity; and learning is an active process of filtering, selecting, organizing, and integrating information. Mayer points out that “people learn more from words and pictures” “rather than just words” [34,35]. However, only adding words to pictures is not an effective way to achieve this goal. The purpose of multimedia learning is to make teaching media according to people’s way of thinking. This is the basis of Mayer’s cognitive theory of multimedia learning. When it comes to multimedia learning, the theory puts forward three main assumptions:
- There are two separate channels (auditory and visual) for processing information (sometimes referred to as Dual-Coding theory).
- Learning is an active process of filtering, selecting, organizing, and integrating information based upon prior knowledge. Humans can only process a finite amount of information in a channel at a time, and they make sense of incoming information by actively creating mental representations.
Image, sound, action, and plots are the four characteristics of films. Combining these characteristics, it becomes a powerful force, which is far more than the media effect of pure text or ordinary text plus pictures. The advantage of film is that it has sound and light effects at the same time, giving viewers extreme sensory stimulation. Therefore, it is undeniable that film itself has a unique charm in attracting learners’ attention. Furthermore, due to the development of digital audio–visual technology and the population of networks, digital audio–visual information is everywhere in our daily life. Many teachers have used film as an auxiliary tool for teaching in school classes, but the format of films is mostly in a one-way communication mode, that is, relying on the authors’ intention to produce and play the content of the film, and the audience is expected to watch and accept the content. However, in the digital era, the one-way communication mode cannot meet the information audio–visual needs of the audiences. Responding to this trend, producers integrate new media materials and new technology and produce two-way films with interactive characteristics, through which users can participate and even dominate the content. In recent years, interactive films have been widely used in advertising, marketing, education, publicity, navigation, and other aspects of daily life. Interactive films have become an efficient instrument in education and communication.
3. Research Design and Method
3.1. Research Design
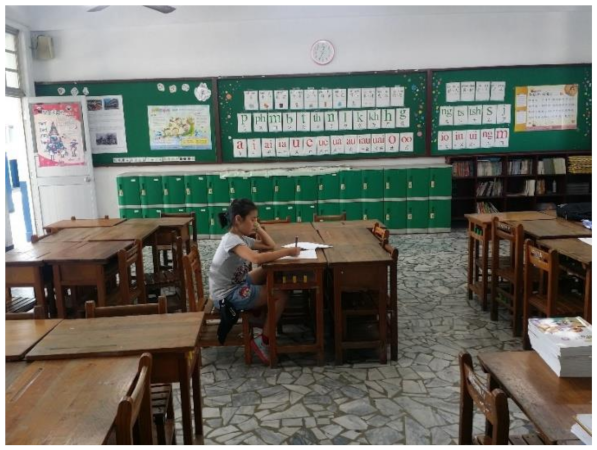
In this study, the interactive puzzle film “Story of the Comet” (Halley’s Comet) is provided to students to watch (Figure 1); the film is modeled after puzzle-solving in a scientific teaching guidance system to study the learning process and effectiveness of students and further confirm whether this teaching mode can improve teaching effectiveness of teachers and learning effectiveness of students. In the experiment, when the emotion recognition system was added—through which doubtful students were encouraged with emotion-related feedback—to inspect the impact of emotion-related feedback on the learning process of students.
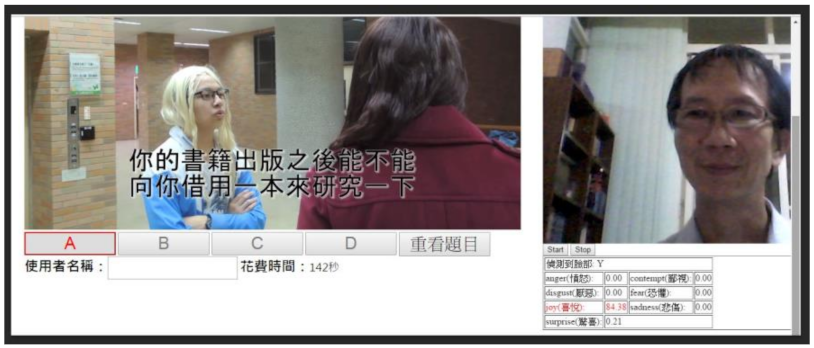
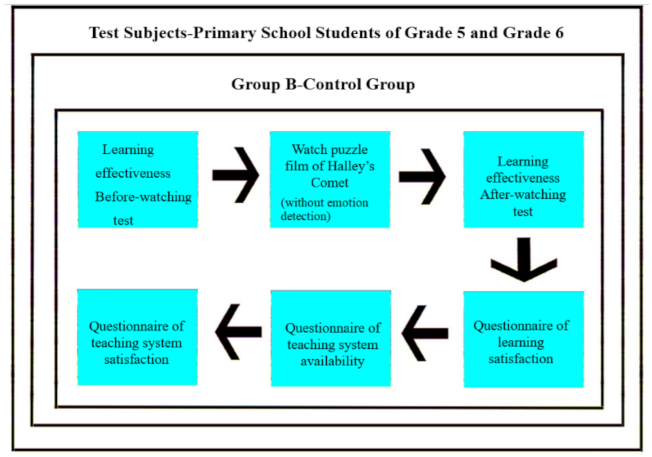
The learning effectiveness block was divided into two groups. One group was the experimental group, and the other group was the control group. In both the experimental group and control group, the students were asked to complete the first knowledge test on Halley’s Comet discovery process (Figure 2). The test had 10 true or false questions and 10 multiple-choice questions, with 5 points for each question, totaling 100 points. Then, the students in the experimental group and control group watched the interactive puzzle film “Story of the Comet” and chose their answers for four levels according to the guidance in the interactive puzzle film (Figure 3). When the students of the experimental group watched the interactive puzzle film, facial emotion detection and recognition systems were added (Figure 4). If emotions of disgust, sadness, or joy were detected when choosing answers while watching the interactive puzzle film “Story of the Comet”, the corresponding encouragement card of emotion feedback was given at different levels (Figure 5, Figure 6, Figure 7, Figure 8, Figure 9). When watching the interactive puzzle film, students in the control group the facial emotion detection and recognition systems were not used (Figure 10); in other words, there was no encouraging emotional feedback; the content of the interactive puzzle film “Story of the Comet” was entirely about the story of discovering Halley’s Comet. The 16 short films were organized into four levels, including the historical story of Halley’s Comet and fabricated stories, and students were required to choose answers. After completing the interactive puzzle film, the second test on the discovery process of Halley’s Comet was immediately conducted on students in the experimental group and control group. The question content and question numbers were completely the same as the first test, including 10 true or false questions and 10 multiple-choice questions, with each question valuing 5 points, totaling 100 points. After completing the interactive puzzle film and the second test, the test results were compared with those of the first test to check learning effectiveness. In addition, the students were asked to fill the questionnaire on system availability, system satisfaction, and learning satisfaction (Figure 2). Before the test, Excel was employed to generate a random number table to decide whether the students who participated in the test before and after belonged to the experimental group to join the emotional detection or to the control group without adding emotional detection.
The script of the film is in Appendix A.
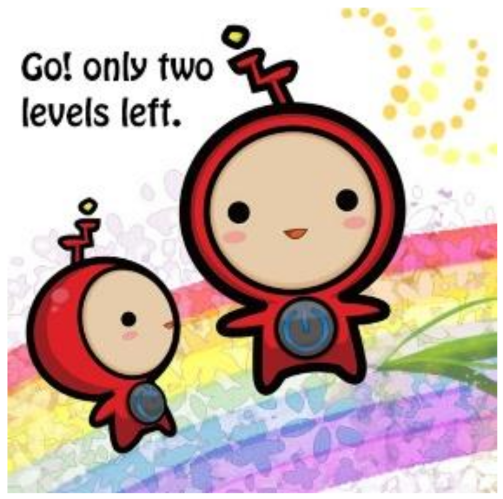
The 5 captioned encouragement cards (Figure 5, Figure 6, Figure 7, Figure 8, Figure 9) are as follows:
Thus, this study proposed the following hypotheses.
3.2. Research Hypothesis
Hypothesis 1 (H1).
When using film with emotion detection for learning, emotional feedback will have a positive impact on learning effectiveness.
Hypothesis 2 (H2).
The addition of emotion detection when using film teaching will have a positive impact on learning satisfaction.
Hypothesis 3 (H3).
The availability of the teaching system when using film teaching will be positively impacted by the addition of emotion detection.
Hypothesis 4 (H4).
The satisfaction of the teaching system when using film teaching will be positively impacted by the addition of emotion detection.
3.3. Research Method
This study shot a total of four films to tell the “Story of the Comet” (Halley’s Comet) and designed a teaching guidance system. By combining the films with the teaching guidance system and through emotion detection and emotion feedback, this teaching guidance system was installed in private laptops of the researcher, and the researcher took the paper questionnaires and laptops to elementary schools in different cities to conduct the experiment one school after another. The researcher made a parental consent form and then asked the fifth- and sixth-grade class teachers to distribute it to their students. The students took the forms home and obtained consent signed by their parents. The students with parental consent were the samples in this study. The elementary schools participating in this research provided a classroom with no classes as an experimental classroom. The researcher used an experimental system installed on a notebook computer to process. The class teacher assigned one student to the experimental classroom for the experiment at a time. This student filled out test paper on the discovery process of Halley’s Comet for the first time and then used the notebook computer to watch puzzle film of Halley’s Comet. After the puzzle film of Halley’s Comet test was over, the student filled out the test paper on the discovery process of Halley’s Comet for the second time. Furthermore, after filling out some other paper questionnaires at the same time, the student completed the experiment and went back to invite the next student to the experimental classroom to continue the experiment.
The four films are coded with One, Two, Three, and Four. The first film is a story about Halley and Newton, the second film is about Halley and Hooke, the third film is about Halley and Wren, and the fourth film is about Halley and Flamsteed. Except for the first film, the other three films are fabricated. Every film has four plots to form a complete film plot; therefore, the first film is about Halley and Newton, which is made up of four short plots of D, F, I, and O; the second film is about Halley and Hooke, which is made up of four short plots of C, H, J, and M; the third film is about Halley and Wren, which is made up of four short plots of B, E, K, and P; and the fourth film is about Halley and Flamsteed, which is made up of four short plots of A, G, L, and N. There are 16 short films in total, in which D, F, I, O is the right sequence, and the rest—C, H, J, M; B, E, K, P; A, G, L, N, etc.—are fabricated plots, and the 16 short films are compiled in the following mode:
- First-level film: Answer (A). Flamsteed (1); Answer (B). Wren (1); Answer (C). Hooke (1); Answer (D). Newton (1).
- Second-level film: Answer (E). Wren (2); Answer (F). Newton (2); Answer (G). Flamsteed (2); Answer (H). Hooke (2).
- Third-level film: Answer (I). Newton (3); Answer (J). Hooke (3); Answer (K). Wren (3); Answer (L). Flamsteed (3).
- Fourth-level film: Answer (M). Hooke (4); Answer (N). Flamsteed (4); Answer (O). Newton (4); Answer (P). Wren (4).
Before the first level, there was an introduction of the film’s characters in words. Then, before every level, there was a part of words showing the choices of the answers, and there was a caption of plot introduction before each plot was performed by an actual person, at the beginning of which the options were shown, such as A, B, and C; then, the plot was performed by actual persons. After watching the performance of the four answers by actual persons, there was a captioned film that asked the subjects to choose the correct answer from the four options. If the subject chose the correct answer, the caption guided the subject to go on to the next level of the film; if the wrong answer was chosen, the caption told the subject to choose another film plot of the level, and the film plot was returned to the beginning page. In this way, until choosing the correct plot answers for the four levels, the subject completed the levels in sequence.
The film content sequence of the first level was as follows:
- (Captioned film) Based on the story of the first level, there are four different plots A, B, C, and D. Please choose the right one.
- (Captioned film) A: Halley and Flamsteed were both British astronomers and celebrities at that time. Halley paid a special visit to Flamsteed to look for the comet data he was studying.
The actors performed the above plot film.
- (Captioned film) B: Halley and Wren were both British astronomers and good friends; Halley paid a special visit to Wren to look for the comet data he was studying.
The actors performed the above plot film.
- (Captioned film) C: Halley, Hooke, and Wren were friends. One day, the friends met to chat. Halley asked Hooke for the calculation formula in order to look for the comet data he was studying.
The actors performed the above plot film.
- (Captioned film) D: Active Halley and lonely Newton were good friends in spite of their difference in age. Halley always had doubts about the laws of planetary motion and could not find the answer.
The actors performed the above plot film.
- (Captioned film) Please choose the correct answer from A, B, C, and D.
The film content order of the second level is as follows:
- (Captioned film) There are E, F, G, and H, totaling four different plots in the second level. Please choose the right one.
- (Captioned film) E: Three months later, Wren published a book on astronomy and astrology—On the Revolutions of Heavenly Spheres. One day, Halley went to Wren’s house and asked for books On the Revolutions of Heavenly Spheres.
The actors performed the above plot film.
- (Captioned film) F: In August 1684, Halley paid a special visit to Newton in Oxford to look for the comet data he was studying and borrowed the formula data of the law of planetary motion from Newton.
The actors performed the above plot film.
- (Captioned film) G: Two months later, Flamsteed published a book on astronomy and astrology — The Origins of Astrology. One day, Halley went to Flamsteed’s house and wanted to borrow the book, The Origins of Astrology.
The actors performed the above plot film.
- (Captioned film) H: A few days later, Halley went to Hooke’s house. Hooke lent the calculation formula of planetary orbit to Halley.
The actors performed the above plot film.
- (Captioned film) Please choose the right answer from E, F, G, and H.
The film content order of the third level is as follows:
- (Captioned film) There are I, J, K, and L, totaling four different plots in the third level. Please choose the right one.
- (Captioned film) I: Based on the hypothesis mentioned in The Principia: Mathematical Principles of Natural Philosophy of Newton, Halley analyzed all the comet observation records collected and found the movement law of a certain comet.
The actors performed the above plot film.
- (Captioned film) J: After studying the data of the Scientific Principles of Nature written by Hooke for some time, Halley found the movement law of a certain comet.
The actors performed the above plot film.
- (Captioned film) K: After studying data of On the Revolutions of Heavenly Spheres written by Wren for some time, Halley found the movement law of a certain comet.
The actors performed the above plot film.
- (Captioned film) L: After studying data of The Origins of Astrology written by Flamsteed for some time, Halley found the movement law of a certain comet.
The actors performed the above plot film.
- (Captioned film) Please choose the right answer from I, J, K, and L.
The film content order of the fourth level is as follows:
- (Captioned film) There are M, N, O, and P, totaling four different plots in the fourth level. Please choose the right one.
- (Captioned film) M: Two years later, on Christmas eve, Hooke and Halley sat in a chair outside the café. Halley found that the comet he had speculated using Hooke’s formula in the sky returned.
The actors performed the above plot film.
- (Captioned film) N: Three years later, one night in September, Halley sat in front of his house to enjoy the cool. He found in the sky that the comet he had speculated by using the Flamsteed formula had returned.
The actors performed the above plot film.
- (Captioned film) O: On December 25, 1758, this comet was observed by a German farmer and amateur astronomer, Johann Georg Palitzsch. However, Halley died in 1742 and failed to see the return of this comet.
The actors performed the above plot film.
- (Captioned film) P: Seven years later, one night in March, Mary, Halley’s wife, sat in front of her house to enjoy the cool. She found in the sky that the comet Halley had speculated by using the Wren formula had returned.
The actors performed the above plot film.
- (Captioned film) Please choose the right answer from M, N, O, and P.
In the first level, after watching films of the four answers, when the subjects chose the wrong answer, a 10-s caption of “Sorry, you chose the wrong answer, please choose again.” would appear, and the system would start to detect facial emotions. When disgust or sadness emotions were detected, the 01 captioned encouragement card would appear for 2 s, then return to the current page. For the wrong answer, when a joy expression was detected, the 05 captioned encouragement card would appear for 2 s and return to the current page. At the same level, if the wrong answers were chosen multiple times or joy expression was detected, the captioned encouragement card would appear under the same rule. The rules were the same for the second, third, and fourth levels. In the first, second, and third levels, when the subjects chose the right answer, the system would display the caption of “Congratulations! Your answer is right. Please go on to the next level.” and the system would automatically be guided to the next level. In the fourth level, if the subjects chose the right answer, the system would display the caption of “Congratulations! Your answer is right, and all levels have been finished. The test is completed.” The test time of interactive puzzle film “Story of the Comet” was 60 min; the sample was regarded as invalid if this time limit was exceeded.
Characters and Script Are Introduced as Follows
Characters in “Story of the Comet”:
- Edmond Halley (1656–1742): A British astronomer for Greenwich Observatory.
- Isaac Newton (1643–1727): A British physicist, mathematician, astronomer, natural philosopher, and alchemist. In 1687, he released The Principia: Mathematical Principles of Natural Philosophy. The universal gravitation and three laws of motion were expounded, which laid the foundation of mechanics and astronomy in the next three centuries.
- Robert Hooke (1635–1703): A British naturalist, inventor, physicist, machinist, and architect. In terms of physical research, he put forward the basic law describing material elasticity—Hooke’s law. In terms of mechanical manufacturing, he designed and manufactured vacuum pumps, microscopes, and telescopes and wrote his own observations with a microscope in his book Micrographia. The English word “cell” was named by him. Hooke also made important contributions to urban design and architecture, but he was barely known after his death due to a debate with Newton.
- Christopher Wren (1632–1723): A British astronomer, architect, academician of The Royal Society, President of The Royal Society, and junior knight.
- Mary Stuart: Wife of Halley, who married Edmond Halley in 1682 and died in 1736.
- Johann Georg Palitzsch: A farmer and amateur astronomer in Germany in the eighteenth century.
- John Flamsteed: The first royal astronomer in Britain in the seventeenth century. His successor was Edmond Halley. He recorded more than 3000 stars. The famous Flamsteed naming method was invented by John Flamsteed.
4. Research Results
Experimental Results: There were 130 subjects in this test and questionnaire, in which there were 125 valid samples and 5 invalid samples; the valid rate of the questionnaire was 96.15%. There were 63 valid subjects in the group with emotion recognition and 62 valid subjects in the group without emotion recognition.
- For comparative analysis of learning satisfaction, a p-value of 0.000 < 0.05 indicates that there is a significant difference between the learning satisfaction average of the two groups; the learning satisfaction average of the group with emotion recognition was 4.13, and that of the group without emotion recognition was 3.69. The statistical analysis shows that the group with emotion recognition was higher in learning satisfaction than the group without emotion recognition.
- In the comparative analysis of teaching system availability, there was no significant difference between the two groups.
- In the comparative analysis of teaching system satisfaction, with a p-value of 0.00 < 0.05, there was a significant difference between the teaching system satisfaction of the two groups; the teaching system satisfaction average of the group with emotion recognition was 4.26, and that of the group without emotion recognition was 3.46. The statistical analysis shows that the group with emotion recognition was higher than the group without emotion recognition in terms of teaching system satisfaction.
Research Findings:
- According to the test results before and after watching the puzzle film, results show that among the subjects, the group with emotion recognition and receiving encouragement words performed better than the group without emotion recognition and no encouraging words. The appearance of encouragement cards facilitated better learning performance.
- According to results of the questionnaire, for comparative analysis of learning satisfaction and comparative analysis of teaching system satisfaction, the two analyses indicated that the learning satisfaction of the group with emotion recognition was higher than that of the group without emotion recognition; the increase of perception accessibility also enhanced the entertainment perception, which has a direct impact on the use intention of students and indirectly affects students’ use intention.
- Learning through multimedia aims to make teaching media according to people’s thinking modes from an overall perspective. In response to this trend, we should integrate various materials and novel technologies, arrange appropriate content, determine teaching strategies based on the learning status of students, and make two-way interactive films. An interactive film can design changing story trends, increase diversified learning pathways, and provide interesting, positive, encouraging interaction when questions are answered. With adaptive learning strategies and a good learning mood, it helps to improve students’ interest in watching the film.
4.1. Implementation and Collection of Test and Questionnaire
The survey subjects of this testing and questionnaire, who were tested and questioned on-site and whose answers were collected, totaled 130 cases. During the implementation of the 130 student samples in the puzzle film, all students finished the task in one hour (60 min). There were 125 valid test and questionnaire samples and 5 invalid test and questionnaire samples (A21, A57, B3, B8, B26), so the valid rate of the questionnaire was 96.15%.
4.2. Analysis of Basic Data
The valid questionnaires indicated that there are a total of 125 valid respondents, including 63 in the group with emotion recognition and 62 in the group without emotion recognition.
Gender and gender distribution (Table 1): there are 64 females (51.2%) and 61 males (48.8%), and there are 2.4% more females. In the group with emotion recognition, there are 11.2% more females; in the group without emotion recognition, there are 6.4% more males.
Grade and grade distribution (Table 1): There are 51 (40.8%) students in Grade 5. There are 74 (59.2%) students in Grade 6, which is 18.4% more than Grade 5. For the group with emotion recognition, Grade 6 is 11.2% larger than Grade 5; for the group without emotion recognition, Grade 6 is 25.8% larger than Grade 5.
Age and age distribution (Table 1): There are 17 (13.6%) students aged 10, 51 (40.8%) students aged 11, 49 (39.2%) students aged 12, and 8 (6.4%) students aged 13; students aged 11 and 12 are almost the same numbers. For the group with emotion recognition, students aged 11 account for more with a ratio of 44.4%; for the group without emotion recognition, students aged 12 account for more with a ratio of 43.5%.
Learning time (time used to finish four levels): the average learning time spent by the group with emotion recognition was 20 min 9 s, and that of the group without emotion recognition was 17 min 15 s; the group with emotion recognition spent 2 min 54 s more on average, and their emotional reaction was detected 3.3 times on average, upon which occasion they received encouragement cards. The group with emotion recognition took 16.8% more time than the group without emotion recognition.
Emotion detection data: among the 65 students in the group with emotion recognition, an emotional reaction was not detected in five respondents—A11, A27, A28, A38, and A46—during the test. Among the 65 respondents, the most detected emotional reaction was disgust, with a total number of 177 times, and for individuals, disgust was detected nine times at most; sadness was detected 11 times, and for individuals, sadness was detected three times at most; joy was detected 12 times in total, and for individuals, joy was detected three times at most. The longest time for a student to finish the four levels in the group with emotion recognition was 30 min 36 s, and the shortest time was 10 min 38 s; the longest time for a student to finish the four levels in the group without emotion recognition was 35 min 36 s, and the shortest time was 4 min 21 s.
4.3. Effectiveness Analysis of the Interactive Teaching Test
An independent sample t-test was adopted to compare whether there is a significant difference between the average of the two groups of samples. (1) There is no significant difference between the group with emotion recognition and the group without emotion recognition in the before-watching true or false questions test, with a p-value of 0.10>0.05, indicating that there is no difference between the true or false answers of the two groups before the interactive teaching; for the group with emotion recognition, the average right answers of true or false questions in the before-watching test is 5.05, and that of the group without emotion recognition is 5.42. (2) There is no significant difference between the group with emotion recognition and the group without emotion recognition in the before-watching multiple-choice questions test either. With a p-value of 0.69>0.05, it indicates that there is no difference in the multiple-choice question answers of the two groups before the interactive teaching; for the group with emotion recognition, the average right answers of multiple-choice questions in the before-watching test is 3.38, and that of the group without emotion recognition is 3.27, which indicates that there is no difference between the performances of the two groups in the before-watching test before watching the “Story of the Comet”.
An independent sample t-test is used to compare whether there is a significant difference between the average of samples of the two groups. (1) There is no significant difference between the group with emotion recognition and the group without emotion recognition in the after-watching true or false questions test, with a p-value of 0.43>0.05, it indicates that there is no difference between the true or false answers of the two groups after the interactive teaching; for the group with emotion recognition, the average right answers of true or false questions in the after-watching test is 6.19, which is 1.14 more than the before-watching test; that of the group without emotion recognition is 6.39, which are 0.97 more than the before-watching test. (2) However, there is a significant difference between the group with emotion recognition and the group without emotion recognition in the after-watching multiple-choice question test; with a p-value of 0.00<0.05, it indicates that there is a difference between the choice answers of the two groups after the interactive teaching; for the group with emotion recognition, the average right answers of multiple-choice questions in the after-watching test is 5.86, which is 2.48 more than the before-watching test—that of the group without emotion recognition is 4.74, which is 1.47 more than the before-watching test, and indicates that during the interactive teaching of “Story of the Comet”, the appearance of the encouragement card helps students of the group with emotion recognition to obtain better learning performance in the after-watching test of multiple-choice questions.
4.4. Construct Validity and Reliability of the Questionnaire
4.4.1. Construct Validity Analysis
After investigation and collection of all questionnaires, the valid samples collected is 125, which ensures the validity of the factor analysis. Statistics software of SPSS 18.0 for Windows is taken as the main tool for data analysis; generally, the method to measure construction validity is to use factor analysis to analyze the factor structure matrix of each item of each scale, and then retain the item only if the factor loading listed in the structure matrix is greater than 0.5, otherwise; it is deleted. To judge the validity of the framework, the greater the factor loading, the better the validity. KMO is Kaiser-Meyer-Olkin sampling adequacy. When the KMO value is greater, it means that there are more common factors among variables, which is more suitable for factor analysis. When the KMO value is less than 0.5, it is not suitable for factor analysis. When the KMO value is greater than 0.7, the effect is acceptable, and when the KMO value is greater than 0.9, the effect is the best. Factor analysis can be verified by the KMO value and Bartlett’s test.
4.4.2. Reliability Analysis
To understand the validity and reliability of the questionnaire, reliability analysis should be completed. Cronbach’s α coefficient is the commonly used reliability analysis method in the Likert scale. The higher the coefficient, the higher the degree of internal consistency of items. Devellis [38] and Nunnally [39] believed that the minimum reliability coefficient should be more than 0.7 to be acceptable. This study uses this method to verify the consistency of scale questionnaires in learning satisfaction, teaching system availability, teaching system satisfaction, etc.
4.4.3. Validity and Reliability Analysis of the Questionnaire
(1) Survey analysis of learning satisfaction
Factor analysis on the learning satisfaction survey is conducted. There are nine items in the scale of students’ statements about learning satisfaction. KMO and Bartlett’s tests are conducted to test whether it is suitable for factor analysis. With a KMO of 0.917 and Bartlett’s test p = 0.000 < 0.001, the value reaches a significant level, indicating that the correlation matrix has common factors and is suitable for factor analysis; the α coefficient of Factor 1 is 0.899, which has reached high reliability.
(2) Survey analysis on teaching system availability
Factor analysis on teaching system availability is conducted. There are 10 items in the scale of students’ statements about teaching system availability. KMO and Bartlett’s tests are conducted to test whether it is suitable for factor analysis. With a factor load of 0.488, item 10 is deleted; after deleting item 10, the remaining 9 items underwent factor analysis again. With a KMO value of 0.847 and Bartlett’s test p = 0.000 < 0.001, the value reaches a significant level, indicating that the correlation matrix has common factors and is suitable for factor analysis; the α coefficient of Factor 1 is 0.838, which has reached high reliability; that of Factor 2 is 0.776, which has also reached high reliability.
(3) Survey analysis on teaching system satisfaction
Factor analysis on teaching system satisfaction was conducted. There are six items in the scale of students’ statements about teaching system satisfaction. KMO and Bartlett’s tests were conducted to test whether it is suitable for factor analysis. With a KMO value of 0.890 and Bartlett’s test p = 0.000 < 0.001, the value reaches a significant level, indicating that the correlation matrix has common factors and is suitable for factor analysis; the α coefficient of Factor 1 is 0.869, which has reached high reliability.
4.5. Comparative Analysis of the Group with Emotion Recognition and the Group without Emotion Recognition
4.5.1. Comparative Analysis of Learning Satisfaction
(1) Frequency-distribution table
Based on the questionnaire collected, there are 125 valid samples, including 63 in the group with emotion recognition and 62 in the group without emotion recognition. There are nine questions in learning satisfaction. In the group with emotion recognition, “strongly agree” accounts for most answers with a ratio of 42.2%—however, there is no “strongly disagree”; in the group without emotion recognition, “agree” accounts for most answers, with a ratio of 40.1%.
(2) Average learning satisfaction based on gender
An independent sample t-test was used to determine whether there is a significant difference between the sample average of the two groups and the average learning satisfaction of females and males; with a p-value of 0.336 > 0.05, it indicates that there is no significant difference in the average of learning satisfaction based on gender—the average of learning satisfaction of females is 3.86, and that of males is 3.97.
(3) Average learning satisfaction based on grades
An Independent sample t-test was used to determine whether there is a significant difference between the sample average of the two groups and the average of learning satisfaction of Grade 5 and Grade 6, with a p-value of 0.000 < 0.05. It indicates that there is a significant difference between the average learning satisfaction based on grades; the average learning satisfaction of Grade 5 is 4.18, and that of Grade 6 is 3.73, so Grade 5 is higher than Grade 6 in learning satisfaction.
(4) Learning satisfaction comparison based on groups
An independent sample t-test was used to determine whether there is a significant difference between the sample averages of the two groups and the average learning satisfaction, including the group with emotion recognition and the group without emotion recognition. With a p-value of 0.000 < 0.05, it indicates that there is a significant difference between the average of the learning satisfaction of the two groups; learning satisfaction average of the group with emotion recognition is 4.13, and that of the group without emotion recognition is 3.69—the statistics show that the group with emotion recognition is higher in learning satisfaction than the group without emotion recognition.
(5) Learning satisfaction comparison of questions within the groups
An independent sample t-test was used to determine whether there is a significant difference between the sample averages of the two groups and the learning satisfaction averages of questions within the two groups—the group with emotion recognition and the group without emotion recognition—with a p-value < 0.05. Results indicate that the learning satisfaction of questions within groups has a significant difference. By comparing questions of learning satisfaction, * indicates a p-value < 0.05 and has a significant difference. Questions 1–9 (Table 2), except question 2, failed to reach a significant level; the learning satisfaction of the remaining 8 questions all reached a significant level, indicating that except for question 2, learning satisfaction of the remaining questions in the group with emotion recognition is better than that of the group without emotion recognition.
4.5.2. Comparative Analysis of Teaching System Availability
(1) Frequency distribution table
Based on the questionnaire collected, there are 125 valid samples, including 63 in the group with emotion recognition and 62 in the group without emotion recognition. There are nine questions in teaching system availability. Questions 1, 3, 5, 7, and 9 express the teaching system availability positively, in the group with emotion recognition “strongly agree” accounts for most answers with a rate of 33.3%; in the group without emotion recognition, “agree” accounts for most answers with a rate of 35.2%. Questions 2, 4, 6, and 8 express the teaching system availability negatively in the group with emotion recognition. “Ordinary” accounts for most answers with a rate of 36.9%; in the group without emotion recognition, “ordinary” accounts for most answers with a rate of 41.9%.
(2) Teaching system availability based on gender
An independent sample t-test was used to determine whether there is a significant difference between the sample average of the two groups and the average of teaching system availability based on gender. Questions 1, 3, 5, 7, and 9 express the teaching system availability positively, with a p-value of 0.613 > 0.05. Results indicate that there is no significant difference between the positive average based on gender. For females, the positive average of teaching system availability is 3.84, and that of males is 3.90. Questions 2, 4, 6, and 8 express the teaching system availability negatively, with a p-value of 0.252 > 0.05. Results indicate that there is no significant difference between the negative average based on gender. For females, the positive average of teaching system availability is 2.68, and that of males is 2.52. Overall, there is no significant difference between genders in ratings of teaching system availability.
(3) Teaching system availability based on grades
An independent sample t-test was used to determine whether there is a significant difference between the sample average of the two groups and the average of teaching system availability for Grade 5 and Grade 6. Questions 1, 3, 5, 7, and 9 express the teaching system availability positively, with a p-value of 0.000 < 0.05. Results indicate that there is a significant difference between the positive average based on grades. For Grade 5, the positive average of teaching system availability is 4.19, and that of Grade 6 is 3.65. Grade 5 is higher than Grade 6. Questions 2, 4, 6, and 8 express the teaching system availability negatively, with a p-value of 0.014 < 0.05. Results indicate that there is a significant difference between the negative average based on grades. For Grade 5, the positive average of teaching system availability is 2.39, and that of Grade 6 is 2.76, Grade 5 is lower than Grade 6. Overall, Grade 5 is higher than Grade 6 in teaching system availability.
(4) Teaching system availability comparison based on groups
An independent sample t-test was used to determine whether there is a significant difference between the sample average of the two groups and teaching system availability average of two groups, including the group with emotion recognition and the group without emotion recognition. Questions 1, 3, 5, 7, and 9 express the teaching system availability positively, with a p-value of 0.969 > 0.05. Results indicate that there is no significant difference between the positive average based on groups. The positive average of teaching system availability of the group with emotion recognition is 3.87, and that of the group without emotion is 3.87. Questions 2, 4, 6, and 8 express the teaching system availability negatively; with a p-value of 0.378 > 0.05, results indicate that there is no significant difference between the negative average based on groups. The negative average of teaching system availability of group with emotion recognition is 2.66, and that of the group without emotion is 2.57. Overall, for teaching system availability, there is no significant difference between the two groups.
(5) Teaching system availability comparison based on questions within the groups
An independent sample t-test was used to determine whether there is a significant difference between the sample average of the two groups and the teaching system availability average of two groups, including the group with emotion recognition and the group without emotion recognition. With a p-value < 0.05, results indicate that questions within the two groups in teaching system availability have no significant difference. All questions from 1 to 9 did not reach a significant level (Table 3), which indicates that there is no difference in the teaching system availability between the group with emotion recognition and the group without emotion recognition.
4.5.3. Comparative Analysis on Teaching System Satisfaction
(1) Frequency distribution table
Based on the questionnaire collected, there are 125 valid samples, including 63 in the group with emotion recognition and 62 in the group without emotion recognition. There are six questions in teaching system satisfaction. In the group with emotion recognition, “strongly agree” accounts for most answers with a ratio of 44.7%; in the group without emotion recognition, “neutral” accounts for most answers with a ratio of 40.0%.
(2) Teaching system satisfaction based on gender
An independent sample t-test was used to determine whether there is a significant difference between the sample average of the two groups and the average of teaching system satisfaction based on the gender of males and females. With a p-value of 0.295 > 0.05, results indicate that there is no significant difference between the average teaching system satisfaction based on gender; for females, the average teaching system satisfaction is 3.93, and that of males is 3.80.
(3) Teaching system satisfaction based on grades
An independent sample t-test was used to determine whether there is a significant difference between the sample average of the two groups and the average teaching system satisfaction for Grade 5 and Grade 6. With a p-value of 0.000 < 0.05, results indicate that there is a significant difference between the average of teaching system satisfaction base on grades; for Grade 5, the average of teaching system satisfaction is 4.11, and that of Grade 6 is 3.70. Grade 5 is, therefore, higher than Grade 6 in teaching system satisfaction.
(4) Teaching system satisfaction comparison based on groups
An independent sample t-test was used to determine whether there is a significant difference between the sample average of the two groups and the teaching system satisfaction of the two groups, including the group with emotion recognition and the group without emotion recognition. With a p-value of 0.00 < 0.05, results indicate that there is a significant difference between the teaching system satisfaction of the two groups; the teaching system satisfaction average of the group with emotion is 4.26, and that of the group without emotion recognition is 3.46. Statistical analysis indicates that the group with emotion recognition is higher in teaching system satisfaction as a whole than the group without emotion recognition.
(5) Teaching system satisfaction comparison in questions within the groups
An independent sample t-test was used to determine whether there is a significant difference between the sample average of the two groups and the teaching system satisfaction average of the two groups, including the group with emotion recognition and the group without emotion. With a p-value < 0.05, results indicate that there is a significant difference between teaching system satisfaction within questions of the two groups.
By comparing questions within the groups in teaching system satisfaction, * indicates p-value < 0.05, which shows a significant difference. From questions 1 to 6 (Table 4), all six questions reached the significance level in teaching system satisfaction, which indicated that the teaching system satisfaction of questions within the group with emotion recognition is better than the group without emotion recognition as a whole.
5. Conclusions
According to Elias et al., if students can use emotional intelligence in the classroom, they can achieve better results in tests or any other form of academic performance. In this study, the test results before and after watching the interactive film show that the experimental group performed better in learning (answered 2.48 more questions correctly) than the control group (answered 1.47 more questions correctly), proving that the encouragement cards enhanced the students’ learning effectiveness. The results of this research fully echo the research of several scholars, such as Elias et al. In addition, Mary E. Pritchard et al. suggested that positive emotions can increase students’ learning interest and motivation. In this study, the learning satisfaction of the experimental group (average 4.13) is higher than that of the control group (average 3.69), and the system satisfaction of the experimental group (average 4.26) is also higher than that of the control group (average 3.46). Nevertheless, the teaching system availability of the two groups has no significant difference. The increase of perception accessibility also enhances the perception of entertainment, which has a direct impact on the use intention of students. The results of this research also echo the research of several scholars, such as Mary E. Pritchard. The goal of this research is to understand the impact of emotional feedback on learning when using a puzzle film in teaching. The research results also confirmed that emotions play an important role in learning. An intelligent learning system can arouse pleasant emotions and reduce learning resistance for learners who may feel frustrated or confused during learning. A positive learning mood can enhance learning effectiveness, and this teaching system improves the past teacher-oriented teaching methods. The sound and light effects of the film stimulate learning enthusiasm. The more important purpose is to increase students’ continuous learning motivation and improve their learning ability. Therefore, it is recommended that teachers can make good use of film combined with emotion detection to teach, which will be of great help to improve learning results and the future development of education.
Author Contributions
Conceptualization, H.-C.K.L. and S.-C.T.; methodology, H.-C.K.L. and S.-C.T.; software, S.-C.T.; validation, H.-C.K.L. and S.-C.T.; formal analysis, H.-C.K.L. and S.-C.T.; investigation, S.-C.T.; resources, H.-C.K.L. and S.-C.T.; data curation, S.-C.T.; writing—original draft preparation, S.-C.T.; writing—review and editing, H.-C.K.L. and S.-C.T.; visualization, S.-C.T.; supervision, H.-C.K.L. and S.-C.T.; project administration, S.-C.T.; funding acquisition, H.-C.K.L. and S.-C.T. All authors have read and agreed to the published version of the manuscript.
Funding
This research received no external funding.
Institutional Review Board Statement
Not applicable.
Informed Consent Statement
Informed consent was obtained from all subjects involved in the study.
Data Availability Statement
Flipped Education, Parenting, Dialogue between Teaching and Learning, Available online: https://flipedu.parenting.com.tw/article/139, accessed on 18 August 2021.
Conflicts of Interest
The authors declare no conflict of interest.
Appendix A. Film Script
Script of the First Film
Act 1
(Caption): Although with 14 years apart, active Halley and lonely Newton were good friends. In newton’s mind, Halley was the most trustworthy friend.
(Caption): In 1680.
Halley: According to Kepler’s third law of planetary motion, the gravitational attraction of the sun to the planet should be inversely proportional to the square of the distance, but can this gravitational attraction comply with Kepler’s first law of planetary motion that the orbit of the planet is elliptical?
(Caption): Halley could not prove it himself. He once consulted Mr. Hooke who studied the same question and other members of The Royal Society, but he couldn’t get the answer. Finally, Halley decided to ask Newton.
Act 2
(Caption): In August 1684, Halley went to Oxford to visit Newton.
Halley: Mr. Newton, I’d like to ask you a question this time.
Newton: Oh, what’s that?
Halley: According to Kepler’s law of motion, if the planets really move around the sun along the elliptic orbit, what’s the law they follow?
Newton: I calculated the inverse-square law ratio almost ten years ago, that is, the planets move around the sun along the elliptic orbit under the law of inverse-square ratio.
Halley: Really, wow! Great. Can you show me all the data of the calculation process?
Newton: OK, wait a moment. I’ll get it for you.
(Caption): At that time, Kepler’s law of planetary motion was only summary according to the observation records without knowing the principle. Newton could explain the reason through calculation formula. With the support of observation data, it was deduced that the motion of celestial bodies in the sky and objects on the earth could be explained by the same law, that is, the law of universal gravitation!
Act 3
(Caption): The book The Principia: Mathematical Principles of Natural Philosophy of Newton was published in 1686, in which a hypothesis was proposed that in addition to planets, there were also many comets had closed orbits, which meant that they would move around the sun regularly. Hoping to test this hypothesis, Halley had been collecting previous observation record since 1695. Analyzing by Newton’s law of motion, he found that the orbit of a comet in 1305, 1380, 1456, 1531 and 1607 were very similar to that of the 1682, which should be the same comet.
(Caption): In 1705.
Halley: If my hypothesis is correct, the comet should come back about every 76 years, so it should reappear in 1758. I want to announce this message. If it does reappear in 1758, future generations will remember that the credit for discovering the comet belongs to a Briton.
Act 4
Johann Georg Palitzsch: Wow! It’s really back. This is the comet mentioned by Mr. Halley before. Halley’s prediction is correct.
(Caption): On December 25, 1758, this comet was observed by Johann Georg Palitzsch, a farmer and amateur astronomer in Germany. Halley died in 1742 and failed to live to see the return of this comet. Later, this most legendary comet, named after Halley, an Englishman, is still in use today.
Script of the Second Film
Act 1
(Caption): Halley is friends with Hooke and Wren. One day, these three people got together to chat.
Wren: The attraction between the sun and the planets should be the endless motion of the planets around the sun.
Halley: Then what orbit do the planets revolve around the sun? If it is really like Kepler said, if the planets revolve around the sun in an elliptical orbit, then what law of gravitation does this follow?
Hooke: I know the answer. If there is no error in the calculation process, the orbit of the planet should be elliptical.
Halley: So what law of gravitation does it follow?
Hooke: Of course it is based on the principle of the inverse square ratio formula.
Halley: Can you borrow me to study your calculation data?
Hooke: I’ll find it and you will get it in two days.
Halley: Okay, thank you.
Act 2
(Caption): Halley went to Hooke’s residence, Hooke lent the calculation data of planetary orbits to Halley.
Halley: Wow, your information is so precious, let me study it for a while.
Hooke: OK.
Halley: I suggest that you can publish these materials into books, the name of the book is called “Science Principles of Nature”.
Hooke: Your suggestion is very good, but I am worried that my funds are not enough.
Halley: It’s okay, I’ll support you, That’s it.
Act 3
(Caption): Halley happily ran to Hooke after studying the books and materials of Hooke’s “Science Principles of Nature”.
Halley: Mr. Hooke, Mr. Hooke, I have calculated it. This comet should come back every 38 years, so after the calculation, it should be two years later that we can see its traces again.
Hooke: Great, we will come together to welcome its visit at that time.
Act 4
(Caption): On Christmas night two years later, Hooke and Halley were sitting in chairs outside the café.
Halley: Wow, it’s this one, the comet I speculated is back.
Hooke: It’s true, what a beautiful comet.
(Caption): Later, in commemoration of the comet that Halley and Hooke discovered together, the world named the comet Hooke Halley’s Comet.
Script of the Third Film
Act 1
(Caption): Halley and Wren are British astronomers, and they are also very good friends.
Wren: I have been observing astronomy for many years. According to my observations, the sun should be the center of the entire universe. I want to publish my observations into a book so that the general public can share my results. The title of my book will be called “Celestial movement theory”.
Halley: Does the comet also orbit the sun, do you think it is?
Wren: Of course it is.
Halley: What shape do you think the orbit of the comet orbiting the sun should be?
Wren: It should be circular. There is a detailed calculation method in my book “Celestial movement theory”. It operates in accordance with the formula of the law of gravitational velocity that I discovered.
Halley: Can you give me a copy after the book is published.
Wren: Of course no problem.
Act 2
(Caption): Three months later, Wren published a book “Celestial movement theory” on astronomy. On this day, Halley arrived at Wren’s residence and asked him for the book on “Celestial movement theory”. At this time, Wren was sitting outside the house to enjoy the cool.
Halley: Congratulations, Wren, your masterpiece has finally come out, you promised me to give me a copy.
Wren: No problem, I’ll get it to you.
Wren: On page 107 of the book, there is a formula for the law of gravitational velocity when a comet orbits the sun.
Halley: Great. Recently, I am very interested in a certain comet on the celestial body. Now I have enough information to do research.
Act 3
(Caption): Halley happily ran to find Wren after studying the book materials of Wren’s “Celestial movement theory” for a period of time.
Halley: Mr. Wren, Mr. Wren, I have calculated. This comet should come back every 60 years, so it should be 10 years from now.
Wren: That’s great, I hope we have the honor to see it.
(Caption): Halley passed away due to overwork and illness after three years of studying comets. Halley confessed to his wife Mary Stuart before his death.
Halley: Mary, thank you very much for taking care of me for so many years. The comet I studied may come back in seven years. You must help me pay attention to this matter.
Mary: Halley, don’t worry, I will help you pay attention.
Act 4
(Caption): Seven years later, one night in March, Mary sat in front of the house to enjoy the cool.
Mary: Wow, it’s a comet. It’s such a beautiful comet. According to the date, it is supposed to be the comet Halley was studying. It has returned again. Its cycle around the sun is really 60 years. I want to announce this message. Let the world know.
(Caption): In order to commemorate Halley’s research on comets, the world named this comet Mary Halley’s Comet.
Script of the Fourth Film
Act 1
(Caption): Halley and Flamsteed were both British astronomers and celebrities at that time. Halley paid a special visit to Flamsteed in order to find the comet data he was studying.
Flamsteed: I have been observing astronomy for many years. According to my observations, the sun should be the center of the entire universe. I want to publish my observations into a book so that future generations will always remember my contribution to astronomy. My book title will be called “Principle of Planetary Motion in the Universe”.
Halley: May I ask Mr. Flamsteed, is the comet also orbiting the sun?
Flamsteed: Of course it is.
Halley: What shape do you think the orbit of the comet orbiting the sun should be?
Flamsteed: It should be round. There is a detailed explanation in my book “Principle of Planetary Motion in the Universe”.
Halley: After your book is published, can you borrow a copy for me to study?
Flamsteed: Of course it can.
Act 2
(Caption): Two months later, Flamsteed published an astronomy book “Principle of Planetary Motion in the Universe”. On this day, Halley arrived at Flamsteed’s residence and wanted to borrow from him the book “Principle of Planetary Motion in the Universe”. At this time, Flamsteed just taking a walk outside the house.
Halley: Congratulations, Flamsteed, your masterpiece has finally come out. You said you would lend me a copy for me to study the comet.
Flamsteed: No problem, I’ll bring it to you now.
Flamsteed: On page 59 of the book, there is information about comets orbiting the sun.
Halley: Great, I can finally do my research.
Act 3
(Caption): Halley happily ran to Flamsteed after studying the book materials of “Principle of Planetary Motion in the Universe” written by Flamsteed for a period of time.
Halley: Mr. Flamsteed, Mr. Flamsteed, I have calculated that this comet should come back every three years, so we should be able to see it again in September after three years.
Flamsteed: Great, I want to include the comet you discovered in my next edition of “Principle of Planetary Motion in the Universe”
Halley: I will pay special attention to the coming of this comet in September in three years.
Flamsteed: Remember to tell me the observation data at that time.
Halley: OK
Act 4
(Caption): Three years later, one night in September, Halley sat in front of the house to enjoy the cool.
Halley: Wow, it’s a comet. It’s such a beautiful comet. It’s the comet I studied three years ago. It is inferred from the date that it really came back again. I want to inform Flamsteed of this information as soon as possible.
(Caption): In order to commemorate Halley’s research on comets, the world named this comet as Flamsteed Halley’s Comet.
References
- CTi News, Recording Taiwan. Available online: https://www.youtube.com/watch?v=M7FryY7DlRU (accessed on 13 October 2013).
- Flipped Education, Parenting, Dialogue between Teaching and Learning. Available online: https://flipedu.parenting.com.tw/article/139 (accessed on 12 January 2015).
- Pritchard, M.E.; Wilson, G.S. Using emotional and social factors to predict student success. J. Coll. Stud. Dev. 2003, 44, 18–28. [Google Scholar] [CrossRef]
- McLean, G.F.; Graham, E.D.; Jernigan, M.E. A software environment for teaching image processing. In Proceedings of the ICASSP-92: 1992 IEEE International Conference on Acoustics, Speech, and Signal Processing, San Francisco, CA, USA, 23 March 1992. [Google Scholar]
- Ageenko, E.; La Russa, G. A visualization toolkit for teaching, learning, and experimentation in image processing. In Proceedings of the 2005 IEEE Annual Conference on Frontiers in Education, F2H-21-F2H26, Indianopolis, IN, USA, 19–22 October 2005. [Google Scholar]
- Zhang, D.; Zhou, L.; Briggs, R.O.; Nunamaker, J.F., Jr. Instructional video in e-learning: Assessing the impact of interactive video on learning effectiveness. Inf. Manag. 2006, 43, 15–27. [Google Scholar] [CrossRef]
- Bruning, M.J. VIS: Technology for Multicultural Teacher Education. TechTrends 1992, 37, 13–14. [Google Scholar] [CrossRef]
- Hutchinson, J.A.; Cissna, K.N.; Hall, M.E.; Backlund, P.E.; Tolhuizen, J.H. Videotape self-confrontation as a technique to enhance interpersonal communication effectiveness. Commun. Educ. 1978, 27, 245–250. [Google Scholar] [CrossRef]
- Duhaney, D. Technology and the educational process: Transformin classroom activities. Int. J. Instr. Media. 2000, 27, 67–72. [Google Scholar]
- Tsutsui, M. Multimedia as a Means to Enhance Feedback. Comput. Assist. Lang. Learn. 2004, 17, 377–402. [Google Scholar] [CrossRef]
- Guay, F.; Ratelle, C.F.; Chanal, J. Optimal learning in optimal contexts: The role of self-determination in education. Can. Psychol. Can. 2008, 49, 233–240. [Google Scholar] [CrossRef] [Green Version]
- Pike, G.R.; Smart, J.C.; Ethington, C.A. The Mediating Effects of Student Engagement on the Relationships Between Academic Disciplines and Learning Outcomes: An Extension of Holland’s Theory. Res. High. Educ. 2011, 53, 550–575. [Google Scholar] [CrossRef]
- Alavi, M.; Wheeler, B.C.; Valacich, J.S. Using IT to reengineer business eduaction: An exploratory investigation of collaborative telelearning. MIS Q. 1995, 19, 293–312. [Google Scholar] [CrossRef]
- Shih, Y.C.; Huang, P.R.; Hsu, Y.C.; Chen, S.Y. A complete understanding of disorientation problems in Web-based learning. Turk. Online J. Educ. Technol. 2012, 11, 1–13. [Google Scholar]
- Knowles, M.S. The Modern Practice of Adult Education; Association Press: New York, NY, USA, 1970. [Google Scholar]
- Maki, R.H.; Maki, W.S.; Patterson, M.; Whittaker, P.D. Evaluation of a Web-based introductory psychology course: I. Learning and satisfaction in on-line versus lecture courses. Behav. Res. Methods Instrum. Comput. 2000, 32, 230–239. [Google Scholar] [CrossRef] [Green Version]
- Piccoli, G.; Ahmad, R.; Ives, B. Web-Based Virtual Learning Environments: A Research Framework and a Preliminary Assessment of Effectiveness in Basic IT Skills Training. MIS Q. 2001, 25, 401–426. [Google Scholar] [CrossRef] [Green Version]
- Hung, C.-Y.; Chang, T.-W.; Yu, P.-T.; Cheng, P.-J. The Problem Solving Skills and Learning Performance in Learning Multi-Touch Interactive Jigsaw Game Using Digital Scaffolds. In Proceedings of the 2012 IEEE Fourth International Conference On Digital Game And Intelligent Toy Enhanced Learning, Takamatsu, Japan, 27–30 March 2012; pp. 33–38. [Google Scholar] [CrossRef]
- Long, H.B. Contradictory Expectations? Achievement and Satisfaction in Adult Learning. J. Contin. High. Educ. 1985, 33, 10–12. [Google Scholar] [CrossRef]
- Allen, T. The Adult Learning Projects, 2nd ed.; The Ontario Institute for Studies in Education: Toronto, ON, Canada, 1982. [Google Scholar]
- Johnson, S.D.; Aragon, S.R.; Shaik, N. Comparative analysis of learning satisfaction and learning outcomes in online and face-to-face learning environments. J. Interact. Learn. Res. 2000, 11, 29–49. [Google Scholar]
- Kuo, F.O. Study on the Effects of Integrating Multimedia Presentation Model into Instruction. Ph.D. Dissertation, Department of Computer Science and Information Engineering, National Chung Cheng University, Minxiong, Taiwan, 2014. [Google Scholar]
- Shen, L.; Wang, M.; Shen, R. Affective e-Learning: Using “Emotional” Data to Improve Learning in Pervasive Learning Environment. J. Educ. Technol. Soc. 2009, 12, 176–189. [Google Scholar]
- Wegmuller, M.; von der Weid, J.P.; Oberson, P.; Gisin, N. High resolution fiber distributed measurements with coherent OFDR. Proc. ECOC’00 2000, paper 11.3.4. 109. [Google Scholar]
- Arguedas, M.; Daradoumis, T.; Xhafa, F. Analyzing the effects of emotion management on time and self-management in computer-based learning. Comput. Hum. Behav. 2016, 63, 517–529. [Google Scholar] [CrossRef] [Green Version]
- Elias, M.J.; Weissberg, R.P. Primary prevention: Educational approaches to enhance social and emotional learning. J. Sch. Heal. 2000, 70, 186–190. [Google Scholar] [CrossRef]
- Payton, J.W.; Wardlaw, D.M.; Graczyk, P.A.; Bloody, M.R.; Trompsett, C.J.; Weissberg, R.P. Social and Emotional Learning: A Framework for Promoting Mental Health and Reducing Risk Behaviour in Children and Youth. J. Sch. Health 2000, 70, 179–184. [Google Scholar] [CrossRef]
- Paivio, A. Imagery and Verbal Processes. Leonardo 1972, 5, 359–360. [Google Scholar] [CrossRef]
- Paivio, A. Mental Representations: A Dual Coding Approach; Oxford University Press: Oxford, UK, 1986. [Google Scholar]
- Richardson, A. “Verbalizer-visualizer: A cognitive style dimension”. J. Ment. Imag. 1977, 1, 109–126. [Google Scholar]
- Mayer, R.E. Multimedia Learning; Cambridge University Press: New York, NY, USA, 2001. [Google Scholar]
- Mayer, R.E. The promise of multimedia learning: Using the same instructional design methods across different media. Learn. Instr. 2003, 13, 125–139. [Google Scholar] [CrossRef]
- Mayer, R.E. The Cambridge Handbook of Multimedia Learning; Cambridge University Press: Cambridge, UK, 2005. [Google Scholar]
- Mayer, R.E. Comprehension of graphics in texts: An overview. Learn. Instr. 1993, 3, 239–245. [Google Scholar] [CrossRef]
- Mayer, R.E.; Sims, K. For whom is a picture worth a thousand words? Extensions of a dual-coding theory of multimedia learning. J. Educ. Psychol. 1994, 86, 389–401. [Google Scholar] [CrossRef]
- Sweller, J.; Chandler, P. Why some material is difficult to learn. Cogn. Instr. 1994, 12, 185–233. [Google Scholar] [CrossRef]
- Sweller, J.; Van Merrienboer, J.J.; Paas, F.G. Cognitive architecture and instructional design. Educ. Psychol. Rev. 1998, 10, 251–297. [Google Scholar] [CrossRef]
- Xie, Y.; DeVellis, R.F. Scale Development: Theory and Applications. Contemp. Sociol. A J. Rev. 1992, 21, 876. [Google Scholar] [CrossRef]
- Nunnally, J.C. Psychometric Theory; McGraw-Hill: New York, NY, USA, 1978. [Google Scholar]
Figure 1.
Student participating in this experiment watching “The Comet’s Story” puzzle film.

Figure 2.
Student participating in this experiment—filling out the questionnaire.

Figure 3.
Puzzle film, “The Comet’s Story”, combined with emotion detection system.

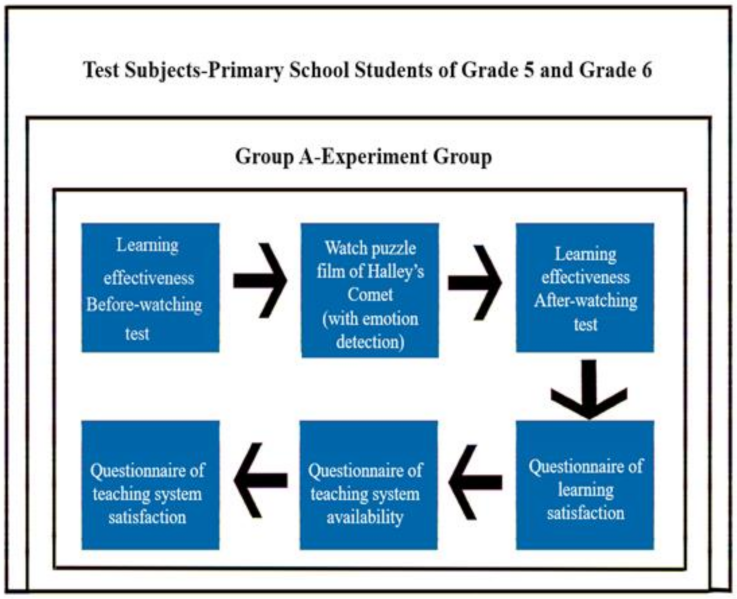
Figure 4.
Research framework—experimental group.

Figure 5.
Title insert 1: Go! Please work hard.

Figure 6.
Title insert 2: Go, there are three levels ahead.

Figure 7.
Title insert 3: Go, only two levels left.

Figure 8.
Title insert 4: Go, it is almost finished.

Figure 9.
Title insert 5: Now in a happy mood. Go! Let us finish it!

Figure 10.
Research framework—control group.


Table 1.
Gender, grade, and age distribution of the two groups.
| Group | Group with Emotion Recognition | Group without Emotion Recognition | Total | |||||||||
|---|---|---|---|---|---|---|---|---|---|---|---|---|
| Gender | Female | Male | Female | Male | Female | Male | ||||||
| No. | 35 | 28 | 29 | 33 | 64 | 61 | ||||||
| % | 55.6 | 44.4 | 46.8 | 53.2 | 51.2 | 48.8 | ||||||
| grade | Grade 5 | Grade 6 | Grade 5 | Grade 6 | Grade 5 | Grade 6 | ||||||
| No. | 28 | 35 | 23 | 39 | 51 | 74 | ||||||
| % | 44.4 | 55.6 | 37.1 | 62.9 | 40.8 | 59.2 | ||||||
| Age | 10 | 11 | 12 | 13 | 10 | 11 | 12 | 13 | 10 | 11 | 12 | 13 |
| No. | 10 | 28 | 22 | 3 | 7 | 23 | 27 | 5 | 17 | 51 | 49 | 8 |
| % | 15.9 | 44.4 | 34.9 | 4.8 | 11.3 | 37.1 | 43.5 | 8.1 | 13.6 | 40.8 | 39.2 | 6.4 |
| Total | 63 | 62 | 125 | |||||||||
Table 2.
Comparative analysis table of the two groups on questions of learning satisfaction.
| Content of Learning Satisfaction | With Emotion Recognition | Without Emotion Recognition | p-Value |
|---|---|---|---|
| 1. This learning mode can improve my learning interest. | 4.22 | 3.87 | 0.022 * |
| 2. This learning mode can improve my learning concentration. | 4.06 | 3.76 | 0.054 |
| 3. Learning by this mode is relatively easy and there is no pressure. | 4.21 | 3.60 | 0.000 * |
| 4. This learning mode is completely acceptable. | 4.22 | 3.76 | 0.003 * |
| 5. Through this learning mode I can learn the scientific knowledge content of “Story of the Comet”. | 4.32 | 3.87 | 0.004 * |
| 6. I am satisfied with the interesting content of “Story of the Comet”. | 4.03 | 3.56 | 0.004 * |
| 7. I think the content of “Story of the Comet” is easy to understand. | 3.68 | 3.26 | 0.008 * |
| 8. I feel satisfied with the whole explanation of the content of “Story of the Comet”. | 4.17 | 3.66 | 0.001 * |
| 9. I feel satisfied with the learning process of “Story of the Comet”. | 4.25 | 3.90 | 0.022 * |
(* indicates a p-value < 0.05).
Table 3.
Comparative analysis table of the two groups on questions of teaching system availability.
| Applicable Content of the Teaching System | With Emotion Recognition | Without Emotion Recognition | p-Value |
|---|---|---|---|
| 1. I think I would like to use this teaching system often. | 3.83 | 3.81 | 0.914 |
| 2. I think this teaching system is too complicated. | 2.78 | 2.73 | 0.794 |
| 3. I think this teaching system is easy to use. | 3.84 | 3.84 | 0.988 |
| 4. I think I need the help of a technician to use this teaching system. | 3.00 | 2.98 | 0.937 |
| 5. I think the functions of the teaching system are integrated very well. | 4.11 | 4.16 | 0.750 |
| 6. I think there are too many inconsistencies in the teaching system. | 2.33 | 2.37 | 0.795 |
| 7. I can imagine that most people can learn to use this teaching system very quickly. | 3.94 | 3.94 | 0.995 |
| 8. I think it is very inconvenient to use this teaching system. | 2.54 | 2.08 | 0.005 |
| 9. I am confident that I can use this teaching system. | 3.67 | 3.61 | 0.778 |
Table 4.
Comparative analysis table of the two groups on questions of teaching system satisfaction.
| Content of Teaching System Satisfaction | With Emotion Recognition | Without Emotion Recognition | p-Value |
|---|---|---|---|
| 1. The activity design of this teaching system makes me learn the content of “Story of the Comet” more easily (easy to learn). | 4.17 | 3.56 | 0.000 * |
| 2. The activity design of this teaching system improves my learning efficiency (effectiveness). | 4.27 | 3.44 | 0.000 * |
| 3. The activity design of this teaching system makes me remember the content of “Story of the Comet” more easily (easy to remember). | 4.08 | 3.15 | 0.000 * |
| 4. The activity design of this teaching system makes me understand the content of “Story of the Comet” more correctly (correctness). | 4.37 | 3.32 | 0.000 * |
| 5. The activity design of this teaching system makes me feel useful (usefulness). | 4.21 | 3.50 | 0.000 * |
| 6. The activity design of this teaching system makes me feel satisfied (subjective satisfaction). | 4.49 | 3.81 | 0.000 * |
(* indicates a p-value < 0.05).
Publisher’s Note: MDPI stays neutral with regard to jurisdictional claims in published maps and institutional affiliations. |
© 2021 by the authors. Licensee MDPI, Basel, Switzerland. This article is an open access article distributed under the terms and conditions of the Creative Commons Attribution (CC BY) license (https://creativecommons.org/licenses/by/4.0/).
Share and Cite
MDPI and ACS Style
Tsai, S.-C.; Lin, H.-C.K. Effect of Adding Emotion Recognition to Film Teaching—Impact of Emotion Feedback on Learning through Puzzle Films. Sustainability 2021, 13, 11107. https://0-doi-org.brum.beds.ac.uk/10.3390/su131911107
AMA Style
Tsai S-C, Lin H-CK. Effect of Adding Emotion Recognition to Film Teaching—Impact of Emotion Feedback on Learning through Puzzle Films. Sustainability. 2021; 13(19):11107. https://0-doi-org.brum.beds.ac.uk/10.3390/su131911107
Chicago/Turabian StyleTsai, Shang-Chin, and Hao-Chiang Koong Lin. 2021. "Effect of Adding Emotion Recognition to Film Teaching—Impact of Emotion Feedback on Learning through Puzzle Films" Sustainability 13, no. 19: 11107. https://0-doi-org.brum.beds.ac.uk/10.3390/su131911107
Note that from the first issue of 2016, this journal uses article numbers instead of page numbers. See further details here.