
The Effects of On- and Before- Journey Advantages Using Ride-Sourcing in Indonesia
by
 , ,
, ,
Muhamad Rizki
1,* ,
,
Tri Basuki Joewono
2,
Dimas Bayu Endrayana Dharmowijoyo
3 and
Dwi Prasetyanto
1 1
Department of Civil Engineering, Institut Teknologi Nasional Bandung, Bandung 40124, Indonesia
2
Department of Civil Engineering, Parahyangan Catholic University, Bandung 40141, Indonesia
3
Department of Civil and Environmental Engineering, University of Technology PETRONAS, Seri Iskandar 32610, Malaysia
*
Author to whom correspondence should be addressed.
Sustainability 2021, 13(19), 11117; https://0-doi-org.brum.beds.ac.uk/10.3390/su131911117
Submission received: 24 August 2021
/
Revised: 30 September 2021
/
Accepted: 3 October 2021
/
Published: 8 October 2021
(This article belongs to the Topic Sustainable Transport Systems and New Mobility Services: Challenges and Solutions)
Abstract
:This paper explores the effects of on-journey (i.e., waiting and travel time reliability, driver quality), before-journey (i.e., service coverage, application quality, fare, etc.), and multi-tasking advantages when using ride-sourcing, the perceived usefulness of ride-sourcing and, in turn, the frequency of usage. Assuming a structural form without any reciprocal effects, the modified Structural Equation Model is used. This study collected data from 497 ride-sourcing users in Bandung city in 2018. As expected, ride-sourcing users who appreciate the usefulness of ride-sourcing services correlate with a higher frequency of use. This study found that situational variables or variables related to travel and built environment conditions (e.g., on-journey advantages, built environment, and travel characteristics) play a role in keeping travellers using the services. This study confirms that multi-tasking is not a reason for ride-sourcing users to use the services more often. Moreover, those who previously used motorcycles and car-based ride-sourcing (CBRS) are more loyal travellers than car, public transport users, and motorcycle-based-ride-sourcing (MBRS) users, respectively.
1. Introduction
The rise of mobility-on-demand platforms is one of the most important innovations of recent decades. Ride-sourcing, transportation network companies, and on-demand rides [1] are among the precursors of a sharing economy [2]. While there are various terms for mobility-on-demand platforms, this study defines ride-sourcing as application-based services provided commercially by companies [1]. These services match travellers who want to take a specific trip, through a mobile application, with a driver who is willing to satisfy that demand in real-time [3,4,5]. The magnitude of the growth in ride-sourcing in various countries around the world has been extraordinary [2]. Due to its position as one of the countries with the highest smartphone ownership rates in the world and continuous developments in terms of Information and Communication Technology (ICT) infrastructure [6], the increase in ride-sourcing users can be observed in Indonesia. Go-Jek, founded in 2010, was the first ride-sourcing service in Indonesia and is currently present in 50 cities there. It facilitated 5 billion kilometres of travel in 2019 [7,8]. The poor networks and poor quality of public transport systems in developing countries [2] mean that ride-sourcing services have a role in supporting the public transport system, particularly in Indonesia [9,10]. In Indonesia, there are two types of ride-sourcing services, namely motorcycle- (MBRS) and car-based ride-sourcing (CBRS). The users of these two types of ride-sourcing modes might have differences in perceiving the usefulness of the services and different usage behaviours. There is an indication that MBRS is used more often by low-income persons, which may make their use of the services less frequent than CBRS users [9]. With this strong growth and strong implications for providing better mobility, the investigation of ride-sourcing services in developing countries is worthy of being conducted.
Studies [11,12] have identified the various benefits of ride-sourcing over public and private transport, such as having the flexibility of private modes of transport without the additional effort of finding parking lots and paying parking charges, or in the case of public transport, having less egress, ingress and waiting time [13,14,15]. Ride-sourcing studies have focused on mode choice or whether users choose ride-sourcing as a substitute for public or private modes of transport or as a complement to public or private transportation. Ride-sourcing has been found to be used as a substitute for the feeder systems of public transport (e.g., Light Rail Transit/LRT and bus system), but it increases the use of primary systems of public transport [16]. Other studies argued that ride-sourcing complements secondary and/or feeder systems in developed [17,18] and developing countries [9,10]. The growing number of ride-sourcing users causes researchers to study factors related to the frequency of using the services [11,12,19]. Socio-demographic variables (e.g., income, age, employment, education, and race), land use, the built environment, the use of the internet or social media, and instrumental variables (e.g., frequency of long-distance trips) were used as predictors of ride-sourcing usage, whilst non-instrumental factors have also been proposed to correlate with mode choice [20,21,22,23,24]. Alemi et al. [11] have included attitudes in the frequency of the use of ride-sourcing. On the other hand, Dawes et al. [25] and Irawan et al. [9] used the benefits of using ride-sourcing (e.g., the perceived ease of use of the applications, perceived shorter travel time, no ingress and egress, comfort, safety, and environmental benefits) on ride-sourcing usage.
Among the non-instrumental factors, some studies have shown the effects of travel experiences on the mode choice [26,27], but, to the best of the authors’ knowledge, travel experiences have rarely been used as a predictor in ride-sourcing studies. Similar to public transport, travelling with ride-sourcing includes on-journey (e.g., travel and waiting time) and before-journey (e.g., reliability of the applications and the service coverage area) components, whereas before-journey components are not found when taking private vehicles. The high penetration of ride-sourcing might be due to the reliability of before-journey components, for example, calling the service just using a smartphone, compared to the greater effort involved in taking conventional taxis and public transport. Informal community drivers who share their vehicles with passengers via mobile applications may increase the coverage of the services compared to conventional taxis and public transport. It is hypothesised that the before-journey advantages are the reason why this mode is perceived to be useful and why travellers use this mode more often. Circella and Alemi [28], Rayle et al. [1], Tang et al. [29], and Tirachini et al. [2] have suggested some on-journey and before-journey advantages of using ride-sourcing, but without detailed classifications of whether these are before- or after-journey advantages and without advanced statistical tests. This study tries to adjust the various on-journey and before-journey advantages of using ride-sourcing to be more relevant in the Indonesian context, as modified from Tirachini et al. [2], and thus to apply it by using multivariate analysis.
Using data collected from ride-sourcing users in Bandung City in 2018, Exploratory Factor Analysis (EFA) is used to explore the typology of various positive and negative experiences using ride-sourcing, and these will be used as predictors of the perceived usefulness of ride-sourcing. Assuming that it has a structural form, the study assumes that the effects of the perceived usefulness of ride-sourcing correlate with ride-sourcing usage. The typology of various positive and negative travel experiences is expected to differentiate which components are part of on-journey and before-journey benefits and drawbacks. This may help in understanding which components correlate with the usefulness of the service and its usage. This study will also use socio-demographic and travel characteristics, the built environment, and multiple types of multi-tasking activities in interaction with various positive and negative travel experiences on those two dependent variables. The inclusion of socio-demographic, travel characteristics, and built environment variables will help suggest the persons that should be targeted for using the modes more frequently. In Indonesia, pool ride-sourcing is available for CBRS, but the service is not popular. Therefore, this study will focus on the non-pooled services of CBRS and MBRS. Due to a number of sampling problems with CBRS users, this study does not separate the perceived usefulness and ride-sourcing usage into CBRS and MBRS models. This study only uses a dummy variable for indicating whether the respondents are MBRS or CBRS users. The dummy variable can indicate whether MBRS and CBRS users have different perceptions of usefulness and ride-sourcing usage. The modified Structured Equation Model (modified SEM; [20,30]) is used for its flexibility in examining different responses of endogenous variables in the recursive structure with less computational time, but it ignores the reciprocal effects as a limitation of the model. In this study, perceived usefulness is treated as a continuous variable, whereas the frequency of using ride-sourcing is treated as an ordinal response.
The remainder of the paper is structured as follows. The following section presents the literature review, while the data collection and the respondents’ characteristics are described in the data explanation section. Section 4 explains the model structure. The model estimation is presented in Section 5, followed by the discussion and conclusion sections.
2. Literature Review
2.1. The Effects of Multi-Tasking and Travel Advantages of Using Ride-Sourcing
Participation in activities, including travelling with a particular mode of transport, is a subject of interaction between instrumental factors (such as travel parameters and built environment conditions), socio-demographic and non-instrumental factors (such as attitude, planned or reasoned behaviour, past behaviour, and cognitive and affective experiences of the activities) [20,21,23,31]. Travel experience is one of the non-instrumental factors that can correlate with mode choice or mode usage.
Some studies have indicated a correlation between positive travel experiences or satisfaction with using a particular mode and the likelihood of choosing that mode [9,26,27,32]. When the positive experiences or satisfaction with previous trips using a particular mode are high, people tend to take the same mode on their next trips [33,34]. It can be assumed that the positive outcome of the travel can be represented by how useful the service is (perceived usefulness of the service). The perceived usefulness can be defined as a proxy for satisfaction with the service. Thus, the study can be extended to how the perceived usefulness correlates with the frequency of using the service.
Some studies have argued that the determinants of travel experiences or the perceived usefulness of using a mode can be defined by socio-demographic characteristics [35], the service quality of the trip (such as travel time and waiting time) [33,36], activities performed during travel [37,38,39,40], trip companionship [40,41,42], and mode-choice [26,43,44]. Moreover, travel experiences are also found to be associated with residential locations (i.e., urban and suburban) [27] and residential self-selection [35]. Finally, various research has found that travel satisfaction is correlated with attitudes and affirmative perceptions towards a certain transport mode [44,45]. Rasouli and Timmermans [40] and Shaw et al. [46] suggested that more productive time due to multi-tasking during a trip and more productive time in the whole day can be suggested as determinants of travel experiences.
Some researchers have tried to break down the travel advantages of using ride-sourcing as the determinants of the usefulness of the services. Irawan et al. [9] used the shorter waiting time and less ingress and egress time in the usefulness of ride-sourcing. The journey benefit (i.e., safety, reliability, convenience) was also among the significant variables that shaped ride-sourcing use in Toronto [47]. Etminani-Ghasrodashti and Hamidi [24] extend the travel advantages with cost-effectiveness and trip security when using ride-sourcing. Tirachini [2] compiled various studies that suggested some variables that are among the journey benefits (e.g., trip cost, reliability, no need to drive, having no car, and low reliability of taxi and public transport), and some that are beyond-journey benefits such as ease of payment, ease of requesting the service, weather, attractive fare discounts, security, and fare transparency. Since ride-sourcing services depend on the reliability of applications and the coverage, the ease of payment, and cost transparency (before the journey is taken) [48], this study indicates that there are two different advantages, namely, on-journey and before-journey advantages.
Some travel advantage variables suggested in previous studies are relevant in the Indonesian context, but some are not. For the Indonesian context, before-journey benefits can be expanded to having broad coverage areas, 24-h services, ease of getting services, user-friendly applications, fare attractions/incentives, cashless payment, etc. Some beyond-journey benefits, such as 24-h services, might not be relevant in developed countries due to security reasons, but they are relevant in developing countries or in the case of Indonesia. Some travel disbenefits such as unskilful and careless drivers, bad driver behaviour, disputes with drivers due to fares or the routes taken, taking different routes from the suggested routes of the applications, unexpected routes from the services, and extraordinary events, such as experiencing accidents and criminality, tend to be found daily by ride-sourcing users in developing countries or Indonesia. These factors were also found to shape the ride-sourcing use behaviour in previous studies [49,50]. Therefore, we tried to explore those variables further in this study. This study also includes some travel benefits from other studies, such as perceiving more productive time due to multi-tasking or perceiving more productive time due to the possibility of performing more activities outside the travel session, as reported by Shaw et al. [46] in their multi-tasking study.
In addition, multi-tasking has been used to explain people’s travel experiences or perceived usefulness using private or public transport in developed [37,39,46,51] and developing countries [29,52,53,54,55]. However, the authors found that multi-tasking was rarely a predictor of the experiences of using ride-sourcing and the usage of ride-sourcing. As with public transport, ride-sourcing users do not need to drive; thus, multi-tasking might be the reason why people feel the mode is useful and increase their usage.
2.2. The Ride Sourcing Studies in Indonesia
In Indonesia, the sparks of ride-sourcing were started in 2010, and since then, the number of users of these services has become substantial [9]. Currently, ride-sourcing serves more than 50 cities in Indonesia. With its popularity and its effect on the existing transport ecosystem, many researchers from various backgrounds are investigating the effect of ride-sourcing in Indonesia [9,10,56,57,58,59].
Even though many people from low-income households and uneducated people were involved in the study in JMA [9], those with a middle-high income and those who are well-educated use ride-sourcing services more often, as shown in studies in the United States (US) [11,28,31,60]. In both Indonesia and the US, ride-hailing is mostly used by younger people [28,57], especially those with experience of the internet and information and communication technology (ICT) [60]. Indonesian users, especially in Jakarta, tend to use them for short-to-medium distance or duration trips [59], similar to studies in Beirut, Lebanon [61], or China [29]. The services are also used for only a few of their daily trips, including accessing public transport stations/shelters [10,57]. With the combination of the characteristics and benefits of private and public transport, ride-sourcing was found to increase the kilometres travelled in Indonesia [10], similar to a study in Chile [19].
Some studies in Indonesia showed the various effects of ride-sourcing on public transport demand, similar to the studies in developed countries [16,17,18]. While in metropolitan Jakarta, ride-sourcing (especially MBRS) tends to complement the mass transport system [10,57,62], in smaller cities such as Yogyakarta [57] and Bandung [63], it is a substitute for public transport, resulting in a decline of users.
The various results from ride-sourcing research underline the different characteristics between developing and developed countries. Developing countries, particularly Indonesia, are different from developed countries in many facets of their social, economic, infrastructure, and land use conditions [54,64]. The effects of ride-sourcing on increasing mobility differ between developing countries and developed countries because the former usually have poor-quality public transport and/or apply paratransit services as their main public transport system [2]. Moreover, the competition of ride-sourcing services with public transport in Indonesia has raised the issue of safety and security [57,59], transport actor frictions [10], and the sustainability of conventional, urban public transport, such as paratransit and bus services [65].
With the competitiveness issue and quality of public transport services, as well as safety, security, and environmental issues, there is concern about how to manage the demand and improve the quality of ride-sourcing services. Therefore, considering the potential advantages of this mode to complement public transport and as the main public transport system, understanding which components, either on-journey or before-journey, have more significant effects can enhance the perceived usefulness and travel usages. Journey components can also include the effects of journey disbenefits such as accidents and security during travelling, as has been revealed by Irawan et al. [57]. Moreover, specific characteristics of the socio-demographic and built environment conditions in developing countries that differ from developed countries might provide insight into which respondents can be targeted, which areas should be served more, and what incentives or strategies could be proposed to make the targeted users more loyal, to expand their numbers, and to broaden the coverage. More importantly, Indonesia has initiated a strong development of urban public transport services (i.e., mass rail transport, light rail train, and bus rapid transit) for the coming decades [66]. Therefore, it is important to manage ride-sourcing services as a part of an integrated public transport system.
3. The Data Used
3.1. Data Collection Process
This study distributed questionnaires to travellers who use motorcycle or car ride-sourcing services in Bandung City, Indonesia. Data from the Transport Department of Yogyakarta Province in 2020 revealed that ride-sourcing contributed around 4% of the modal share of road transportation in Yogyakarta Metropolitan Area (YMA), whereas 74.1% and 17.9% are private motorcycles and private cars. It is assumed that the number of ride-sourcing users in Bandung city is similar to YMA. Since there is no information regarding the current users of ride-sourcing, the sample size of 400 was determined from Yamane’s equation [67], given that the population of Bandung was 2,497,938 [68] and assuming a 5% significance level. The sample size was upgraded to 500 to overcome the possibility of errors during the survey. The authors assume that the number of respondents is beyond the required number when considering all of the ride-sourcing users in the entire city of Bandung. The questionnaires were constructed based on the literature regarding ride-sourcing [1,9], travel behaviour [19], travel experiences [34,69], and the built environment [12,70].
The questionnaire was divided into three parts. The first part contained questions about the respondents’ socio-demographic characteristics. The second part was related to the characteristics of their trips using ride-sourcing, such as travel time, cost, length, frequency, and the activities conducted during travel. In this part, the respondents were also asked to identify their on-journey and before-journey benefits and travel disbenefits using a 5-point Likert scale, where 1 represented “strongly disagree”, and 5 represented “strongly agree”. In this part, respondents were also questioned on the overall perceived usefulness of ride-sourcing services using a five-point Likert scale, where 1 represented “not useful”, and 5 represented “very useful”. The last part of the questionnaire covered questions about the built environments of respondents’ residential locations, including perceptions of accessibility, safety and security, social interactions, and design of the residential area; these questions were answered using a five-point Likert scale ranging from 1 “strongly disagree” to 5 “strongly agree”.
The questionnaire form was distributed from 24 April to 14 May 2018 after a series of reviews and revisions from a pilot survey. The questionnaire was distributed in six administrative areas in Bandung City. The method used to distribute the questionnaire was simple random sampling, using face-to-face interviews in various locations (offices, malls, schools, etc.). Before asking the questions, the surveyor asked, as a filtering question, whether the respondent was a ride-sourcing user or not. Only ride-sourcing users answered the remainder of the questions. Moreover, the respondents were informed that they would get a shopping voucher as a gift after completing the questionnaire and that the survey would take an average of 15 min of their time. The respondents who agreed to participate were guided to finish the questionnaire. After reviewing the data set that was collected, 497 out of the 500 respondents completed the questionnaires for further analysis. Furthermore, Section 3.2 and Section 3.3 will explain the variables that were used in the analysis.
3.2. Socio-Demographic, Travel, and Multi-Tasking Characteristics
Table 1 describes the respondents’ personal and travel characteristics. It seems that the samples were heavily weighted towards the investigation of people with high spatial constraints, such as students (36.1%) and workers (59.3%), and there were more males (61.2%) and people aged from around 18 to 40 years old (88.5%). The income distribution was dominated by respondents with a salary range of IDR 3 to 6 million/month (equal to USD 214–428/month) or people from a middle-income household, as reported by the Jabodetabek Urban Transport Policy Integration Study [64,71]. Most of the respondents work 6–8 h a day. In terms of travel characteristics, most ride-sourcing users waited less than 10 min for the vehicle to come (73.1%), and they had used the application for 3 months to 1 year (51.9%). Moreover, 60.8% of the respondents were frequent users who had used ride-sourcing more than 4 times, whereas 39.8% had used the services fewer than 4 times. Most respondents were MBRS users (406 respondents), whereas only 91 respondents were CBRS users. Table 1 also shows that the majority of respondents were motorcyclists before ride-sourcing became established. Interestingly, there were several respondents who used public transport before ride-sourcing became established, meaning that it is possible that ride-sourcing is used not only as a substitute for trips made by private car but also for trips made by public transport.
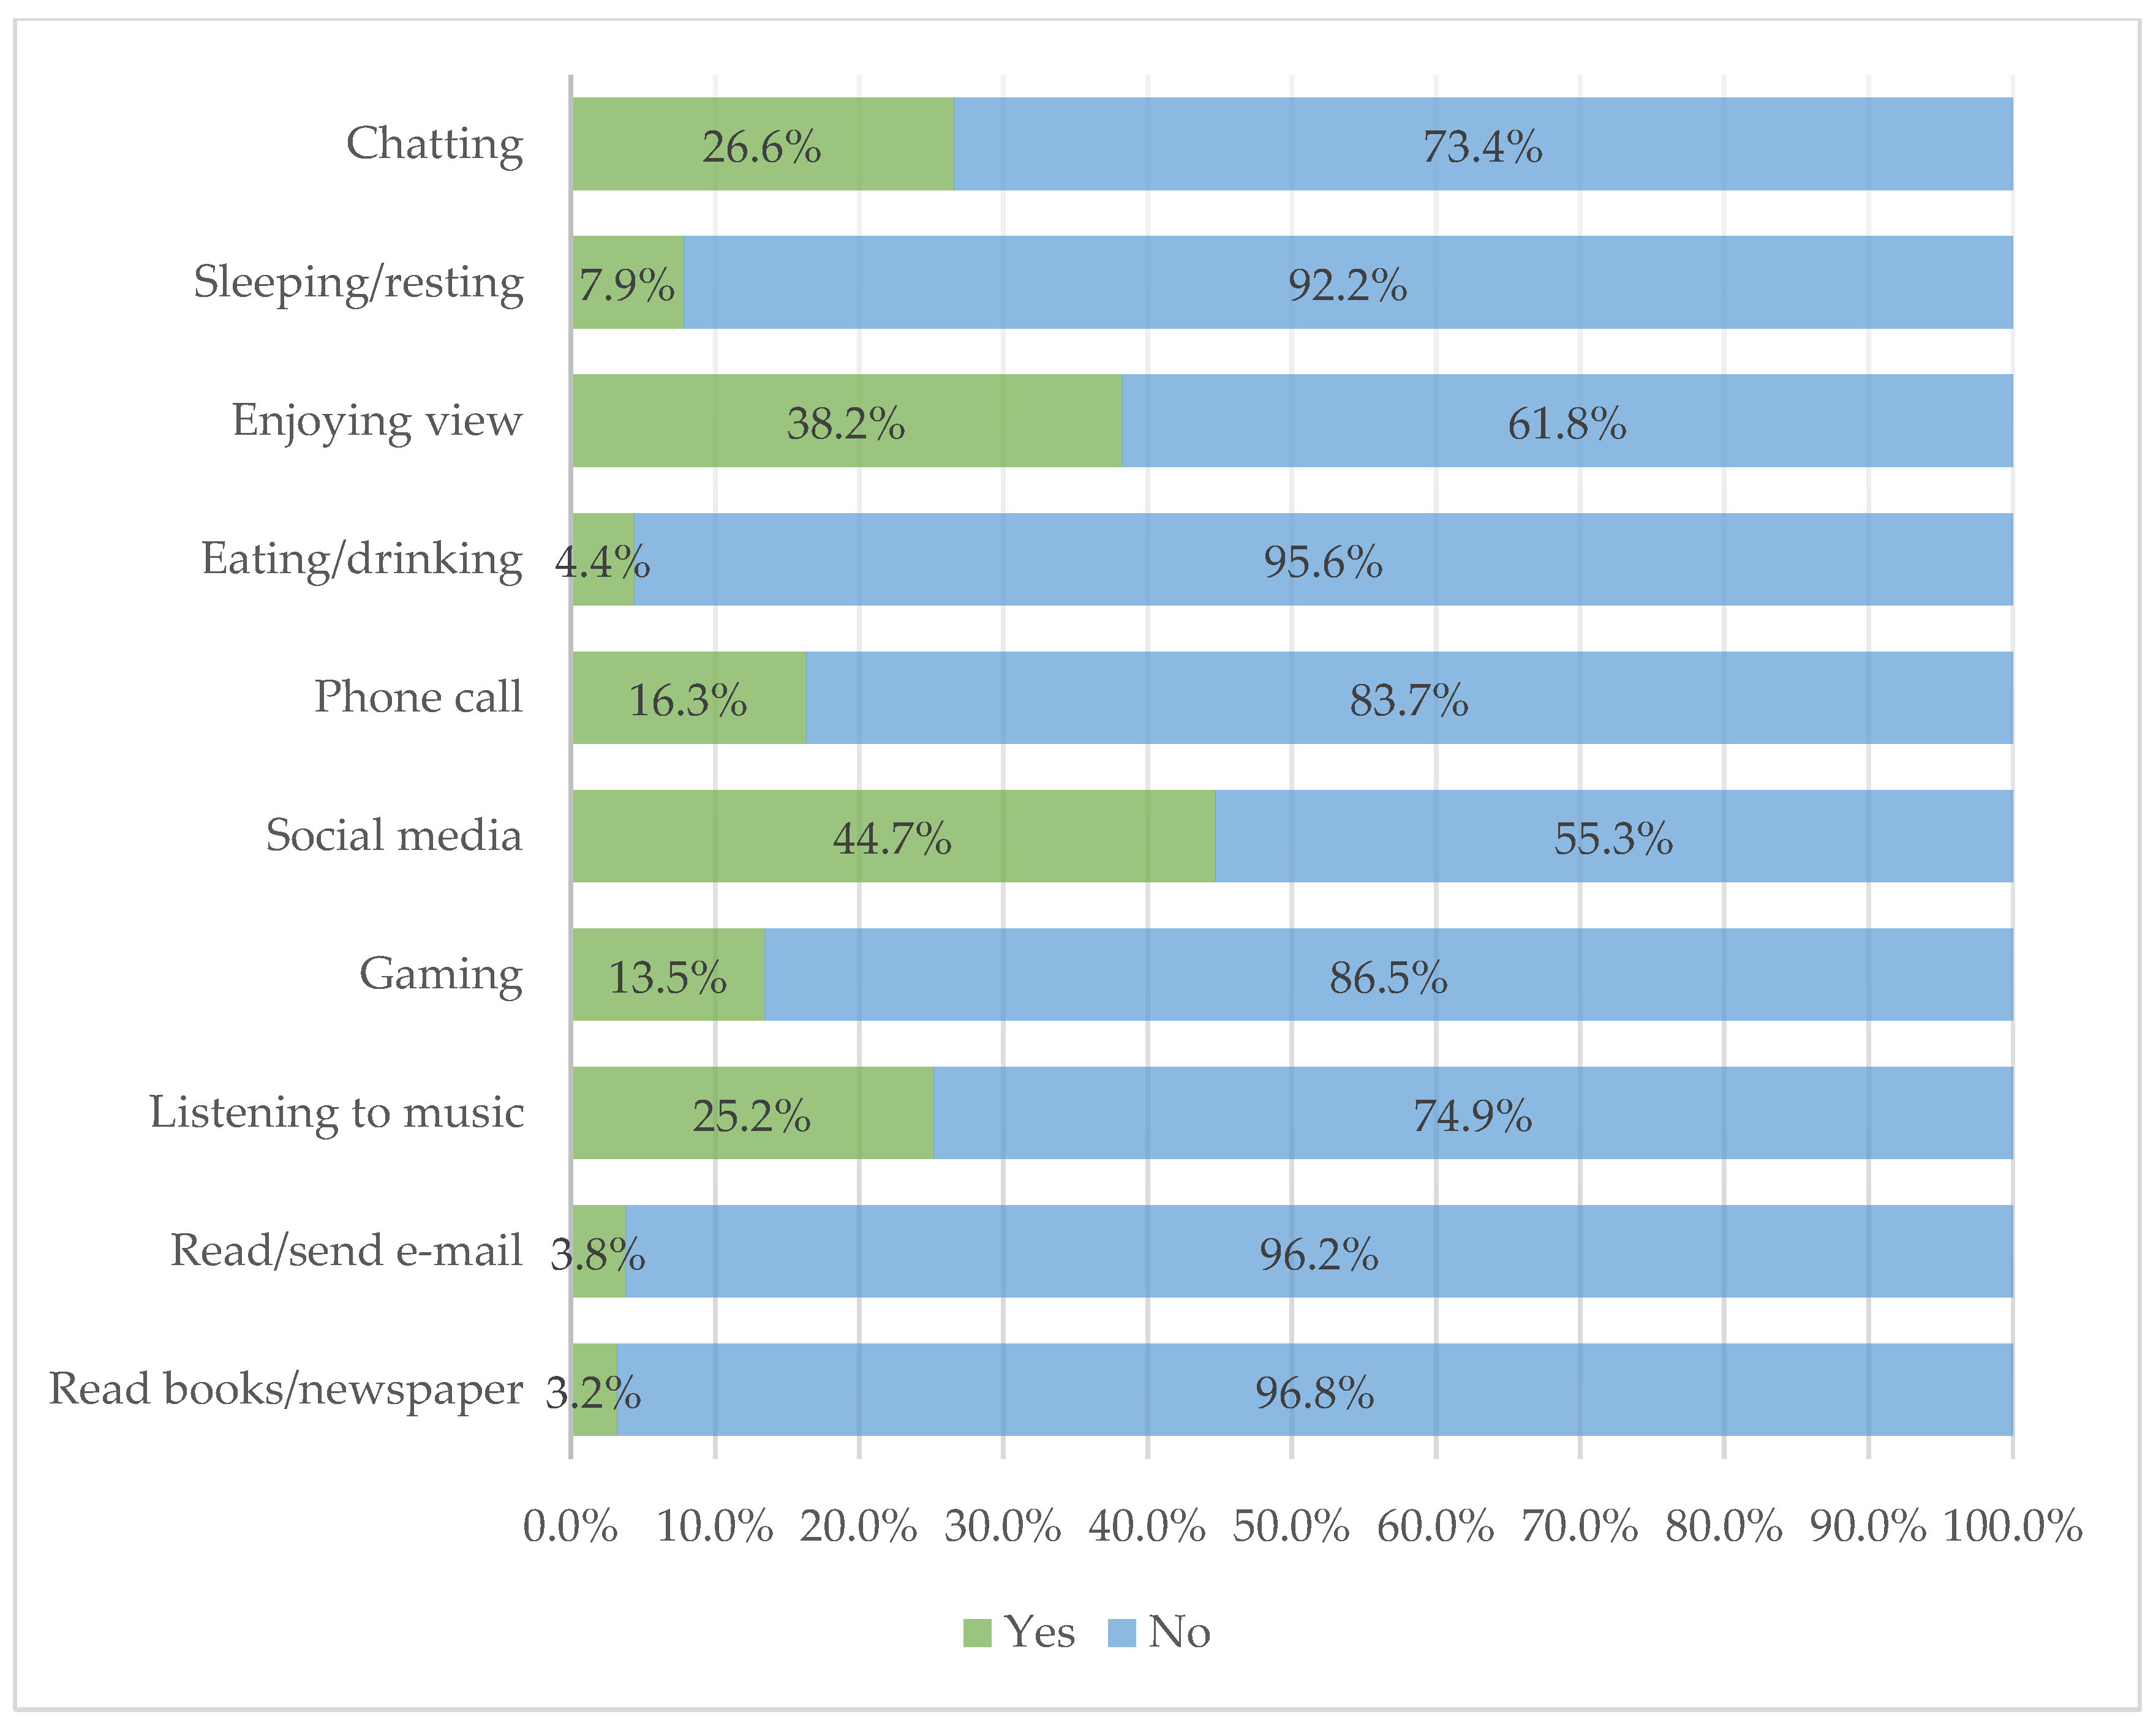
The types of activities performed during trips are summarised in Figure 1. Most respondents were using social media (44.7%), enjoying the scenery (38.2%), listening to music (25.2%), and chatting with the drivers (MBRS and CBRS) (26.6%). Only a few respondents were gaming (13.48%), eating/drinking (4.4%), reading/sending emails (3.8%), and reading books/newspapers (3.2%) while travelling. MBRS users were likely to perform all these activities during travelling, even though some activities such as eating/drinking, reading/sending emails and reading books/newspapers are undoubtedly difficult for MBRS users to perform.
Most CBRS and MBRS users in this study were middle-high income (income > IDR 3 million) with 81.32% and 80.32%, respectively. Around 18.68% and 26.37% of CBRS and 19.70% and 31.77% of MBRS users were low- (less than IDR 3 million) and middle-income (between IDR 3 and 6 million), respectively. This study confirms that CBRS has more users from the high-income group, whereas MBRS has more users from middle-low-income groups than MBRS, as also found by Wicaksono et al. [72] using the 2019 Malang Greater Area (MGA) dataset. Around 22.41% are frequent users of CBRS or use the services more than 7 times/month, whereas only 20.88% use MBRS more frequently. Therefore, CBRS users might be using ride-sourcing more frequently. Unlike the study in the Jakarta Metropolitan Areas (JMA, [9]), this study only covered 9% of frequent travellers using ride-sourcing due to the high involvement of low-income users (Table 1). Therefore, the current study tends to cover better the frequent users of ride-sourcing than Irawan et al. [9].
3.3. Positive and Negative Experiences Using Ride-Sourcing and Built Environment Conditions
Table 2 shows the descriptive analysis of multiple questions about negative and positive experiences when using ride-sourcing and its overall perceived usefulness. From the descriptions, on average, respondents agreed with the positive experiences (above 3 scale points, as a neutral scale) and disagreed with the negative experiences (below 3). The overall perceived usefulness is also 4.449. Since more frequent ride-sourcing travellers were included in the survey (60.8% use ride-sourcing more than 4 times/week and 29.6% more than 7 times/week), it is plausible that these users tend to have positive experiences with ride-sourcing.
Exploratory Factor Analysis (EFA) was performed to define the typology of the multiple positive and negative experiences using ride-sourcing and the typology of built environment conditions. Orthogonal varimax rotation was applied to provide adequate information about the variables under examination and simplify the factor structure. Variables with factor loadings of less than 0.5 were removed as a value for practical significance, as suggested by Hair et al. [73]. The value from the Kaiser–Meyer–Olkin sampling adequacy test is higher than 0.8, as shown in Table 3 and Table 4, which indicates that the sum of the partial correlations is small relative to the sum of the population.
As expected, Table 3 shows that the 26 positive and negative experiences observed are classified into 5 components of cognitive positive experiences (or cognitive advantages) and 2 components of cognitive negative experiences (cognitive disadvantages). It is confirmed by the EFA procedure that respondents classified the advantages into on-journey and before-journey. There are three components related to on-journey advantages that confirm public transport and ride-sourcing literature, namely, reliable travel time, more productive time, and reliable vehicles and drivers. Two other components are before-journey advantages: reliable coverage and reliable applications and costs. In terms of disbenefits, EFA is classified into two types of components, namely, travel disadvantages and extraordinary events during the services, such as accidents and criminality.
In terms of the built environment, 18 attributes were collected from the survey and were measured on a 5-point Likert scale (from strongly disagree 1 to strongly agree 5). Using the EFA, Table 4 shows the main findings, with the variables reduced to four factors: residing in well-developed or richer neighbourhoods, closer to public transport and pedestrian networks, closer to various public amenities, and high population density neighbourhoods with high social interactions. The four factors represent the built environment conditions of the respondents’ home locations.
4. Proposed Model Structure
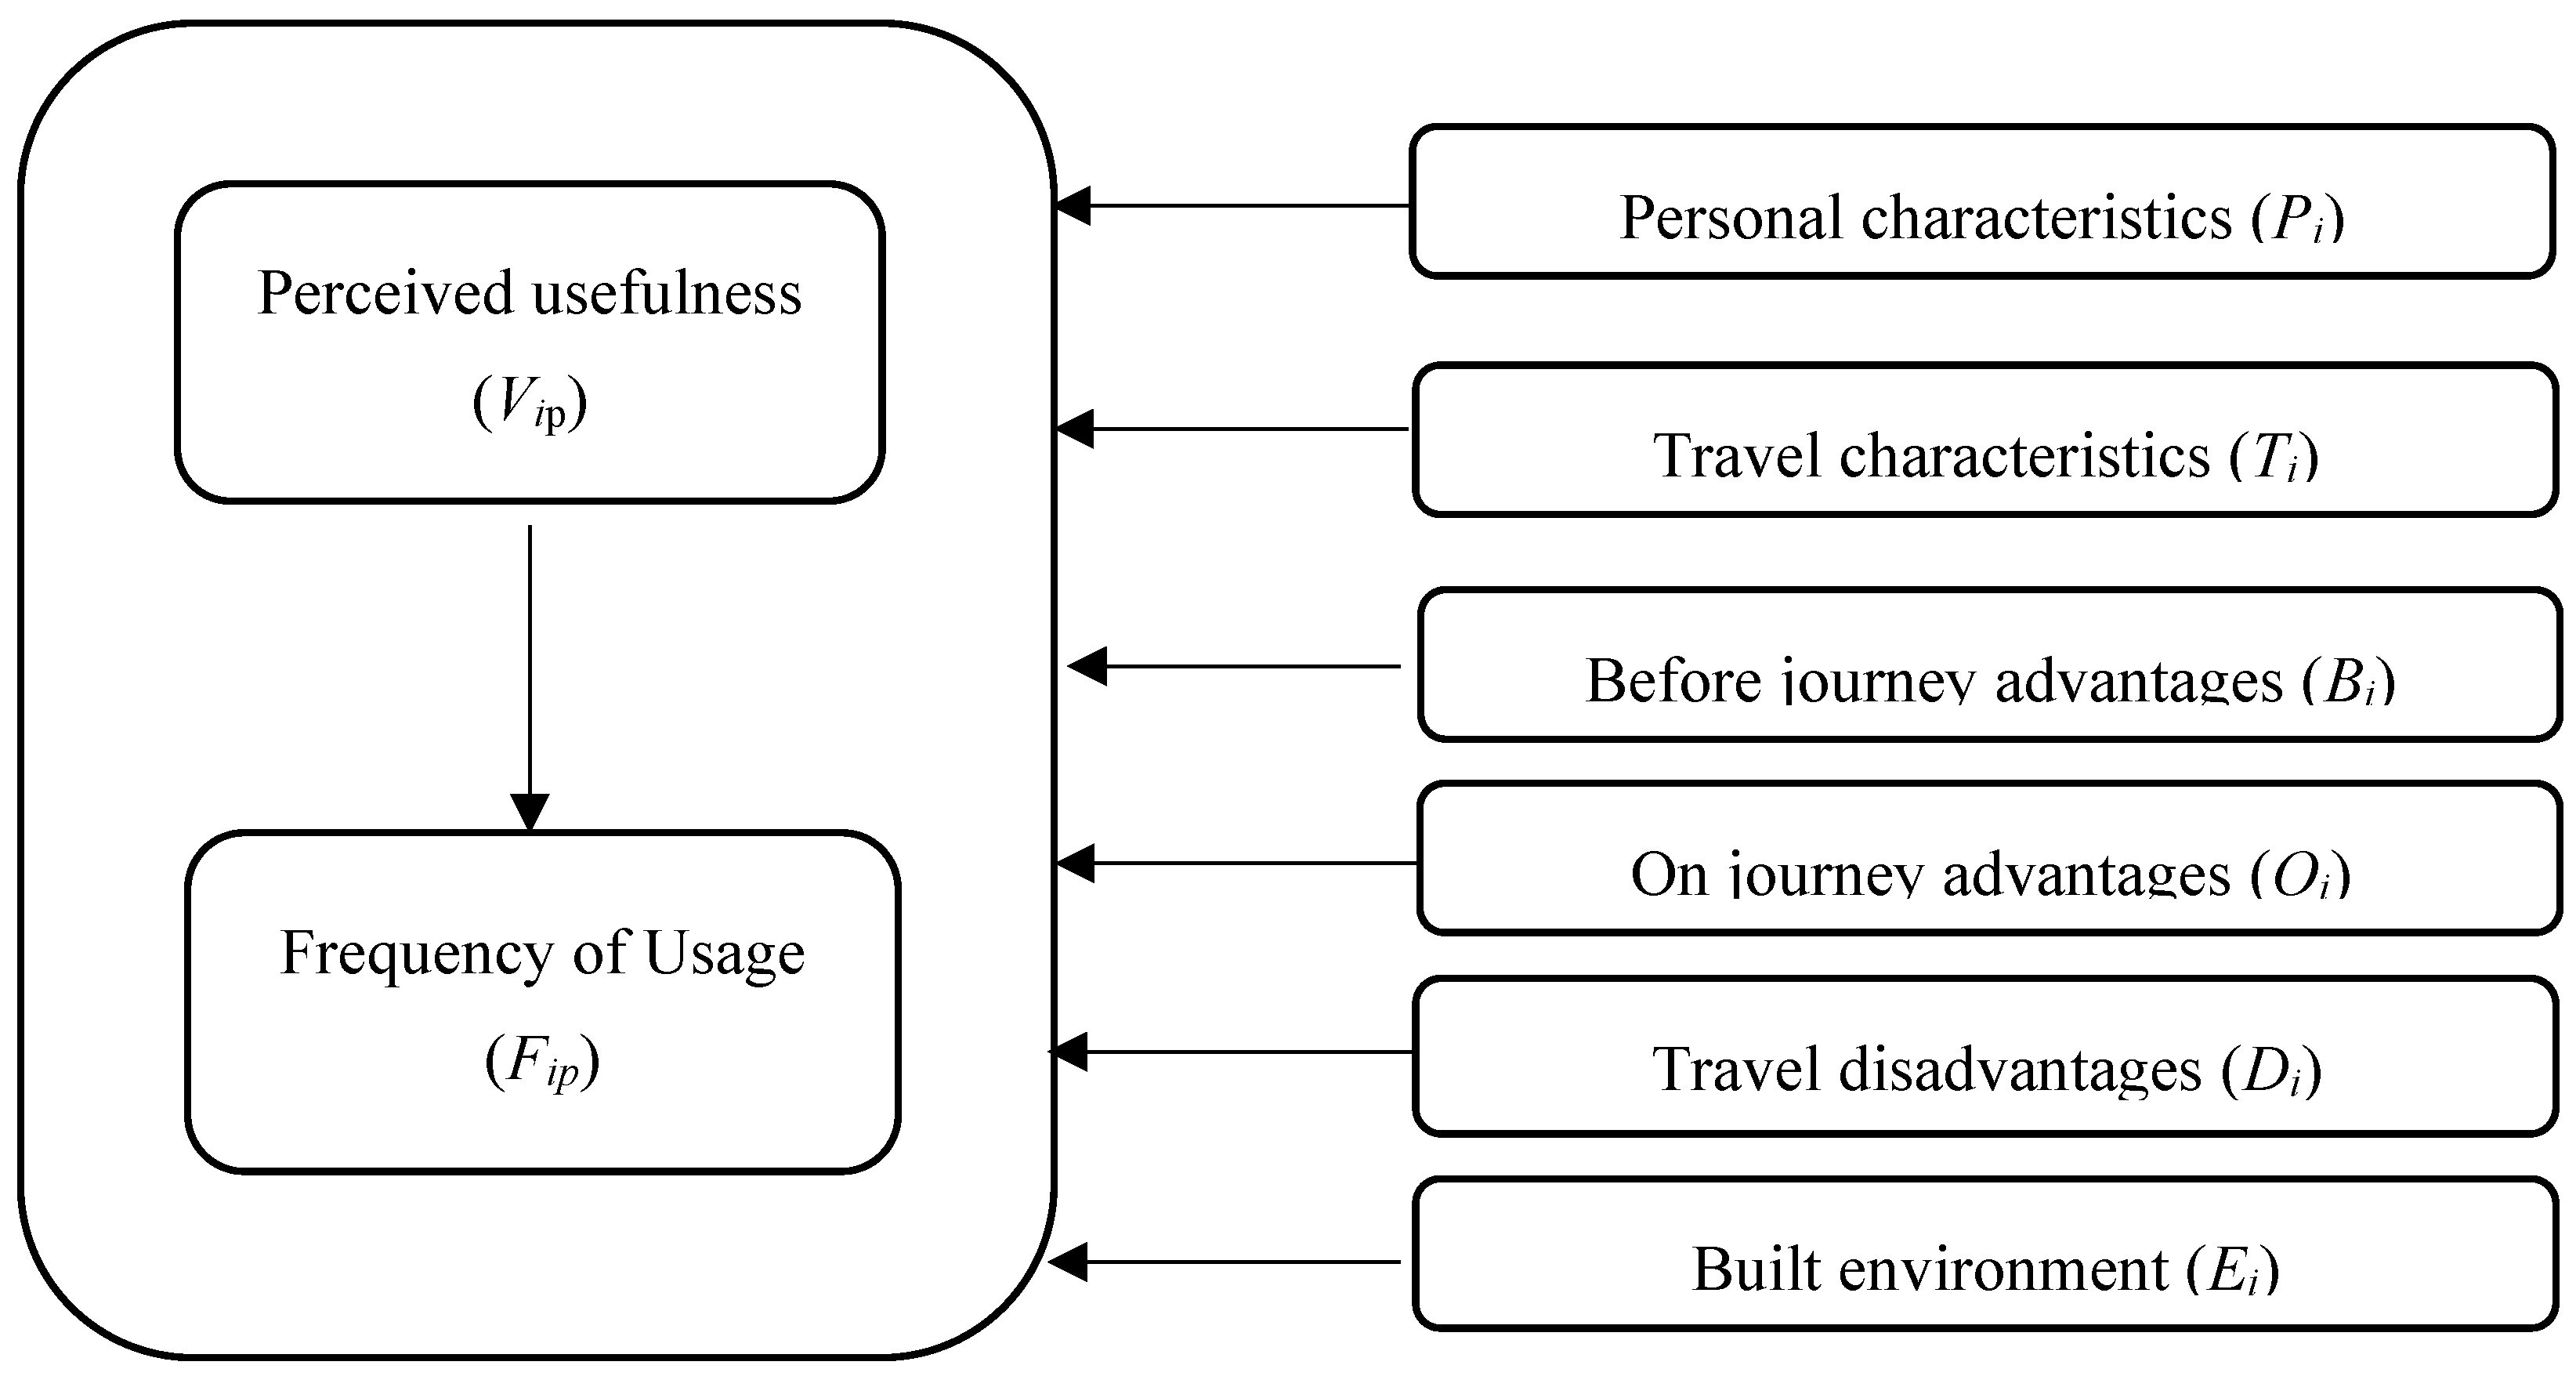
To better understand the relationships between the perceived usefulness and the frequency usage and what describes those variables, the interaction between socio-demographic, travel, multi-tasking, built-environment, on-journey and before-journey advantages, and travel disadvantages were modelled using the modified SEM. Figure 2 shows the proposed model. Perceived usefulness and frequency of usage were analysed in the models as endogenous variables, while all the other variables were treated as exogenous.
The modified SEM captured the relationship between the perceived usefulness and the frequency usage in a recursive structure. Full-information Maximum-Likelihood SEM (FIML-SEM) and other types of multipath analysis usually require the endogenous variables in continuous responses. However, modified SEM can be used for various data responses (i.e., nominal and continuous data) of endogenous variables, so it can provide better results. The modified SEM can also solve the endogeneity issue of using the instrumental variables (IV) method as similar to the two- and three-stage least square method (2SLS and 3SLS) [20]. Therefore, the modified SEM has more advantages compared to the conventional SEM method [74] (detailed discussion of the modified SEM can be found in [75,76]). In this study, perceived usefulness is treated as continuous, and the frequency of taking ride-sourcing uses ordinal responses. The frequency of using ride-sourcing is better represented by ordinal responses than continuous responses since the observed values are not in a range from minus ∞ to positive ∞.
To apply different responses to different endogenous variables, the modified SEM is actually a combination of linear regression (LR) in the first stage (perceived usefulness) and ordinal regression (OR) in the second stage (ride-sourcing usage). Since it is a combination of two models, the global fit such as the root mean square error of approximation (RMSEA) cannot be estimated here (as also found in Dharmowijoyo et al. [20,64]) as in FIML-SEM and its variant. To apply the structural form, the modified SEM uses a similar approach to a 2-Stage Least Square (2SLS) and 3-Stage Least Square (3SLS) method. The creation of the perceived usefulness ( is like the creation of the first stage of 2SLS and 3SLS, also called the creation of an instrumental variable (IV), whereas the incorporation of the estimated perceived usefulness ( in the travel usage model is like the second step of 2SLS. As in 2SLS, the inclusion of the estimated perceived usefulness using ride-sourcing tries to tackle endogeneity problems between the observed perceived usefulness (Vi) and other variables (e.g., personal and travel characteristics, multi-tasking activities, and on-journey and before-journey advantages). The detailed equations are shown in Equations (1) and (2). As a limitation of this study, and similar to 2SLS, the first and the second stages were run separately; thus, the estimated error terms are assumed not to be correlated. In other words, different from 3SLS, which can be applied to correlate the third stage by correlating the error terms ε1 and ε2 of Equations (1) and (2), respectively, the modified SEM ignores the third stage. Therefore, the model sacrifices the simultaneous and the reciprocal effects. Myung [77] defined this model of non-full information SEM using 2SLS as contrary to FIML-SEM and 3SLS. Since simultaneous effects are not expected to be a novelty of this study, the formation of journey and non-journey advantages, travel disadvantages, and the built environment were also not run simultaneously.
Using LR as the first stage, the equation to estimate the perceived usefulness is provided below:
where Vi = perceived usefulness of the ride-sourcing by an individual i. The right-hand side of Equation (1) consists of the following: Pi = personal characteristics of individual i, Ti = travel characteristics of individual i, Bi = before-journey advantages using ride-sourcing of individual i, Oi = on-journey advantages using ride-sourcing of individual i, Di = travel disadvantage during travel by individual i, and Ei = built environment in individual i’s residence.
Moreover, there are various scales of the predictors used in the models. Since most of the personal and travel characteristics, including multi-tasking activities during travel, are nominal variables, for incorporation into the regression analysis, we converted all of them into dummy variables. Dummy variables are used because this gives us opportunities to use a single regression equation to represent multiple categories [78]. Latent variables such as Bi, Oi, Di, and Ei are treated as continuous variables that range from minus ∞ to positive ∞ as they are generated using explanatory factor analysis.
In the travel frequency model or the second-stage model, this study incorporates (estimated perceived usefulness of the ride-sourcing of individual i) from the perceived usefulness model applied into OR. Endogeneity problems were expected to be tackled by applying instead of Vi. The recursive structure between perceived usefulness and ride-sourcing usage was represented by applying in the second-stage model. Since the dependent variable can be treated as ordinal, the likelihood of using ride-sourcing more or less (y) was defined as shown in Equation (2), where the μ parameters represent thresholds to be estimated [79].
With the OR model, the utility function can be written as follows:
Since the scale of the latent variable y is arbitrary, it is common to assume that the logistic distribution for the residual is in its standard form, i.e., with mean 0 and variance μ2 = 3 (logit) [79]. Additionally, for identification, one must either set one of the thresholds equal to zero or set the intercept to zero. In what follows, Raman and Hedeker [80] suggested specifying the latter and estimating j − 1 thresholds, with j being the number of categories and xi being the parameters in the utility function. The estimation of the parameters in the utility function uses Maximum Likelihood Estimation (MLE). With the full set of normalisation in place, the probabilities for the ordered choice can be written as follows [79]:
Moreover, the stepwise method is used for both of the models, which is the step-by-step iterative construction of a regression model that involves the selection of independent variables to be used in a final model [73]. Several variables that are not significant were still retained in the models due to their interactions with the goodness-of-fit of the models after a review during the stepwise process [81].
5. The Model Result
5.1. Perceived Usefulness
Table 5 presents the estimation results of linear regression for measuring the perceived usefulness of ride-sourcing, with the explanatory variables of personal and travel characteristics, multi-tasking, the built environment, and cognitive advantages and disadvantages. The values of R2 indicate that the model can accurately predict 23.8% of the data variance (R2 = 0.238). The ANOVA test shows that the explanatory variables are significant predictors for the dependent variable.
As shown in Table 5, even though ride-sourcing services contain on-journey and before-journey components, the travellers’ appreciation of before-journey components, the reliable coverage and the reliable applications and costs significantly explain the perceived usefulness. Listening to music was found to be positively associated with the perceived usefulness, whereas enjoying the view and reading or sending messages showed the opposite effect. Using data from 2008–2013, some studies in developed countries [40,46,51] and in developing countries [52] showed that offline activities such as enjoying the view, daydreaming, and socialising positively correlate with travel experiences. However, with having multiple options of online activities, as occurred in 2018, those who just enjoy the view might have no options to connect with online activities or feel that the trips are boring [54]. Moreover, those who send/read messages might have tighter time-space constraints; thus, they still do work activities such as reading/sending emails while riding MBRS or CBRS. Differing from the hypothesis, two variables of on-journey advantages, reliable travel time and more productive time, show an insignificant impact on perceived usefulness as well as the cognitive disadvantages.
The built environment was insignificantly correlated with the travel experiences of using ride-sourcing. This was also found by studies in developed countries [37] and China [44] that investigated the effects of the built environment on the travel experiences of non-ride-sourcing modes. It seems that ride-sourcing services can be accessed by all people from different genders, incomes, and education levels. Therefore, gender, income, and education level were found to be insignificant in the perceived usefulness. However, workers who work more than 8 h might feel benefits from being free from driving a vehicle or walking and waiting for public transport. The results are similar to results from developed countries that show workers and students tend to adopt the services whereas non-workers do not [11,82]. Moreover, travellers who are younger than 25 or older than 40 years old positively correlate with the perceived usefulness, rather than travellers who are 25 to 40 years old. The model also reveals that several travel characteristics correlate with the perceived usefulness of the ride-sourcing service. Persons who have less than 2 months of ride-sourcing experience perceive negative experiences, whereas those who have more than 2 months of experience with the service feel the opposite. Travellers who previously used public transport are more likely to respond with negative experiences than travellers who previously used private vehicles.
5.2. Frequency of Ride-Sourcing Usage
Table 6 shows the estimation of the ride-sourcing usage model. In order to test the accuracy of the model, the overall goodness-of-fit test shows that the model has a good fit since models with predictors are better than models without predictors. The values of the Nagelkerke R2, Cox and Snell R2, as well as McFadden R2 indicate that the model can accurately predict roughly more than a quarter of the data variation. Furthermore, the parallel line test indicates that each group is mutually aligned; thus, the ordinal regression model is suitable for the data variation.
As expected, the positive perceived usefulness of ride-sourcing services significantly correlates with high ride-sourcing usage. Students who are 16–18 years old tend to use the service less frequently, whereas travellers who are older than 18 years (generation Z and millennials) and educated (having a bachelor degree or higher) are more likely to take ride-sourcing more often. This was also found in developed countries [31,82,83]. However, this study also found that educated generation X and older people also take the mode more often, which is different from the results in developed countries. Males were found to adopt the services more, similar to a study in the UK [82], but females were found to adopt the services in the US [11,31] and Canada [83]. In terms of travel characteristics, travellers with more than 2 months’ experience of using the services and who experience waiting times less than 5 min tend to take the service more often. In addition, CBRS users tend to use the services more often than MBRS users, as also indicated in Section 2. It seems that motorcyclists take the services more often than public transport and private vehicle users.
In contrast to the perceived usefulness model, on-journey benefits significantly correlate with ride-sourcing usage, whereas no before-journey benefit endogenous variables are found to significantly correlate with ride-sourcing usage. The reliable travel time and more productive time significantly correlate with increasing the frequency of using ride-sourcing. Applying various types of positive and negative experiences due to the involvement of multi-tasking during trips, Shaw et al. [46] define reliable travel time and more productive time as productive benefits during the journey time. Those who perceive the high reliability of vehicles and drivers may be beginner users; thus, the effects are negative on the usage. With regard to multi-tasking, the infrequent users have social interactions with drivers during ride-sourcing services. As also found in developed countries [11,31] and in China [29], the built environment also showed significant correlations with the frequency of ride-sourcing usage. Residents from well-developed areas or in richer neighbourhoods might reside in real estate not far from a city centre [84]. Those people tend to use these services less frequently, while travellers who live closer to public transport, pedestrian networks, and public amenities tend to have higher ride-sourcing use. Those who reside near public transport networks and public amenities reside near the city centre [64,84].
6. Discussion and Conclusions
As expected, travellers who perceive ride-sourcing as useful positively correlate with a likelihood of high usage of the mode; having positive experiences of travel with a specific mode was also found in developed countries for different travel mode applications [27,32,33,34,43,85,86]. Without perceiving the mode to be useful through perceiving high performances of before-journey components (e.g., high coverage, reliable applications and cashless payments, and low fares) and high performances of vehicles and drivers, people may not start to use the mode or may not repeat their use of the mode. Since the perceived usefulness shows the highest magnitude on travel usage and before-journey performance and the reliability of vehicles and drivers are the variables with the highest magnitude on perceived usefulness, reducing the before-journey performance, and the vehicle and driver performance will have a high impact on the perceived usefulness and ride-sourcing usage. Moreover, similar to an earlier study in Vietnam [48], on-journey advantages, such as good quality of the vehicle (i.e., convenient and reliable) and the financial benefit (i.e., reduced travel cost), shape the appreciation of the services. On the other hand, perceiving reliable travel time and more productive time and other situational variables are not found to correlate with perceived usefulness but significantly correlate with whether users will use the mode frequently or not.
Even though travellers know that Bandung is a congested city [84], perceiving a better travel time still correlates with a high magnitude of usage. With the high-level congestion in urban areas, the need for more efficient travel time trips has influenced people to use ride-sourcing [9,60]. Therefore, more advanced navigation systems for route selection and improving the drivers’ familiarity with their operation areas can be suggested as ways to reduce travel time and, in turn, increase usage. While it is proposed that ride-sourcing providers pool their drivers around locations with dense activity to reduce the waiting time, this pooling management might not be needed in good neighbourhoods in some suburban areas [64]. There is a tendency for ride-sourcing to be used for short and medium distances in developing countries, as also found in other studies [29,59,61], for reaching public amenities or shopping centres or public transport networks around the city centre.
This study confirms that multi-tasking is not a reason for ride-sourcing users to take the services more often. Those who are enjoying the view or reading/sending emails during the journey perceive negative experiences during the services, while those who are enjoying social interactions with the driver tend to be infrequent users.
By contrast with research in developed countries [11,31,82,83], educated generation X and older people perceive this service to be useful and take this mode more often. On the other hand, educated millennials may not feel this service to be useful but keep using this mode. This is presumably because generation X feels that this mode improves their mobility compared to what it was before the existence of this mode. Males take this mode more often, as in the UK [82]. In developing countries, particularly Indonesia, males are workers [30], so this mode seems to help male workers to improve their mobility. Moreover, motorcyclists and CBRS users are more loyal travellers than car and public transport users and MBRS, respectively. Therefore, CBRS users and motorcyclists who are part of the educated generation X and older can be offered a loyal user programme (e.g., as premium or titanium users with more benefits in using this service).
Since beginner users perceive negative experiences and take the mode infrequently, incentives can be provided to new users or those who have used the mode for less than 2 months in order to improve the perceived usefulness of the mode and increase the usage. Moreover, incentives such as discounts should be given to users who have a waiting time of more than 15 min; that can improve the perceived usefulness and the usage. However, given the issue of ride-sourcing competition with public transport, this incentive should be considered carefully, as ride-sourcing should not be a substitute for the demand for public transport [9,57]. Integrating financial incentives for ride-sourcing trips to public transport stations can be alternatives to support the public transport services.
During the COVID-19 pandemic, the demand for using this service tended to be reduced due to the travel restrictions, which particularly affected the demand for using public transport or quasi-public transport. However, it is reported that this service is also utilized for food delivery [87]. But to avoid contact with crowds, some people adopting protective behaviour during the new normal period might choose this mode rather than public transport if they need to travel but have no private vehicle. Considering the limited public transport networks in developing countries such as Indonesia, due to limited public funding and the difficulties in changing road-oriented land use developments, this mode still has the possibility to act as quasi-public transport in improving the mobility of people in the new normal period. An emerging short travel mode might also be impacted by ride-sourcing, especially MBRS [9,10,61]. In the future, the use of this service for food delivery and the likelihood of having short or long travel times using CBRS and MBRS can be investigated further. Therefore, understanding the effect of digitalization in transportation services will be relevant, particularly in developing countries such as Indonesia.
Author Contributions
Conceptualisation: M.R., T.B.J., B.B.E.D.; Data Collection: M.R., T.B.J.; Software and analysis: M.R., B.B.E.D.; First draft: M.R., B.B.E.D.; Review and editing: T.B.J., B.B.E.D., D.P.; Funding: M.R., T.B.J., D.P. All authors have read and agreed to the published version of the manuscript.
Funding
This study is funded by Young Lecturer Grant from Institut Teknologi Nasional Bandung and The Directorate of Research and Community Services, the Directorate General of Research and Development Strengthening, The Ministry of Research, Technology, and Higher Education, Indonesia.
Institutional Review Board Statement
Ethical review and approval were waived for this study, due to no personal identity were involved or reported.
Informed Consent Statement
Informed consent was obtained from all subjects involved in the study.
Data Availability Statement
Not applicable.
Acknowledgments
The authors thank all parties who have participated in data collection.
Conflicts of Interest
The authors declare no conflict of interest. The funders had no role in the design of the study; in the collection, analyses, or interpretation of data; in the writing of the manuscript, or in the decision to publish the results.
References
- Rayle, L.; Dai, D.; Chan, N.; Cervero, R.; Shaheen, S. Just a Better Taxi? A Survey-Based Comparison of Taxis, Transit, and Ridesourcing Services in San Francisco. Transp. Policy 2016, 45, 168–178. [Google Scholar] [CrossRef] [Green Version]
- Tirachini, A. Ride-hailing, travel behaviour and sustainable mobility: An international review. Transportation 2020, 47, 2011–2047. [Google Scholar] [CrossRef]
- Aarhaug, J.; Olsen, S. Implications of Ride-Sourcing and Self-Driving Vehicles on the Need for Regulation in Unscheduled Passenger Transport. Res. Transp. Econ. 2018, 69, 573–582. [Google Scholar] [CrossRef]
- Anderson, D.N. “Not Just a taxi”? For-Profit Ridesharing, Driver Strategies, and VMT. Transportation 2014, 41, 1099–1117. [Google Scholar] [CrossRef] [Green Version]
- Jin, S.T.; Kong, H.; Wu, R.; Sui, D.Z. Ridesourcing, the Sharing Economy, and the Future of Cities. Cities 2018, 76, 96–104. [Google Scholar] [CrossRef]
- Das, K.; Gryseels, M.; Sudhir, P.; Tan, K.T. Unlocking Indonesia’s Digital Opportunity; McKinsey & Company: New York, NY, USA, October 2016. Available online: https://www.mckinsey.com/featured-insights/asia-pacific/unlocking-indonesias-digital-opportunity (accessed on 20 August 2020).
- GOJEK. One App for All Your Needs. 2018. Available online: https://www.go-jek.com/about (accessed on 30 October 2019).
- GOJEK. Rilis Laporan Kejog. 2019. Available online: https://selular.id/2019/01/rilis-laporan-kejog-gojek-umumkan-pencapaiannya-selama-2018/kejog-2018/ (accessed on 23 December 2019).
- Irawan, M.Z.; Belgiawan, P.F.; Tarigan, A.; Wijanarko, F. To Compete or Not Compete: Exploring the Relationships between Motorcycle-Based Ride-Sourcing, Motorcycle Taxis, and Public Transport in the Jakarta Metropolitan Area. Transportation 2020, 47, 2367–2389. [Google Scholar] [CrossRef]
- Medeiros, R.M.; Duarte, F.; Achmad, F.; Jalali, A. Merging ICT and Informal Transport in Jakarta’s Ojek System. Transp. Plan. Technol. 2018, 41, 336–352. [Google Scholar] [CrossRef]
- Alemi, F.; Circella, G.; Handy, S.; Mokhtarian, P. What Influences Travelers to Use Uber? Exploring the Factors Affecting the Adoption of on-Demand Ride Services in California. Travel Behav. Soc. 2018, 13, 88–104. [Google Scholar] [CrossRef]
- Dias, F.F.; Lavieri, P.S.; Garikapati, V.; Astroza, S.; Pendyala, R.M.; Bhat, C.R. A Behavioral Choice Model of the Use of Car-Sharing and Ride-Sourcing Services. Transportation 2017, 44, 1307–1323. [Google Scholar] [CrossRef]
- Chen, C.; Gong, H.; Paaswell, R. Role of the Built Environment on Mode Choice Decisions: Additional Evidence on the Impact of Density. Transportation 2008, 35, 285–299. [Google Scholar] [CrossRef]
- Damaini, A.A.; Nugroho, G.S.; Suyoto, S. Fraud Crime Mitigation of Mobile Application Users for Online Transportation. Int. J. Interact. Mob. Technol. 2018, 12, 153–167. [Google Scholar] [CrossRef]
- Mostofi, H.; Masoumi, H.; Dienel, H.-L. The Relationship between Regular Use of Ridesourcing and Frequency of Public Transport Use in the MENA Region (Tehran and Cairo). Sustainability 2020, 12, 8134. [Google Scholar] [CrossRef]
- Clewlow, R.R.; Mishra, G.S. Disruptive Transportation: The Adoption, Utilization, and Impacts of Ride-Hailing in the United States. Available online: https://escholarship.org/uc/item/82w2z91j (accessed on 12 June 2020).
- Feigon, S.; Murphy, C. Shared Mobility and the Transformation of Public Transit. TCRP Research Report, no. 188, Art. no. Project J-11, Task 21. Available online: https://trid.trb.org/view/1416012 (accessed on 16 September 2020).
- Hall, J.D.; Palsson, C.; Price, J. Is Uber a Substitute or Complement for Public Transit? J. Urban Econ. 2018, 108, 36–50. [Google Scholar] [CrossRef] [Green Version]
- Tirachini, A.; del Río, M. Ride-Hailing in Santiago de Chile: Users’ Characterisation and Effects on Travel Behaviour. Transp. Policy 2019, 82, 46–57. [Google Scholar] [CrossRef]
- Dharmowijoyo, D.B.E.; Susilo, Y.O.; Karlström, A. On Complexity and Variability of individuals’ Discretionary Activities. Transportation 2018, 45, 177–204. [Google Scholar] [CrossRef] [Green Version]
- Dijst, M.; Farag, S.; Schwanen, T. A Comparative Study of Attitude Theory and Other Theoretical Models for Understanding Travel Behaviour. Environ. Plan. A Econ. Space 2008, 40, 831–847. [Google Scholar] [CrossRef]
- Gärling, T.; Axhausen, K.W. Introduction: Habitual Travel Choice. Transportation 2003, 30, 1–11. [Google Scholar] [CrossRef]
- Van Acker, V.; Van Wee, B.; Witlox, F. When Transport Geography Meets Social Psychology: Toward a Conceptual Model of Travel Behaviour. Transp. Rev. 2010, 30, 219–240. [Google Scholar] [CrossRef] [Green Version]
- Etminani-Ghasrodashti, R.; Hamidi, S. Individuals’ Demand for Ride-Hailing Services: Investigating the Combined Effects of Attitudinal Factors, Land Use, and Travel Attributes on Demand for App-Based Taxis in Tehran, Iran. Sustainability 2019, 11, 5755. [Google Scholar] [CrossRef] [Green Version]
- Dawes, M. Perspectives on the Ridesourcing Revolution: Surveying Individual Attitudes toward Uber and Lyft to Inform Urban Transportation Policymaking. MIT Thesis, Massachusetts Institute of Technology, Cambridge, MA, USA, 2016. Available online: https://dspace.mit.edu/handle/1721.1/104994 (accessed on 25 August 2020).
- Abou-Zeid, M.; Fujii, S. Travel Satisfaction Effects of Changes in Public Transport Usage. Transportation 2015, 43, 301–314. [Google Scholar] [CrossRef]
- De Vos, J.; Mokhtarian, P.L.; Schwanen, T.; Van Acker, V.; Witlox, F. Travel Mode Choice and Travel Satisfaction: Bridging the Gap between Decision Utility and Experienced Utility. Transportation 2016, 43, 771–796. [Google Scholar] [CrossRef] [Green Version]
- Circella, G.; Alemi, F. Transport Policy in the Era of Ridehailing and Other Disruptive Transportation Technologies. In Advances in Transport Policy and Planning; Elsevier: Amsterdam, The Netherlands, 2018; Volume 1, pp. 119–144. [Google Scholar] [CrossRef]
- Tang, L.; Duan, Z.; Zhao, Y. Toward Using Social Media to Support Ridesharing Services: Challenges and Opportunities. Transp. Plan. Technol. 2019, 42, 355–379. [Google Scholar] [CrossRef]
- Dharmowijoyo, D.B.E.; Susilo, Y.O.; Karlström, A. Day-to-Day Variability in travellers’ Activity-Travel Patterns in the Jakarta Metropolitan Area. Transportation 2016, 43, 601–621. [Google Scholar] [CrossRef]
- Alemi, F.; Circella, G.; Mokhtarian, P.; Handy, S. Exploring the Latent Constructs Behind the Use of Ridehailing in California. J. Choice Model. 2018, 29, 47–62. [Google Scholar] [CrossRef]
- Shaaban, K.; Kim, I. The Influence of Bus Service Satisfaction on University students’ Mode Choice. J. Adv. Transp. 2016, 50, 935–948. [Google Scholar] [CrossRef] [Green Version]
- Abenoza, R.F.; Cats, O.; Susilo, Y.O. Travel Satisfaction with Public Transport: Determinants, User Classes, Regional Disparities and Their Evolution. Transp. Res. Part A Policy Pract. 2017, 95, 64–84. [Google Scholar] [CrossRef] [Green Version]
- Kahneman, D.; Krueger, A.B. Developments in the Measurement of Subjective Well-Being. J. Econ. Perspect. 2006, 20, 3–24. [Google Scholar] [CrossRef] [Green Version]
- Cao, X.; Ettema, D. Satisfaction with Travel and Residential Self-Selection: How Do Preferences Moderate the Impact of the Hiawatha Light Rail Transit Line? J. Transp. Land Use 2014, 7, 93–108. [Google Scholar] [CrossRef]
- Higgins, C.D.; Sweet, M.N.; Kanaroglou, P.S. All Minutes Are Not Equal: Travel Time and the Effects of Congestion on Commute Satisfaction in Canadian Cities. Transportation 2018, 45, 1249–1268. [Google Scholar] [CrossRef]
- Ettema, D.; Friman, M.; Gärling, T.; Olsson, L.E.; Fujii, S. How in-Vehicle Activities Affect Work commuters’ Satisfaction with Public Transport. J. Transp. Geogr. 2012, 24, 215–222. [Google Scholar] [CrossRef]
- Lyons, G.; Jain, J.; Holley, D. The Use of Travel Time by Rail Passengers in Great Britain. Transp. Res. Part A Policy Pract. 2007, 41, 107–120. [Google Scholar] [CrossRef] [Green Version]
- Malokin, A.; Circella, G.; Mokhtarian, P.L. How Do Activities Conducted While Commuting Influence Mode Choice? Using Revealed Preference Models to Inform Public Transportation Advantage and Autonomous Vehicle Scenarios. Transp. Res. Part A Policy Pract. 2019, 124, 82–114. [Google Scholar] [CrossRef]
- Rasouli, S.; Timmermans, H. Judgments of Travel Experiences, Activity Envelopes, Trip Features and Multi-Tasking: A Panel Effects Regression Model Specification. Transp. Res. Part A Policy Pract. 2014, 63, 67–75. [Google Scholar] [CrossRef]
- De Vos, J. Analysing the Effect of Trip Satisfaction on Satisfaction with the Leisure Activity at the Destination of the Trip, in Relationship with Life Satisfaction. Transportation 2017, 46, 623–645. [Google Scholar] [CrossRef]
- Zhu, P.; Wang, L.; Jiang, Y.; Zhou, J. Metropolitan Size and the Impacts of Telecommuting on Personal Travel. Transportation 2018, 45, 385–414. [Google Scholar] [CrossRef]
- Sprumont, F.; Astegiano, P.; Viti, F. On the consistency between commuting satisfaction and traveling utility: The case of the University of Luxembourg. Eur. J. Transp. Infrastruct. Res. 2017, 17. [Google Scholar] [CrossRef]
- Ye, R.; Titheridge, H. Satisfaction with the Commute: The Role of Travel Mode Choice, Built Environment and Attitudes. Transp. Res. Part D Transp. Environ. 2017, 52, 535–547. [Google Scholar] [CrossRef]
- De Vos, J. Do People Travel with Their Preferred Travel Mode? Analysing the Extent of Travel Mode Dissonance and Its Effect on Travel Satisfaction. Transp. Res. Part A Policy Pract. 2018, 117, 261–274. [Google Scholar] [CrossRef]
- Shaw, F.A.; Malokin, A.; Mokhtarian, P.L.; Circella, G. It’s Not All Fun and Games: An Investigation of the Reported Benefits and Disadvantages of Conducting Activities While Commuting. Travel Behav. Soc. 2019, 17, 8–25. [Google Scholar] [CrossRef]
- Loa, P.; Habib, K.N. Examining the Influence of Attitudinal Factors on the Use of Ride-Hailing Services in Toronto. Transp. Res. Part A Policy Pract. 2021, 146, 13–28. [Google Scholar] [CrossRef]
- Nguyen-Phuoc, D.Q.; Su, D.N.; Tran, P.T.K.; Le, D.-T.T.; Johnson, L.W. Factors Influencing customer’s Loyalty towards Ride-Hailing Taxi Services—A Case Study of Vietnam. Transp. Res. Part A Policy Pract. 2020, 134, 96–112. [Google Scholar] [CrossRef]
- Ma, L.; Zhang, X.; Ding, X.; Wang, G. Risk Perception and Intention to Discontinue Use of Ride-Hailing Services in China: Taking the Example of DiDi Chuxing. Transp. Res. Part F Traffic Psychol. Behav. 2019, 66, 459–470. [Google Scholar] [CrossRef]
- Nguyen-Phuoc, D.Q.; Oviedo-Trespalacios, O.; Vo, N.S.; Le, P.T.; Van Nguyen, T. How Does Perceived Risk Affect Passenger Satisfaction and Loyalty towards Ride-Sourcing Services? Transp. Res. Part D Transp. Environ. 2021, 97, 102921. [Google Scholar] [CrossRef]
- Mokhtarian, P.L.; Papon, F.; Goulard, M.; Diana, M. What Makes Travel Pleasant and/or Tiring? An Investigation Based on the French National Travel Survey. Transportatation 2014, 42, 1103–1128. [Google Scholar] [CrossRef] [Green Version]
- Dharmowijoyo, D.B.E.; Susilo, Y.O.; Tarigan, A.K.M.; Joewono, T.B. Multitasking behaviour and daily subjective well-being. Soc. Indic. Res. 2021. submitted. [Google Scholar]
- Fauzi, N.F.M.; Dharmowijoyo, D.B. Activity-Travel Participation, Multitasking in Travel and Daily Well-Being. MATEC Web Conf. 2019, 270, 03014. [Google Scholar] [CrossRef] [Green Version]
- Rizki, M.; Joewono, T.B.; Dharmowijoyo, D.B.E.; Belgiawan, P.F. Does Multitasking Improve the Travel Experience of Public Transport Users? Investigating the Activities During Commuter Travels in the Bandung Metropolitan Area, Indonesia. Public Transp. 2021, 13, 429–454. [Google Scholar] [CrossRef]
- Varghese, V.; Jana, A. Impact of ICT on Multitasking during Travel and the Value of Travel Time Savings: Empirical Evidences from Mumbai, India. Travel Behav. Soc. 2018, 12, 11–22. [Google Scholar] [CrossRef]
- Almunawar, M.N.; Anshari, M.; Lim, S.A. Customer Acceptance of Ride-Hailing in Indonesia. J. Sci. Technol. Policy Manag. 2020, 12. [Google Scholar] [CrossRef]
- Irawan, M.Z.; Belgiawan, P.F.; Joewono, T.B.; Simanjuntak, N.I.M. Do Motorcycle-Based Ride-Hailing Apps Threaten Bus Ridership? A Hybrid Choice Modeling Approach with Latent Variables. Public Transp. 2019, 12, 207–231. [Google Scholar] [CrossRef]
- Rizki, M.; Joewono, T.B.; Belgiawan, P.F.; Prasetyanto, D. Exploring the Ride-Hailing Drivers’ Characteristics and Their Order Rejection Behavior in Bandung City. In Ground Improvement Techniques and Geosynthetics; Springer: Singapore, 2021; pp. 861–869. [Google Scholar] [CrossRef]
- Suatmadi, A.Y.; Creutzig, F.; Otto, I.M. On-Demand Motorcycle Taxis Improve Mobility, Not Sustainability. Case Stud. Transp. Policy 2019, 7, 218–229. [Google Scholar] [CrossRef]
- Alemi, F.; Circella, G.; Mokhtarian, P.; Handy, S. What Drives the Use of Ridehailing in California? Ordered Probit Models of the Usage Frequency of Uber and Lyft. Transp. Res. Part C Emerg. Technol. 2019, 102, 233–248. [Google Scholar] [CrossRef]
- Tarabay, R.; Abou-Zeid, M. Modeling the Choice to Switch from Traditional Modes to Ridesourcing Services for social/Recreational Trips in Lebanon. Transportation 2020, 47, 1733–1763. [Google Scholar] [CrossRef]
- Saffan, A.F.; Rizki, M. Exploring the Role of Online ‘Ojek’ in Public Transport Trips: Case of Jakarta Metropolitan Area Rail Users. In IOP Conference Series: Earth and Environmental Science; IOP Publishing: Bristol, UK, 2018; Volume 158, p. 012024. [Google Scholar] [CrossRef]
- Rizki, M.; Joewono, T.B.; Belgiawan, P.F.; Irawan, M.Z. The Travel Behaviour of Ride-Sourcing Users, and Their Perception of the Usefulness of Ride-Sourcing Based on the users’ Previous Modes of Transport: A Case Study in Bandung City, Indonesia. IATSS Res. 2020, 45, 267–276. [Google Scholar] [CrossRef]
- Dharmowijoyo, D.B.; Susilo, Y.O.; Syabri, I. Time Use and Spatial Influence on Transport-Related Social Exclusion, and Mental and Social Health. Travel Behav. Soc. 2020, 21, 24–36. [Google Scholar] [CrossRef]
- Mutiah, D. Makin Ditinggalkan, Perlukah Angkot di Bandung Dipertahankan? Available online: https://www.liputan6.com/regional/read/2909825/makin-ditinggalkan-perlukah-angkot-di-bandung-dipertahankan (accessed on 21 August 2020).
- Ministry of National Development Planning. Indonesia Mid Term Development Plan 2020–2024. Presidential Regulation No 18 2020; Ministry of National Development Planning: Bogor, Indonesia, 20 January 2020.
- Yamane, T. Statistics. An Introductory Analysis, 2nd ed.; Harper & Row: New York, NY, USA, 1973. [Google Scholar]
- Bandung Statistics Bureau. Bandung in Figures 2019; BPS: Bandung, West Java, Indonesia, 2019. [Google Scholar]
- Ettema, D.; Gärling, T.; Eriksson, L.; Friman, M.; Olsson, L.E.; Fujii, S. Satisfaction with Travel and Subjective Well-Being: Development and Test of a Measurement Tool. Transp. Res. Part F Traffic Psychol. Behav. 2011, 14, 167–175. [Google Scholar] [CrossRef]
- Mahmoudi, J.; Zhang, L. Impact of the Built Environment Measured at Multiple Levels on Nonmotorized Travel Behavior: An Ecological Approach to a Florida Case Study. Sustainability 2020, 12, 8837. [Google Scholar] [CrossRef]
- ALMEC Corporation. Jabodetabek Urban Transport Policy Integration Study; ALMEC Corporation: Tokyo, Japan, 2019. [Google Scholar]
- Wicaksono, A.; Dharmowijoyo, D.B.E.; Tanjung, L.E.; Susilo, Y.O. The reciprocal effects of online and physical activities and the use of ride-sourcing mode on health. Submitt. J. Transp. Health 2021. submitted. [Google Scholar]
- Hair, J.F.; Black, B.; Babin, B.J.; Anderson, R.E. Multivariate Data Analysis: International Edition, 7th ed.; Pearson: London, UK, 2013; Available online: https://www.pearson.com/uk/educators/higher-education-educators/program/Hair-Multivariate-Data-Analysis-Global-Edition-7th-Edition/PGM916641.html (accessed on 21 July 2020).
- Dharmowijoyo, D.B.E.; Susilo, Y.O.; Joewono, T.B. Residential location and health effects on multitasking behaviours and day experiences. Sustainability 2021, in press. [Google Scholar]
- Liu, Y.; Bellibas, M.S.; Printy, S. How School Context and Educator Characteristics Predict Distributed Leadership. Educ. Manag. Adm. Leadersh. 2018, 46, 401–423. [Google Scholar] [CrossRef]
- Gujarati, D.N. Basic Econometrics; McGraw-Hill: New York, NY, USA, 2003. [Google Scholar]
- Myung, I.J. Tutorial on Maximum Likelihood Estimation. J. Math. Psychol. 2003, 47, 90–100. [Google Scholar] [CrossRef]
- Hardy, M. Regression with Dummy Variables; SAGE Publications Ltd.: Thousand Oaks, CA, USA, 1993. [Google Scholar] [CrossRef]
- Greene, W.H.; Hensher, D.A. Modeling Ordered Choices: A Primer; Cambridge University Press: Cambridge, UK, 2010. [Google Scholar]
- Raman, R.; Hedeker, D. A Mixed-Effects Regression Model for Three-Level Ordinal Response Data. Stat. Med. 2005, 24, 3331–3345. [Google Scholar] [CrossRef] [PubMed]
- Wang, G.C.S.; Jain, C.L. Regression Analysis: Modeling & Forecasting.; Institute of Business Forec: Flushing, NY, USA, 2003. [Google Scholar]
- Deka, D.; Fei, D. A Comparison of the Personal and Neighborhood Characteristics Associated with Ridesourcing, Transit Use, and Driving with NHTS Data. J. Transp. Geogr. 2019, 76, 24–33. [Google Scholar] [CrossRef]
- Young, M.; Farber, S. The Who, Why, and When of Uber and Other Ride-Hailing Trips: An Examination of a Large Sample Household Travel Survey. Transp. Res. Part A Policy Pract. 2019, 119, 383–392. [Google Scholar] [CrossRef] [Green Version]
- Tarigan, A.; Sagala, S.; Samsura, D.A.; Fiisabiilillah, D.F.; Simarmata, H.A.; Nababan, M. Bandung City, Indonesia. Cities 2016, 50, 100–110. [Google Scholar] [CrossRef]
- Abou-Zeid, M.; Witter, R.; Bierlaire, M.; Kaufmann, V.; Ben-Akiva, M. Happiness and Travel Mode Switching: Findings from a Swiss Public Transportation Experiment. Transp. Policy 2012, 19, 93–104. [Google Scholar] [CrossRef]
- Abou-Zeid, M.; Schmöcker, J.-D.; Belgiawan, P.F.; Fujii, S. Mass Effects and Mobility Decisions. Transp. Lett. 2013, 5, 115–130. [Google Scholar] [CrossRef]
- Rizki, M.; Dharmowijoyo, D.B.E.; Balijepalli, C.; Joewono, T.B.; Farda, M.; Maulana, A. Travel-activity changes during new normal period: Learning from the COVID-19 outbreak in Indonesia. Submitt. Transp. 2021. submitted. [Google Scholar]
Figure 1.
Activity During Travelling Characteristics (n = 497).

Figure 2.
The Hypothesised Structure of The Model.


Table 1.
Socio-demographic and travel parameters (n = 497).
| Variables | Proportion | Variables | Proportion | ||
|---|---|---|---|---|---|
| Personal Characteristics | Travel Characteristics | ||||
| Gender | Male | 61.20% | Average working hours per day | <6 h | 14.60% |
| Female | 38.80% | 6–8 h | 74.90% | ||
| Age * | 16–18 years old | 2.80% | >8 h | 10.50% | |
| 18–25 years old | 51.70% | Average waiting time | <5 min | 26.80% | |
| 26–40 years old | 36.80% | 5–10 min | 46.30% | ||
| 41–60 years old | 7.40% | 11–15 min | 20.30% | ||
| >60 years old | 1.30% | 16–30 min | 5.20% | ||
| Education | Highschool/Lower | 5.20% | >30 min | 1.40% | |
| Senior Highschool | 21.50% | Average travel time | <15 min | 16.30% | |
| Graduates | 70.80% | 15–30 min | 49.70% | ||
| Post-graduates/Higher | 2.50% | 30–60 min | 32.60% | ||
| Occupation | Students | 36.10% | 60–90 min | 1.40% | |
| Entrepreneurs | 16.90% | >90 min | 0.00% | ||
| Non-workers/jobless | 4.60% | Frequency of using ride-sourcing per months | <4 times | 39.20% | |
| Civil servants | 4.40% | 4–6 times | 31.20% | ||
| Private employees | 28.60% | 7–14 times | 20.30% | ||
| Lecturers/teachers | 2.20% | >14 times | 9.30% | ||
| Housewives | 4.10% | Experiences of using ride-sourcing | 1–2 months | 7.60% | |
| Others | 3.10% | 3 months–1 year | 51.90% | ||
| Monthly Income ‡ | <IDR 1,000,000 | 2.40% | >1 year | 40.50% | |
| IDR 1,000,000–IDR 3,000,000 | 16.70% | Previous Modes ** | Motorcycle | 58.80% | |
| IDR 3,000,001–IDR 6,000,000 | 30.60% | Car | 23.10% | ||
| IDR 6,000,001–IDR 9,000,000 | 18.90% | Public Transport | 18.10% | ||
| IDR 9,000,001–IDR 12,000,000 | 16.50% | Ride-sourcing Modes | Motorcycle-based | 81.70% | |
| >IDR 12,000,000 | 14.90% | Car-based | 18.30% | ||
* The respondents are adults. An adult in Indonesia is defined as someone who is 16 years old or more. This means that these people can decide on their own travel. ** Previous mode means the modes that respondents used before ride-sourcing was established. ‡ 14,000 IDR is equal to 1 USD (2018).
Table 2.
Descriptive Analysis of Perceived Usefulness and Perceived Services of the Ride-Sourcing Services.
Table 2.
Descriptive Analysis of Perceived Usefulness and Perceived Services of the Ride-Sourcing Services.
| Perceiving … | Mean | Std. Dev. | Var. |
|---|---|---|---|
| Overall perceived usefulness | 4.449 | 0.601 | 0.361 |
| Broad areas of coverage | 3.899 | 0.646 | 0.417 |
| 24-h services | 3.883 | 0.689 | 0.474 |
| Ease of getting to the services | 3.686 | 0.829 | 0.688 |
| Reliable drivers | 3.676 | 0.774 | 0.598 |
| User-friendly applications | 3.759 | 0.72 | 0.518 |
| Reliable vehicles | 3.668 | 0.733 | 0.537 |
| Cleanliness and comfort of the vehicles | 3.73 | 0.619 | 0.383 |
| Skilful drivers | 3.759 | 0.624 | 0.389 |
| More fare incentives | 3.855 | 0.745 | 0.556 |
| Benefits of cashless payment | 3.841 | 0.685 | 0.469 |
| Shorter waiting time | 3.656 | 0.704 | 0.496 |
| Shorter travel time | 3.718 | 0.76 | 0.578 |
| Reliable travel time | 3.728 | 0.639 | 0.408 |
| More productive time during the trips due to travel with multi-tasking | 3.773 | 0.706 | 0.499 |
| Lower travel cost | 3.612 | 0.845 | 0.714 |
| More productive time in a whole day due to the saved travel time | 3.742 | 0.68 | 0.462 |
| Vehicle breakdown during the trip | 1.203 | 0.476 | 0.227 |
| Uncomfortable driving | 1.525 | 0.654 | 0.427 |
| Careless drivers | 1.509 | 0.663 | 0.44 |
| Navigation problems with the driver | 1.221 | 0.519 | 0.269 |
| Non-transparent fares | 1.336 | 0.658 | 0.433 |
| Misinformation from the applications | 1.71 | 0.693 | 0.48 |
| Navigation problems with the applications | 1.497 | 0.629 | 0.396 |
| Drivers’ bad behaviour | 1.362 | 0.573 | 0.328 |
| Accidents during the trips | 1.543 | 0.628 | 0.394 |
| Criminality during the trips | 1.074 | 0.325 | 0.105 |
Table 3.
Factor Analysis of Respondents’ Attitude Towards Ride-sourcing and Negative Experiences.
| Perceiving… | Components | ||||||
|---|---|---|---|---|---|---|---|
| On Journey Advantages | Before Journey Advantages | Travel Disadvantages | |||||
| Reliable Travel Time | More Productive Time | Reliable Vehicles and Drivers | Reliable Coverage | Reliable Applications and Costs | Travel Disadvantages | Extraordinary Events | |
| Shorter waiting time | 0.735 | ||||||
| Shorter travel time | 0.707 | ||||||
| Reliable travel time | 0.672 | ||||||
| More productive time during the trips due to travel with multi-tasking | 0.628 | ||||||
| More productive time in a whole day due to the saved travel time | 0.550 | ||||||
| Reliable drivers | 0.662 | ||||||
| Reliable vehicles | 0.532 | ||||||
| Cleanliness and comfort of the vehicles | 0.799 | ||||||
| Skilful drivers | 0.703 | ||||||
| Broad areas of coverage | 0.631 | ||||||
| 24-hour services | 0.822 | ||||||
| Ease of getting to the services | 0.789 | ||||||
| User-friendly applications | 0.528 | ||||||
| More fare incentives | 0.811 | ||||||
| Benefits of cashless payment | 0.714 | ||||||
| Lower travel cost | 0.551 | ||||||
| Vehicle breakdown during the trip | 0.583 | ||||||
| Uncomfortable driving | 0.596 | ||||||
| Careless drivers | 0.652 | ||||||
| Navigation problems with the driver | 0.502 | ||||||
| Drivers’ bad behaviour | 0.682 | ||||||
| Non-transparent fares | 0.564 | ||||||
| Misinformation from the applications | 0.781 | ||||||
| Navigation problems with the applications | 0.775 | ||||||
| Accidents during the trips | 0.831 | ||||||
| Criminality during the trips | 0.822 | ||||||
| Extraction Method: Principal Component Analysis; Rotation Method: Varimax with Kaiser Normalisation | |||||||
| Kaiser-Meyer-Olkin Measure of Sampling Adequacy | 0.853 | ||||||
| Bartlett’s Test of Sphericity [χ2; df.; p-value] | [5034.354; 460; 0.000] | ||||||
Loading less than 0.5 were suppressed.
Table 4.
Factor Analysis of Respondents’ Built Environment Attributes.
| Perceiving to Reside in an Area… | Component | |||
|---|---|---|---|---|
| Residing in Well-Developed or Richer Neighbourhoods | Closer to Public Transport and Pedestrian Networks | Closer to Various Public Amenities | High Population Density with High Social Interactions | |
| With more bungalow houses | 0.688 | |||
| With available parking space | 0.787 | |||
| With a well-designed neighbourhood | 0.835 | |||
| With wealthier neighbourhoods | 0.706 | |||
| With tidy arrangements and more trees | 0.726 | |||
| Closer to public transport networks | 0.523 | |||
| Closer to pedestrian facilities | 0.786 | |||
| With comfortable pedestrian facilities | 0.803 | |||
| Closer to parks and green space | 0.637 | |||
| Closer to sport facilities | 0.611 | |||
| With sufficient street lighting | 0.524 | |||
| Closer to shopping facilities | 0.682 | |||
| Closer to public facilities | 0.686 | |||
| Closer to city centre | 0.72 | |||
| Closer to main road | 0.755 | |||
| With good internet network | 0.686 | |||
| With a high population in the district/sub-district level | 0.807 | |||
| With a high population at neighbourhood level | 0.851 | |||
| With high social interaction | 0.641 | |||
| Extraction Method: Principal Component Analysis; Rotation Method: Varimax with Kaiser Normalisation | ||||
| Kaiser-Meyer-Olkin Measure of Sampling Adequacy | 0.904 | |||
| Bartlett’s Test of Sphericity [χ2; df.; p-value] | [4445.847; 190; 0.000] | |||
Loading less than 0.5 were suppressed.
Table 5.
Estimates of Perceived Usefulness of Ride-Sourcing Service.
| Variables | Standardised Coefficient | t-Stat |
|---|---|---|
| Intercept | 30.193 ** | |
| Personal Characteristics * | ||
| Post-graduates (D) | 0.063 | 1.506 |
| Male travellers (D) | −0.016 | −0.376 |
| >9,000,000 IDR income (D) | −0.045 | −1.023 |
| <8 working hours (D) | −0.083 | −1.948 * |
| 25–40 years old (D) | −0.09 | −2.123 ** |
| Travel Characteristics * | ||
| MBRS users (D) | 0.053 | 1.247 |
| Less than 2 months ride-sourcing experience (D) | −0.082 | −1.982 ** |
| Waiting time more than 15 min (D) | −0.048 | −1.153 |
| Previously using car (D) | −0.033 | −0.735 |
| Previously using public transport (D) | −0.093 | −2.075 ** |
| Endogenous variables of built Environment characteristics | ||
| Endogenous variables of well-developed or richer neighbourhoods | 0.003 | 0.07 |
| Endogenous variables of closer to various public amenities | 0.076 | 1.641 |
| Endogenous variables of high population density with high social interactions | 0.057 | 1.288 |
| Multitasking Characteristics | ||
| Read/Send e-mail (D) | −0.09 | −2.114 ** |
| Listening to music (D) | 0.093 | 2.237 ** |
| Social media (D) | 0.043 | 1.01 |
| Enjoying view (D) | −0.084 | −1.977 ** |
| Endogenous variables of on and Before Journey Advantages and Travel Disadvantages | ||
| Endogenous variables of reliable coverages | 0.107 | 2.192 ** |
| Endogenous variables of reliable applications and costs | 0.157 | 3.016 ** |
| Endogenous variables of reliable vehicles and drivers | 0.177 | 3.391 ** |
| Endogenous variables of reliable travel time | −0.013 | −0.255 |
| Endogenous variables of more productive time | 0.024 | 0.473 |
| Endogenous variables of travel disadvantages | 0.001 | 0.012 |
| ANOVA [F; p-value] | [6.440; 0.000] | |
| R; R2 | [0.488; 0.238] | |
Table 6.
Estimates of Frequency of Ride-sourcing Usage.
| Variables | Standardised Coeff. | t-Stat |
|---|---|---|
| Threshold | ||
| <4 times/month | 0.656 | |
| 4–6 times/month | 1.455 | |
| 7–14 times/month | 2.280 ** | |
| Variables | ||
| Endogenous variable of perceived travel usefulness^ | 0.192 | 1.912 * |
| Personal Characteristics | ||
| 16–18 years old (D) | −0.117 | −2.383 ** |
| Male travelers (D) | 0.116 | 2.302 ** |
| Post-graduates (D) | 0.106 | 2.036 ** |
| Travel Characteristics | ||
| Less than 5 min waiting time (D) | 0.137 | 2.691 ** |
| MBRS users (D) | −0.133 | −2.666 ** |
| Less than 2 months ride-sourcing experience (D) | −0.099 | −1.986 ** |
| Previously using car (D) | −0.087 | −1.703 * |
| Previously using public transport (D) | −0.186 | −3.388 ** |
| Built Environment | ||
| Residing in well-developed or richer neighbourhoods | −0.162 | −3.176 ** |
| Closer to public transport networks | 0.092 | 1.844 * |
| Closer to various public amenities | 0.111 | 2.087 ** |
| High population density with high social interactions | −0.061 | −1.18 |
| Multitasking Characteristics | ||
| Phone call (D) | −0.067 | −1.367 |
| Eating/drinking (D) | 0.049 | 1.01 |
| Enjoying view (D) | −0.068 | −1.281 |
| Chatting (D) | −0.142 | −2.923 ** |
| On and Before Journey Advantages and Travel Disadvantages | ||
| Endogenous variables of reliable coverages | −0.092 | −1.438 |
| Endogenous variables of reliable vehicles and drivers | −0.16 | −2.053 ** |
| Endogenous variables of reliable travel time | 0.144 | 2.286 ** |
| Endogenous variables of more productive time | 0.12 | 2.043 ** |
| Endogenous variables of super-ordinary events | −0.051 | −0.912 |
| −2LL (0); −2LL (β); [χ2; df.; p-value] | −1262.461; −1168.002 | |
| [94.459; 22; 0.000] | ||
| Cox and Snell R2; Nagelkerke R2; McFadden R2 | [0.173; 0.188; 0.075] | |
| Test of Parallel Lines [χ2; df.; p-value] | [51.267; 44; 0.210] | |
Publisher’s Note: MDPI stays neutral with regard to jurisdictional claims in published maps and institutional affiliations. |
© 2021 by the authors. Licensee MDPI, Basel, Switzerland. This article is an open access article distributed under the terms and conditions of the Creative Commons Attribution (CC BY) license (https://creativecommons.org/licenses/by/4.0/).
Share and Cite
MDPI and ACS Style
Rizki, M.; Joewono, T.B.; Dharmowijoyo, D.B.E.; Prasetyanto, D. The Effects of On- and Before- Journey Advantages Using Ride-Sourcing in Indonesia. Sustainability 2021, 13, 11117. https://0-doi-org.brum.beds.ac.uk/10.3390/su131911117
AMA Style
Rizki M, Joewono TB, Dharmowijoyo DBE, Prasetyanto D. The Effects of On- and Before- Journey Advantages Using Ride-Sourcing in Indonesia. Sustainability. 2021; 13(19):11117. https://0-doi-org.brum.beds.ac.uk/10.3390/su131911117
Chicago/Turabian StyleRizki, Muhamad, Tri Basuki Joewono, Dimas Bayu Endrayana Dharmowijoyo, and Dwi Prasetyanto. 2021. "The Effects of On- and Before- Journey Advantages Using Ride-Sourcing in Indonesia" Sustainability 13, no. 19: 11117. https://0-doi-org.brum.beds.ac.uk/10.3390/su131911117
Note that from the first issue of 2016, this journal uses article numbers instead of page numbers. See further details here.