Article

Identification of the Dominant Factors in Groundwater Recharge Process, Using Multivariate Statistical Approaches in a Semi-Arid Region

by
José Luis Uc Castillo
1,
José Alfredo Ramos Leal
1,
Diego Armando Martínez Cruz
2,
Adrián Cervantes Martínez
3 and
Ana Elizabeth Marín Celestino
4,*
1
Instituto Potosino de Investigación Científica y Tecnológica, A.C. División de Geociencias Aplicadas, Camino a la Presa San José 2055, Lomas 4a Sección, San Luis Potosí 78216, Mexico
2
CONACYT-Centro de Investigación en Materiales Avanzados, S.C. Calle CIMAV 110, Ejido Arroyo Seco, Col. 15 de mayo (Tapias), Durango 34147, Mexico
3
Unidad Académica Cozumel, Universidad de Quintana Roo, Av. Andrés Quintana Roo, Calle 11 con calle 110 sur s/n, Cozumel 77600, Mexico
4
CONACYT-Instituto Potosino de Investigación Científica y Tecnológica, A.C. División de Geociencias Aplicadas, Camino a la Presa San José 2055, Col. Lomas 4ta Sección, San Luis Potosí 78216, Mexico
*
Author to whom correspondence should be addressed.
Sustainability 2021, 13(20), 11543; https://0-doi-org.brum.beds.ac.uk/10.3390/su132011543
Submission received: 31 August 2021 / Revised: 15 October 2021 / Accepted: 15 October 2021 / Published: 19 October 2021

Abstract

:
Identifying contributing factors of potential recharge zones is essential for sustainable groundwater resources management in arid regions. In this study, a data matrix with 66 observations of climatic, hydrogeological, morphological, and land use variables was analyzed. The dominant factors in groundwater recharge process and potential recharge zones were evaluated using K-means clustering, principal component analysis (PCA), and geostatistical analysis. The study highlights the importance of multivariate methods coupled with geospatial analysis to identify the main factors contributing to recharge processes and delineate potential groundwater recharge areas. Potential recharge zones were defined into cluster 1 and cluster 3; these were classified as low potential for recharge. Cluster 2 was classified with high potential for groundwater recharge. Cluster 1 is located on a flat land surface with nearby faults and it is mostly composed of ignimbrites and volcanic rocks of low hydraulic conductivity (K). Cluster 2 is located on a flat lowland agricultural area, and it is mainly composed of alluvium that contributes to a higher hydraulic conductivity. Cluster 3 is located on steep slopes with nearby faults and is formed of rhyolite and ignimbrite with interbedded layers of volcanic rocks of low hydraulic conductivity. PCA disclosed that groundwater recharge processes are controlled by geology, K, temperature, precipitation, potential evapotranspiration (PET), humidity, and land use. Infiltration processes are restricted by low hydraulic conductivity, as well as ignimbrites and volcanic rocks of low porosity. This study demonstrates that given the climatic and geological conditions found in the Sierra de San Miguelito Volcanic Complex (SSMVC), this region is not working optimally as a water recharge zone towards the deep aquifer of the San Luis Potosí Valley (SLPV). This methodology will be useful for water resource managers to develop strategies to identify and define priority recharge areas with greater certainty.

1. Introduction

Groundwater recharge is an essential part of the hydrological cycle and an essential factor for the sustainable management of hydric resources [1,2,3,4]. Recharge feeds aquifers and is essential to balance the demand and supply of water to develop activities, particularly in arid and semi-arid regions [5,6,7]. In those regions, surface water is scanty, so groundwater is a safe resource to meet water supply needs of populations. Increased groundwater consumption has put pressure on natural recharge, altering the balance between recharge and discharge into aquifers [1,8,9]. The groundwater recharge process by precipitation in arid and semi-arid zones is highly variable in space due to the extreme climate (e.g., very high temperatures and evapotranspiration) and low rainfall of high intensity and short duration [8,9,10,11]. Likewise, the infiltration rate of rainfall that feeds the aquifers is conditioned to the geological structure within the basin. Conceptual understanding of the geological framework in the recharge process is complex. Accurate quantitative assessments of multiple parameters are needed to find associations and identify potential groundwater recharge zones. Researchers have included many variables and classified them as determining the source of recharge (rainfall, drainage, irrigation, etc.) [12,13,14,15,16,17] and those that influence infiltration (soil, land use, slope, geology, lithology, hydraulic conductivity, etc.) [18,19,20,21,22,23,24,25].
Multivariate statistical approaches have been robust tools for managing groundwater resources [26,27]. These methods have been successfully applied in various disciplines [25]. Previous studies have used cluster analysis (CA) and principal component analysis (PCA) to identify groundwater pollution sources, assess water quality, analyze groundwater recharge processes, and conduct environmental studies [25,26,27,28,29,30].
To our knowledge, there are few studies that have applied K-means clustering algorithm and PCA on variables as soil, slope, geology, vegetation, and rainfall, to identify the dominant factors controlling the groundwater recharge [25,28]. This could be due to the fact that in most regions there is not a suitable spatio-temporal characterization of geophysical variables. These techniques have been applied chiefly in hydrogeochemical investigations [31,32,33,34]. Moreover, geospatial analysis techniques have been helpful to understand the characteristics of recharge [8,35].
The Sierra de San Miguelito Volcanic Complex (SSMVC) is located in a semi-arid environment in the San Luis Potosi Valley (SLPV). Previous research reports that the SSMVC is a recharge zone that feeds the deep aquifer of the SLPV [24,36,37]. Other studies mention that the SSMVC could not be working optimally as a recharge area [38,39]. Nowadays, it is uncertain whether the SSMVC functions as a groundwater recharge zone. Therefore, a methodology is proposed by applying and analyzing with K-means clustering algorithm and PCA, combined with geospatial analysis to identify main variables that determine groundwater recharge processes and define potential recharge zones in the SSMVC.

2. Materials and Methods

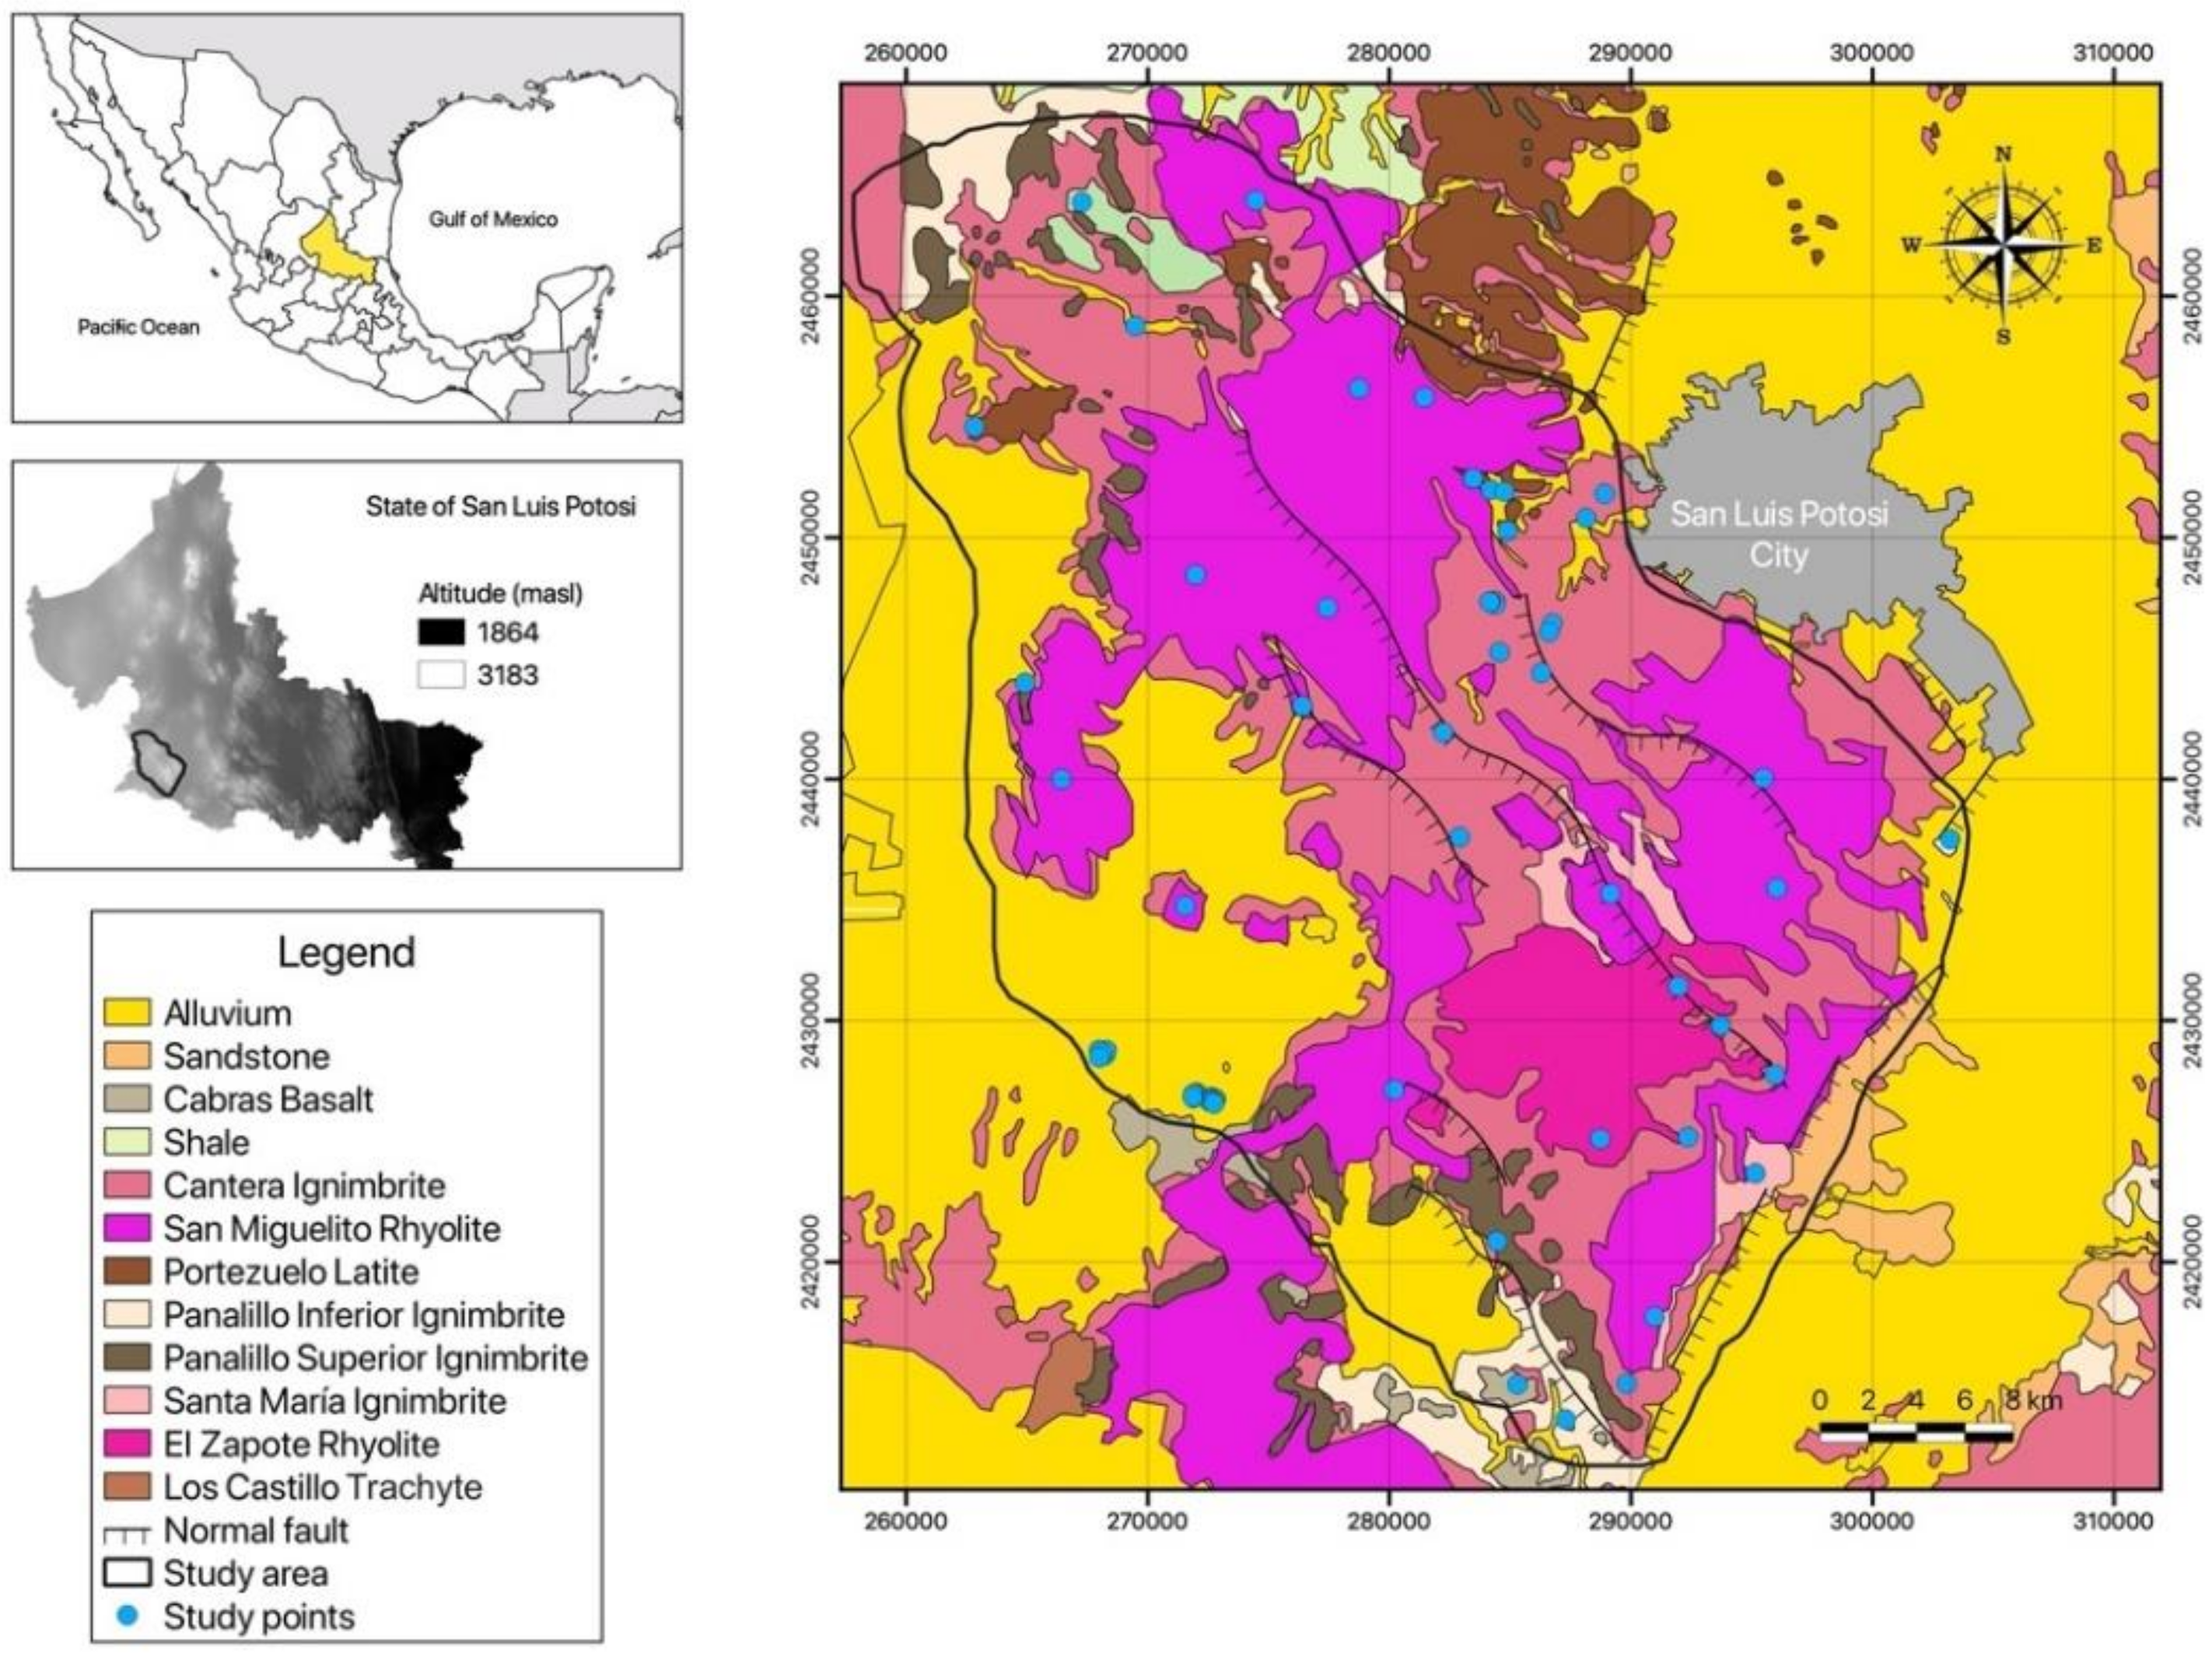
2.1. Description of the Study Area

The SSMVC is located in central Mexico, towards the western edge of the estate of San Luis Potosi; the study zone has an approximate extension of 149,669 ha (Figure 1). The area is steep and irregular, and it is characterized by having slopes greater than 30° and an altitude between 1900 and 2870 m above sea level (masl), classifying it as a high mountain range with plateaus [40,41,42]. The climate is semi-arid temperate, with an annual temperature that ranges between 20 and 22 °C [42]. Annual rainfall ranges between 400 and 600 mm, while evapotranspiration (2551 mm) exceeds average rainfall (408 mm) [42,43,44]. The predominant native plant species are Pinus cembroides Zucc. (1832) and Quercus potosina Trel. (1924), developed in soils classified as lithic-paralithic Leptosols in the highest parts of the sierra [41,45]. Other types of vegetation develop in the lower parts of the sierra, such as grasslands, chaparrals, and scrublands on soils of more significant proportion, such as regosols, phaeozems, and planosols [46].

2.1.1. Geology Settings

The geology of the SSMVC is of volcanic origin, made up of many silicic rocks from the Oligocene and Miocene (31 to 26 million years), where the Oligocene sequence is formed by lava flows of rhyolitic composition and ignimbrites. In contrast, the Miocene sequence is characterized by the emission of lavas that vary from basaltic (Cabras Basalt) to trachytes (Los Castillo Trachyte), this being the last volcanic activity in the area [47,48] (Figure 1). Structurally, the sierra contains several normal faults with strikes from 300° to 340°, and almost all have SW dip-directions ranging from 45° to 75° [49,50]. These faults were classified as a domino system because they show uniform fault dip direction and similar bed dip angles [50].

2.1.2. Hydrogeology Settings

The SLPV is limited to the west by the SSMVC and the east by the Sierra de Álvarez (SA); in the valley, the existence of two aquifers has been identified: (1) a shallow aquifer (hook) and (2) a deep aquifer (fractured volcanic), which are separated by a layer composed of compact fine sand with low hydraulic conductivity [16,51].
The material that makes up the shallow aquifer presents textural variations towards the SSMVC, conglomerates immersed in a clayey matrix predominate, and towards the SA this material thins, with silts and sands predominating [52,53]. The shallow aquifer has an approximate thickness of 5 to 40 m and a low hydraulic conductivity of ≈2 × 10⁻⁴ m/s; due to its shallow depth, it is susceptible to seasonal effects [52,54].
Additionally, the deep aquifer is formed by fractured volcanic rock and is confined in the center of the SLPV by a low permeable sedimentary layer, it is limited on one side by the Sierra de San Miguelito and on the other side by the SA, and it has a low hydraulic conductivity of the order from ≈2 × 10⁻⁴ m/s [43,46]. Its upper limit is approximately 100 to 150 m deep [39].
Between the shallow and deep aquifer is a granular layer, which is mainly composed of Quaternary clastic materials, the thickness of which varies from 100 to 200 m. This layer is confined in the center and is exploited by pumping wells with a depth of up to 350 m [52,55].

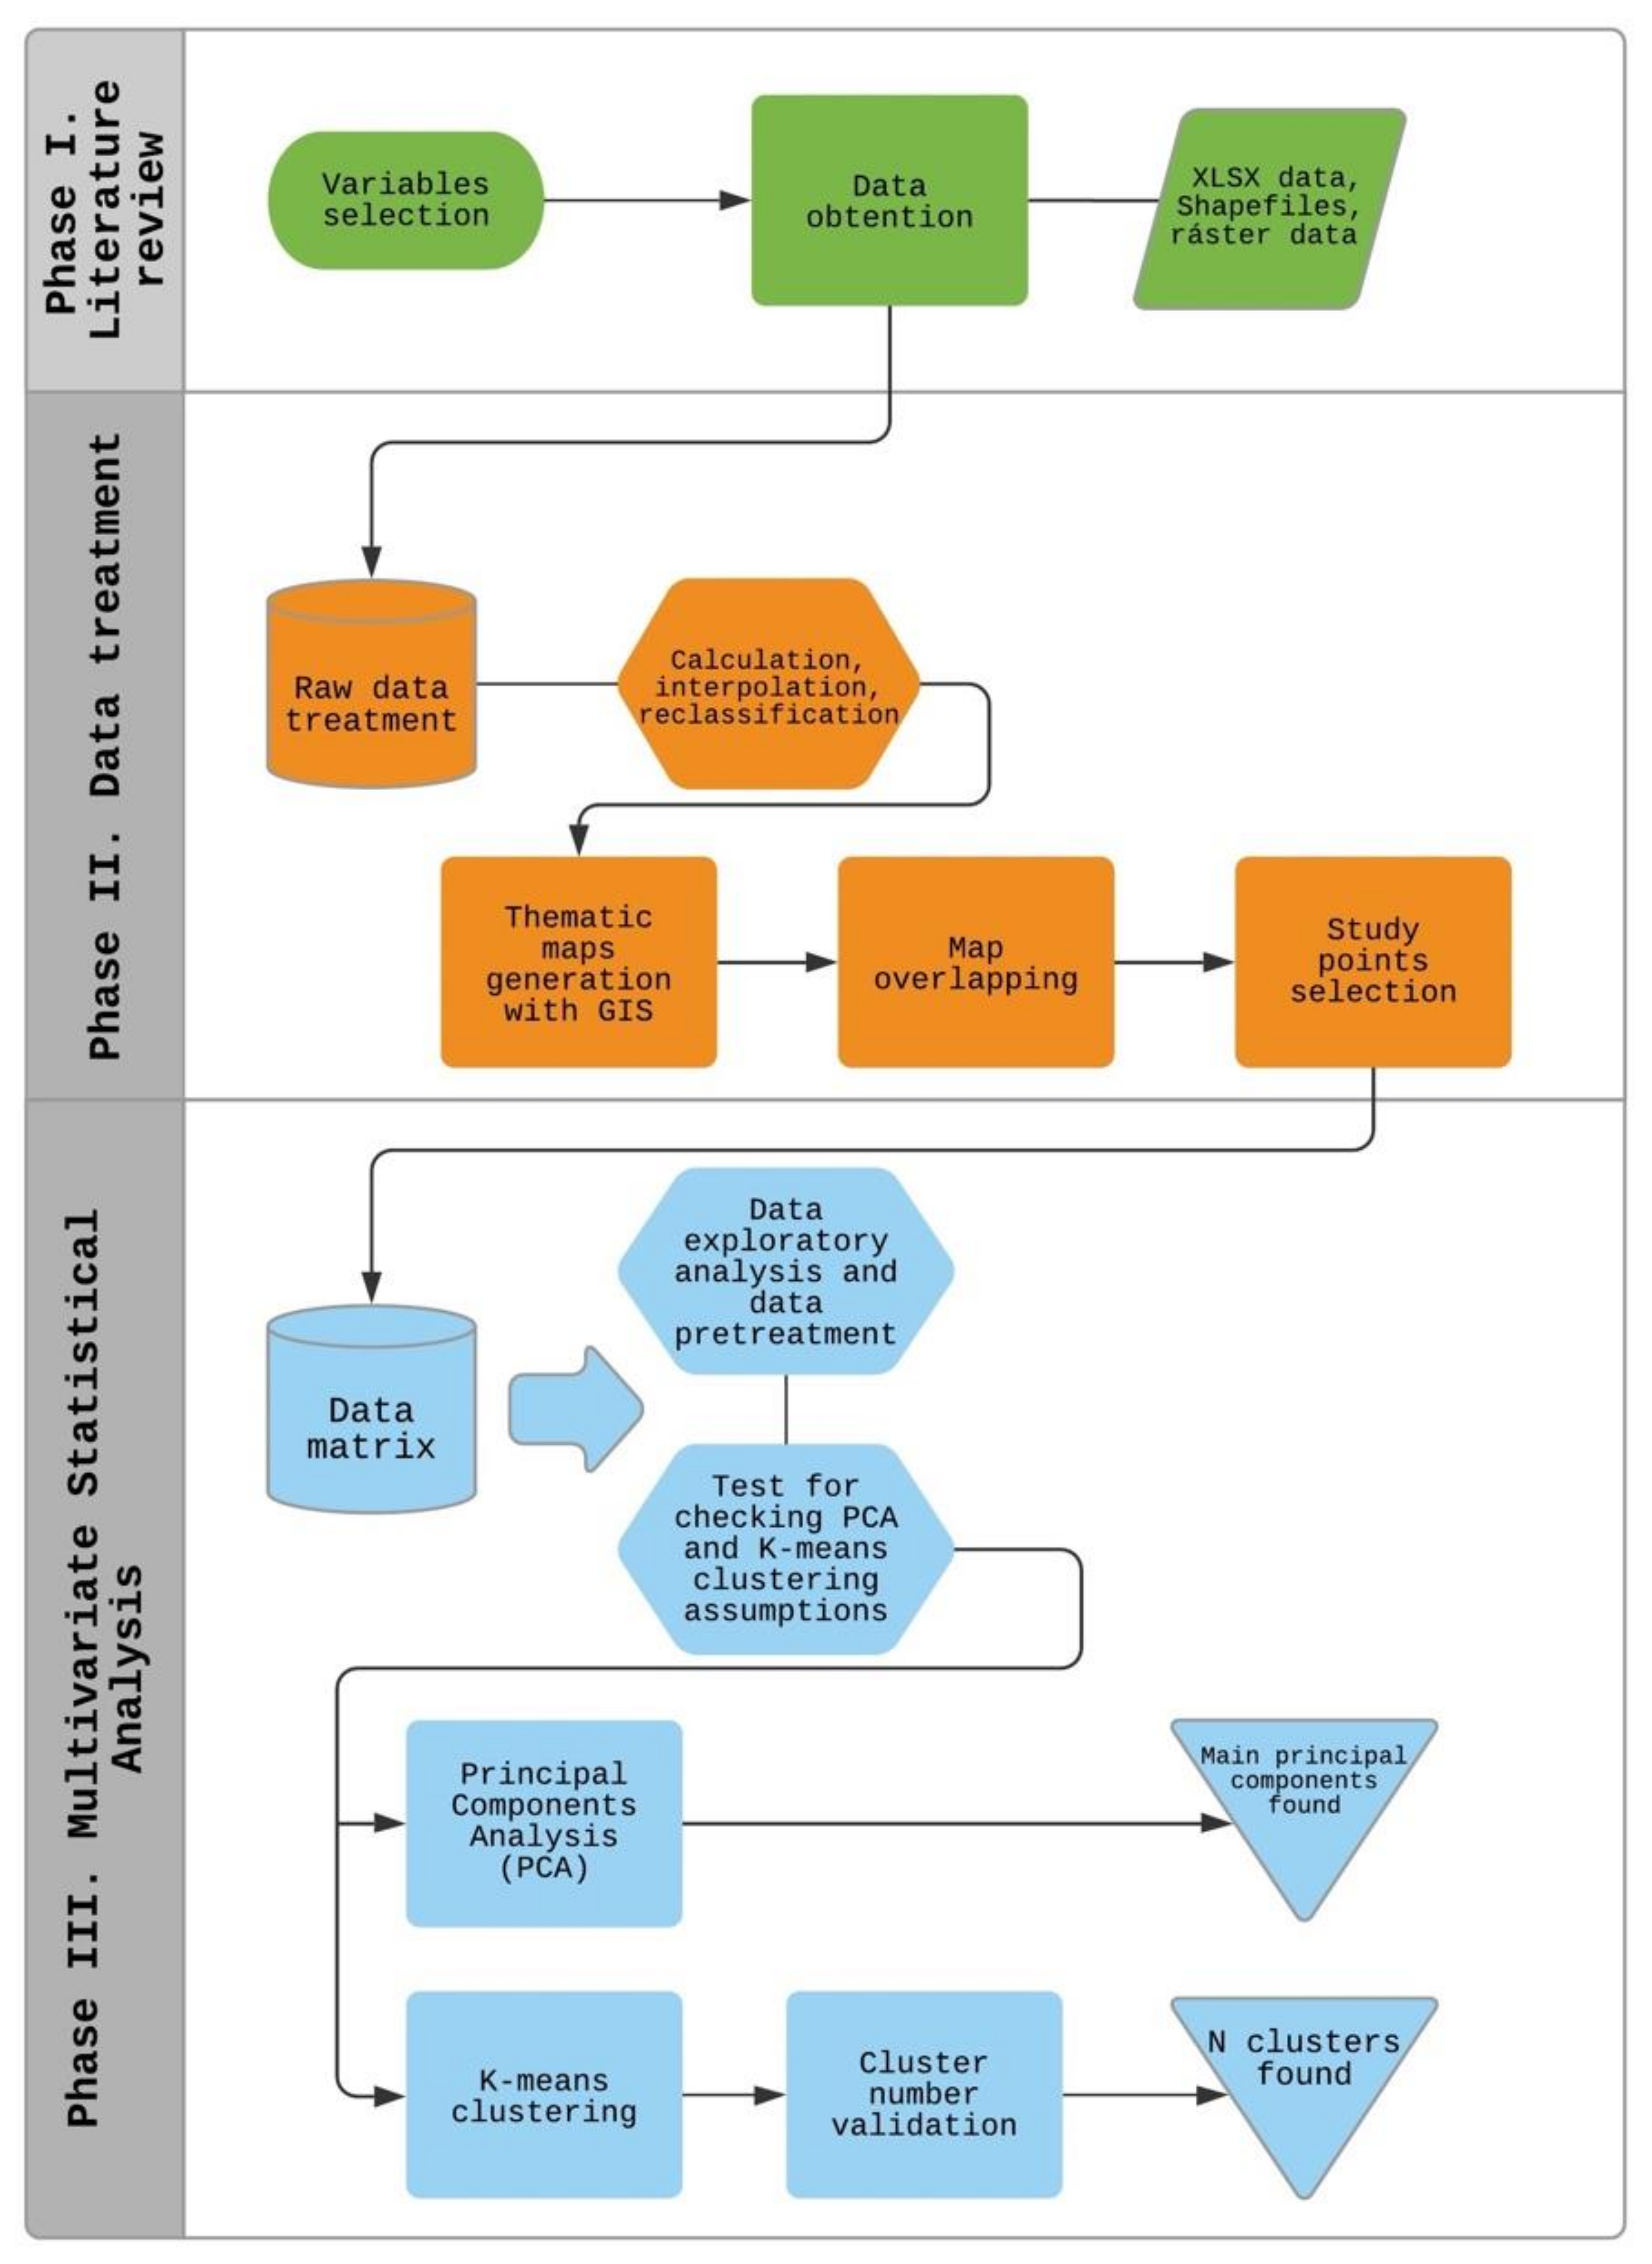
2.2. Research Approach

The approach used in this research included three components: Phase I Literature review, where the variables were selected and the data obtained from several sources; Phase II Raw data treatment, which included the generation of thematic maps and the study point selection; and Phase III, Multivariate statistical analysis, including PCA analysis and K-means clustering (Figure 2).

2.2.1. Phase I Literature Review

Twelve variables were selected: altitude (masl), slope (%), temperature (°C), soil type, vegetation type, rainfall (mm/year), relative humidity (%), potential evapotranspiration (PET, mm/year), land use, runoff coefficient, hydraulic conductivity (K, m/d), and geology. The data were obtained from INEGI and Climate Forecast System Reanalysis (CFSR) in shp, raster, and xlsx formats.

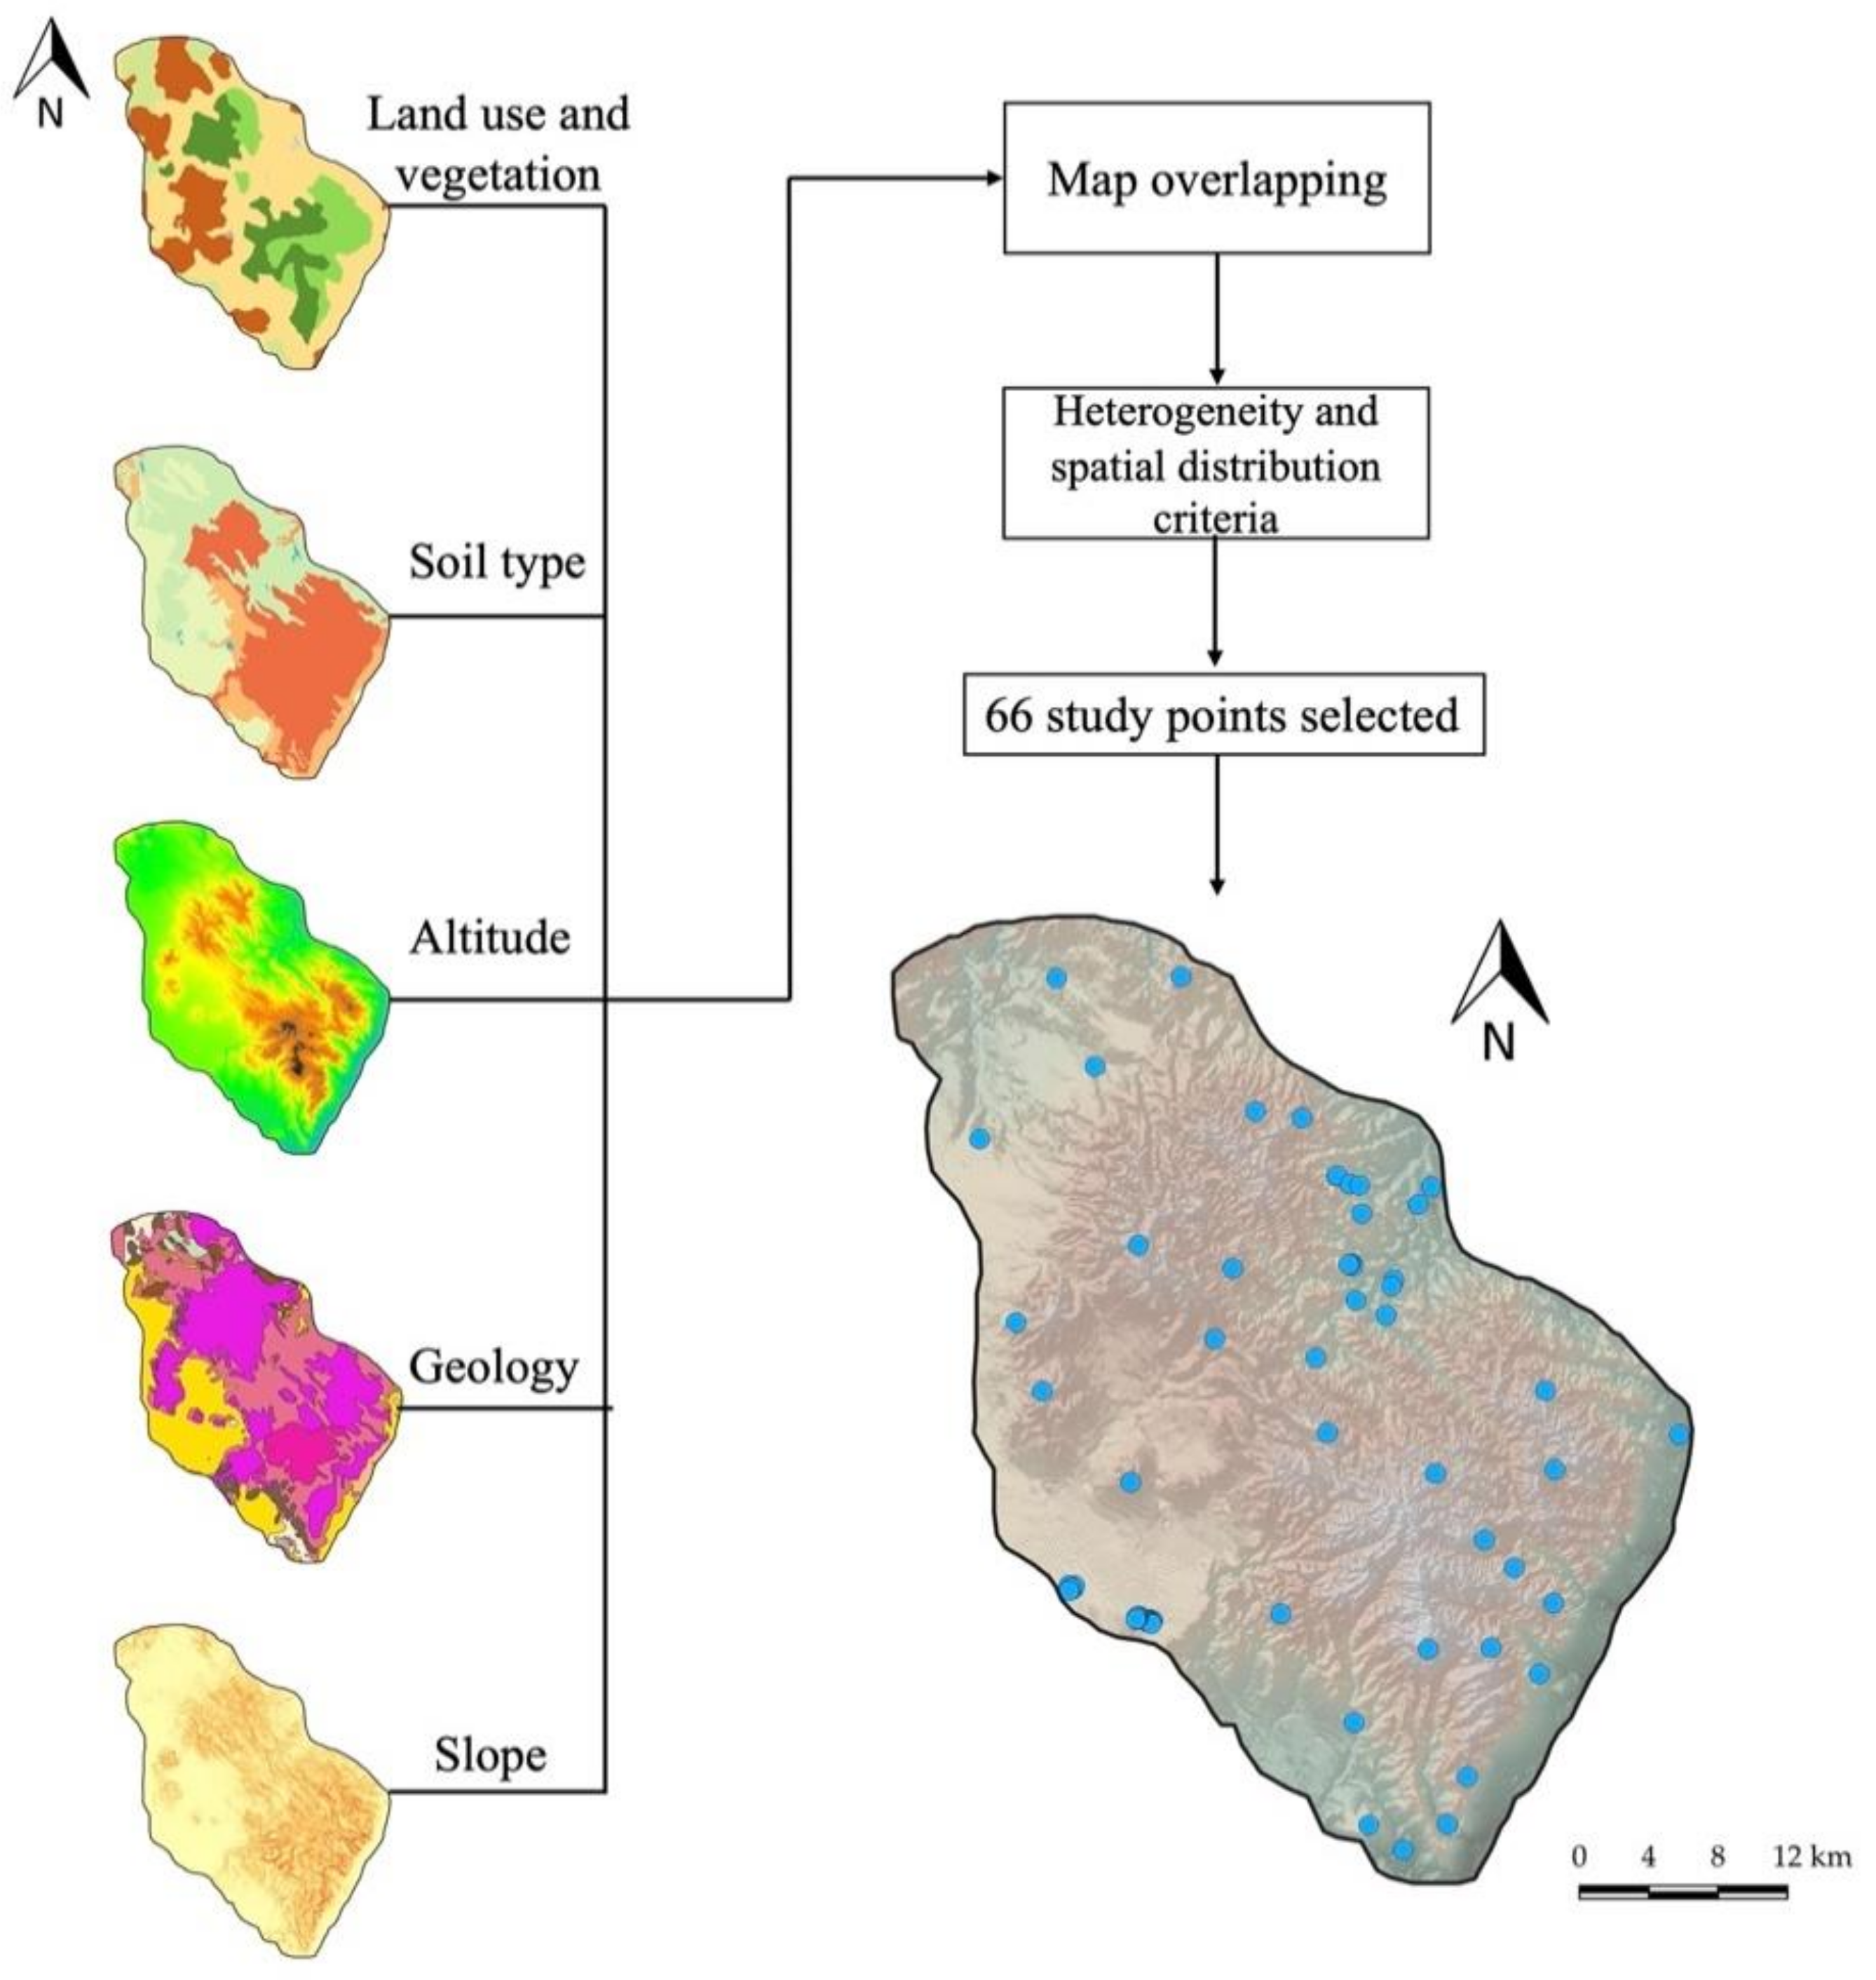
2.2.2. Phase II Data Treatment

To realize the corresponding thematic maps, vector data in shapefile format of land use and vegetation type and soil type were obtained from INEGI for the years 2013 and 2007, respectively. A geological map of the study area was made, taking reference from the maps used by [43,48].
The altitude and slope variables were obtained from the Mexican Continuous of Elevations (CEM 3.0 in Spanish) of INEGI for San Luis Potosi, extracting the level curves of the study zone and obtaining slope ranges, generating the respective thematic maps.
The thematic maps generated were made with QGIS v. 3.4.0 Madeira, which allows handling and analyzing spatial information as well as superimposing thematic layers. Cartographic information was used under the WGS84 datum coordinate system at a scale of 1:250,000. Thematic layers of land use and vegetation, soil type, altitude, geology, and slope were overlapped to define the study points (Figure 3). Through the map overlap, attributes of each entity were intersected, allowing the identification of points with different characteristics as well as their spatial distribution. A total of 66 points were selected considering this criterion (Figure 1).
Data of rainfall, relative humidity, and temperature were employed. The data sets were downloaded from the CFSR for nine reference points close to the study area over a 34-year period (1979 to 2013). PET was calculated through Thornthwaite method [56] based on the mean temperature and astronomical duration of the day for a specific latitude (See Supplementary Materials, Table S1). An interpolation was carried out with the Inverse Distance Weighting (IDW) method, considering the average values obtained at each reference point. The values of climatic variables were obtained for each study point.
The runoff coefficient was determined, considering the Prevert Coefficient [57] (See Supplementary Materials, Table S2), which encompasses three conditions: land use, soil texture, and terrain slope. This coefficient was supplemented with the Chow Coefficient [58] (See Supplementary Materials, Table S3) because Prevert does not consider land use for urban areas. For the determination of K, data from previous studies in the SSMVC were taken [59,60], as well as values reported in hydraulic conductivity tests carried out in similar geological units and considering characteristics such as slope, altitude, proximity to the fault zone and fractures, etc. [61,62,63,64,65,66,67]. The values employed were transformed into meters per day (m/d). The runoff coefficient and K values were obtained for each study point.

2.2.3. Phase III Multivariate Statistical Analysis

A data matrix with 66 study points and 12 variables was integrated. Those qualitative variables were transformed into quantitative variables through coding to facilitate their handling.
The optimal results in applying multivariate statistical techniques require a univariate and multivariate normal distribution and homogeneity of variances (homoscedasticity) [26,27,68,69,70]. The univariate and multivariate normal distribution was verified by Shapiro-Wilk’s test [71] and Royston’s test [72], respectively. A non-normal distribution was observed on the data matrix in both tests. A logarithmic transformation (natural logarithm) was applied to the original data matrix to achieve a normal-like distribution. The Kolmogorov-Smirnov (K-S) test evaluated the adjustment of the transformed variables to the normal log distribution, being favorable (p-value < 0.05).
The database was scaled through standardization to achieve the optimal conditions for multivariate analysis. Standardization reduces the difference in variances in variables and prevents dissimilarity measures like the Euclidian distance obtained from being affected [27,73]. Each variable was standardized to their corresponding Z scores, which were calculated by Equation (1):
Z i = X i m e a n S
where Zi is the standardized Z score, Xi is the value for each variable, and mean and S are the mean value and the standard deviation of each variable, respectively.
The Kaiser Meyer Olkin (KMO) and Bartlett’s sphericity tests were applied to assess the precision and suitability of the data for PCA. KMO is used to measure the adequacy of the sampling, designating the portion of shared variance. A value close to 1 commonly indicates that PCA may be useful [26,27,74]. In this study, a valid KMO value of 0.77 was obtained (See Supplementary Materials, Table S4). Bartlett’s sphericity test allows to validate that the analyzed variables are adequately correlated; small values (p-value < 0.05), as were obtained in this study, indicate a great relationship between variables.
Correlation analysis is used to measure and establish the interrelation between two variables [75]. Based on the results obtained in the Shapiro-Wilk test, the most appropriate correlation method was selected [75,76]. Due to the variables presented a non-normal distribution (p-value < 0.05) (See Supplementary Materials, Table S5), the Spearman correlation method was employed. In this work, the criteria established by [27] were used; a value of r greater than 0.7 indicates a high correlation, and a value of r between [0.5, 0.7] denotes a moderate association.
Cluster analysis aims to classify a sample into small groups based on similarities between units and differences between groups [26,73,77]. The K-means algorithm was used, which divides the data into a number of clusters specified by the user and characterized by centroids [73,78]. In each repetition, the occurrences are assigned to the closest groups based on the Euclidean distance between instances and centroids (Equation (2)), such that the squared error between the empirical means of a group and the points in the groups is minimized [77,78].
d Z p , Z q = Z p Z q 2 = i j = 1 D Z p j Z q j
where d is the distance, Zp is the point in the space representing a given object, Zq is cluster q, Zpj is known as the jth attribute of the pth instance, Zqj is the jth attribute of the qth cluster, and D is known as the total number of attributes. The K-means grouping was formulated as the sum of the squared errors [26,77,79], as shown in Equation (3):
K = l = 1 k x C l x m l 2
where Χ = x 1 , . . . . . ,   x n is the data,   m l = x C l x n 1 is known as the centroid of cluster Cl, 1 ≤ 1 ≤ K, n1 is the number of data objects in the cluster, and K is the number of clusters.
The main purpose of the PCA is to explain the variance within a data set while reducing the dimensionality of its structure [25,26,80]. PCA was carried out to transform the original correlated variables into a smaller set of uncorrelated variables called the principal components (PCs) [69,81,82]. PCs are expressed as loadings, which indicate the relative contribution of a given variable to each of the extracted PCs [81]. The principal component (PC) is expressed by Equation (4) according to [83]:
Z i j = a i 1 x 1 j + a i 2 x 2 j + a i 3 x 3 j + + a i m x m j
where Z is the component score, a is the component loading, x is the estimated value of the variable, i is the component number, j is the sample number, and m is the total number of variables.
The PCs were chosen based on the eigenvalues (>1) and the cumulative percentage of the dataset variance.
The software RStudio v. 1.3.959 (Copyright RStudio Inc., Boston, MA, USA) was employed to perform data pretreatment, descriptive statistics, correlation matrix, K-means clustering algorithm, and PCA.

3. Results and Discussion

3.1. Correlation among Variables

In this study, Spearman’s rank correlation (r) was applied to measure and determine the inter-variables relationships. The results obtained from Spearman’s correlation analyses are shown in Table 1.
Temperature and PET have the highest correlation coefficient (0.93). This could be due to increase air temperature during the last years in the study zone [84]. Previous research has reported similar correlations between temperature and evapotranspiration [85,86]. This could be attributed to high temperatures increasing evaporative demand, inducing humidity deficits and evaporative stress which will result in an increase in evapotranspiration that is partly dependent on climate [87]. This could be explained by intensive irrigation practices and urban sprawl in the study zone. However, temperature showed a high inverse correlation with relative humidity (−0.89), suggesting that with the increase of temperature, the humidity decreases and vice versa at high humidity, the temperature declines [88,89]. Studies reported by [52] have demonstrated that a low level of humidity is related to high temperature levels in the SSMVC. Similar studies have documented that the changes in climatic conditions, such as an increase in temperature, are associated with greater soil humidity deficits. This can decrease the magnitude of groundwater recharge affecting water availability [90].
A high positive correlation between relative humidity and land use (0.86) was obtained; this could be explained by the agricultural irrigation practices that have been intensified, including large areas of land [91,92,93]. PET obtained a high inverse correlation of −0.88 and −0.82 with humidity and rainfall, respectively; this reveals that the humidity and precipitation decrease when the PET increase and vice versa. This can be due to the evapotranspiration exceeding the average annual rainfall [51,52,53]. In semi-arid regions, approximately 90% of the rainfall is lost through evapotranspiration [94]. Additionally, the impact of climatic characteristics on groundwater recharge is indirectly determined by the PET on soil humidity. For example, a drier soil could delay groundwater recharge and make it difficult [95]. In previous studies in other countries, researchers reported that high evapotranspiration rates were principally related to decreases in humidity [96]. A negative association (−0.75) between temperature and rainfall can be attributed to elevated temperatures (40 °C) in the SLPV, causing a rise in evaporation and, consequently, a decrease in rainfall [44,52].
An inverse association of −0.82 and −0.78 was observed by land use with temperature and PET, respectively; this suggests that land use changes have altered the spatio-temporal temperature patterns [97,98]. It has likewise been observed that the evapotranspiration increased. Previous studies have attributed the land use and land cover change to increased evapotranspiration. This is due to anthropogenic activities and climate change. Some researchers have reported that land use and land cover change have greater effect on the hydrological cycle and, consequently, groundwater recharge dynamics [95,96,99]. Moreover, land use is negatively correlated with geology (−0.69) and soil type (−0.61); this could be because geology plays a significant role in the current land use. The local geology defines the soil type and processes in soils, and has an important impact on chemical and hydraulic characteristics [100]. The movement of water is determined by soil texture and composition. For example, sandier soils tend to have high groundwater recharge rates, while clayey soils tend to have restricted water movement [101]. Therefore, water infiltration into the soil is influenced by soil hydraulic properties, precipitation rate, and the initial water content of the soil [102]. This could provide vital information on potential groundwater recharge areas [103].
A moderate positive correlation between rainfall and humidity (0.66) was observed; low levels of humidity belonging to low rainfall (350 to 400 mm/year) in the study area could explain it [52]. Previous investigations in other regions obtained similar associations of 0.46 and 0.59 between rainfall and humidity [104,105].
Slope and runoff coefficients showed a moderate positive correlation (0.62); this could be due to the irregular steep slope, which favors greater runoff in the study zone, indicating that the runoff increase would decrease infiltration and vice versa [106,107,108]. This could be explained by steep slopes tending to decrease groundwater recharge due to the runoff flowing rapidly. Meanwhile, plains tend to improve groundwater recharge, because higher retention time contributes to rainwater infiltration of soils [109].
Moderate inverse associations of −0.59 and −0.53 were observed by geology with humidity and slope, respectively; this could be related to the presence of potential groundwater recharge zones. The SSMVC is characterized by faults and fractures, which could favor water infiltration [110]. Similar studies have considered largely geologic features to identify recharge potential zones [111]. This is due to the recharge involving complex interplay factors during the infiltration process from vadose zone and saturate zone.

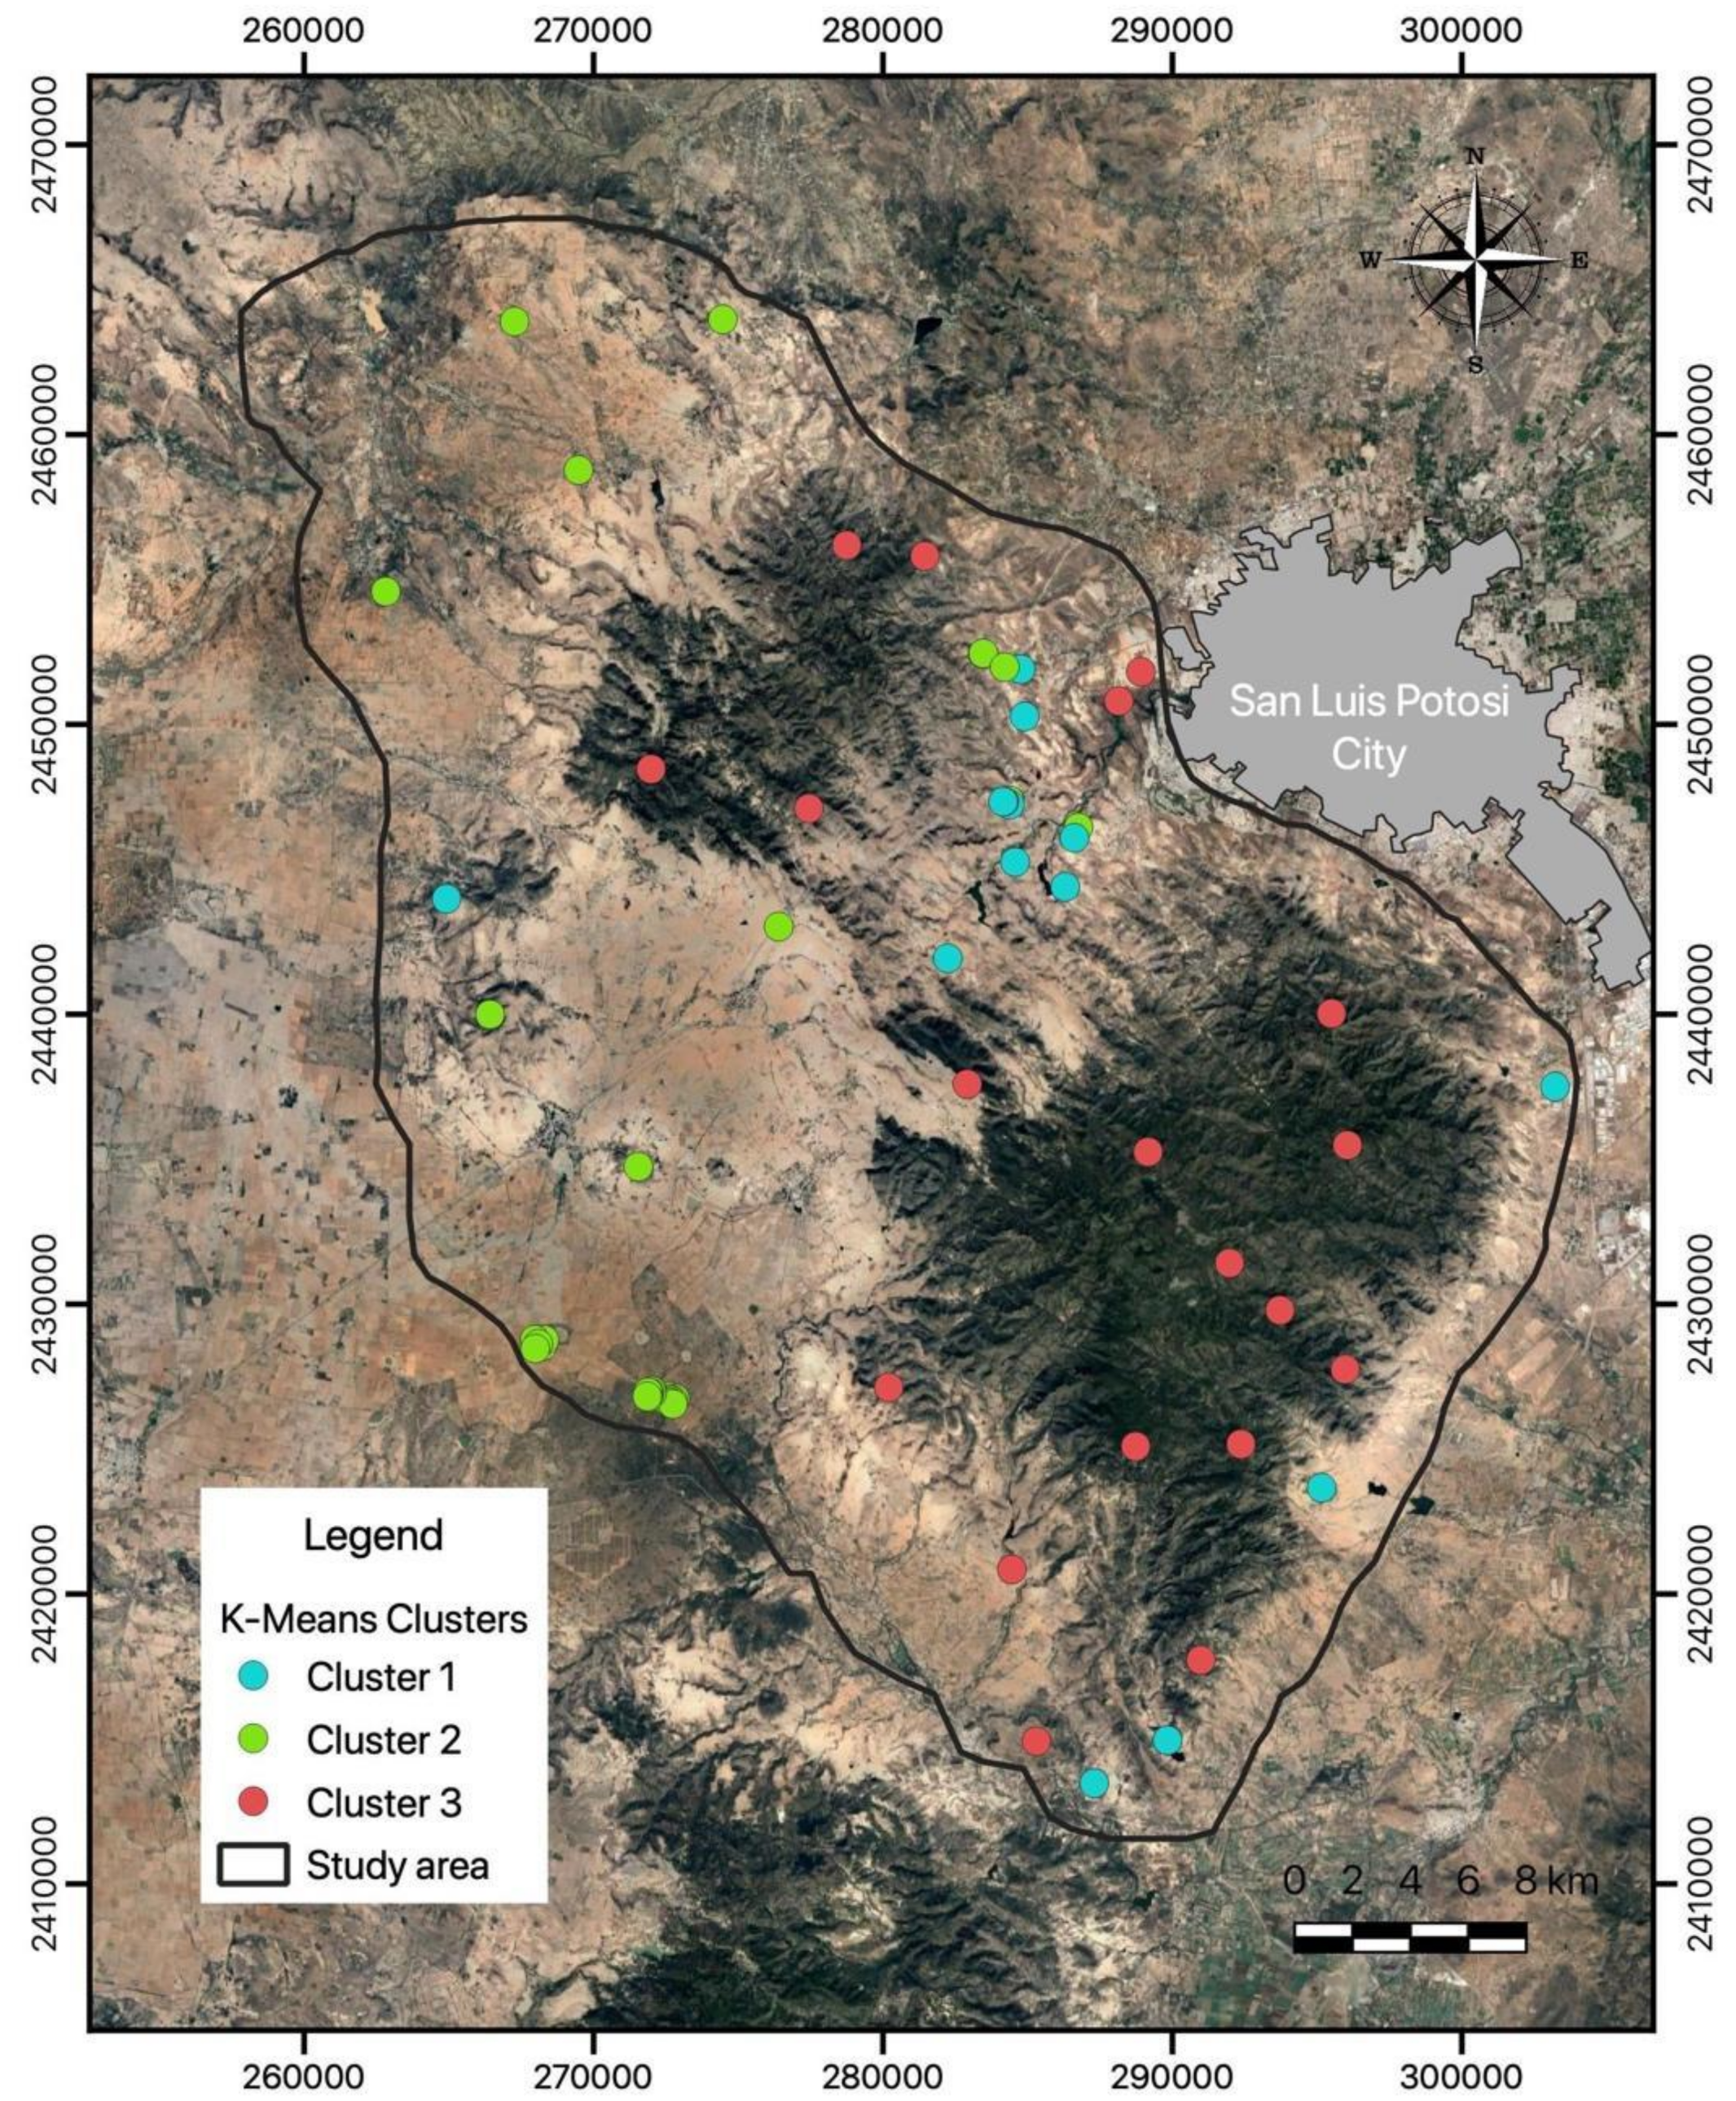
3.2. Cluster Analysis

Cluster analysis by the K-means clustering algorithm was applied to identify and define groups of sampling points based on their similarities and differences. The results obtained by the spatial cluster analysis are shown in Figure 4. Three principal groups were found with different characteristics related to their potential groundwater recharge.

3.2.1. Cluster 1

The first class (Cluster 1) is located in northeastern and southeastern parts of the SSMVC. Cluster 1 includes 23% of the total points analyzed (Figure 4) and showed low potential for groundwater recharge. The first group showed gentle slopes (0–5%) in most of the land (Table 2); this can be linked to lower runoff coefficients (0.20) observed in Cluster 1 (Table 3). Similar studies have reported that gentle slopes would have more contact time between water and soil layer, decreasing runoff and increasing surface infiltration [106,107,108,112]. Moreover, surface crusts favor the redistribution of water and its accumulation, which supports vegetation conservation [113]. This can contribute to groundwater recharge in the study zone. However, the occurrence of recharge is limited by the structure geologic, where group 1 was defined by ignimbrites and volcanic rocks of low porosity and hydraulic conductivity (Table 2). However, high hydraulic conductivity values (0.297 m/d) can be related to fractures or faults zones located in the southeastern and central parts, which could increase the hydraulic conductivity [61,63,114]. Therefore, diversities in the hydraulic properties and composition of superficial deposits could affect the subsurface dynamics of recharge to deeper aquifers [115,116,117]. Additionally, it found that natural grassland is the principal dominant vegetation of cluster 1 (Table 2). Previous researches have associated natural grassland and altitudes higher than 2300 masl to potential groundwater recharge [24]. Cluster 1 was characterized by an average altitude of less than 2300 masl (Table 3). This explains its low potential for groundwater recharge. The results are supported by similar studies, showing that the steep slopes with shallow rooted grasslands decrease surface runoff and favor infiltration, thus leading to an increase in groundwater recharge rates [118,119].

3.2.2. Cluster 2

The second class (Cluster 2) is located southwest and northwest of the SSMVC. Cluster 2 comprises 48% of the total number of points studied (Figure 4) and showed a high potential for groundwater recharge. The geological setting of Cluster 2 is mostly of alluvium (Table 2), which tends to increase hydraulic conductivity [28,67]. Groundwater recharge is significantly influenced by lithology based on natural topography, slope, faults, fracture extension, interbedded strata type, and their sequence stratigraphic in which highly compacted layers reduce the recharge [120]. Gentle slopes of 0–5% and low runoff coefficients were identified (Table 2 and Table 3); this could increase of infiltration and the presence of groundwater recharge areas. However, the lowest values (mean = 0.07 m/d) of hydraulic conductivity were observed. Meanwhile, mean values of K of 0.29 m/d and 0.44 m/d were found in Clusters 1 and 3, respectively (Table 3); this may be due to the predominant soil types being planosols, soils with low hydraulic conductivity [46,121]. When soils are flooded during the rainy season, the water is employed in irrigation practices (Table 2). Although studies have reported that agricultural zones have high groundwater recharge potential [28,122], they are also associated with climatic patterns such as temperature, humidity, precipitation, and evapotranspiration. Therefore, high evapotranspiration rates and planosol soil type could limit the superficial infiltration, hindering the natural recharge towards the deep aquifer. In semi-arid environments, the occurrence of efficient recharge is determined by several soil properties, like the porosity, drainage patterns, slope, class of soils, and weather. Therefore, it is essential to understand the groundwater resource condition, their occurrence, movement, and surface–groundwater interactions in drylands [115,123].

3.2.3. Cluster 3

The third class (Cluster 3) is situated south and northeast of the study zone. Cluster 3 includes 29% of the total number of points sampled (Figure 4) and showed low potential for groundwater recharge. The highest altitude (2368 masl) was observed in Cluster 3, whereas lower altitudes of 2046 and 2100 masl were observed in Clusters 1 and 2, respectively (Table 3). Cluster 3 is characterized by high slopes between 10 and 30 % and slopes greater than 30%, while lower slopes were determined in Cluster 1 and Cluster 2 (Table 2). Previous investigations disclosed that steep slopes increase the surface runoff, hindering the contact between water and soil surface [106,107,108]; this can be linked to the highest runoff coefficient (mean = 0.44) obtained in Cluster 3, while lower values of 0.20 and 0.31 were found in Clusters 1 and 2, respectively (Table 3). The geological structure is mostly formed of rhyolite and ignimbrite (Table 2). These formations are made up of interbedded layers of volcanic rocks of low porosity and hydraulic conductivity. However, the highest hydraulic conductivity (mean = 0.44 m/d) was identified, whereas lower K of 0.29 and 0.07 m/d was observed in group 1 and group 2 (Table 3). This can be linked to fractures or faults in the study area, which increases the K. Studies have documented the variations in hydraulic properties influencing overall aquifer dynamic, defining referential flow directions, and modifying their storage capacity [61,63,65].
Three different vegetation types (chaparral and oak-pine forest) were identified in Cluster 3 (Table 2) and are associates with groundwater recharge [24]. Previous studies in the SSMVC have reported that the surface infiltration reaches a depth of 50 cm. This is explained by the interactions between pine forest and volcanic rock [41,43]. Therefore, the surface infiltrations rates are limited by the vegetation type and rock type and hinder the natural recharge. Studies reported that deep rooted ecosystem, such as the eucalypt forests, could decrease groundwater recharge. Meanwhile, steep slopes such as such as the ones in this group with shallow rooted grasslands reduce surface runoff and promote infiltration [118,119].

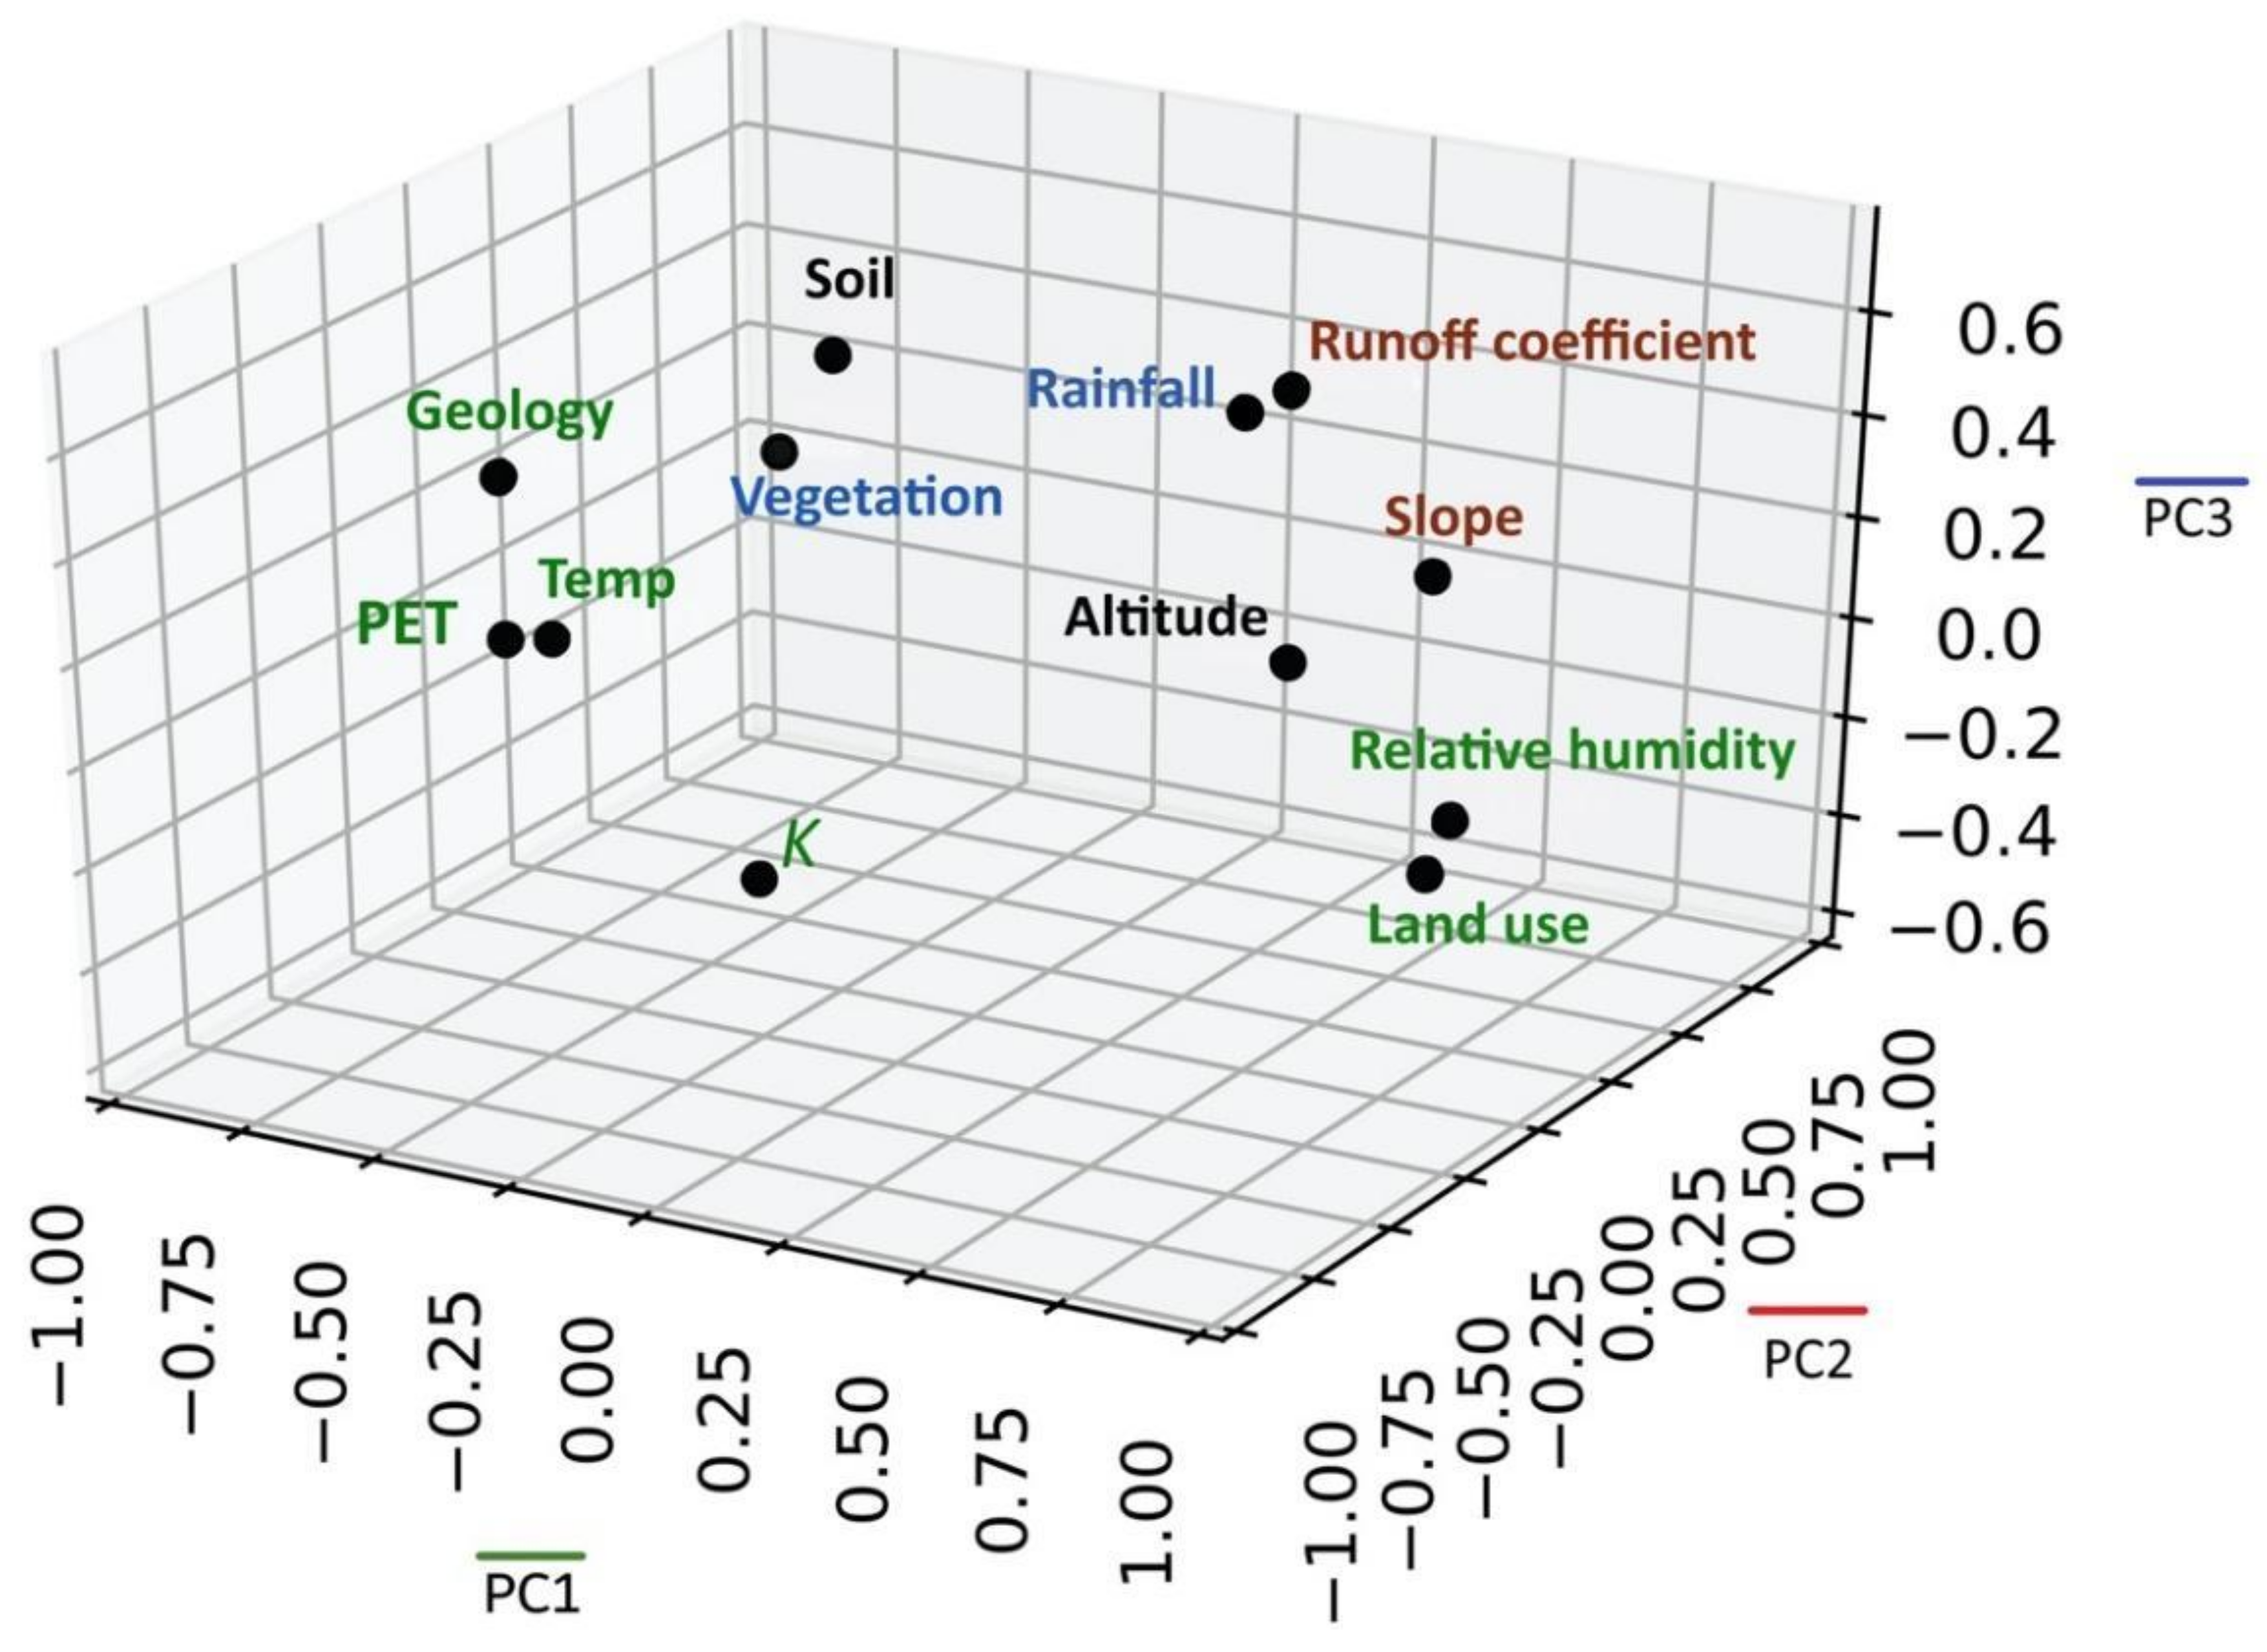
3.3. Principal Component Analysis

PCA was applied to reduce the high-dimensional dataset to a small dataset with most of the information of the initial dataset. PCA was performed on a dataset consisting of 66 observations and 12 variables. Four components (PCs) were defined, accounting for 77.88% of the total variance in the dataset. The results are shown in Table 4 and Figure 5.
The first component explains 44.10% of the total variance. PC1 has a robust negative loading of −0.92, −0.90, and −0.79 on PET, temperature, and geology, and high positive loading of 0.93, 0.91, 0.56, 0.53, and 0.52 on humidity, land use, precipitation, hydraulic conductivity, and slope. PC1 suggests that the occurrence of infiltration processes is determined by hydraulic conductivity, rainfall, and humidity in the SSMVC. Potential groundwater recharge zones are controlled by geological formations, high levels of PET, and temperature. In previous studies, researchers have recognized water deficits that caused low infiltration rates [11,15]. This is warranted by the high levels of evapotranspiration and temperature observed in the SSMVC. Previous studies have reported that the recharge depends on the nature and hydraulic properties of the vadose zone. This is due to the fact that the unsaturated layers are often defined by the permeability and porosity features which vary from point to another. Thus, groundwater recharge is governed by subsurface geology. In addition, the occurrence of fractures and faults are linked to increase of water movement (high hydraulic conductivity) to saturated zone [111]. However, variation of natural recharge process associated with PET and temperature is due to the groundwater recharge being controlled, in part, by precipitation and evaporation, itself dependent on temperature [124,125]. A high association between humidity and land use can be due to a large area of agricultural fields in the study zone. Studies have demonstrated that the zones with high groundwater recharge potential are located in areas with dense vegetation cover coupled with flat relief and consolidated and structured soils [126].
The second component describes 13.68% of the variance of the dataset. PC2 has a fit, positive loading of 0.78 and 0.57 on runoff coefficient and slope. This indicates that the hillslopes have a significant function in the rainfall-runoff processes, determining the infiltration rates; thus, groundwater recharge [106,107,108]. It observed a suite of cluster analyses where gentle slopes in Cluster 1 and Cluster 2 were linked to lower runoff coefficients. Meanwhile, high slopes in Cluster 3 were related to the highest runoff coefficient. In previous studies, researchers have highlighted that suitable slope and elevation delineated by basin and depressions are crucial for recharge. This is due to the runoff being larger over zones of steeper slopes, leaving no time for infiltration. Thus, it is probable that recharge is decreased as runoff flows faster and does not allow infiltration [109,127,128].
The third component explains 11.62% of the total variance. PC3 has a robust positive loading of 0.70 and 0.58 on precipitation and vegetation. This reveals the strong influence of precipitation and vegetation on the increase in evapotranspiration. Previous studies have reported that the surface soil layers are recharged by rainfall and lose water by high evapotranspiration rates [39,53]. It observed that the infiltration rates were defined by high precipitation (514.21 mm) and vegetation type [41,43]. Previous investigations have described that landslides and floods in the study zone could be attributed to high runoffs [46]. It is well known that the temperature and precipitation can have meaningful effects on groundwater recharge [129,130]. Particularly the recharge is significant in semi-arid regions where rainfall is variable and evapotranspiration frequently exceeds precipitation [109,131]. In addition, previous studies have found a high association between recharge and both climate and land cover [125]. Some researchers have documented that variations in groundwater recharge are strongly related to vegetation types [129].
The fourth component explains 8.47% of the variance of the data. PC4 has a robust positive loading of 0.64 on altitude. Similar investigations in other countries have reported that the potential groundwater recharge zones are determined by low altitudes [132]. However, it observed that the altitudes of up to 2800 masl caused increased runoff and decreased soil infiltration rate. This indicates that the groundwater recharge is controlled by altitude, such as in Cluster 3, where the highest altitude and runoff coefficient was found.

4. Conclusions

The results obtained from correlation analysis indicated that climatic variables such as temperature, humidity, precipitation, and evapotranspiration determine the groundwater recharge process, while land use and geology define potential recharge zones. A high correlation between temperature and evapotranspiration (0.93), humidity (−0.87), and rainfall (−0.75) was observed. This is explained by an increase in the temperature during the last years in the study zone, which has altered the spatio-temporal rainfall patterns. Moreover, land use showed a robust negative association with local geology (−0.69) and soil type (−0.61). This could be due to the fact that the local geology determines the soil type and soil processes and has a meaningful influence on the hydraulic conductivity, which provides primary information on potential recharge zones.
Statistical methods such as K-means clustering and PCA were usefully applied to identified main factors that determine recharge processes and potential groundwater recharge areas. The K-means algorithm recognized three clusters. The first group showed a low potential for groundwater recharge. This cluster was located in the southeastern and central parts. This group is characterized by gentle slopes (0–5%) in most of the land and lower runoff coefficients (0.20), as well as low porosity and hydraulic conductivity. However, it was possible to identify high hydraulic conductivity values (0.297 m/d), which can be related to fractures or faults zones. The second group disclosed a potential for groundwater recharge due to its geology and land use, but it is limited by h climatic factors. This cluster was located in the north and northwest portions. The geological setting of this group is mostly of alluvium, which tends to increase hydraulic conductivity. The third cluster revealed low potential for water recharge. This group is situated in the south and northeast parts. This cluster is characterized by the highest altitude (2368 masl), high slopes (>30%), which can be linked to the highest runoff coefficient (0.44) observed in Cluster 3. The geological structure of this cluster is mostly formed of rhyolite and ignimbrite of low porosity. However, it had the highest hydraulic conductivity (0.86), which can be related to fractures found in the study area.
Four components identified in the principal component analysis are responsible for 77.88% of the total variance in the data matrix, and were found to be the main variables controlling groundwater recharge: geology, K, temperature, precipitation, PET, humidity, and land use. Infiltration processes are restricted by low hydraulic conductivity, as well as ignimbrites and volcanic rocks of low porosity in the study area.
Given the climatic and geological conditions shown in this study, the SSMVC is not working optimally as a water recharge zone towards the deep aquifer of the SLPV. The methodology used in this study will be useful for water resource managers to develop strategies to define priority recharge areas and safeguard the sustainable management of water resources.

Supplementary Materials

The following are available online at https://0-www-mdpi-com.brum.beds.ac.uk/article/10.3390/su132011543/s1, Table S1: Thornthwaite method for the PET estimation, Table S2: Runoff coefficient of Prevert (1984), Table S3: Runoff coefficient of Chow (1993), Table S4: Results of the KMO test, Table S5: Results of the Shapiro-Wilk test.

Author Contributions

Conceptualization, A.E.M.C.; Data curation, J.L.U.C.; Formal analysis, J.L.U.C., D.A.M.C. and A.E.M.C.; Investigation, J.L.U.C.; Methodology, D.A.M.C. and A.E.M.C.; Resources, J.A.R.L.; Software, J.L.U.C. and A.E.M.C.; Supervision, A.E.M.C.; Validation, J.L.U.C. and A.E.M.C.; Visualization, J.A.R.L., D.A.M.C. and A.C.M.; Writing—original draft, J.L.U.C. and A.E.M.C.; Writing—review&editing, J.A.R.L., D.A.M.C., A.C.M. and A.E.M.C. All authors have read and agreed to the published version of the manuscript.

Funding

This research received no external funding.

Institutional Review Board Statement

Not applicable.

Informed Consent Statement

Not applicable.

Data Availability Statement

Not applicable.

Acknowledgments

J.L.U.C. thanks the Consejo Nacional de Ciencia y Tecnología (CONACYT) for a Ms.S. scholarship No. 930739 and the Instituto Potosino de Investigación Científica y Tecnológica A.C. (IPICYT).

Conflicts of Interest

The authors declare no conflict of interest.

References

  1. Guerrero-Martínez, L.; Hernández-Marín, M.; Burbey, T.J. Estimation of natural groundwater recharge in the Aguascalientes semiarid valley, Mexico. Rev. Mex. Cienc. Geológicas 2018, 35, 268–276. [Google Scholar] [CrossRef] [Green Version]
  2. Xu, G.; Su, X.; Zhang, Y.; You, B. Identifying potential sites for artificial recharge in the plain area of the daqing river catchment using gis-based multi-criteria analysis. Sustainability 2021, 13, 3978. [Google Scholar] [CrossRef]
  3. Fernández-Mejuto, M.; Andreu, J.M.; García-Sánchez, E.; Palencia, R. An assessment of groundwater recharge at a regional scale for sustainable resource management: Province of alicante (SE Spain). Water 2021, 13, 862. [Google Scholar] [CrossRef]
  4. Singh, A.; Panda, S.N.; Uzokwe, V.N.E.; Krause, P. An assessment of groundwater recharge estimation techniques for sustainable resource management. Groundw. Sustain. Dev. 2019, 9, 100218. [Google Scholar] [CrossRef]
  5. Moeck, C.; Grech-Cumbo, N.; Podgorski, J.; Bretzler, A.; Gurdak, J.J.; Berg, M.; Schirmer, M. A global-scale dataset of direct natural groundwater recharge rates: A review of variables, processes and relationships. Sci. Total Environ. 2020, 717, 137042. [Google Scholar] [CrossRef] [PubMed]
  6. Owuor, S.O.; Butterbach-Bahl, K.; Guzha, A.C.; Rufino, M.C.; Pelster, D.E.; Díaz-Pinés, E.; Breuer, L. Groundwater recharge rates and surface runoff response to land use and land cover changes in semi-arid environments. Ecol. Process. 2016, 5, 1–21. [Google Scholar] [CrossRef] [Green Version]
  7. Siebert, S.; Burke, J.; Faures, J.M.; Frenken, K.; Hoogeveen, J. Groundwater use for irrigation—A global inventory. Hydrol. Earth Syst. Sci. 2010, 14, 1863–1880. [Google Scholar] [CrossRef] [Green Version]
  8. Lentswe, G.B.; Molwalefhe, L. Delineation of potential groundwater recharge zones using analytic hierarchy process-guided GIS in the semi-arid Motloutse watershed, eastern Botswana. J. Hydrol. Reg. Stud. 2020, 28, 100674. [Google Scholar] [CrossRef]
  9. Hernández-Marín, M.; Guerrero-Martínez, L.; Zermeño-Villalobos, A.; Rodríguez-González, L.; Burbey, T.J.; Pacheco-Martínez, J.; Martínez-Martínez, S.I.; González-Cervantes, N. Spatial and temporal variation of natural recharge in the semi-arid valley of Aguascalientes, Mexico. Hydrogeol. J. 2018, 26, 2811–2826. [Google Scholar] [CrossRef]
  10. Allison, G.B.; Gee, G.W.; Tyler, S.W. Vadose-Zone Techniques for Estimating Groundwater Recharge in Arid and Semiarid Regions. Soil Sci. Soc. Am. J. 1994, 58, 6–14. [Google Scholar] [CrossRef]
  11. Montenegro, A.; Ragab, R. Hydrological response of a Brazilian semi-arid catchment to different land use and climate change scenarios: A modelling study. Hydrol. Process. 2010, 24, 2705–2723. [Google Scholar] [CrossRef]
  12. Wakode, H.B.; Baier, K.; Jha, R.; Azzam, R. Impact of urbanization on groundwater recharge and urban water balance for the city of Hyderabad, India. Int. Soil Water Conserv. Res. 2018, 6, 51–62. [Google Scholar] [CrossRef]
  13. Ebrahimi, H.; Ghazavi, R.; Karimi, H. Estimation of Groundwater Recharge from the Rainfall and Irrigation in an Arid Environment Using Inverse Modeling Approach and RS. Water Resour. Manag. 2016, 30, 1939–1951. [Google Scholar] [CrossRef]
  14. Hernández-Espriú, A.; Arango-Galván, C.; Reyes-Pimentel, A.; Martínez-Santos, P.; de la Paz, C.P.; Macías-Medrano, S.; Arias-Paz, A.; Breña-Naranjo, J.A. Water supply source evaluation in unmanaged aquifer recharge zones: The mezquital valley (Mexico) case study. Water 2017, 9, 4. [Google Scholar] [CrossRef] [Green Version]
  15. Coelho, V.H.R.; Montenegro, S.; Almeida, C.N.; Silva, B.B.; Oliveira, L.M.; Gusmão, A.C.V.; Freitas, E.S.; Montenegro, A.A.A. Alluvial groundwater recharge estimation in semi-arid environment using remotely sensed data. J. Hydrol. 2017, 548, 1–15. [Google Scholar] [CrossRef]
  16. Carrillo-Rivera, J.J.; Clark, I.D.; Fritz, P. Investigating Recharge Of Shallow And Paleo-Groundwaters In The Villa De Reyes Basin, SLP, Mexico, With Environmental Isotopes. Hydrogeol. J. 1992, 1, 35–48. [Google Scholar] [CrossRef]
  17. Parisi, S.; Paternoster, M.; Kohfahl, C.; Pekdeger, A.; Meyer, H.; Hubberten, H.W.; Spilotro, G.; Mongelli, G. Groundwater recharge areas of a volcanic aquifer system inferred from hydraulic, hydrogeochemical and stable isotope data: Mount Vulture, southern Italy. Hydrogeol. J. 2011, 19, 133–153. [Google Scholar] [CrossRef]
  18. Tsai, J.P.; Chen, Y.W.; Chang, L.C.; Chen, W.F.; Chiang, C.J.; Chen, Y.C. The assessment of high recharge areas using DO indicators and recharge potential analysis: A case study of Taiwan’s Pingtung plain. Stoch. Environ. Res. Risk Assess. 2014, 29, 815–832. [Google Scholar] [CrossRef]
  19. Setiawan, O.; Sartohadi, J.; Hadi, M.P.; Mardiatno, D. Delineating spring recharge areas inferred from morphological, lithological, and hydrological datasets on Quaternary volcanic landscapes at the southern flank of Rinjani Volcano, Lombok Island, Indonesia. Acta Geophys. 2019, 67, 177–190. [Google Scholar] [CrossRef]
  20. Chowdhury, A.; Jha, M.K.; Chowdary, V.M. Delineation of groundwater recharge zones and identification of artificial recharge sites in West Medinipur district, West Bengal, using RS, GIS and MCDM techniques. Environ. Earth Sci. 2010, 59, 1209–1222. [Google Scholar] [CrossRef]
  21. Nassif, S.H.; Wilson, E.M. The influence of slope and rain intensity on runoff and infiltration. Hydrol. Sci. Bull. 1975, 20, 539–553. [Google Scholar] [CrossRef]
  22. Tejedor, M.; Neris, J.; Jiménez, C. Soil Properties Controlling Infiltration in Volcanic Soils (Tenerife, Spain). Soil Sci. Soc. Am. J. 2013, 77, 202–212. [Google Scholar] [CrossRef]
  23. Del Toro-Guerrero, F.J.; Vivoni, E.R.; Kretzschmar, T.; Runquist, S.H.B.; Vázquez-González, R. Variations in soil water content, infiltration and potential recharge at three sites in a Mediterranean mountainous region of Baja California, Mexico. Water 2018, 10, 1844. [Google Scholar] [CrossRef] [Green Version]
  24. Peñuela-Arévalo, L.A.; Carrillo-Rivera, J.J. Definición de zonas de recarga y descarga de agua subterránea a partir de indicadores superficiales: Centro-sur de la Mesa Central, México. Investig. Geogr. 2012, 81, 18–32. [Google Scholar] [CrossRef] [Green Version]
  25. Setiawan, O.; Sartohadi, J.; Hadi, M.P.; Mardiatno, D. Infiltration characterization using principal component analysis and K-means cluster analysis on quaternary volcanic landscape at the southern flank of Rinjani Volcano, Lombok Island, Indonesia. Phys. Geogr. 2019, 41, 217–237. [Google Scholar] [CrossRef]
  26. Marín-Celestino, A.E.; Martínez-Cruz, D.A.; Otazo-Sánchez, E.M.; Gavi-Reyes, F.; Vásquez-Soto, D. Groundwater quality assessment: An improved approach to K-means clustering, principal component analysis and spatial analysis: A case study. Water 2018, 10, 437. [Google Scholar] [CrossRef] [Green Version]
  27. Marín-Celestino, A.E.; Ramos-Leal, J.A.; Martínez-Cruz, D.A.; Tuxpan-Vargas, J.; De Lara-Bashulto, J.; Morán-Ramírez, J. Identification of the Hydrogeochemical Processes and Assessment of Groundwater Quality, Using Multivariate Statistical Approaches and Water Quality Index in a Wastewater Irrigated Region. Water 2019, 11, 1702. [Google Scholar] [CrossRef] [Green Version]
  28. Rukundo, E.; Doğan, A. Dominant influencing factors of groundwater recharge spatial patterns in Ergene river catchment, Turkey. Water 2019, 11, 653. [Google Scholar] [CrossRef] [Green Version]
  29. Naranjo-Fernández, N.; Guardiola-Albert, C.; Aguilera, H.; Serrano-Hidalgo, C.; Montero-González, E. Clustering Groundwater Level Time Series of the Exploited Almonte-Marismas Aquifer in Southwest Spain. Water 2020, 12, 1063. [Google Scholar] [CrossRef] [Green Version]
  30. Oh, J.; Kim, H.-R.; Yu, S.; Kim, K.-H.; Yun, S.-T. Delineating the impacts of poultry burial leachate on shallow groundwater in a reclaimed agro-livestock farming area, using multivariate statistical analysis of hydrochemical data. Environ. Sci. Pollut. Res. 2020, 28, 7742–7755. [Google Scholar] [CrossRef]
  31. Demlie, M.; Wohnlich, S.; Wisotzky, F.; Gizaw, B. Groundwater recharge, flow and hydrogeochemical evolution in a complex volcanic aquifer system, central Ethiopia. Hydrogeol. J. 2007, 15, 1169–1181. [Google Scholar] [CrossRef]
  32. Chotpantarat, S.; Parkchai, T.; Wisitthammasri, W. Multivariate statistical analysis of hydrochemical data and stable isotopes of groundwater contaminated with nitrate at Huay Sai royal development study center and adjacent areas in Phetchaburi province, Thailand. Water 2020, 12, 1127. [Google Scholar] [CrossRef] [Green Version]
  33. Asante, J.; Kreamer, D. A New Approach to Identify Recharge Areas in the Lower Virgin River Basin and Surrounding Basins by Multivariate Statistics. Math. Geosci. 2015, 47, 819–842. [Google Scholar] [CrossRef]
  34. Cloutier, V.; Lefebvre, R.; Therrien, R.; Savard, M.M. Multivariate statistical analysis of geochemical data as indicative of the hydrogeochemical evolution of groundwater in a sedimentary rock aquifer system. J. Hydrol. 2008, 353, 294–313. [Google Scholar] [CrossRef]
  35. Malczewski, J.; Rinner, C. Multicriteria Decision Analysis in Geographic Information Science, 1st ed.; Springer: New York, NY, USA, 2015; ISBN 978-3-540-74757-4. [Google Scholar]
  36. Stevens-Vázquez, G.S. La vulnerabilidad hídrica en la ciudad de San Luis Potosí. Un análisis espacial. Rev. El Col. San Luis 2012, 2, 130–159. [Google Scholar] [CrossRef]
  37. Flores-Márquez, E.L.; Ledesma, I.K.; Arango-Galván, C. Sustainable geohydrological model of San Luis Potosí aquifer, Mexico. Geofis. Int. 2011, 50, 425–438. [Google Scholar]
  38. Ramos-Leal, J.A.; Martínez-Ruiz, V.J.; Rangel-Mendez, J.R.; Alfaro De La Torre, M.C. Hydrogeological and mixing process of waters in aquifers in arid regions: A case study in San Luis Potosi Valley, Mexico. Environ. Geol. 2007, 53, 325–337. [Google Scholar] [CrossRef]
  39. Noyola-Medrano, M.C.; Ramos-Leal, J.A.; Domínguez-Mariani, E.; Pineda-Martínez, L.F.; López-Loera, H.; Carbajal, N. Factores que dan origen al minado de acuíferos en ambientes áridos: Caso Valle de San Luis Potosí. Rev. Mex. Cienc. Geológicas 2009, 26, 395–410. [Google Scholar]
  40. Rodríguez-Robles, U.; Arredondo, J.T.; Huber-Sannwald, E.; Vargas, R. Geoecohydrological mechanisms couple soil and leaf water dynamics and facilitate species coexistence in shallow soils of a tropical semiarid mixed forest. New Phytol. 2015, 207, 59–69. [Google Scholar] [CrossRef]
  41. Rodríguez-Robles, U.; Arredondo, J.T.; Huber-Sannwald, E.; Yépez, E.A.; Ramos-Leal, J.A. Coupled plant traits adapted to wetting/drying cycles of substrates co-define niche multidimensionality. Plant Cell Environ. 2020, 43, 2394–2408. [Google Scholar] [CrossRef]
  42. INEGI. Síntesis de Información Geográfica del Estado de San Luis Potosí, 1st ed.; INEGI: San Luis Potosi, Mexico, 2002; ISBN 970-13-3776-X. [Google Scholar]
  43. Rodríguez-Robles, U.; Arredondo, T.; Huber-Sannwald, E.; Ramos-Leal, J.A.; Yépez, E.A. Technical note: Application of geophysical tools for tree root studies in forest ecosystems in complex soils. Biogeosciences 2017, 14, 5343–5357. [Google Scholar] [CrossRef] [Green Version]
  44. Hernández-Constantino, N.A. Evaluación la Disponibilidad y Demanda de Agua, en la Zona Metropolitana de San Luis Potosí. Master’s Thesis, Instituto Potosino de Investigación Científica y Tecnológica, A.C., San Luis Potosi, Mexico, 2020. [Google Scholar]
  45. FAO. World Reference Base for Soil Resources 2006 (WRB): A Framework for International Classification, Correlation and Communication; FAO: Rome, Italy, 2006; ISBN 92-5-105511-4. [Google Scholar]
  46. IPICYT. SEGAM Estudio Técnico de Factibilidad para el Establecimiento del Área Natural Protegida Reserva Estatal “Sierra de San Miguelito” San Luis Potosí; IPICYT: San Luis Potosi, Mexico, 2018. [Google Scholar]
  47. Orozco-Esquivel, M.T.; Nieto-Samaniego, A.F.; Alaniz-Alvarez, S.A. Origin of rhyolitic lavas in the Mesa Central, Mexico, by crustal melting related to extension. J. Volcanol. Geotherm. Res. 2002, 118, 37–56. [Google Scholar] [CrossRef]
  48. Tristán-González, M.; Aguillón-Robles, A.; Barboza-Gudiño, J.R.; Torres-Hernández, J.R.; Bellon, H.; López-Doncel, R.; Rodríguez-Ríos, R.; Labarthe-Hernández, G. Geocronología y distribución espacial del vulcanismo en el Campo Volcánico de San Luis Potosí. Boletín Soc. Geológica Mex. 2009, 61, 287–303. [Google Scholar] [CrossRef]
  49. Nieto-Samaniego, Á.F.; Ferrari, L.; Alaniz-Alvarez, S.A.; Labarthe-Hernández, G.; Rosas-Elguera, J. Variation of Cenozoic extension and volcanism across the southern Sierra Madre Occidental volcanic province, Mexico. Bull. Geol. Soc. Am. 1999, 111, 347–363. [Google Scholar] [CrossRef]
  50. Xu, S.-S.; Nieto-Samaniego, A.F.; Alaniz-Álvarez, S.A. Tilting mechanisms in domino faults of the Sierra de San Miguelito, central Mexico. Geol. Acta 2004, 2, 189–201. [Google Scholar]
  51. Cardona-Benavides, A. Caracterización físico-química y origen de los sólidos disueltos en el agua subterránea en el Valle de San Luis Potosí; su relación con el sistema flujo. Master’s Thesis, Universidad Auntónoma de Nuevo León, Monterrey, Mexico, 1990. [Google Scholar]
  52. IPICYT. Estudio Hidrogeológico de la Porción Oriental del Valle de San Luis Potosí; IPICYT: San Luis Potosi, Mexico, 2007. [Google Scholar]
  53. López-Álvarez, B.; Ramos-Leal, J.A.; Moran-Ramírez, J.; Cardona-Benavides, A.; Hernández-Garcia, G. Origen de la calidad del agua del acuífero colgado y su relación con los cambios de uso de suelo en el Valle de San Luis Potosí. Boletín Soc. Geológica Mex. 2013, 65, 9–26. [Google Scholar] [CrossRef]
  54. Carrillo-Rivera, J.J.; Armienta, M.A. Diferenciación de la contaminación inorgánica en las aguas subterráneas del Valle de la Ciudad de San Luis Potosí, S.L.P., México. Geofis. Int. 1989, 28, 763–783. [Google Scholar]
  55. López-Álvarez, B.; Ramos-Leal, J.A.; Santacruz, G.; Morán-Ramírez, J.; Carranco-Lozada, S.E.; Noyola-Medrano, M.C.; Pineda-Martínez, L.F. Cálculo del índice de pobreza del agua en zonas semiáridas: Caso Valle de San Luis Potosí. Rev. Int. Contam. Ambient. 2013, 4, 249–260. [Google Scholar]
  56. Thornthwaite, C.W. An Approach toward a Rational Classification of Climate. Geogr. Rev. 1948, 38, 55–94. [Google Scholar] [CrossRef]
  57. Treviño-Garza, E.; Muñoz, R.C.; Cavazos, C.C.; Barajas-Chávez, L. Evaluación del flujo hídrico superficial en la Sierra de San Carlos, Tamaulipas. Cienc. UANL 2002, 5, 525–530. [Google Scholar]
  58. Chow, J.C.; Watson, J.G.; Lowenthal, D.H.; Solomon, P.A.; Magliano, K.L.; Ziman, S.D.; Richards, L.W. PM10 and PM2.5 Compositions in California’s San Joaquin Valley. Aerosol Sci. Technol. 1993, 18, 105–128. [Google Scholar] [CrossRef] [Green Version]
  59. Puente-Castillo, W.L. Estudio geotécnico y de peligro geomorfológico de una porción de la Sierra de San Miguelito, S.L.P. Master’s Thesis, Universidad Autónoma de San Luis Potosí, San Luis Potosi, Mexico, 2014. [Google Scholar]
  60. Hernández-Ramos, J.O. Determinación propiedades de suelos agrícolas a partir de mediciones eléctricas realizadas en campo y en laboratorio. Master’s Thesis, Instituto Potosino de Investigación Científica y Tecnológica, A.C., San Luis Potosi, Mexico, 2019. [Google Scholar]
  61. Geldon, A.L. Hydraulic tests of Miocene volcanic rocks at Yucca Mountain and Pahute Mesa and implications for groundwater flow in the Southwest Nevada Volcanic Field, Nevada and California. Geol. Soc. Am. 2004, 381, 1–94. [Google Scholar]
  62. White, P.A.; Meilhac, C.; Zemansky, G.; Kilgour, G. Groundwater Resource Investigations of the Western Bay of Plenty Area Stage 1—Conceptual Geological and Hydrological Models and Preliminary Allocation Assessment. GNS Sci. Consult. Rep. 2008, 240, 221. [Google Scholar]
  63. Ochoa-González, G.H.; Carreón-Freyre, D.; Cerca, M.; López-Martínez, M. Assessment of groundwater flow in volcanic faulted areas. A study case in Queretaro, Mexico. Geofis. Int. 2015, 54, 199–220. [Google Scholar] [CrossRef] [Green Version]
  64. CONAGUA. Actualización de la Disponibilidad Media Anual de Agua en el Acuífero Ocampo (1103), Estado de Guanajuato; CONAGUA: Mexico City, Mexico, 2018. [Google Scholar]
  65. Fitts, C.R. Hydrology and Geology. In Groundwater Science; Fitts, C.R., Ed.; Elsevier: Scarborough, Maine, 2013; pp. 123–186. ISBN 978-0-12-384705-8. [Google Scholar]
  66. Hart, D.J.; Bradbury, K.R.; Feinstein, D.T. The vertical hydraulic conductivity of an aquitard at two spatial scales. Ground Water 2006, 44, 201–211. [Google Scholar] [CrossRef] [PubMed]
  67. Green, J.M.; Henkelman, K.K.; Caskey, R.M. Hydraulic Conductivity of Near-Surface Alluvium in the Vicinity of Cattlemans Detention Basin, South Lake Tahoe, California; U.S. Geological Survey: Reston, VA, USA, 2004.
  68. Oppong, F.B.; Agbedra, S.Y. Assessing Univariate and Multivariate Normality, A Guide for Non—Statisticians. Math. Theory Model. 2016, 6, 26–33. [Google Scholar]
  69. Manoj, K.; Padhy, P.K. Multivariate statistical techniques and water quality assessment: Discourse and review on some analytical models. Int. J. Environ. Sci. 2014, 5, 607–626. [Google Scholar] [CrossRef]
  70. Steinley, D. K-means clustering: A half-century synthesis. Br. J. Math. Stat. Psychol. 2006, 59, 1–34. [Google Scholar] [CrossRef] [Green Version]
  71. Shapiro, S.S.; Wilk, M.B. An analysis of variance test for normality (complete samples). Biometrika 1965, 52, 591–611. [Google Scholar] [CrossRef]
  72. Royston, J.P. Some Techniques for Assessing Multivariate Normality Based on the Shapiro-Wilk W. Appl. Stat. 1983, 32, 121–133. [Google Scholar] [CrossRef]
  73. Hair, J.F.J.; Black, W.C.; Babin, B.J.; Anderson, R.E. Multivariate Data Analysis, 7th ed.; Pearson Education Limited: London, UK, 2014; ISBN 978-1-292-02190-4. [Google Scholar]
  74. Sarmadi, F.; Shokoohi, A. Regionalizing precipitation in Iran using GPCC gridded data via multivariate analysis and L-moment methods. Theor. Appl. Climatol. 2015, 122, 121–128. [Google Scholar] [CrossRef]
  75. Restrepo, B.L.; González, L.J. De Pearson a Spearman. Rev Col Cienc Pec 2007, 20, 183–192. [Google Scholar]
  76. Rodríguez-Rodríguez, R.M. Elementos potencialmente tóxicos en el polvo urbano de la zona metropolitana de San Luis Potosí. Master’s Thesis, Instituto Potosino de Investigación Científica y Tecnológica, A.C., San Luis Potosi, Mexico, 2020. [Google Scholar]
  77. Jain, A.K. Data clustering: 50 years beyond K-means. Pattern Recognit. Lett. 2010, 31, 651–666. [Google Scholar] [CrossRef]
  78. Hancer, E.; Karaboga, D. A comprehensive survey of traditional, merge-split and evolutionary approaches proposed for determination of cluster number. Swarm Evol. Comput. 2017, 32, 49–67. [Google Scholar] [CrossRef]
  79. Li, Y.; Wu, H. A Clustering Method Based on K-Means Algorithm. Phys. Procedia 2012, 25, 1104–1109. [Google Scholar] [CrossRef] [Green Version]
  80. Jollife, I.T.; Cadima, J. Principal component analysis: A review and recent developments. Phil. Trans. R. Soc. A 2016, 374. [Google Scholar] [CrossRef]
  81. Majkić-Dursun, B.; Oros, I.; Boreli-Zdravković, Đ. Spatial distribution of groundwater quality parameters in the Velika Morava River Basin, central Serbia. Environ. Earth Sci. 2018, 77, 1–15. [Google Scholar] [CrossRef]
  82. Shrestha, S.; Kazama, F. Assessment of surface water quality using multivariate statistical techniques: A case study of the Fuji river basin, Japan. Environ. Model. Softw. 2007, 22, 464–475. [Google Scholar] [CrossRef]
  83. Juahir, H.; Zain, S.M.; Yusoff, M.K.; Hanidza, T.I.T.; Armi, A.S.M.; Toriman, M.E.; Mokhtar, M. Spatial water quality assessment of Langat River Basin (Malaysia) using environmetric techniques. Environ. Monit. Assess. 2011, 173, 625–641. [Google Scholar] [CrossRef] [PubMed] [Green Version]
  84. Mata-Martínez, M.A. Estimación de la Evapotraspiración en el Valle de San Luis Potosí y zonas aledañas por medio de Imágenes de Satélite. Master’s Thesis, Instituto Potosino de Investigación Científica y Tecnológica, A.C., San Luis Potosi, Mexico, 2011. [Google Scholar]
  85. Fang, Y.; Sun, G.; Caldwell, P.; Mcnulty, S.G.; Noormets, A.; Domec, J.C.; King, J.; Zhang, Z.; Zhang, X.; Lin, G.; et al. Monthly land cover-specific evapotranspiration models derived from global eddy flux measurements and remote sensing data. Ecohydrology 2016, 9, 248–266. [Google Scholar] [CrossRef] [Green Version]
  86. Deb, C.; Ramachandraiah, A. Evaluation of thermal comfort in a rail terminal location in India. Build. Environ. 2010, 45, 2571–2580. [Google Scholar] [CrossRef]
  87. Condon, L.E.; Atchley, A.L.; Maxwell, R.M. Evapotranspiration depletes groundwater under warming over the contiguous United States. Nat. Commun. 2020, 11. [Google Scholar] [CrossRef]
  88. Ayllón, T. Elementos de Metereología y Climatología, 2nd ed.; Trillas: Mexico City, Mexico, 2003; ISBN 968-24-6725-X. [Google Scholar]
  89. Shrestha, A.K.; Thapa, A.; Gautam, H. Solar radiation, air temperature, relative humidity, and dew point study: Damak, jhapa, Nepal. Int. J. Photoenergy 2019, 2019. [Google Scholar] [CrossRef] [Green Version]
  90. Hughes, A.; Mansour, M.; Ward, R.; Kieboom, N.; Allen, S.; Seccombe, D.; Charlton, M.; Prudhomme, C. The impact of climate change on groundwater recharge: National-scale assessment for the British mainland. J. Hydrol. 2021, 598, 126336. [Google Scholar] [CrossRef]
  91. López-Martínez, J.D.; Guerrero-Alvarado, J. Contenido de humedad del suelo para decidir la siembra en agricultura de zonas áridas. Terra Latinoam. 1999, 17, 51–57. [Google Scholar]
  92. Shaxson, F.; Barber, R. Optimización de la Humedad del Suelo para la Producción Vegetal: El Significado de la Porosidad del Suelo; Boletín de Suelos de la FAO 79; FAO: Rome, Italy, 2005; ISBN 92-5-304944-8. [Google Scholar]
  93. Salcedo-Pérez, E.; Galvis-Spinola, A.; Hernández-Mendoza, T.M.; Rodríguez-Macias, R.; Zamora-Natera, F.; Bugarin-Montoya, R.; Carrillo-González, R. La humedad aprovechable y su relación con la materia orgánica y superficie específica del suelo. Terra Latinoam. 2007, 25, 419–425. [Google Scholar]
  94. Glenn, E.P.; Huete, A.R.; Nagler, P.L.; Hirschboeck, K.K.; Brown, P. Integrating remote sensing and ground methods to estimate evapotranspiration. CRC. Crit. Rev. Plant Sci. 2007, 26, 139–168. [Google Scholar] [CrossRef]
  95. Cambraia Neto, A.J.; Neiva Rodrigues, L. Impact of climate change on groundwater recharge in a Brazilian Savannah watershed. Theor. Appl. Climatol. 2021, 143, 1425–1436. [Google Scholar] [CrossRef]
  96. Li, G.; Zhang, F.; Jing, Y.; Liu, Y.; Sun, G. Response of evapotranspiration to changes in land use and land cover and climate in China during 2001–2013. Sci. Total Environ. 2017, 596–597, 256–265. [Google Scholar] [CrossRef]
  97. Jáuregui, E. Impact of land-use changes on the climate of the Mexico City Region. Investig. Geogr. 2004, 55, 46–60. [Google Scholar] [CrossRef]
  98. Sharifi, E.; Lehmann, S. Correlation analysis of surface temperature of rooftops, streetscapes and urban heat island effect: Case study of central Sydney. J. Urban Environ. Eng. 2015, 9, 3–11. [Google Scholar] [CrossRef]
  99. Xu, F.; Bao, H.X.H.; Li, H.; Kwan, M.P.; Huang, X. Land use policy and spatiotemporal changes in the water area of an arid region. Land Use Policy 2016, 54, 366–377. [Google Scholar] [CrossRef] [Green Version]
  100. Wiggering, H. The geology—land use—nexus. Environ. Earth Sci. 2014, 71, 5037–5044. [Google Scholar] [CrossRef]
  101. Kim, J.H.; Jackson, R.B. A Global Analysis of Groundwater Recharge for Vegetation, Climate, and Soils. Vadose Zo. J. 2012, 11. [Google Scholar] [CrossRef] [Green Version]
  102. Essig, E.T.; Corradini, C.; Morbidelli, R.; Govindaraju, R.S. Infiltration and deep flow over sloping surfaces: Comparison of numerical and experimental results. J. Hydrol. 2009, 374, 30–42. [Google Scholar] [CrossRef]
  103. Lee, E.M.; Doornkamp, J.C.; Griffiths, J.S.; Tragheim, D.G. Environmental geology mapping for land use planning purposes in the Torbay area. Geosci. South-West Engl. 1988, 7, 18–25. [Google Scholar]
  104. Owoade, O.K.; Olise, F.S.; Ogundele, L.T.; Fawole, O.G.; Olaniyi, H.B. Correlation between particulate matter concentrations and meteorological parameters at a site in Ile-Ife, Nigeria. Ife J. Sci. 2012, 14, 83–93. [Google Scholar]
  105. Huang, D.; Yan, P.; Xiao, X.; Zhu, J.; Tang, X.; Huang, A.; Cheng, J. The tri-pole relation among daily mean temperature, atmospheric moisture and precipitation intensity over China. Glob. Planet. Chang. 2019, 179, 1–9. [Google Scholar] [CrossRef]
  106. Fang, H.; Sun, L.; Tang, Z. Effects of rainfall and slope on runoff, soil erosion and rill development: An experimental study using two loess soils. Hydrol. Process. 2015, 29, 2649–2658. [Google Scholar] [CrossRef]
  107. Morbidelli, R.; Saltalippi, C.; Flammini, A.; Cifrodelli, M.; Corradini, C.; Govindaraju, R.S. Infiltration on sloping surfaces: Laboratory experimental evidence and implications for infiltration modeling. J. Hydrol. 2015, 523, 79–85. [Google Scholar] [CrossRef]
  108. Mu, W.; Yu, F.; Li, C.; Xie, Y.; Tian, J.; Liu, J.; Zhao, N. Effects of rainfall intensity and slope gradient on runoff and soil moisture content on different growing stages of spring maize. Water 2015, 7, 2990–3008. [Google Scholar] [CrossRef] [Green Version]
  109. Abdullateef, L.; Tijani, M.N.; Nuru, N.A.; John, S.; Mustapha, A. Assessment of groundwater recharge potential in a typical geological transition zone in Bauchi, NE-Nigeria using remote sensing/GIS and MCDA approaches. Heliyon 2021, 7, e06762. [Google Scholar] [CrossRef] [PubMed]
  110. Singhal, B.B.S.; Gupta, R.P. Applied Hydrogeology of Fractured Rocks, 2nd ed.; Springer: Berlin/Heidelberg, Germany, 2010; ISBN 978-90-481-8799-7. [Google Scholar]
  111. Mogaji, K.A.; Lim, H.S. A GIS-based linear regression modeling approach to assess the impact of geologic rock types on groundwater recharge and its hydrological implication. Model. Earth Syst. Environ. 2020, 6, 183–199. [Google Scholar] [CrossRef]
  112. Matus, O.; Faustino, J.; Jiménez, F. Guía para la Identificación Participativa de Zonas con Potencial de Recarga Hídrica: Aplicación Práctica en la Subcuenca del Río Jucuapa, Nicaragua. 2009. Available online: https://repositorio.catie.ac.cr/bitstream/handle/11554/8339/Guia_para_la_identificacion_participativa.pdf?sequence=1 (accessd on 15 October 2021).
  113. Janeau, J.L.; Bricquet, J.P.; Planchon, O.; Valentin, C. Soil crusting and infiltration on steep slopes in northern Thailand. Eur. J. Soil Sci. 2003, 54, 543–553. [Google Scholar] [CrossRef] [Green Version]
  114. Hernández-Díaz, M.C. Aplicación de métodos geoeléctricos para la detección de zonas de filtración en la presa Gonzalo N. Santos, San Luis Potosí. Master’s Thesis, Instituto Potosino de Investigación Científica y Tecnológica, A.C., San Luis Potosi, Mexico, 2019. [Google Scholar]
  115. Zarate, E.; Hobley, D.; MacDonald, A.M.; Swift, R.T.; Chambers, J.; Kashaigili, J.J.; Mutayoba, E.; Taylor, R.G.; Cuthbert, M.O. The role of superficial geology in controlling groundwater recharge in the weathered crystalline basement of semi-arid Tanzania. J. Hydrol. Reg. Stud. 2021, 36. [Google Scholar] [CrossRef]
  116. Acworth, R.I.; Rau, G.C.; Cuthbert, M.O.; Leggett, K.; Andersen, M.S. Runoff and focused groundwater-recharge response to flooding rains in the arid zone of Australia. Hydrogeol. J. 2021, 29, 737–764. [Google Scholar] [CrossRef]
  117. Rau, G.C.; Halloran, L.J.S.; Cuthbert, M.O.; Andersen, M.S.; Acworth, R.I.; Tellam, J.H. Characterising the dynamics of surface water-groundwater interactions in intermittent and ephemeral streams using streambed thermal signatures. Adv. Water Resour. 2017, 107, 354–369. [Google Scholar] [CrossRef] [Green Version]
  118. Tao, Z.; Li, H.; Neil, E.; Si, B. Groundwater recharge in hillslopes on the Chinese Loess Plateau. J. Hydrol. Reg. Stud. 2021, 36, 100840. [Google Scholar] [CrossRef]
  119. Ilstedt, U.; Bargués Tobella, A.; Bazié, H.R.; Bayala, J.; Verbeeten, E.; Nyberg, G.; Sanou, J.; Benegas, L.; Murdiyarso, D.; Laudon, H.; et al. Intermediate tree cover can maximize groundwater recharge in the seasonally dry tropics. Sci. Rep. 2016, 6, 1–12. [Google Scholar] [CrossRef]
  120. Makonyo, M.; Msabi, M.M. Identification of groundwater potential recharge zones using GIS-based multi-criteria decision analysis: A case study of semi-arid midlands Manyara fractured aquifer, North-Eastern Tanzania. Remote Sens. Appl. Soc. Environ. 2021, 23. [Google Scholar] [CrossRef]
  121. INEGI. Estudio Hidrológico del Estado de San Luis Potosí, 1st ed.; INEGI: Aguascalientes, Mexico, 2002; ISBN 970-13-3631-3. [Google Scholar]
  122. Ansari, T.A.; Katpatal, Y.B.; Vasudeo, A.D. Spatial evaluation of impacts of increase in impervious surface area on SCS-CN and runoff in Nagpur urban watersheds, India. Arab. J. Geosci. 2016, 9, 1–15. [Google Scholar] [CrossRef]
  123. Saiz-Rodríguez, J.A.; Lomeli Banda, M.A.; Salazar-Briones, C.; Ruiz-Gibert, J.M.; Mungaray-Moctezuma, A. Allocation of groundwater recharge zones in a rural and semi-arid region for sustainable water management: Case study in Guadalupe Valley, Mexico. Water 2019, 11, 1586. [Google Scholar] [CrossRef] [Green Version]
  124. Atawneh, D.A.; Cartwright, N.; Bertone, E. Climate change and its impact on the projected values of groundwater recharge: A review. J. Hydrol. 2021, 601. [Google Scholar] [CrossRef]
  125. Seddon, D.; Kashaigili, J.J.; Taylor, R.G.; Cuthbert, M.O.; Mwihumbo, C.; MacDonald, A.M. Focused groundwater recharge in a tropical dryland: Empirical evidence from central, semi-arid Tanzania. J. Hydrol. Reg. Stud. 2021, 37, 100919. [Google Scholar] [CrossRef]
  126. Tenenwurcel, M.A.; de Moura, M.S.; da Costa, A.M.; Mota, P.K.; Viana, J.H.M.; Fernandes, L.F.S.; Pacheco, F.A.L. An improved model for the evaluation of groundwater recharge based on the concept of conservative use potential: A study in the river Pandeiros Watershed, Minas Gerais, Brazil. Water 2020, 12, 1001. [Google Scholar] [CrossRef] [Green Version]
  127. Pourghasemi, H.R.; Sadhasivam, N.; Yousefi, S.; Tavangar, S.; Ghaffari Nazarlou, H.; Santosh, M. Using machine learning algorithms to map the groundwater recharge potential zones. J. Environ. Manag. 2020, 265, 110525. [Google Scholar] [CrossRef] [PubMed]
  128. Aslan, V.; Çelik, R. Integrated gis-based multi-criteria analysis for groundwater potential mapping in the euphrates’s sub-basin, harran basin, turkey. Sustainability 2021, 13, 7375. [Google Scholar] [CrossRef]
  129. Gates, J.B.; Steele, G.V.; Nasta, P.; Szilagyi, J. Lithologic influences on groundwater recharge through incised glacial till from profile to regional scales: Evidence from glaciated Eastern Nebraska. Water Resour. Res. 2014, 50, 466–481. [Google Scholar] [CrossRef] [Green Version]
  130. Pulido-Velazquez, D.; García-Aróstegui, J.L.; Molina, J.L.; Pulido-Velazquez, M. Assessment of future groundwater recharge in semi-arid regions under climate change scenarios (Serral-Salinas aquifer, SE Spain). Could increased rainfall variability increase the recharge rate? Hydrol. Process. 2015, 29, 828–844. [Google Scholar] [CrossRef]
  131. Chung, I.M.; Sophocleous, M.A.; Mitiku, D.B.; Kim, N.W. Estimating groundwater recharge in the humid and semi-arid African regions: Review. Geosci. J. 2016, 20, 731–744. [Google Scholar] [CrossRef]
  132. Lamichhane, S.; Shakya, N.M. Alteration of groundwater recharge areas due to land use/cover change in Kathmandu Valley, Nepal. J. Hydrol. Reg. Stud. 2019, 26, 100635. [Google Scholar] [CrossRef]
Figure 1. Location map of the study area, showing the study point’s location and geology aspects.
Sustainability 13 11543 g001
Figure 2. Processes followed for the description of potential groundwater recharge areas.
Sustainability 13 11543 g002
Figure 3. Scheme of the map overlapping procedure for the study points selection.
Sustainability 13 11543 g003
Figure 4. Spatial distribution map of groups using K-means clustering.
Sustainability 13 11543 g004
Figure 5. Principal Component Analysis (PCA) plot of the variables.
Sustainability 13 11543 g005
Table 1. Spearman’s rank correlation matrix for the variables studied.
VariablesAltitudeSlopeTempSoilVegetationRainfallRelative HumidityPETLand UseRunoff CoefficientKGeology
Altitude1
Slope0.121
Temp0.05−0.341
Soil0.16−0.20.481
Vegetation−0.15−0.060.0701
Rainfall−0.120.28−0.75−0.120.071
Relative humidity0.060.32−0.89−0.45−0.110.661
PET0.03−0.380.930.390.14−0.82−0.881
Land use0.010.43−0.82−0.61−0.060.520.86−0.781
Runoff coefficient0.30.62−0.110.31−0.290.270.09−0.270.051
K0.480.27−0.3−0.05−0.090.220.4−0.310.320.321
Geology−0.44−0.530.520.450.16−0.18−0.590.53−0.69−0.30−0.411
Note: Coefficients greater than 0.5 and minor than −0.5 are underlined.
Table 2. Descriptive statistics for the groups found from K-means clustering analysis for the categorical variables.
Categorical Variables
VariableClass1 (n = 15)2 (n = 32)3 (n = 19)
Slope0–586.6784.3836.84
5–1013.3315.6336.84
10–300021.05
>30005.26
SoilRegosol73.3328.1310.53
Phaeozem20078.95
Planosol065.630
Leptosol03.1310.53
Fluvisol6.6700
VegetationCrassicaule shrubland6.679.385.26
Chaparral0042.11
Oak0010.53
Natural grassland93.3390.6321.05
Pine0021.05
Land useBare ground10021.88100
Temporary farming078.130
GeologyRhyolite012.5057.89
Ignimbrite10021.8836.84
Basalt005.26
Alluvium062.500
Lutite03.130
Note: Data are represented in percentage (%).
Table 3. Descriptive statistics for the groups found from K-means clustering analysis for the numerical variables.
Numerical Variables
VariableUnit1 (n = 15)2 (n = 32)3 (n = 19)
MinMaxMeanSDMinMaxMeanSDMinMaxMeanSD
Altitudemasl190022002046.6774.3220002300210071.84190028002368.42260.45
Temp°C13.3013.4113.600.0713.4013.7013.580.0713.3013.6013.420.09
Rainfallmm500520513.336.17440520501.2518.27490520514.219.61
Relative humidity%585958.30.46565856.410.80575958.210.79
PETmm668677671.272.01671678675.4720.06668675670.472.20
Runoff coefficient-0.150.40.200.090.150.60.310.090.300.880.440.15
Km/d0.0050.8640.2970.376.39 × 10−90.540.070.130.0040.8640.440.34
Min = minimum, Max = maximum, SD = indicates standard deviation, n = indicates number of analyzed points by cluster.
Table 4. Summary of the PCA loadings on the variables.
VariablesPrincipal Component Matrix
PC1PC2PC3PC4
Altitude0.3280.444−0.2590.644
Slope0.5200.5700.140−0.278
Temp−0.9090.185−0.1360.104
Soil−0.4910.3950.4400.306
Vegetation−0.107−0.4150.5880.280
Rainfall0.568−0.1560.7040.127
Relative humidity0.936−0.141−0.0040.030
PET−0.9280.073−0.1020.103
Land use0.916−0.181−0.099−0.057
Runoff coefficient0.1400.7830.363−0.317
K0.5300.206−0.0560.452
Geology−0.798−0.1380.317−0.075
Eigenvalue5.2931.6421.3951.017
Variability (%)44.10613.68311.6268.471
Cumulative (%)44.10657.78969.41577.886
Note: Coefficients greater than 0.5 and minor than −0.5 are underlined.
Publisher’s Note: MDPI stays neutral with regard to jurisdictional claims in published maps and institutional affiliations.

