1. Introduction
Numerous studies have been conducted on the potential of energy recovery in water supply and distribution systems, with several successful installations globally [
1,
2,
3,
4]. Small-scale hydropower technology, applied in Water Supply Infrastructure, has been demonstrated to be a viable renewable energy to develop in South Africa [
5,
6]. Small-scale hydropower technology or energy recovery devices utilise excess energy, which is conventionally dissipated, in order to control the maximum admissible pressure in the system and to avoid pipe rupture [
7]. In both the case of a conventional pressure reducing valve (PRV) and energy recovery devices (ERD) such as hydro turbines, a pressure drop across the component allows for downstream pressure control [
8].
Since leakages are proportional to pressure within the system, a decrease in system pressure will reduce the rate of leakage from the system [
9]. Extensive research has been conducted on leakage reduction through pressure management in water supply and distribution systems. Challenges faced with pressure management are related to the determination of the number, location, and optimal control settings of pressure management devices such as conventional PRVs or ERDs such as hydro turbines or pumps-as-turbines (PAT). The last decade has seen many researchers investigating the optimization of pressure management in water supply/distribution networks employing optimization techniques including linear programming (LP), nonlinear program (NLP) algorithms, mixed integrated nonlinear programming (MINLP), mathematical programming with complimentary constraints (MPCC), and genetic algorithms (GAs) [
9,
10]. Interest in leakage reduction as a benefit of energy recovery has rapidly gained popularity along with the drive for more sustainable societies and resilient infrastructure networks [
11,
12]. Several researchers shifted focus to recovering excess pressure from water supply networks while reducing water losses at the same time [
13,
14,
15].
Creaco and Haidar [
16] developed a methodology proposing a hybrid algorithm that attempts to find an installation of control valves for pressure management in District Metered Areas (DMAs) based on the total installation cost, daily leakage volume, and demand uniformity.
Analysis of the previous research [
1,
2,
3,
4,
5,
6,
7,
8,
9,
10,
11,
12,
13,
14,
15,
16] catalysed the 2020 research study by Bonthuys et al. [
17], which developed a procedure employing a genetic algorithm (GA) to identify and optimize the location and sizes of hydro-turbine installations or conduit hydropower installations for energy recovery. The procedure, named PERRL [
17], differed from the Creaco and Haidar [
16] methodology by specifically focusing on energy recovery rather than pressure management. Bonthuys et al. [
18] improved the developed procedure to include extended period simulations, enabling the analysis of demand patterns and demand uniformity similar to Creaco and Haidar [
16]. The improved procedure was termed PERRL 2.0.
A comparison of the PERRL 2.0 procedure and recent related research studies in energy recovery and leakage reduction was undertaken. The comparison focused on the study methodology and the conclusions with regards to both energy recovery and leakage reduction. A summary of the recent research studies related to energy recovery and leakage reduction from water supply and distribution networks is shown in
Table 1.
From
Table 1, it can be seen that recent studies on energy recovery predominantly focusses on identifying the optimal installation locations within a network based on hydraulic capacity and economic feasibility. The addition of energy balances to the latest research studies improved the evaluation of excess energy in water distribution systems.
Research conducted on the leakage reduction as an effect of pressure management was not included in the comparison in
Table 1, and only studies which focused on leakage reduction as a benefit or value-add from energy recovery were considered. As can be seen from
Table 1, several studies included analyses of the effect of energy recovery on pressure management and leakage reduction, however, none included the benefits (economic, environmental, social) of leakage reduction in the optimisation procedure employed.
Within the South African context, the series of rolling blackouts, known as load-shedding, that started in 2008 when the total electricity demand within the country started encroaching on the supply capacity [
27] sparked various studies on alternative energy supply. Additionally, studies on leakage detection and reduction methods have been sparked by recent severe droughts that have plagued the KwaZulu Natal and Western Cape provinces following poor rainfall during the 2014 to 2017 rainy seasons.
In May 2018, storage reservoirs in Cape Town, in the Western Cape province of South Africa, dropped to about 20%. This resulted in the implementation of strict water-usage restrictions to delay water levels from reaching 13.5%, at which point total failure of the Cape Town Metropolitan Municipal Water Supply System would have occurred [
28]. Above average rainfall in the remainder of 2018 allowed the City of Cape Town to avoid a complete water supply system failure. The effects of the droughts were worsened by poor water-management practices and infrastructure deficiencies [
29,
30]. Although it remains a priority to understand the probability of similar meteorological droughts in future it is imperative to start facilitating the improvement of water-management practices as well as the infrastructure necessary to develop a more resilient system [
28].
The Stellenbosch Local Municipality, situated to the northeast of the City of Cape Town, receives two-thirds of its municipal water from Cape Town via the Wemmershoek and Theewaterskloof dams, resulting in Stellenbosch experiencing similar water distress during the drought period. In 2018, the Stellenbosch municipality imposed strict water restrictions‚ limiting users to 6000 L a month and banning several uses of potable water, such as its application for gardening. Restrictions were also placed on use from groundwater sources [
31].
The current study was conducted to evaluate the Stellenbosch Local Municipality’s Water Supply System’s suitability for energy recovery installations, and to quantify the potential leakage reduction emanating from such energy recovery installations. The PERRL 2.0 procedure developed by Bonthuys et al. [
18] was incorporated in the analysis of the Stellenbosch Local Municipality Water Supply System.
2. Methodology
The objective of the study is to test the application of the PERRL 2.0 procedure [
18] and assess the advantage thereof in terms of the operation of a District Metered Area (DMA). The PERRL 2.0 procedure is an enhanced optimization procedure which incorporates user-defined weighted importance of specific objectives and extended period simulations into a genetic algorithm (GA) that identifies the optimum size and location of potential installations for energy recovery and leakage reduction [
18].
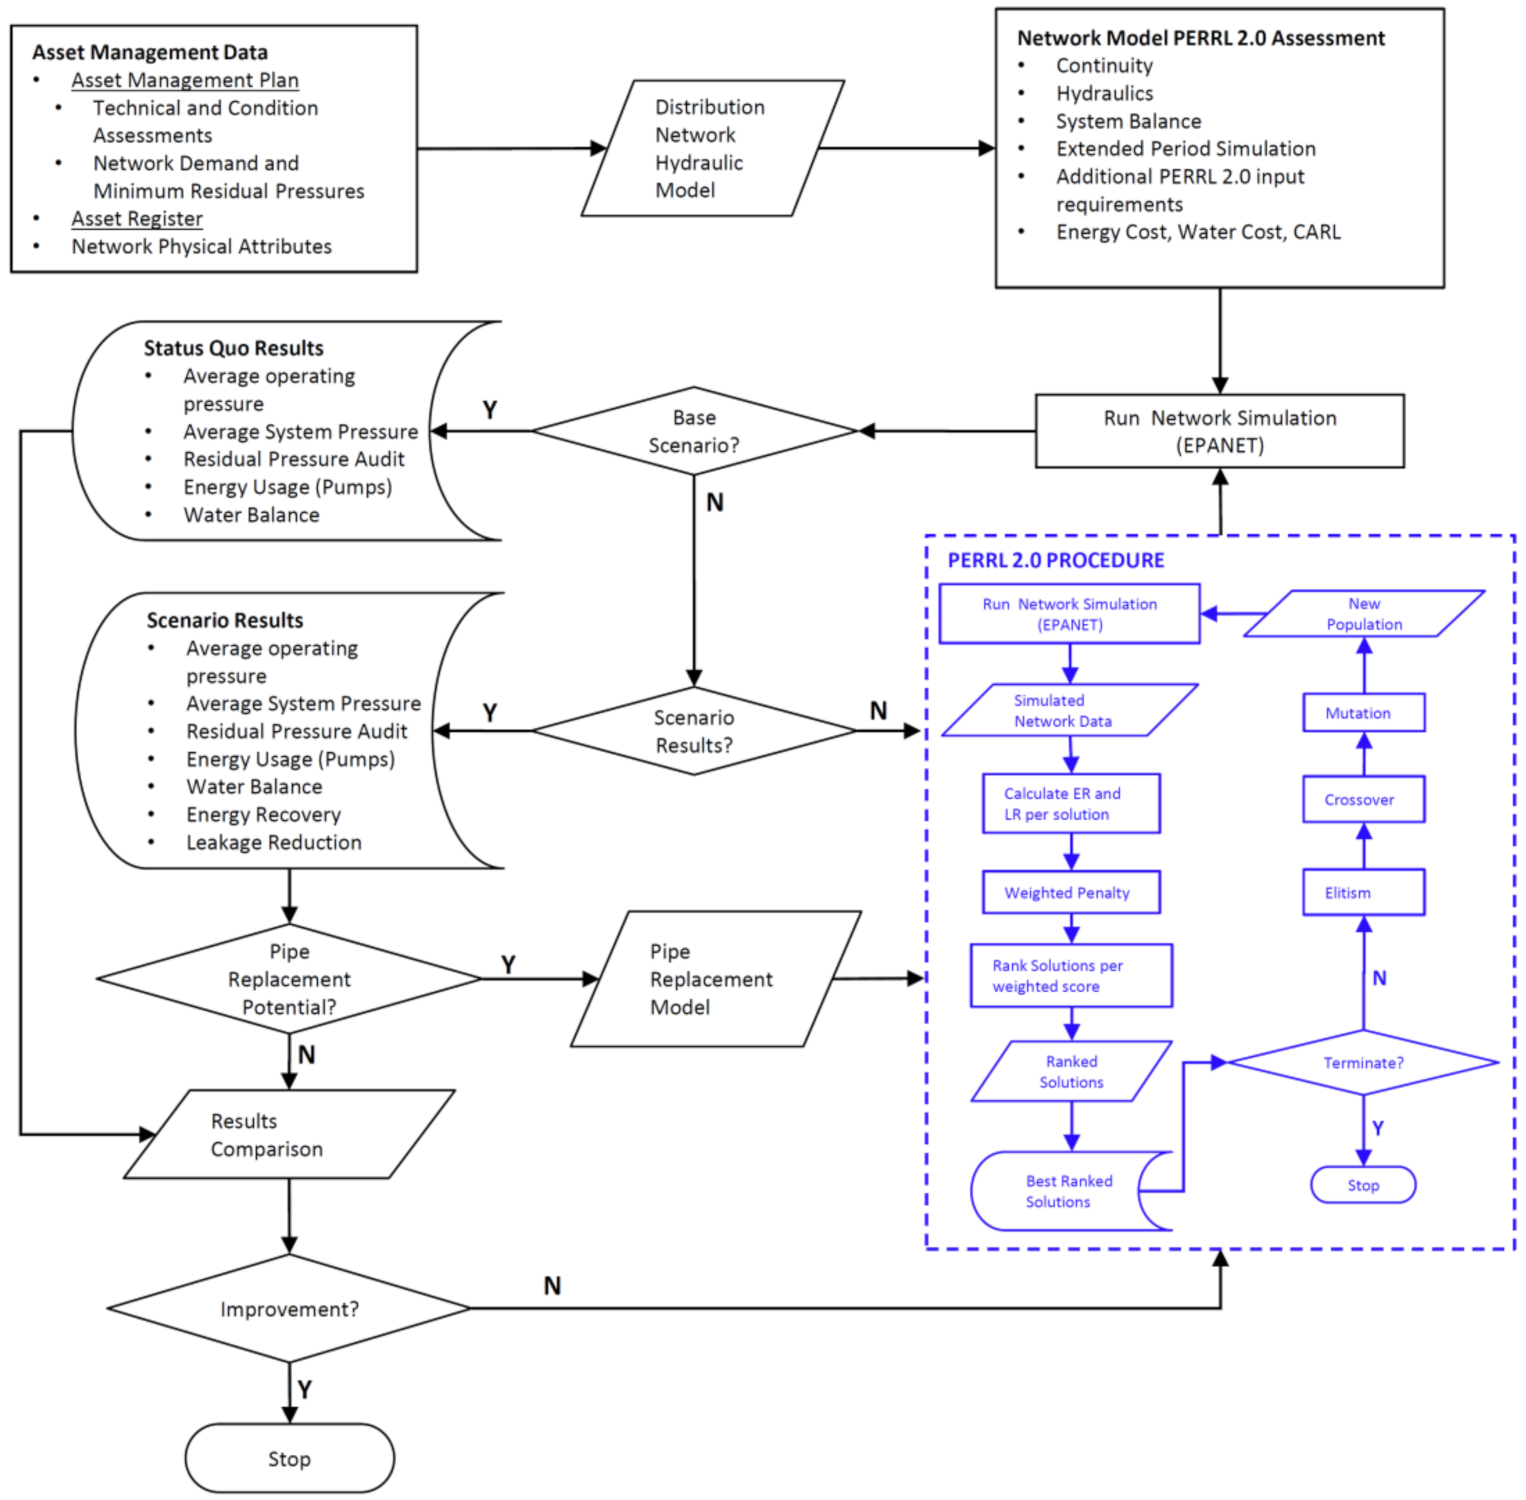
The methodology of the study can be outlined as shown in
Figure 1. To meet the study objective, the PERRL 2.0 procedure was used to evaluate the energy recovery and leakage reduction potential within the Stellenbosch Water Distribution Network, and the subsequent effects the installation of the recommended energy recovery devices would have on the operation of the network.
The paper first evaluates the suitability of the current Stellenbosch Water Distribution Network Model for use within the PERRL 2.0 procedure to obtain a simplified, stable, and closely representative model of reality. The current Stellenbosch Water Distribution Network Model as obtained from the Asset Management Operations of the Stellenbosch Local Municipality. All changes made to the current model, to make it adaptable for use within the PERRL 2.0, procedure have been documented and the effect of these changes on the baseline hydraulic analysis has been evaluated.
The energy recovery installations identified using the PERRL 2.0 procedure, were modelled within EPANET to obtain hydraulic analyses comparable to the baseline hydraulic analysis. The comparison served as a basis for evaluating the energy recovery installations identified by the PERRL 2.0, hereby assessing the efficacy and applicability of the procedure to the Stellenbosch Water Distribution Network.
Finally, the comparison of the energy recovery hydraulic analyses and the baseline hydraulic analysis, was used to identify additional areas where infrastructure changes, such as pipe replacement programs, increase the potential for energy recovery within the system.
3. Stellenbosch Water Distribution Network
The Stellenbosch Local Municipality (LM) is responsible for the governance of the towns of Stellenbosch, Franschhoek, and Pniel, as well as a number of rural towns, in the Western Cape Province of South Africa. The Stellenbosch LM covers approximately 900 km
2 and supplies water to approximately 199,800 people, including a fairly extensive industrial area. Water supply to the consumers in the Stellenbosch LM is achieved through the following water supply systems [
32]:
Stellenbosch (Jonkershoek and Theewaterskloof tunnel);
Franschhoek;
Wemmershoek (treated water imported from the City of Cape Town);
Blackheath (treated water imported from the City of Cape Town);
Faure (treated water imported from the City of Cape Town);
Other own sources (Boreholes).
The total water supply system is comprised of 56 reservoirs, holding tanks, and water towers, 36 water pump stations, 35 pressure-reducing valve installations, 667 km of pipeline, and 79 water supply zones, with a bulk water input of 8,015,027 kL in 2019/20 or an annual average daily demand (AADD) value of 21.9 ML/day. A total of 69% of the AADD is supplied by the three water treatment works managed by the LM, namely, Ida’s Valley, Paradyskloof, and Franschhoek.
Based on the municipality’s IWA Water Balance sheet for 2019/20 shown in
Table 2, the municipality recorded 20.5% for non-revenue water (NRW) and 6.5% for Real Network Losses which is below the best practice value of 15% [
32]. The Stellenbosch LM Long Term Water Conservation and Demand Management (WC/WDM) Strategy was approved by Council in February 2014 and updated in 2019. The strategy implicitly includes measures to further reduce real water losses in the water network.
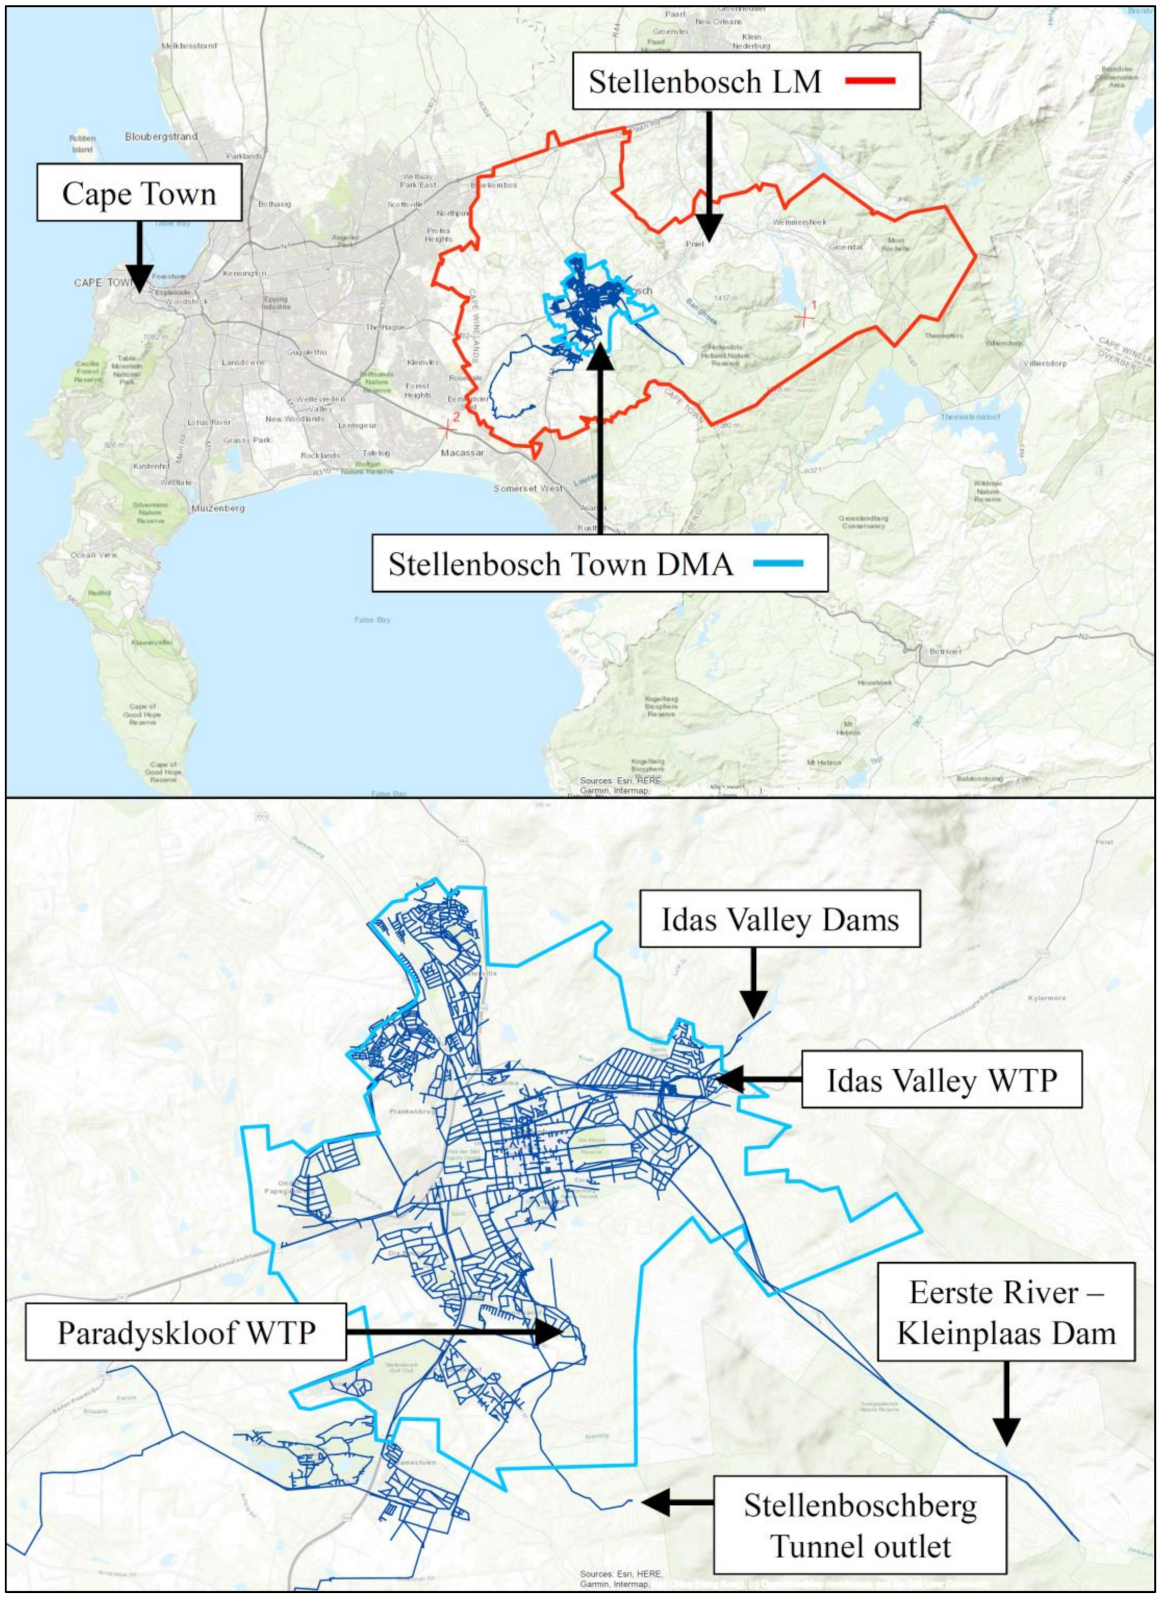
The Stellenbosch LM water supply networks can be classified into several DMAs that. For the purpose of the study, only the Stellenbosch Town DMA was modelled and analysed. The Stellenbosch Town DMA demand comprises 65% of the water supply of the entire Stellenbosch LM, which amounts to an AADD of 14.8 ML/day.
Figure 2 shows the locality of the Stellenbosch Town DMA and the configuration of the Water Distribution Network.
The estimated Current Annual Real Losses (CARL) in the Stellenbosch Town DMA, based on the municipality’s 6.9% for Real Network Losses, is roughly 350,000 kL.
The two main sources of raw water supply for the Stellenbosch Town are as follows:
The Jonkershoek Weir diverts water from the Eerste River in the Jonkershoek Valley at Kleinplaas Dam and conveys it to two off-channel storage dams in Idas Valley through a gravity pipeline. The Jonkershoek Weir combined with the two Idas Valley dams is the most important source of water for Stellenbosch Town. The treatment capacity of the Idas Valley Water Treatment Plant (WTP) is 28 ML/day. The WCWSS supplies water to the Paradyskloof WTP through a pipeline leading from the Stellenboschberg Tunnel outlet of the Riviersonderend GWS tunnel system. Under normal operation, a volume of 3 Mm
3/a is available from this source. The treatment capacity of the Paradyskloof WTP is 10 ML/day [
33].
The Stellenbosch Town DMA has a varying topography with the main water sources of the Jonkershoek Weir and Stellenboschberg Tunnel outlet having elevations of 310 m and 246 m, respectively. The average elevation of consumptive nodes in the system is 134 m, with the lowest consumptive node elevation equal to 78 m and the standard deviation of node elevation equal to 34.7 m, indicating a preliminary potential for energy recovery.
As suggested in Bonthuys et al. [
34], the study leverages asset management data, contained within municipal infrastructure asset registers and asset management plans, to identify energy recovery and leakage reduction potential in municipal water distribution systems. In this particular case study, the Stellenbosch LM provided access to their IMQS data, representing the majority of data outlined in the Bonthuys et al. [
34] study. The IMQS data is contained in a GIS-centric, web-based software for Infrastructure Asset Management. IMQS data is conventionally used for the maintenance and operational planning of physical water infrastructure assets by integrating with specialist hydraulic software packages to offer a geographically linked, infrastructure-lifecycle-focused representation of a municipality’s water reticulation network [
35].
In addition to the Stellenbosch LM IMQS asset management data, the latest Wadiso planning model for the Stellenbosch LM was also received. Wadiso is a comprehensive application for the analysis and optimal design of water distribution systems through its inclusion of a seamless interface to the public domain EPANET program module which is used in the PERRL 2.0 application [
36]. However, the Wadiso model data received was for a steady state analysis on the peak operation of the LM, whereas the PERRL 2.0 procedure uses an extended period simulation. The differences in analyses or simulation types coupled with the several other issues related to the interface between Wadiso, EPANET and the PERRL 2.0 procedure, necessitated certain amendments to the current numerical Stellenbosch Water Distribution Network Model.
4. Amendments to Stellenbosch Water Distribution Network Model
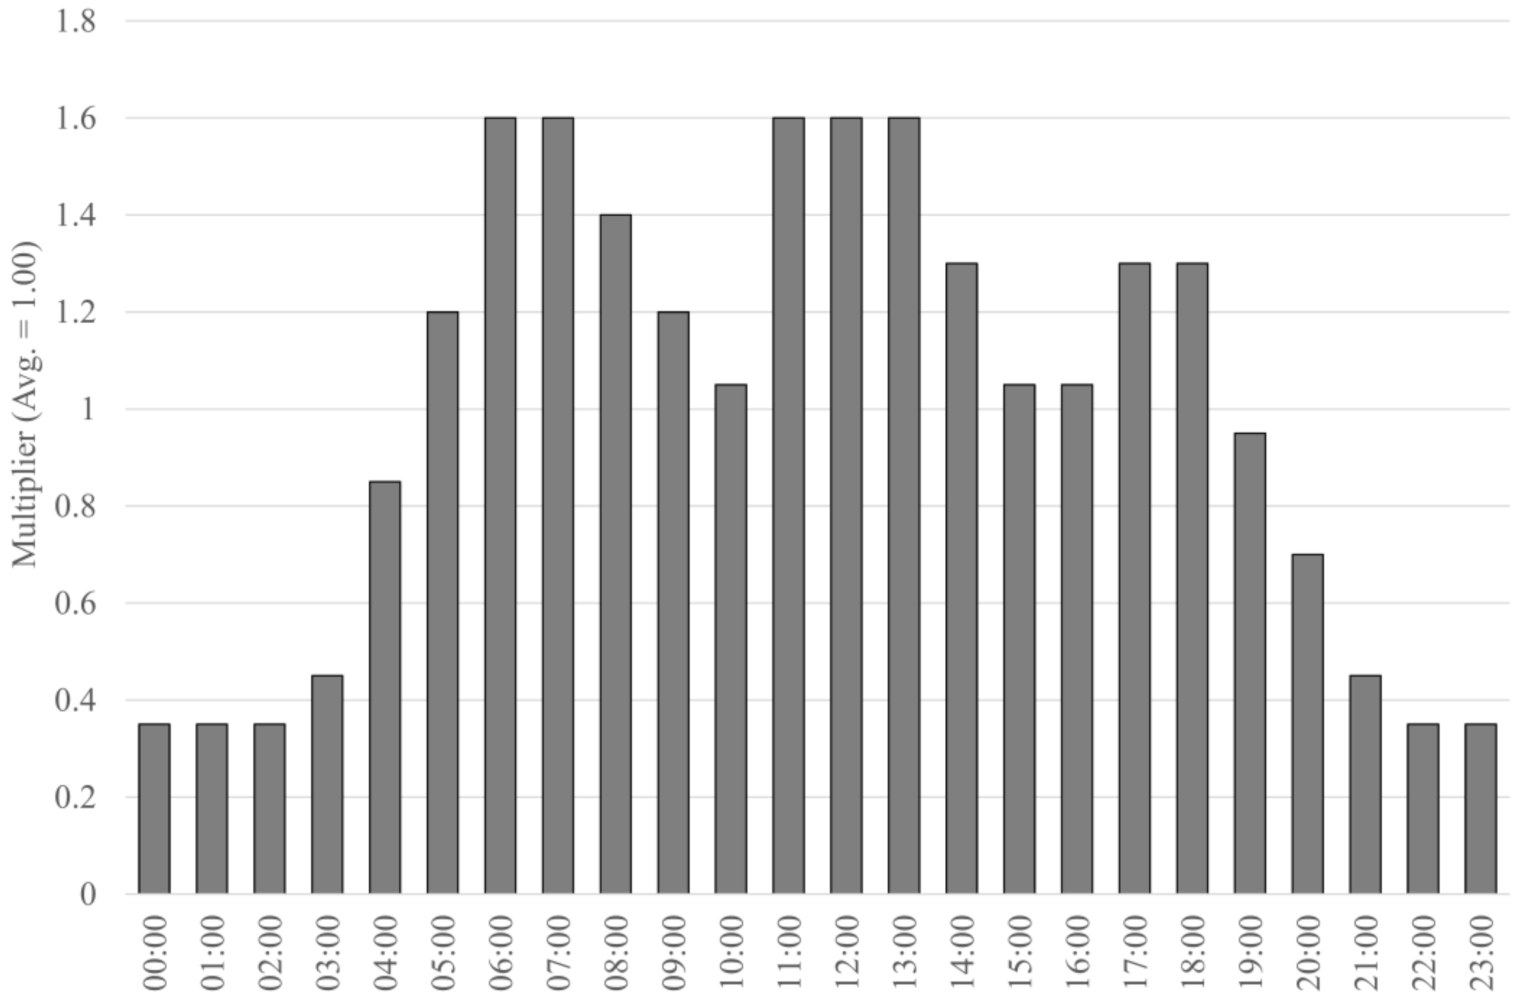
Several amendments to the current Stellenbosch LM Water Distribution Network Model were required to optimally run the PERRL 2.0 procedure and analyse and evaluate the energy recovery and leakage reduction potential in the network through the installation of energy recovery devices. The most prominent change was the introduction of a demand pattern to enable the extended period simulation employed by the GA within the PERRL 2.0 procedure. Standard residential demand patterns, for the applicable levels of service, were used for the extended period simulation similar to the demand pattern employed by Bonthuys et al. [
34] (
Figure 3).
Implementing the demand pattern and changing the model from steady state peak analysis to extended period simulation resulted in model and procedural instabilities. These instabilities centred around the synergy between the PERRL 2.0 procedure and the EPANET model outputs. The PERRL 2.0 procedure was developed to use a 24 h, hourly timestep Extended Period Simulation (EPS). The hydraulic time step in EPANET was also set by the user to 1 h. However, in EPANET, time steps shorter than normal occur automatically in cases of one of the following events [
37]:
the next output reporting time period occurs;
the next time pattern period occurs;
a tank becomes empty or full;
a simple control or rule-based control is activated.
Further analyses of hourly flows in and out of tanks in conjunction with tank storage volumes indicated that the filling and emptying of tanks occurred at intervals shorter than the set hydraulic timestep. This resulted in an unbalanced system, runtime errors, and reporting periods shorter than the 1-h intervals required by the PERRL 2.0 procedure. The issue was overcome through a reduction in the set hydraulic time steps and the amendment of several tank storage sizes, to reflect the actual current operations more accurately and to overcome the errors due to tanks filling or emptying in shorter time steps than the set hydraulic timestep.
In addition to these amendments, an analysis on the roughness coefficients of the current network scenario was conducted in order to better estimate pressure losses. This was conducted by identifying the pipes with higher-than-average roughness coefficients for known materials.
Table 3 shows a comparison of the roughness coefficients for the different pipe materials in the modelled data with the recommended ranges from literature. The percentage of modelled pipe concluded as “aged” or in bad condition, due to low Hazen Williams C-Factors in the source data, are shaded in
Table 3.
All pipe segments were also evaluated in terms of head loss (m), pipe length (m), and unit head loss (m/km). The worst hydraulically performing pipe segments, in terms of head loss and unit head loss were isolated and are shown in
Table 4.
From the above analysis, two different scenarios were proposed for the analysis of energy recovery potential within the Stellenbosch Town DMA network.
Scenario 1—Base scenario analysis with the amended Stellenbosch Water Distribution Network Model as the status quo, excluding energy recovery installations;
Scenario 2—Analysis of the status quo using PERRL 2.0;
Scenario 3—Analysis of energy recovery potential with the following amendments to the network:
- a.
Replacement of “aged” pipe segments for a defined length upstream of energy recovery locations identified in Scenario 1;
- b.
Replacement of defined percentage of “aged” pipes and re-application of the PERRL 2.0 procedure.
5. Scenario 1—Base Scenario Analysis
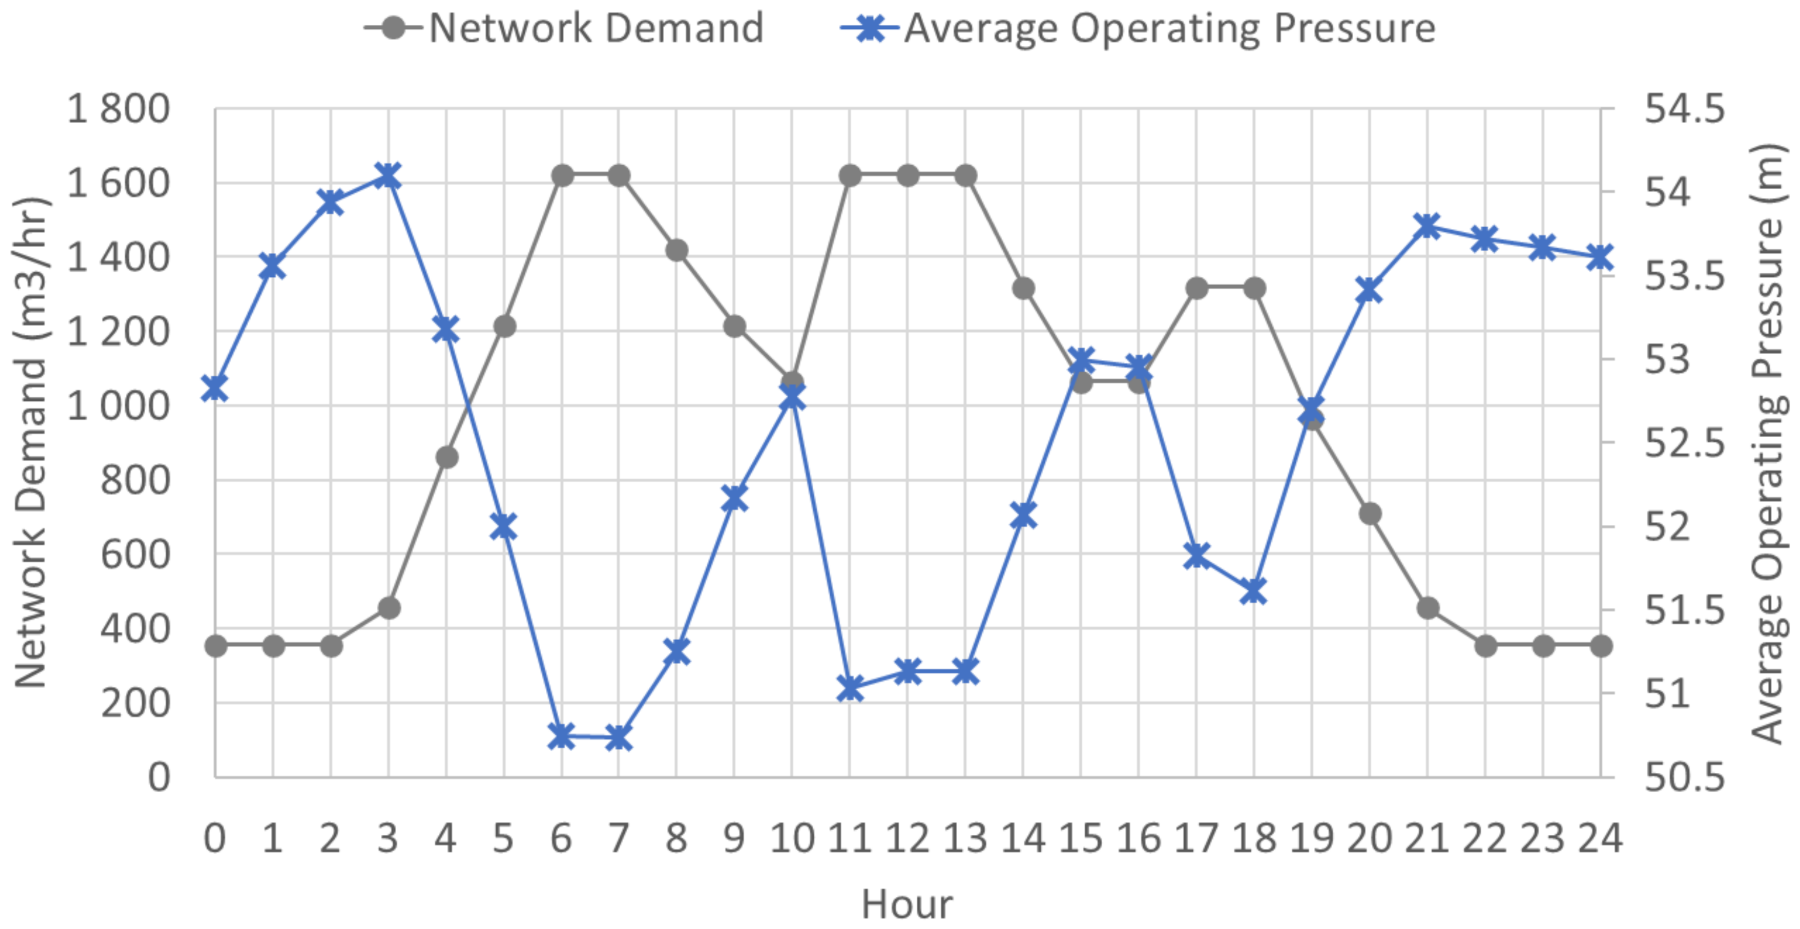
To evaluate the starting network performance, a base scenario was run using the EPANET software.
Figure 4 shows a comparison of the average operating pressure of all consumptive nodes and the consumed flow within a 24-h modelled operation of the network.
As it can be seen, the hourly averaged operating pressure, at the consumptive nodes in the base scenario operation of the Stellenbosch Town DMA, fluctuates between 50 and 55 m of pressure with minimum values obtained during the hours where the network demand is at the maximum. The Council for Scientific and Industrial Research [
41] specifies the minimum residual pressure within the South African municipal water services environment as 24 m (2.4 bar) for house connections under instantaneous peak demand. So, it is clear that pressures within the system are above the minimum acceptable limit, and the potential excess pressure in the system could be exploited through ERD.
Figure 5 shows the distribution of the hourly operating pressure at consumptive nodes in the system during both peak (06h00—07h00) and off-peak (22h00—02h00) times. From
Figure 5 the median of the peak and off-peak operating pressures can be calculated as 50.8 m and 53.3 m, respectively. In both instances, more than 90% of the consumptive nodes are operating at pressures above the acceptable minimum residual pressure, and more than 50% are operating above double the acceptable minimum residual pressure, further indicating the potential for energy recovery within the system.
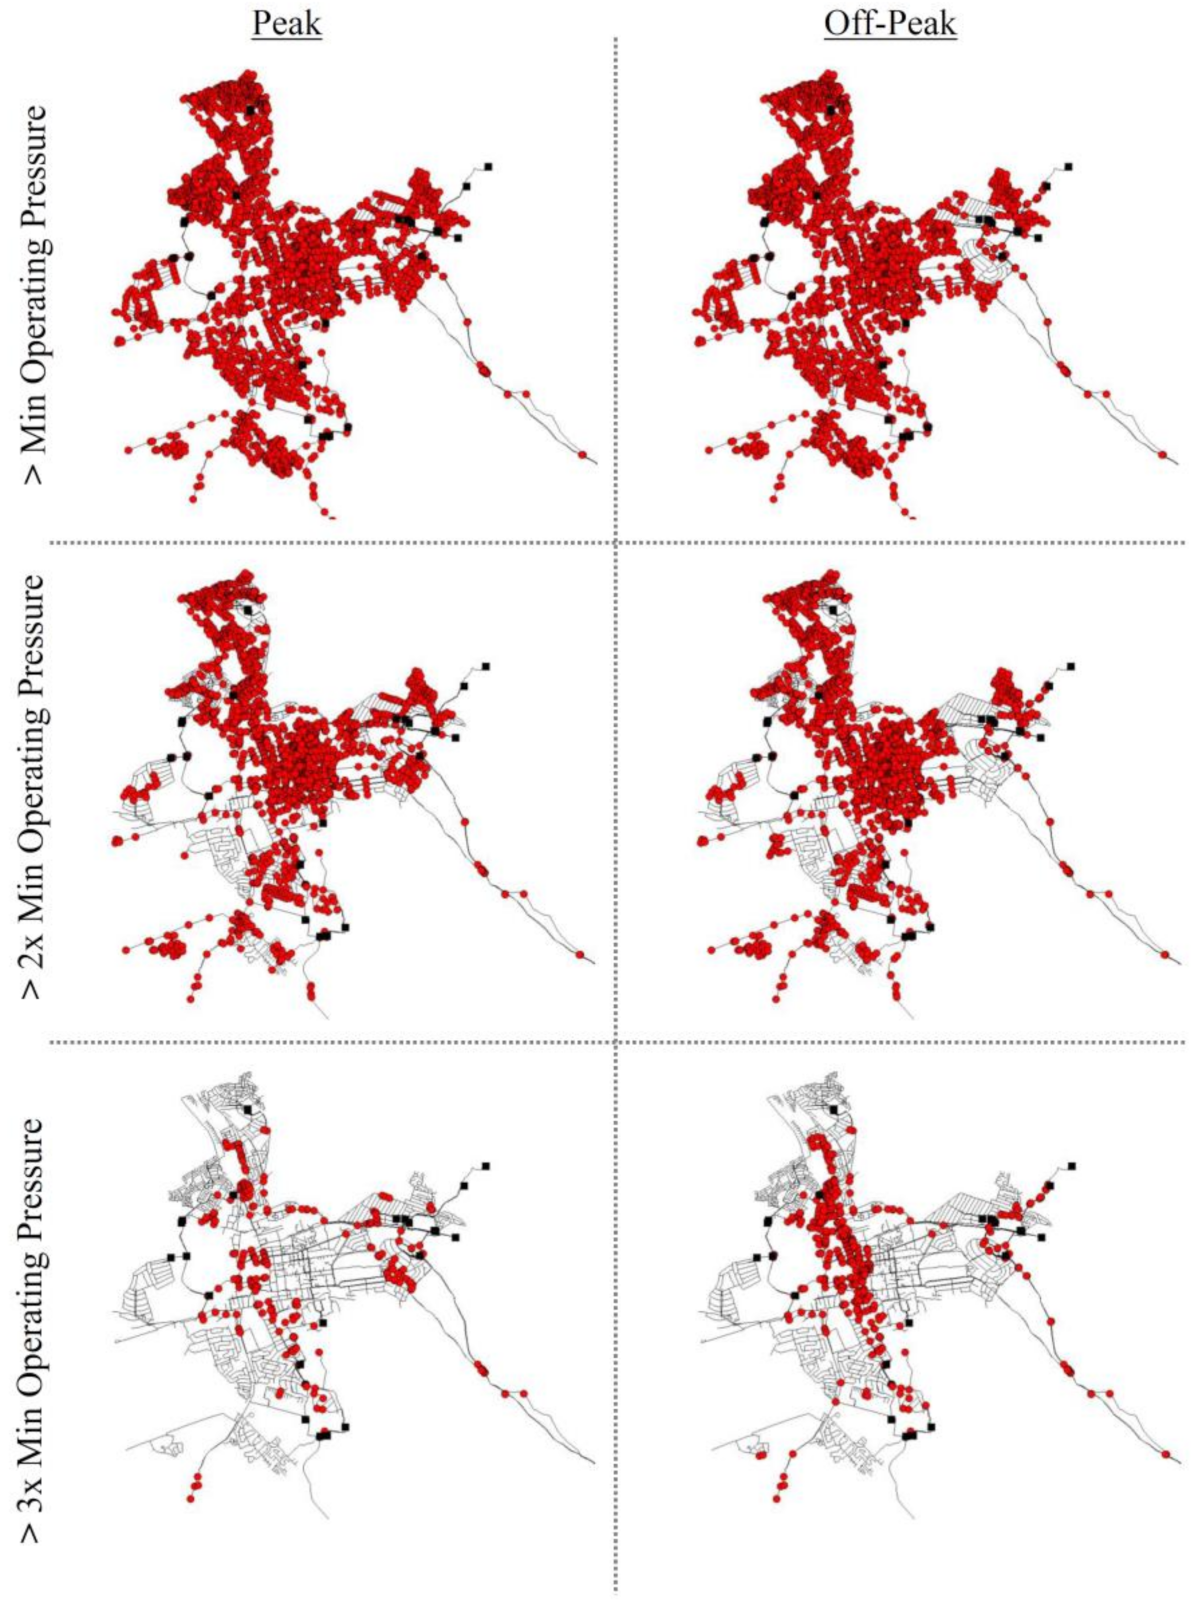
Figure 6 shows the spatial distribution of different operating pressure ranges for the base scenario of the Stellenbosch Town DMA during peak and off-peak operations. As it can be seen, there is a significant percentage of the consumptive nodes characterized by operating pressure values exceeding double the inferior limit and a number of them with operating pressure values exceeding the triple of the inferior limit.
The following metrics (
Table 5) were calculated from the results of the base scenario run (Scenario 1) and used in the evaluation of solutions from Scenario 2 and 3 discussed in the following sections.
6. Results and Discussion
The base scenario analysis of the Stellenbosch Town DMA showed potential for energy recovery. The mean operating pressures calculated at the consumptive nodes, for both the peak and off-peak hours, are considerably more than the minimum residual pressure prescribed by the Council for Scientific and Industrial Research [
41].
The results of both Scenarios 2 and 3 are shown in the following sections and discussed in
Section 7.
6.1. Scenario 2
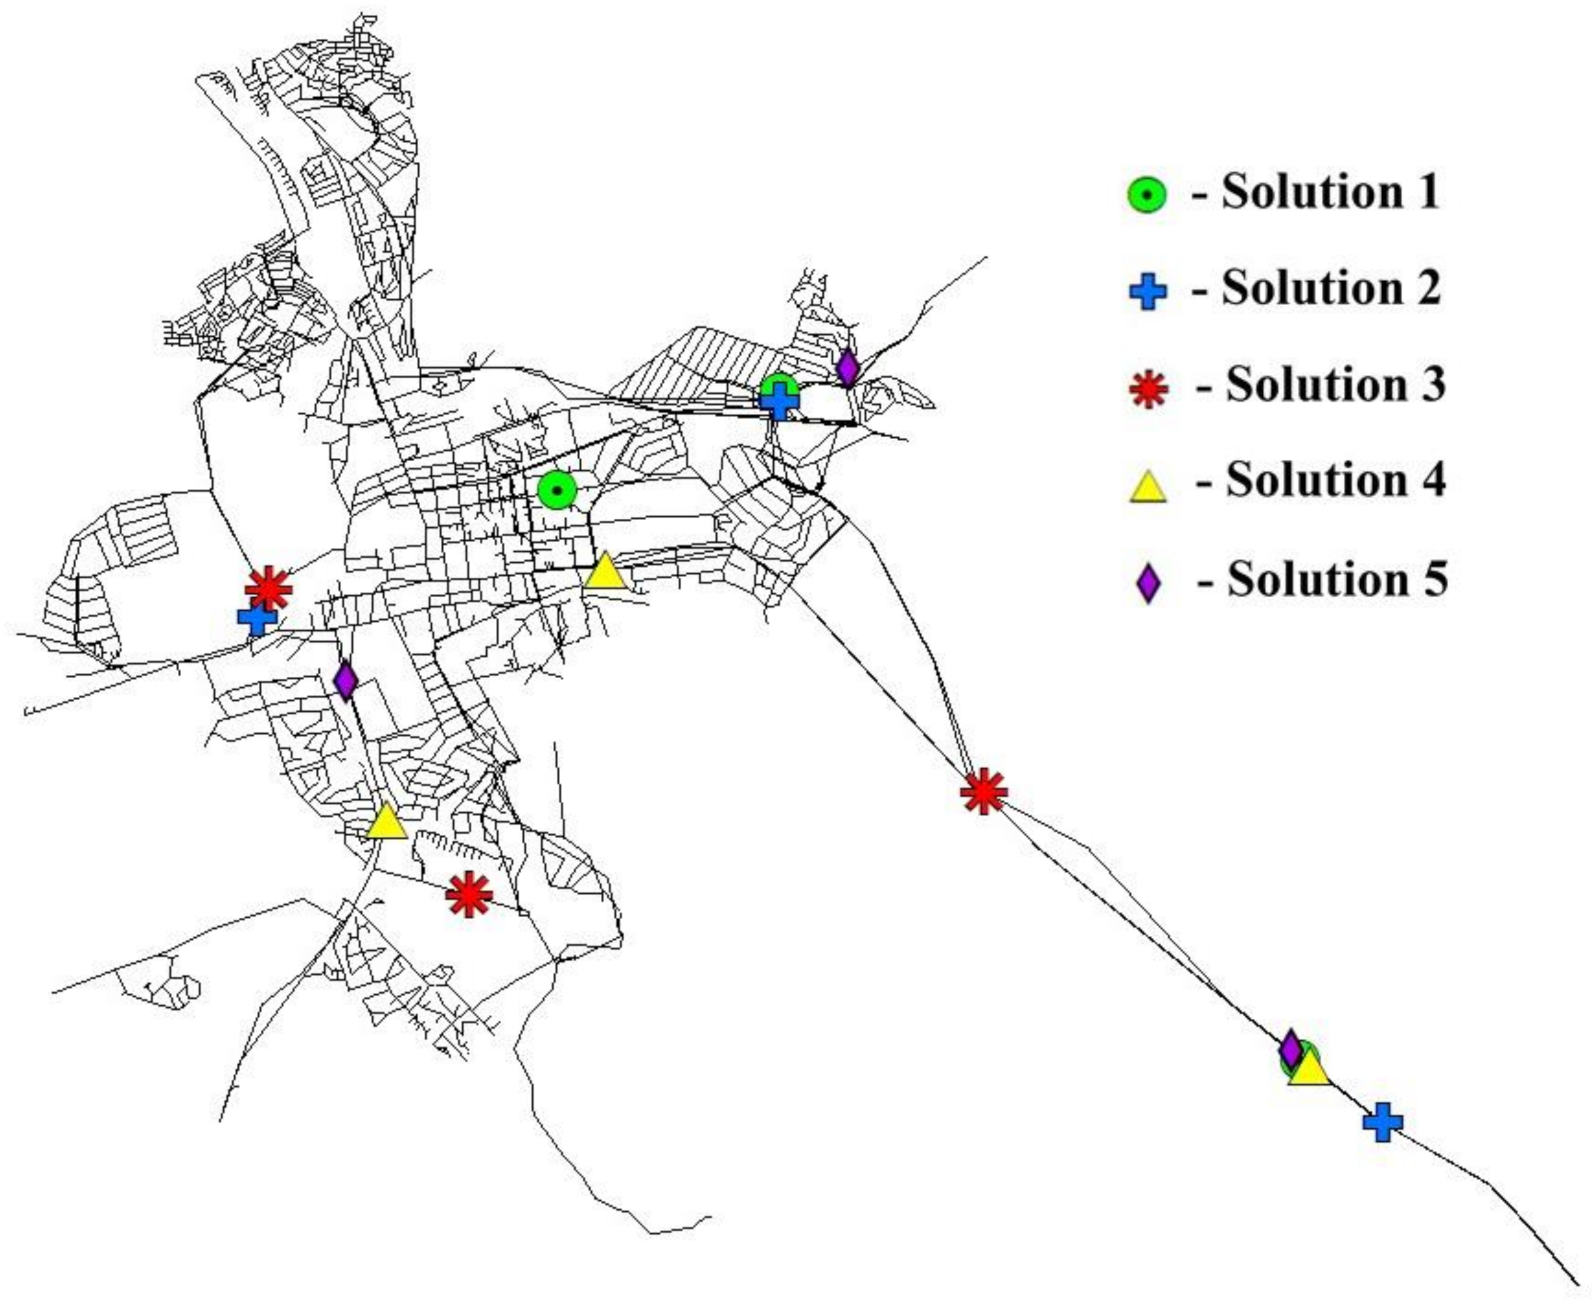
Figure 7 shows the three energy recovery locations for the five top ranked solutions for energy recovery and leakage reduction in the Stellenbosch Town DMA for the Scenario 2 analysis. The main performance metrics of these five solutions are summarized in
Table 6, which also reports the total energy recovery and leakage reduction potential. In the Table, the proposed solutions are compared with the base case scenario discussed in
Section 5.
6.2. Scenario 3
Table 7 shows the pipe sections upstream of the energy recovery locations (Solution 3—Scenario 3), which has been replaced by new uPVC pipes. Link 3 582 is on one of the 450-mm diameter main supply lines from the Jonkershoek Weir. The entire length of pipe from Link 3 582 back to the supply from the Jonkershoek Weir was modelled to be replaced.
Scenario 3a was run with the preferred proposed energy recovery solution as per Scenario 2 (Solution 3) for the base case hydraulics and roughness parameters, as well as the amended roughness parameter corresponding to the proposed pipe replacement (
Table 8).
For Scenario 3b, 10%, 25%, and 50% of all the “aged” pipes identified in
Table 3 were replaced by uPVC pipes with roughness parameters within the recommended range for new pipes. For Scenario 3b, the effect of pipe replacement on the CARL within the system was also incorporated by reducing the CARL proportionally to the sizes and lengths of the pipes replaced.
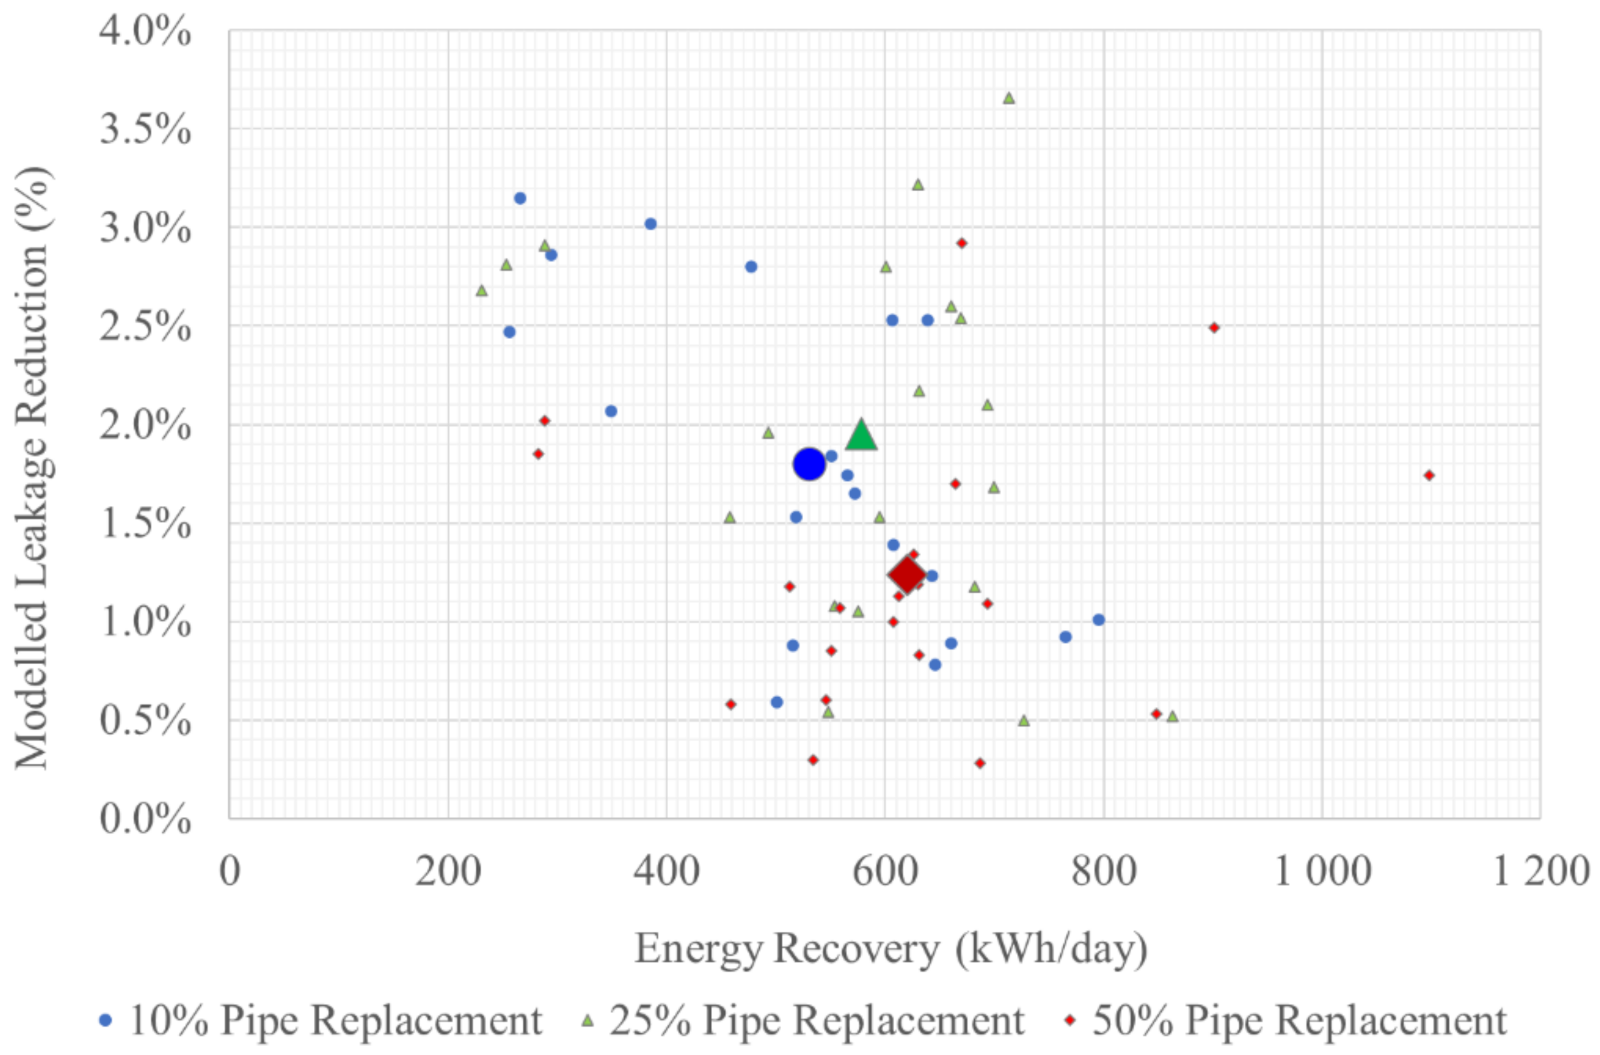
Figure 8 shows the modelled leakage reduction and energy recovery for the system post pipe replacement for the top 20 solutions of each pipe replacement scenario. The large markers were used for each pipe replacement scenario to indicate the average modelled leakage reduction and energy recovery.
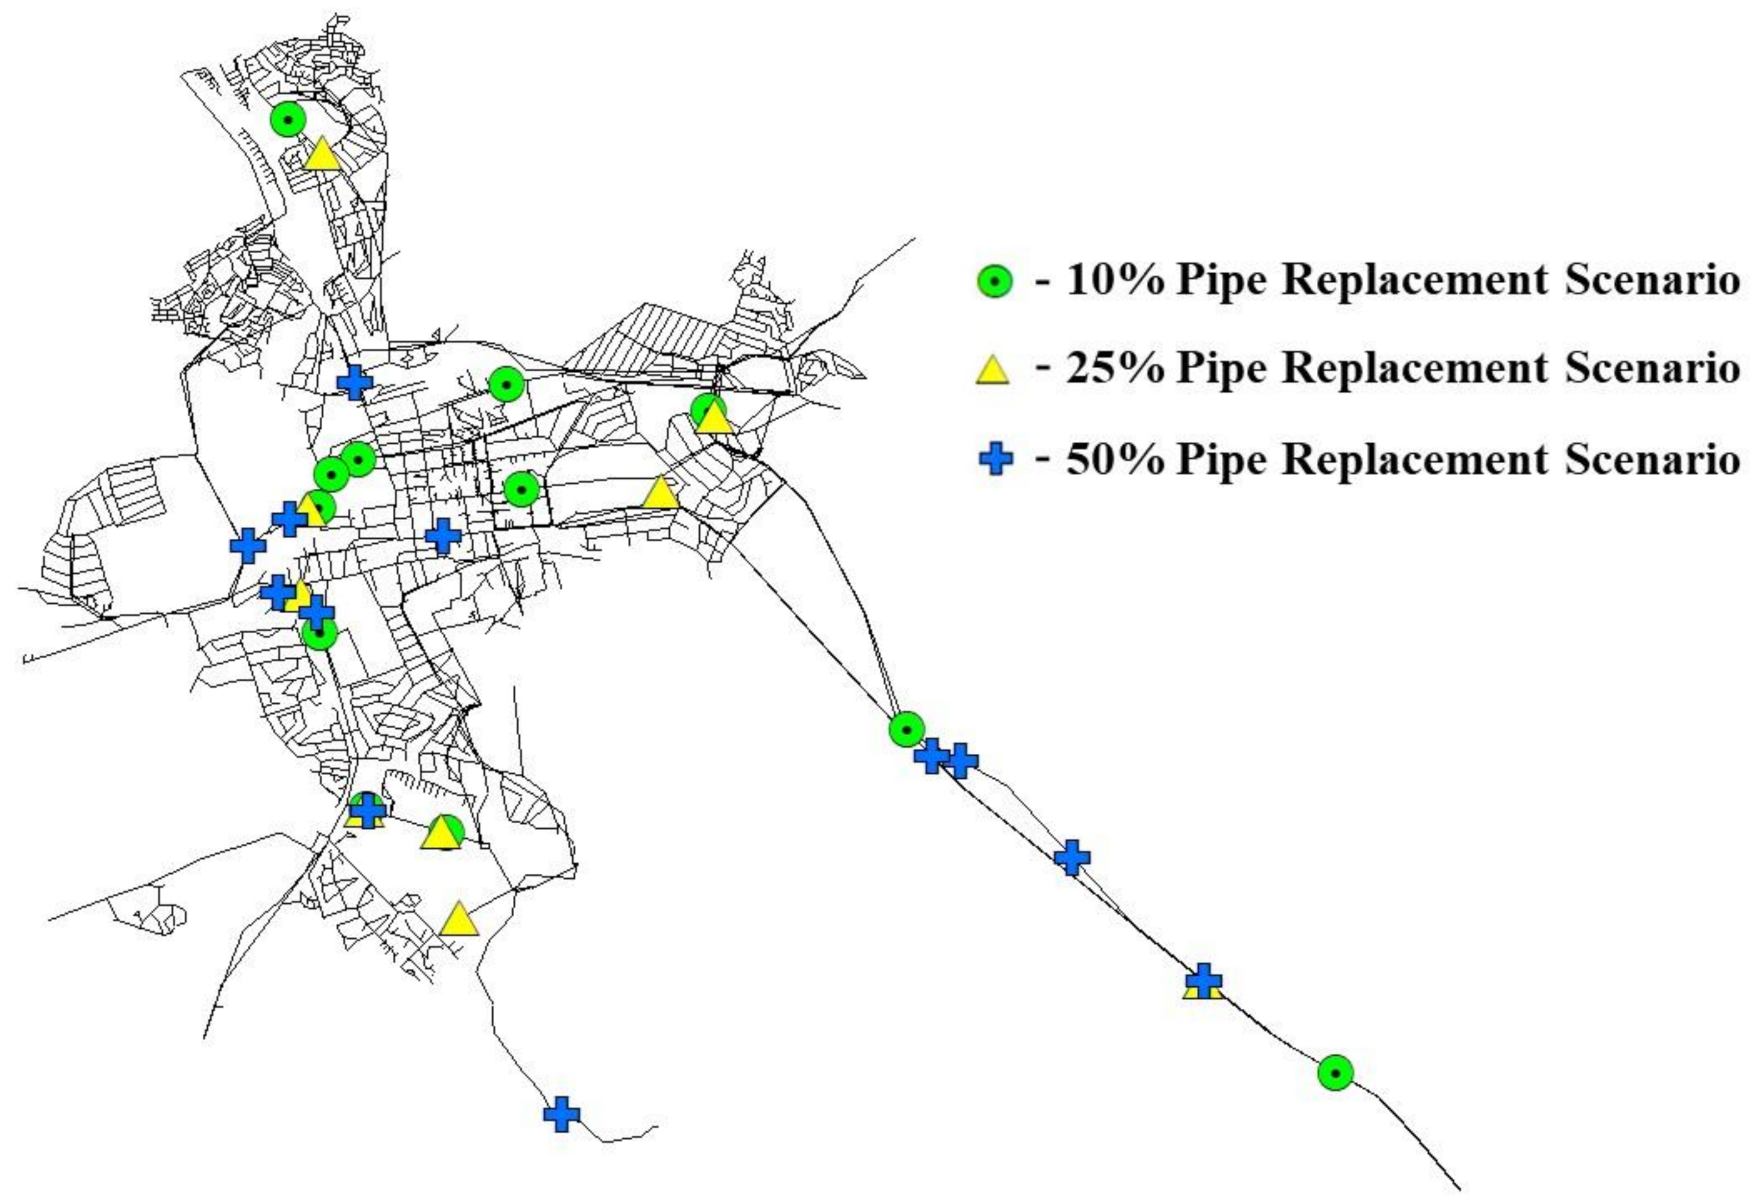
Figure 9 shows the location of the three energy recovery locations (sites) for the top five proposed energy recovery solutions for Scenario 3b with 10%, 25%, and 50% of all the “aged” pipes, whereas
Table 9 shows the comparison between the solutions for Scenario 3b and the base case scenario. Some of the top five proposed energy recovery solutions identified the same or very similar locations for more than one solution. For the sake of clarity, in
Table 9, only the top proposed energy recovery solution was reported.
7. Discussion
The Stellenbosch Town DMA was analysed using the PERRL 2.0 procedure to identify potential for energy recovery and to optimize the size and location of the energy recovery installations, based on several factors including the potential for leakage reduction. In Scenario 2 the DMA is analysed with the current network hydraulics as described in
Section 3 and
Section 4. The varying topography and clear potential for energy recovery highlighted in
Figure 5 and
Figure 6, coupled with the dynamic nature of a network supplied by numerous sources and several consumptive nodes with operating pressures above the minimum residual pressure, made the PERRL 2.0 procedure an ideal analysis method for energy recovery optimization.
The desktop analysis as well as the base case scenario run of the Stellenbosch Town DMA indicated a large degree of “aged” pipes in the network with low roughness coefficients causing high friction losses and less available potential head for energy recovery. High friction losses, however, lower the average operating pressure in the system and in turn cause lower losses due to leakages. However, the high friction losses are from “aged” pipework, which is more susceptible to damage and subsequent leakage. Pipe replacement lowers the friction losses in replaced pipe segments and potentially increases the available head for energy recovery. Higher available head, however, also results in higher leakages from the system, although pipe replacement by nature decreases the number of damaged pipes and in turn the leakage from the system. Scenario 3 was run to analyse the effect of selective pipe replacement on energy recovery and leakage reduction within the Stellenbosch Town DMA.
The results shown in
Section 6 are discussed in more detail in the following sections.
7.1. Scenario 2
Scenario 2 was run using the base case hydraulic characteristics of the Stellenbosch Town DMA, and applying the PERRL 2.0 optimization procedure, which incorporates the user-defined weighted importance of specific objectives and extended-period simulations into a genetic algorithm, to identify the optimum size and location of potential installations for energy recovery and leakage reduction [
18].
Within the PERRL 2.0 process, 10 independent simulation runs, with an initial population of 100 and an energy-recovery location number set to 3, were performed. The PERLL 2.0 process is a multi-objective optimization procedure, and the independent simulation runs were used to define a Pareto frontier. Similar to previous research [
18], the objective functions within the PERRL 2.0 optimization procedure included maximizing the energy recovered and minimizing the cost of water lost through leakage by an overall leakage reduction in the network. The potential yearly revenue along with the current annual real losses (CARL) of the system and the nominal cost of water were used within the PERRL 2.0 procedure to calculate a weighted score to rank the potential energy recovery solutions. The monetary value of energy recovered was calculated per unit rate using an average electrical cost and the water cost per kilolitre was defined as all cost savings from the leakage reduction and included the surface water abstraction and treatment electricity consumption cost, the water distribution electricity consumption cost, and the average water rate (loss of sales) [
34]. The CARL of the Stellenbosch Town DMA was calculated as 350 ML.
All solutions highlighted the potential of reducing the leakage up to 3.65% (Solution 2) and of recovering energy up to 812 kWh/day (Solution 1). However, the maximum values of both these goals are not achieved by a single solution. In particular Solution 1 allows for significantly more energy recovery than the other solutions (812 kWh/day vs. 649–692 kWh/day) at the cost of the minimum reduction in leakage (2.47%). Looking at the locations in
Figure 7, all solutions had proposed installations on the main supply line from the Jonkershoek Weir. In particular, Solution 1 has two locations in common with Solution 2 (Sites 1 and 2 vs. Sites 2 and 3), and hence it is the third site that makes the difference between the achievement of the maximum energy recovery (Solution 1) and the maximum leakage reduction (Solution 2). Site 3 of Solution 1 is located in the centre of the considered DMA with the operating conditions allowing for more energy recovery than all the other sites, however, the corresponding pressure drop deriving from the ERD installation negatively affects the pressure distribution in the other zones of the DMA. In contrast, the third site of the Solution 2 (Site 1) is located on the periphery of the DMA (blue cross on the left of
Figure 7) with less energy recovered but also less impact on the average pressure of the system.
To identify the best solution among the top five, the water balance in the district was also analysed since it affects the pumping power needs of the district. In this case, Solution 3 has a water balance more comparable to the base case scenario (121.95 kW vs. 122.19 kW of average pump power) and, hence, is preferable. Despite their higher weighted score in the PERRL 2.0 procedure, Solution 1 and 2 both have considerably higher average kW pump usages than the base case scenario (161.59 and 160.43 kW).
Solution 5 performed well in terms of the average pump energy use and storage volume changes but showed an increased percentage of demand below the minimum residual pressure. Solution 5 was shown to have the lowest operating pressure at consumptive nodes but a higher average system pressure than both Solution 2 and 3, indicative of the lower leakage reduction potential and, therefore, was not selected as the preferred option.
Solutions 3 and 4 compared well to the status quo operations of the DMA with similar results for the consumptive node operating pressure analysis, water balance analysis and pump pressure usage. These solutions also have very similar average operating pressures at consumptive nodes; however, Solution 3 has a lower average system pressure, which results in higher leakage reduction potential and a higher overall weighted score in the PERRL 2.0 procedure. Thus, for the above-mentioned reasons, Solution 3 was chosen as the preferred solution for Scenario 2.
7.2. Scenario 3
The third scenario that was run aimed at showing the effect of “aged” pipes in the Stellenbosch Town DMA on the energy recovery and leakage reduction potential. Hydraulically poor-performing or “aged” pipes with relatively high friction losses over short pipe lengths reduce the available energy in the system for energy recovery in gravity-fed systems. In systems where additional head is added through pumps, these hydraulically poor-performing pipe segments increase the overall pumping energy consumption in the system.
For the first option of Scenario 3, Scenario 3a, only the pipe segments associated with the immediate upstream pipe network of the top proposed energy recovery solutions were considered for pipe replacement with new pipes of similar diameters. The pipe replacement changes the hydraulic characteristics of the network by changing the roughness coefficients of the replaced pipe to fall within the recommended range of factors, as indicated in
Table 3. The change in roughness theoretically increases the head available for energy recovery but also has the potential to increase the average operating pressure within the system, which will in turn increase overall leakage. Pipe sections immediately upstream of the proposed installation were replaced back to a point where the supply line convergences with another line or back to the supply reservoir. This was done to ensure the pipe replacement benefits the proposed energy recovery installation. The proposed pipe replacement details are shown in
Table 7.
Scenario 3a was run with the preferred proposed energy recovery solution of Scenario 2 for both the base case hydraulics and roughness parameters, as well as the amended roughness parameter corresponding to the proposed pipe replacement. The hydraulic performance of the two simulation runs were compared and analysed in terms of flow, head loss and energy recovery potential, as well as the effect on the average operating pressure and leakage reduction within the system. This was done in order to indicate the effect of the pipe replacement on the energy recovery and leakage reduction potential in the system.
As expected, the pipe replacement in Scenario 3a increased the energy recovery potential in all three identified sites by decreasing the roughness of the pipes upstream of the potential locations. At all points, this increased the flow through the section of pipe due to the lower friction losses. The lower friction losses also account for higher available pressure head above the minimum residual pressure. For Sites 2 and 3, the increases were slight, which can be attributed to the short section of pipes being theoretically replaced upstream of the installation sites.
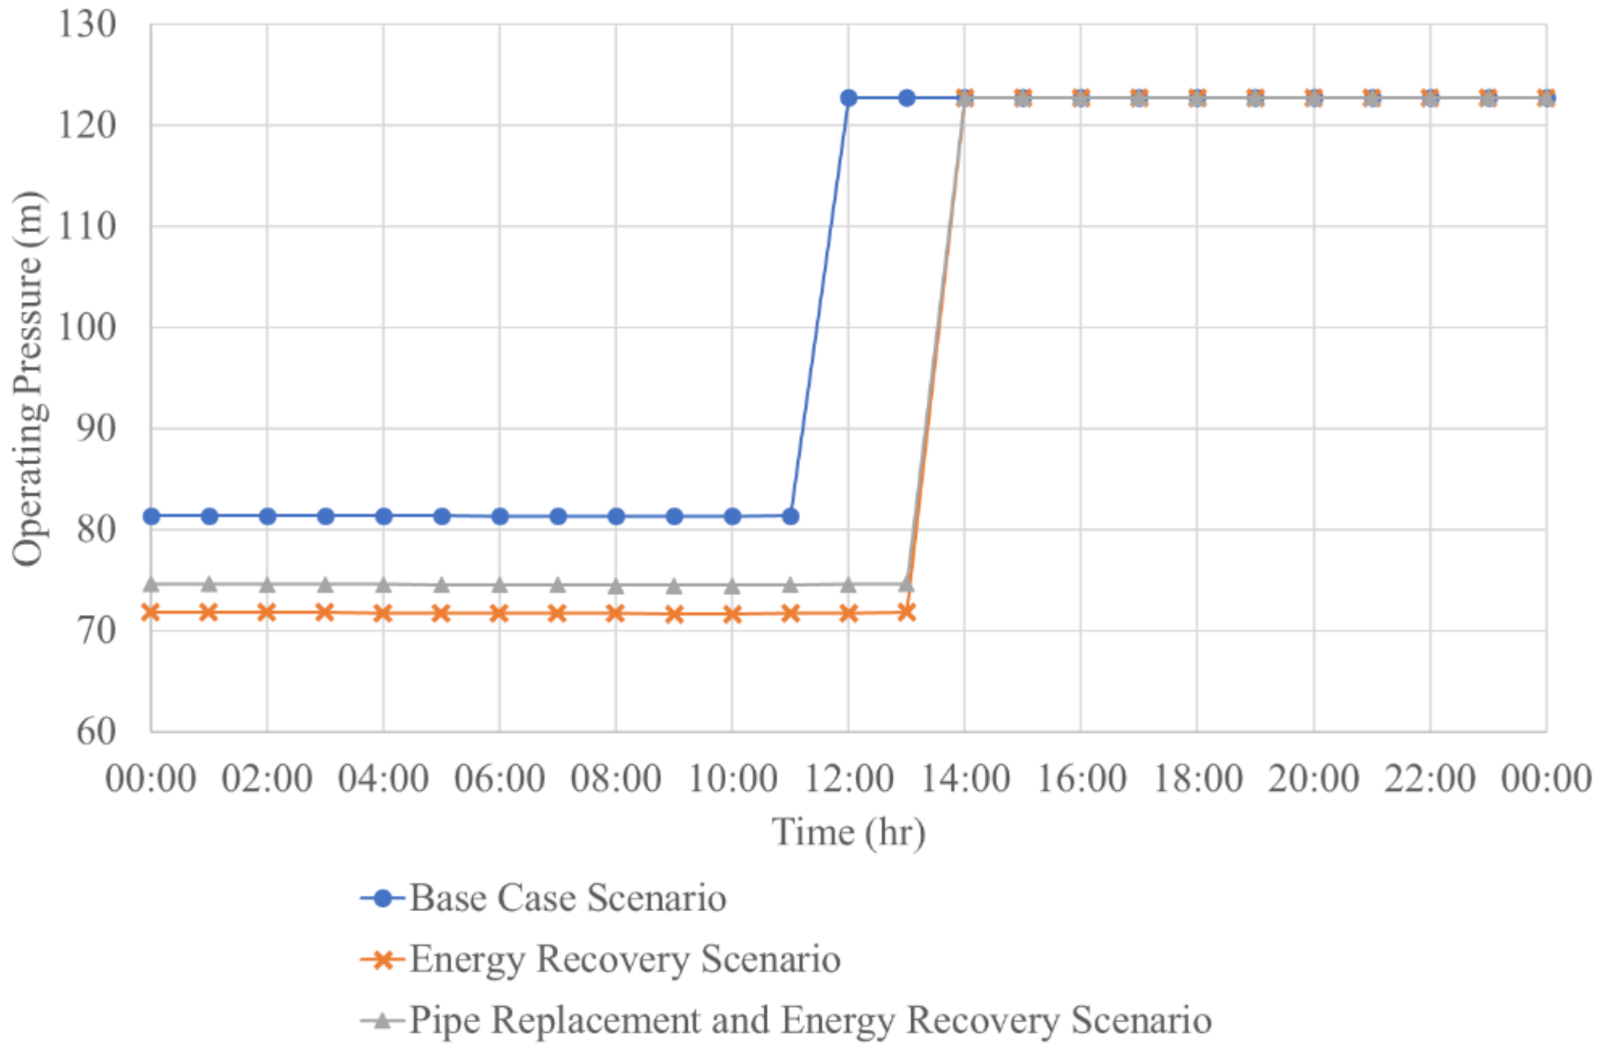
For Link 3 582, over 6 km of pipe was modelled to be theoretically replaced. This increased the daily potential energy recovery at the site by 28%. This does, however, also increase the average operating pressure head downstream of Link 3 582.
Figure 10 shows the operating pressure at Node 3 055, immediately downstream of Link 3 582, before the implementation of energy recovery, with energy recovery and with energy recovery following pipe replacement. From
Figure 10 it can be noted that the pipe replacement scenario increases the daily operating pressures.
Table 8 indicates an increase in the overall system pressure, but due to the dynamic nature of the network, it still reports a slight decrease in average operating pressure at consumptive nodes. With the operating pressure at Node 3 055, with pipe replacement being higher than the pressure with energy recovery alone, there still exists excess pressure available for energy recovery. Utilizing this excess energy will undoubtably further reduce the average operating pressure at consumptive nodes, resulting in a lesser weighted score through the PERRL 2.0 procedure. The overall increase in system pressure also explains the decrease in Total Leakage Reduction Potential between the scenario with base case roughness and the scenario with pipe replacement roughness implemented, notwithstanding the increase in Total Energy Recovery Potential
The Scenario 3b analysis replaced the “aged” pipes as discussed previously and calculated a new CARL based on the modelled system, with the assumption that the base CARL was equally distributed in size and frequency along the length of the pipe network. Replaced pipes were modelled not to have any leakage and thus effectively reduces leakage prior to the installation of energy recovery devices.
Following the pipe replacement, the PERRL 2.0 procedure was applied to identify and optimise potential energy recovery installations. The leakage reduction calculation in the PERRL 2.0 procedure now incorporated the effective reduced CARL calculated in the previous step. The PERRL 2.0 procedure was applied to the amended networks and new proposed energy recovery solutions were identified.
As expected, the average operating pressure for the 10%, 25%, and 50% pipe replacement scenarios, without energy recovery implemented, increased from 52.47 m to 53.02 m, 53.30 m and 53.35 m, respectively. Nevertheless, the replacement of the “aged” pipes allows for the reduction of leakages with respect to the base case scenario from 3.8% up to 21.6% and also with respect to the solutions of the Scenario 2 (only energy recovery). This leakage reduction is further increased when the energy recovery is considered in the simulations and reaches a maximum of 23.5%.
As regards the energy recovery, it is interesting to notice that the amount of energy recovery increases starting from the 25% of pipe replacement. In case of 10%, the contribution of the pipe replacement is not significant. A possible reason of this negligible contribution could be the locations of the replaced pipes in comparison with the locations of the energy recovery devices: The replaced pipes are not sufficient for positively affecting all the potential ERD installations.
The objective of the study was to test the application of the PERRL 2.0 procedure and assess the advantage thereof in terms of the operation of the Stellenbosch Water Distribution Network by evaluating the energy recovery and leakage reduction potential within the network and the subsequent effects that the installation of energy recovery devices has on the operation of the network. Through the application of the PERRL 2.0 procedure the “status quo” of the Stellenbosch Town DMA was analysed and compared with several scenarios with varied degrees of pipe replacement. The PERRL procedure identified several potential locations for energy recovery within the current Stellenbosch Town DMA (status quo) based on a weighted score of energy recovered, leakage reduction, and estimated capital installation cost. Conclusions and recommendations based on the analysed scenarios are discussed in the following section.
8. Conclusions and Recommendations
The PERRL 2.0 procedure, similar to recent research compared in
Table 1, optimizes the installation of energy recovery devices within a water distribution system. The procedure differs from current applied methods in that it incorporates the effect and benefits of leakage reduction within the optimisation process, as illustrated by the current study.
The post-processing of the discussed results were compared the top proposed solutions/installations based on several factors from consumptive node pressures, overall water balance and correlation to the status quo, average pump energy usage, as well as network storage changes.
The following overall conclusions were made from the initial analysis:
The hydraulic operations of the energy recovery solutions need to mimic the status quo operations as closely as possible, barring the increased pressure reduction at proposed installations. Varying too far from the current operations will not result in sustainable energy recovery installations without a change in system operations;
The addition of a water balance analysis to the energy recovery and leakage reduction analysis is valuable in identifying sustainable solutions;
All proposed installations had considerably high average system operating pressures post energy recovery, which indicated additional potential in the network not accessible through current system operation or configuration;
Applying additional DMAs within the Stellenbosch Town and limiting the effect of energy recovery installations on all consumptive nodes could potentially further increase the total energy recovery potential in the system. The existence of several network water storages between sources and end users indicates potential for such network operations and needs to be further investigated.
The third analysed Scenario incorporated pipe replacement, firstly only on pipe segments upstream of proposed energy recovery solution (3a) and secondly at set pipe replacement levels of 10%, 25%, and 50% of all the “aged” pipes identified in the district (3b).
Scenario 3a indicated a higher total energy recovery potential with a lower total leakage reduction potential. This is attributed to the slightly higher overall average system pressure indicated in
Table 8 and the fact that Scenario a did not account for reduced CARL due to pipe replacement.
Scenario 3b was run to show the effect of varying degrees of pipe replacement within the system. Scenario 3b differs from 3a, since it re-applies the PERRL 2.0 procedure to evaluate the energy recovery and leakage reduction potential after pipe replacement considering the dynamic changes to the system operation following the hydraulic changes to the system. The following observations and conclusions were made from the Scenario 3b modelling:
Leakage reduction in the system for Scenario 3b was first calculated as leakage reduction from the pipe replacement only, and the reduced CARL was then used to calculate the additional leakage reduction as a benefit from energy recovery through the PERRL 2.0 process;
The leakage reduction increased as pipe replacement increased for 10% and 25% pipe replacement. For 50% pipe replacement, the modelled leakage reduction reduces. With 50% of the network pipe replaced and in effect not being affected by energy recovery in terms of leakage reduction, this occurrence is validated;
The less pipes are replaced, the higher the average operating pressure in the replaced pipes are (both for the pipe replacement only and energy recovery scenarios). Increasing pipe replacement percentage, however, still increases the average operating pressure in the entire system, which indicates a very localized effect of pipe replacement when conducted on a small scale;
The average operating pressure in the “aged” pipes move closer to the average operating pressure of the entire network as the percentage of pipe replacement increases. This is largely due to the fact that with an increased pipe replacement percentage, the “aged” pipe network length becomes closer to the entire network length. It can also be attributed to the fact that the more pipes are replaced, the closer the network operations become to the base case scenario. This is indicated by the closer correlation of the water balance figures for 50% pipe replacement;
The previous observation is reinforced by
Figure 9, which shows the average distribution of solutions for the 50% pipe replacement scenario similar to the optimum solution for the base case scenario;
In all scenarios, several solutions are contained in the main supply lines from the Jonkershoek Weir. These supply lines carry the largest flow volumes resulting in large energy recovery potential changes with small induced headloss.
In general, the following conclusions were made from the study:
The PERRL 2.0 procedure performed well in conducting a baseline assessment and scenario modelling of the energy recovery and leakage reduction potential within the Stellenbosch Town DMA.
Water distribution and water supply systems are dynamic in nature and require a holistic approach to energy recovery modelling.
Due to the dynamic nature of water supply systems, energy recovery potential installation evaluation should include investigations on the effect of the installation on the overall systems operations to indicate the sustainability of the potential installations. The incorporation of a basic water balance in the evaluation procedure provided valuable insight into the effect of energy recovery on the network operations.
The replacement of aged infrastructure increases the potential for both energy recovery and leakage reduction within a system. Pipe replacement, however, changes the hydraulic operations of the system and could to some extent require revision of the system operating procedures.
9. Disclaimer
The output of the research conducted in this article was generated from developed hydraulic models of the Stellenbosch Town Water Supply Infrastructure. These models incorporate assumptions informed by demand modelling and have not been calibrated to any specific time, date, or scenario of measured data from the Stellenbosch Water Supply Networks. This research does not reflect or constitute the views of the Stellenbosch LM or any individuals affiliated with the Stellenbosch LM.
Author Contributions
Conceptualization, G.J.B. and M.v.D.; methodology, G.J.B. and M.v.D.; software, G.J.B. and M.v.D.; validation, G.J.B., M.v.D. and G.C.; formal analysis, G.J.B. investigation, G.J.B.; resources, G.J.B., M.v.D. and G.C.; data curation, G.J.B.; writing—original draft preparation, G.J.B.; writing—review and editing, G.J.B., M.v.D. and G.C.; visualization, G.J.B., M.v.D. and G.C.; supervision, M.v.D. and G.C. All authors have read and agreed to the published version of the manuscript.
Funding
This research received no external funding.
Institutional Review Board Statement
Not applicable.
Informed Consent Statement
Not applicable.
Data Availability Statement
Restrictions apply to the availability of these data. Data was obtained from the Stellenbosch Local Municipality and are available from the authors with the permission of the Stellenbosch Local Municipality.
Acknowledgments
The authors would like to acknowledge the Stellenbosch Local Municipality for their assistance and willingness to cooperate and share their knowledge as it pertains to the research conducted in this study.
Conflicts of Interest
The authors declare no conflict of interest.
References
- Gono, M.; Kyncl, M.; Gono, R. Hydropower Stations in Czech Water Supply System. AASRI Procedia 2012, 2, 81–86. [Google Scholar] [CrossRef]
- Güttinger, M. Water Resource Management Programme (WARM-P)—Drinking Water and Hydropower: Feasibility Study for Inline Hydropower in Rural NEPAL; Helvetas Swiss Intercooperation: Surkhet, Nepal, 2012. [Google Scholar]
- Perez-Sanchez, M.; Sanchez-Romero, F.J.; Ramos, H.M. Energy recovery in existing water networks: Towards greater sustainability. Water 2017, 9, 97. [Google Scholar] [CrossRef] [Green Version]
- Van Dijk, M.; Kgwale, M.; Bhagwan, J.; Loots, I. Bloemwater conduit hydropower plant launched. Civ. Eng. Siv. Ing. 2015, 23, 42–46. [Google Scholar]
- Loots, I.; Van Dijk, M.; Van Vuuren, S.J.; Bhagwan, J.N.; Kurtz, A. Conduit-hydropower potential in the City of Tshwane water distribution system: A discussion of potential applications, financial and other benefits. J. S. Afr. Inst. Civ. Eng. 2014, 56, 2–13. [Google Scholar]
- Van Dijk, M.; Scharfetter, B.; Bonthuys, G.; Bhagwan, J. Growing hydropower opportunities. Civ. Eng. Sivil. Ing. 2017, 25, 18–21. [Google Scholar]
- Van Dijk, M.; Cavazzini, G.; Bonthuys, G.J.; Santolin, A.; Van Delft, J. Integration of water supply, conduit hydropower generation and electricity demand. Proceedings 2018, 2, 689. [Google Scholar] [CrossRef] [Green Version]
- Ramos, H.M.; Mello, M.; De, P.K. Clean power in water supply systems as a sustainable solution: From planning to practical implementation. Water Sci. Technol. Water Supply 2010, 10, 39–49. [Google Scholar] [CrossRef]
- Gupta, A.; Bokde, N.; Marathe, D.; Kulat, K. Leakage Reduction in Water Distribution Systems with Efficient Placement and Control of Pressure Reducing Valves Using Soft Computing Techniques. Eng. Technol. Appl. Sci. Res. 2017, 7, 1528–1534. [Google Scholar] [CrossRef]
- Nicolini, M.; Zovatto, L. Optimal location and control of pressure reducing valves in water networks. J. Water Resour. Plann. Manag. 2009, 135, 178–187. [Google Scholar] [CrossRef]
- Fecarotta, O.; Aricò, C.; Carravetta, A.; Martino, R.; Ramos, H.M. Hydropower potential in water distribution networks: Pressure control by PATs. Water Resour. Manag. 2015, 29, 699–714. [Google Scholar] [CrossRef]
- Butera, I.; Balestra, R. Estimation of the hydropower potential of irrigation networks. Renew. Sustain. Energy Rev. 2015, 48, 140–151. [Google Scholar] [CrossRef]
- Colombo, A.; Kleiner, Y. Energy recovery in water distribution systems using microturbines. In Proceedings of the Probabilistic Methodologies in Water and Wastewater Engineering 2011, Toronto, ON, Canada, 23 September 2011; pp. 23–27. [Google Scholar]
- Tricarico, C.; Morley, M.S.; Gargano, R.; Kapelan, Z.; de Marinis, G.; Savi´c, D.; Granata, F. Optimal water supply system management by leakage reduction and energy recovery. Procedia Eng. 2014, 89, 573–580. [Google Scholar] [CrossRef] [Green Version]
- Parra, S.; Krause, S. Pressure Management by Combining Pressure Reducing Valves and Pumps as Turbines for Water Loss Reduction and Energy Recovery. Int. J. Sustain. Dev. Plan. 2017, 12, 89–97. [Google Scholar] [CrossRef]
- Creaco, E.; Haidar, H. Multiobjective Optimization of Control Valve Installation and DMA Creation for Reducing Leakage in Water Distribution Networks. J. Water Resour. Plan. Manag. 2019, 145, 04019046. [Google Scholar] [CrossRef]
- Bonthuys, G.J.; Van Dijk, M.; Cavazzini, G. Energy Recovery and Leakage-Reduction Optimization of Water Distribution Systems Using Hydro Turbines. J. Water Resour. Plan. Manag. 2020, 146, 04020026. [Google Scholar] [CrossRef]
- Bonthuys, G.J.; Van Dijk, M.; Cavazzini, G. The Optimization of Energy Recovery Device Sizes and Locations in Municipal Water Distribution Systems during Extended-Period Simulation. Water 2020, 12, 2447. [Google Scholar] [CrossRef]
- Pérez-Sánchez, M.; Sánchez-Romero, F.; Ramos, H.; López-Jiménez, P. Modelling Irrigation Networks for the Quantification of Potential Energy Recovering: A Case Study. Water 2016, 8, 234. [Google Scholar] [CrossRef] [Green Version]
- Samora, I.; Franca, M.; Schleiss, A.; Ramos, H.M. Simulated Annealing in Optimization of Energy Production in a Water Supply Network. Water Resour. Manag. 2016, 30, 1533–1547. [Google Scholar] [CrossRef]
- Samora, I.; Manso, P.; Franca, M.J.; Schleiss, A.J.; Ramos, H.M. Energy Recovery Using Micro-Hydropower Technology in Water Supply Systems: The Case Study of the City of Fribourg. Water 2016, 8, 344. [Google Scholar] [CrossRef] [Green Version]
- Sari, M.A.; Badruzzaman, M.; Cherchi, C.; Swindle, M.; Ajami, N.; Jacangelo, J.G. Recent Innovations and Trends in In-conduit Hydropower Technologies and Their Applications in Water Distribution Systems. J. Environ. Manag. 2018, 228, 416–428. [Google Scholar] [CrossRef]
- Bekker, A.; Van Dijk, M.; Niebuhr, C.M.; Hansen, C.D. Framework Development for the Evaluation of Conduit Hydropower within Water Distribution Systems: A South African Case Study. J. Clean. Prod. 2020, 283, 125326. [Google Scholar] [CrossRef]
- Itani, Y.; Soliman, M.R.; Kahil, M. Recovering energy by hydro-turbines application in water transmission pipelines: A case study west of Saudi Arabia. Energy 2020, 211, 118613. [Google Scholar] [CrossRef]
- Cubides-Castro, E.D.; López-Aburto, C.S.; Iglesias-Rey, P.L.; Martínez-Solano, F.J.; Mora-Meliá, D.; Iglesias-Castelló, M. Methodology for Determining the Maximum Potentially Recoverable Energy in Water Distribution Networks. Water 2021, 13, 464. [Google Scholar] [CrossRef]
- Rodríguez-Pérez, A.M.; Pérez-Calañas, C.; Pulido-Calvo, I. Energy Recovery in Pressurized Hydraulic Networks. Water Resour. Manag. 2021, 35, 1977–1990. [Google Scholar] [CrossRef]
- South African Government. Energy Challenge. Available online: https://www.gov.za/issues/energy-challenge/ (accessed on 22 April 2021).
- Pascale, S.; Kapnick, S.B.; DElworth, T.L.; Cooke, W.F. Increasing risk of another Cape Town “Day Zero” drought in the 21st century. Proc. Natl. Acad. Sci. USA 2020, 117, 29495–29503. [Google Scholar] [CrossRef]
- Muller, M. Cape Town’s drought: Don’t blame climate change. Nature 2018, 559, 174–176. [Google Scholar] [CrossRef] [Green Version]
- Bischoff-Mattson, Z.; Maree, G.; Vogel, C.; Lynch, A.; Olivier, D.; Terblanche, D. Shape of a water crisis: Practitioner perspectives on urban water scarcity and ‘Day Zero’ in South Africa. Water Policy 2020, 22, 193–210. [Google Scholar] [CrossRef]
- Sunday Times. Available online: https://www.timeslive.co.za/news/south-africa/2018-02-19-stellenbosch-imposes-stricter-water-restrictions/ (accessed on 22 July 2021).
- Stellenbosch Local Municipality. Fourth Review of the Fourth Generation Integrated Development Plan for 2017–2022; Stellenbosch LM: Stellenbosch, South Africa, 2021. [Google Scholar]
- Hatch. Stellenbosch Municipality Drought Response Plan. 2017. Available online: https://fsmountain.org/f369/water/DroughtResponsePlan9June2017.pdf (accessed on 22 April 2021).
- Bonthuys, G.J.; Van Dijk, M.; Cavazzini, G. Leveraging Water Infrastructure Asset Management for Energy Recovery and Leakage Reduction. Sustain. Cities Soc. 2019, 46, 101434. [Google Scholar] [CrossRef]
- IMQS. Available online: https://www.imqs.co.za/ (accessed on 22 April 2021).
- Du Plessis, P.C.; (GLS, Stellenbosch, Western Cape, South Africa). Personal communication, 2021.
- Rossman, L.A. EPANET 2, User Manual; United States Environmental Protection Agency: Cincinnati, OH, USA, 2001.
- Connell, D. Hazen-Williams C-Factor Assessment in an Operational Irrigation Pipeline. Master’s Thesis, McGill University, Montreal, Quebec, Canada, 2001. [Google Scholar]
- Rahman, N.A.; Muhammad, N.S.; Abdullah, J.; Mohtar, W.H.M.W. Model Performance Indicator of Aging Pipes in a Domestic Water Supply Distribution Network. Water 2019, 11, 2378. [Google Scholar] [CrossRef] [Green Version]
- Malaysian Water Association. MWA Design Guidelines for Water Supply Systems; The Malaysian Water Association: Kuala Lumpur, Malaysia, 1994. [Google Scholar]
- CSIR. Guidelines for Human Settlement Panning and Design; Capture Press: Pretoria, South Africa, 2005; Volume 2. [Google Scholar]
Figure 1.
Study methodology schematic summary.
Figure 1.
Study methodology schematic summary.
Figure 2.
Stellenbosch Town DMA and water distribution network configuration.
Figure 2.
Stellenbosch Town DMA and water distribution network configuration.
Figure 3.
Stellenbosch Town DMA—adapted demand pattern.
Figure 3.
Stellenbosch Town DMA—adapted demand pattern.
Figure 4.
Average operating pressure and consumed flow—Stellenbosch Town DMA—base scenario.
Figure 4.
Average operating pressure and consumed flow—Stellenbosch Town DMA—base scenario.
Figure 5.
Consumptive node operating pressure cumulative distribution.
Figure 5.
Consumptive node operating pressure cumulative distribution.
Figure 6.
Consumptive node operating pressure spatial distribution.
Figure 6.
Consumptive node operating pressure spatial distribution.
Figure 7.
Scenario 2—Top proposed energy recovery locations.
Figure 7.
Scenario 2—Top proposed energy recovery locations.
Figure 8.
Scenario 3b—Energy recovery and leakage reduction potential—top 20 solutions of each pipe replacement scenario.
Figure 8.
Scenario 3b—Energy recovery and leakage reduction potential—top 20 solutions of each pipe replacement scenario.
Figure 9.
Scenario 3b—Top proposed energy recovery locations.
Figure 9.
Scenario 3b—Top proposed energy recovery locations.
Figure 10.
Node 3 055 daily operating pressure—scenario analysis.
Figure 10.
Node 3 055 daily operating pressure—scenario analysis.
Table 1.
Recent research studies related to energy recovery and leakage reduction from water supply and distribution networks.
Table 1.
Recent research studies related to energy recovery and leakage reduction from water supply and distribution networks.
| Study | Ref. | Abridged Methodology | Conclusions |
|---|
| Energy Recovery | Pressure Management/Leakage Reduction |
|---|
| Modelling Irrigation Networks for the Quantification of Potential Energy Recovering | [19] | | Discriminate the energy needed for irrigation, friction head losses, non-recoverable energy, and potentially recoverable energy in any line in a network based on flows
| |
| Simulated Annealing in Optimization of Energy Production in a Water Supply Network | [20] | Proposed optimization algorithm to provide a selection of optimal locations for the installation of turbines in a distribution network. A simulated annealing process was developed to optimize the location of the turbines
| Rapid convergence for the cases of installing up to three turbines Best solutions were not the combinations of the branches with highest energetic potential, indicating the need for a detailed analysis in terms of daily variation in flow and turbine efficiency.
| |
| Energy Recovery Using Micro-Hydropower Technology in Water Supply Systems | [21] | | The optimization maximizes the economic value of the installation Sensitivity analysis of the demand proposed to be considered to verify the impact of energy recovery and in the behaviour of the network.
| |
| Pressure Management by Combining Pressure Reducing Valves and Pumps as Turbines for Water Loss Reduction and Energy Recovery | [15] | | | |
| Recent Innovations and Trends in In-conduit Hydropower Technologies and Their Applications in Water Distribution Systems | [22] | | | |
| Framework Development for the Evaluation of Conduit Hydropower within Water Distribution Systems | [23] | | | |
| Recovering energy by hydro-turbines application in water transmission pipelines | [24] | Quantification of the embedded power within a WDS from hydraulic analysis of the network simulated in WaterCAD Identification of energy recovery potential hotspots Redesign of network links (maximum velocity) to allow conveying of required design flow rate Selection of the best fitting hydro-turbine type Financial and environmental evaluation of the simulated scenarios with respect to the original design
| Redesign of network links in terms of maximum allowable velocity increased the residual pressure and consequently the potential energy recovery value. From an economic perspective, installing traditional turbines in water transmission systems concluded to be feasible for energy recovery
| |
| Methodology for Determining the Maximum Potentially Recoverable Energy in Water Distribution Networks | [25] | Determination of the potentially recoverable energy (PRE) A new energy balance is proposed Network resilience index (Recoverable Energy Index (PREI)) is proposed
| | |
| Energy Recovery in Pressurized Hydraulic Networks | [26] | | Recommended that energy recovery devices be installed in a parallel position with the valve that regulates the distribution of the water flow to each of the intakes of the urban areas or DMAs Payback period alone does not support the decision to promote energy recovery; socio-environmental analyses proposed in addition to current studies.
| |
Table 2.
Stellenbosch LM 2019/20 IWA water balance (kL) [
32].
Table 2.
Stellenbosch LM 2019/20 IWA water balance (kL) [
32].
Authorized consumption
88.5% | Revenue Water
79.5% | Billed metered | 4,360,974 | 54.4% |
| Billed metered (indigent) | 1,625,305 | 20.3% |
| Billed unmetered | 388,195 | 4.8% |
Non-revenue Water
20.5% | Unbilled metered | 240,451 | 3.0% |
| Unbilled unmetered | 16,030 | 0.2% |
| Informal areas not metered | 462,601 | 5.8% |
Unaccounted for Water (UAW)
11.5% | Losses in bulk supply system | 0 | 0.0% |
| Apparent losses | 400,751 | 5.0% |
| Real network losses | 520,720 | 6.5% |
Table 3.
Modelled roughness coefficients per pipe length.
Table 3.
Modelled roughness coefficients per pipe length.
Pipe
Material | Modelled Length (km) | % of Modelled Pipe Length per
Hazen Williams C-Factor | Recommended Range [38,39] |
|---|
| 90 | 100 | 110 | 115 | 120 | 130 | 150 | New | 25 Years | 50 Years |
|---|
Asbestos
Cement (AC) | 192 | 24 | 31 | 9 | 28 | 7 | 1 | 0 | 150 | 130 | 120 |
| Cast Iron (CI) | 0.2 | 0 | 100 | 0 | 0 | 0 | 0 | 0 | 130 | 110 | 90 |
| HDPE | 16 | 5 | 26 | 11 | 56 | 2 | 0 | 1 | 150 | 140 | 140 |
| uPVC | 108 | 2 | 34 | 11 | 46 | 1 | 6 | 0 | 150 | 140 | 140 |
| Steel 1 | 0.2 | 0 | 100 | 0 | 0 | 0 | 0 | 0 | 150 | 130 | 100 |
| Unknown | 49 | 10 | 42 | 2 | 44 | 3 | 0 | 0 | | | |
Table 4.
Ten worst performing pipe segments at peak flow—Base Scenario.
Table 4.
Ten worst performing pipe segments at peak flow—Base Scenario.
| Pipe ID | Length (m) | Diameter (mm) | Material | C-Value | Unit Headloss (m/km) | Head Loss (m) |
|---|
| 3516 | 5.23 | 200.00 | n/a | 115 | 508.50 | 2.66 |
| 4155 | 7.67 | 37.00 | uPVC | 100 | 433.96 | 3.33 |
| 4335 | 18.55 | 37.00 | uPVC | 100 | 433.96 | 8.05 |
| 3526 | 25.55 | 200.00 | n/a | 115 | 508.50 | 12.99 |
| 3819 | 34.60 | 19.00 | Steel | 100 | 783.38 | 27.11 |
| 4240 | 11.30 | 37.00 | uPVC | 100 | 122.63 | 1.39 |
| 4339 | 18.06 | 37.00 | uPVC | 100 | 122.63 | 2.22 |
| 4033 | 21.2 | 54.00 | uPVC | 100 | 112.80 | 2.39 |
| 3735 | 47.68 | 19.00 | uPVC | 100 | 808.03 | 38.53 |
| 3258 | 12.18 | 125.00 | n/a | 100 | 97.82 | 1.19 |
Table 5.
Base scenario—performance metrics.
Table 5.
Base scenario—performance metrics.
| Average operating pressure | 52.47 m |
| Modelled % consumptive nodes below minimum residual pressure | 2.8% |
| Modelled % demand below minimum residual pressure | 3.7% |
| Pumps | kWh/m3 (avg) | 0.3 |
| Average kW | 121.95 |
| Water Balance | Demand | 24.3 ML |
| Supply | 25.3 ML |
| Network Start Storage | 90.9 ML |
| Network End Storage | 92.3 ML |
| Change in storage | 1.4 ML (1.6%) |
| % Imbalance | 1.9% |
Table 6.
Scenario 2—Solution comparison. The three individual energy recovery locations (sites) are indicated in terms of the numerical sequence assigned to the pipes at which the installations are proposed.
Table 6.
Scenario 2—Solution comparison. The three individual energy recovery locations (sites) are indicated in terms of the numerical sequence assigned to the pipes at which the installations are proposed.
| | Base | Solution 1 | Solution 2 | Solution 3 | Solution 4 | Solution 5 |
|---|
Average operating pressure at
consumptive nodes (m) | 52.47 | 52.49 | 52.10 | 51.94 | 52.02 | 51.86 |
| Average system pressure | 53.53 | 52.64 | 52.29 | 52.50 | 52.58 | 52.53 |
| Modelled % consumptive nodes below minimum residual pressure | 2.8% | 2.8% | 2.8% | 2.8% | 2.8% | 3.0% |
Modelled % demand below minimum
residual pressure | 3.7% | 3.7% | 3.8% | 3.8% | 3.8% | 4.0% |
| Pumps | kWh/m3 (avg.) | 0.30 | 0.30 | 0.30 | 0.29 | 0.29 | 0.30 |
| Average kW | 121.95 | 161.59 | 160.43 | 122.19 | 122.15 | 122.25 |
Water
Balance | Demand (ML) | 24.3 | 24.3 | 24.3 | 24.3 | 24.3 | 24.3 |
| Supply (ML) | 25.3 | 30.7 | 30.9 | 26.3 | 26.3 | 26.3 |
| Network Start Storage (ML) | 90.9 | 90.9 | 90.9 | 90.9 | 90.9 | 90.9 |
| Network End Storage (ML) | 92.3 | 97.0 | 97.0 | 93.2 | 93.1 | 93.3 |
| Change in storage | 1.4 ML (1.6%) | 6.2 ML
(6.8%) | 6.1 ML
(6.7%) | 2.3 ML (2.6%) | 2.2 ML (2.5%) | 2.4 ML (2.7%) |
| % Imbalance | 1.9% | 0.8% | 1.5% | 1.5% | 1.2% | 1.6% |
Energy
Recovery | kWh/day | | 812 | 692 | 665 | 667 | 649 |
| Leakage Reduction | % | | 2.47% | 3.65% | 2.98% | 2.82% | 2.95% |
| Site1 | Link | | 3 060 | 500 | 3 582 | 2 717 | 4 445 |
| Site2 | Link | | 3 673 | 3 668 | 2 044 | 1 750 | 1 242 |
| Site3 | Link | | 4 126 | 3 064 | 689 | 3 673 | 3 673 |
Table 7.
Pipe replacement details.
Table 7.
Pipe replacement details.
| Energy Recovery Location (Model Link No.) | 3582 | 2044 | 689 |
| Pipe Replacement | Start Node | 3138 | 3945 | 416 |
| End Node | 3055 | 1749 | 579 |
| Pipe Diameter (mm) | 400 | 450 | 450 |
| Pipe Length (m) | 61 | 838 | 485 |
| Start Node | 3933 | | |
| End Node | 3138 | | |
| Pipe Diameter (mm) | 450 | | |
| Pipe Length (m) | 6380 | | |
| Total Pipe Replacement Length (m) | 6441 | 838 | 485 |
Table 8.
Top proposed energy recovery installation—Hydraulic effect of pipe replacement.
Table 8.
Top proposed energy recovery installation—Hydraulic effect of pipe replacement.
| Roughness | Base Case | Pipe
Replacement |
|---|
| Energy Recovery Location Induced Headloss | Scenario 2
Results | Scenario 2
Results |
Average operating pressure at consumptive
nodes (m) | 51.94 | 51.89 |
| Average system pressure (m) | 52.50 | 52.58 |
Modelled % consumptive nodes below minimum
residual pressure | 2.8% | 2.8% |
Modelled % demand below minimum residual
pressure | 3.8% | 3.8% |
| Pumps | kWh/m3 (avg.) | 0.29 | 0.30 |
| Average kW | 122.1 | 122.3 |
| Water Balance | Demand (ML) | 24.3 | 24.3 |
| Supply (ML) | 26.3 | 26.4 |
| Network Start Storage (ML) | 90.9 | 90.9 |
| Network End Storage (ML) | 93.2 | 93.2 |
| Change in storage | 2.3 ML
(2.6%) | 2.3 ML
(2.6%) |
| % Imbalance | 1.5% | 1.2% |
| Site 1 | Link | 3582 | 3582 |
| Loss Coefficient | 203.6 | 203.6 |
| Induced Head loss (Peak) (m) | 25.6 | 30.0 |
| Flow (Peak) (LPS) | 196.9 | 214 |
| Energy Recovery Potential (Peak) (kW) | 34.6 | 44.1 |
| Energy Recovery Potential (Daily Avg.) (kWh) | 448 | 573 |
| Site 2 | Link | 2044 | 2044 |
| Loss Coefficient | 833.4 | 833.4 |
| Induced Head loss (Peak) (m) | 19.6 | 19.6 |
| Flow (Peak) (LPS) | 108.2 | 108.5 |
| Energy Recovery Potential (Peak) (kW) | 14.6 | 14.64 |
| Energy Recovery Potential (Daily Avg.) (kWh) | 119 | 120 |
| Site 3 | Link | 689 | 689 |
| Loss Coefficient | 948.1 | 948.1 |
| Induced Head loss (Peak) (m) | 15.2 | 15.2 |
| Flow (Peak) (LPS) | 88.9 | 89.3 |
| Energy Recovery Potential (Peak) (kW) | 9.3 | 9.32 |
| Energy Recovery Potential (Daily Avg.) (kWh) | 98 | 99 |
| Total Energy Recovery Potential (Daily Avg.) (kWh) | 665 | 792 |
| Total Leakage Reduction Potential | 2.98% | 2.73% |
Table 9.
Scenario 3b—Solution comparison with different pipe replacement models.
Table 9.
Scenario 3b—Solution comparison with different pipe replacement models.
| | Base | Solution 1 |
|---|
| Pipe Replacement | Base Case | 10% | 25% | 50% |
|---|
Average
operating pressure | Pipe Replacement Only | 52.47 m | 53.02 m | 53.30 m | 53.35 m |
| Incl. Energy Recovery | 52.53 m | 52.40 m | 52.67 m |
| Average “aged” piped system pressure | Pipe Replacement Only | 53.53 m | 56.45 m | 55.59 m | 53.87 m |
| Incl. Energy Recovery | 56.47 m | 55.62 m | 53.15 m |
| Modelled % consumptive nodes below minimum residual pressure | 2.8% | 3.4% | 4.1% | 2.5% |
| Modelled % demand below minimum residual pressure | 3.7% | 4.3% | 5.0% | 3.4% |
| Pumps | kWh/m3 (avg.) | 0.3 | 0.29 | 0.29 | 0.29 |
| Average kW | 121.95 | 131.98 | 131.66 | 132.34 |
| Water Balance | Demand | 24.3 ML | 24.3 ML | 24.3 ML | 24.3 ML |
| Supply | 25.3 ML | 27.0 ML | 28.3 ML | 22.7 ML |
| Network Start Storage | 90.9 ML | 90.9 ML | 90.9 ML | 90.9 ML |
| Network End Storage | 92.3 ML | 94.0 ML | 93.7 ML | 89.6 ML |
| Change in storage | 1.4 ML (1.6%) | 3.1 ML (3.4%) | 2.8 ML (3.1%) | −1.2 ML (−1.3%) |
| % Imbalance | 1.9% | 1.8% | 3.8% | 2.0% |
| Energy Recovery | kWh/day | | 606 | 713 | 902 |
| Leakage Reduction | Pipe Replacement Only | | 3.8% | 10.1% | 21.6% |
| Incl. Energy Recovery | | 6.2% | 13.4% | 23.5% |
| Site 1 | Link | | 4137 | 1597 | 1597 |
| Site 2 | Link | | 2044 | 4454 | 3675 |
| Site 3 | Link | | 4428 | 4319 | 3677 |
| Publisher’s Note: MDPI stays neutral with regard to jurisdictional claims in published maps and institutional affiliations. |
© 2021 by the authors. Licensee MDPI, Basel, Switzerland. This article is an open access article distributed under the terms and conditions of the Creative Commons Attribution (CC BY) license (https://creativecommons.org/licenses/by/4.0/).


