
Using Thermal Monitoring and Fibre Optic Measurements to Verify Numerical Models, Soil Parameters and to Determine the Impact of the Implemented Investment on Neighbouring Structures


Abstract
:1. Introduction
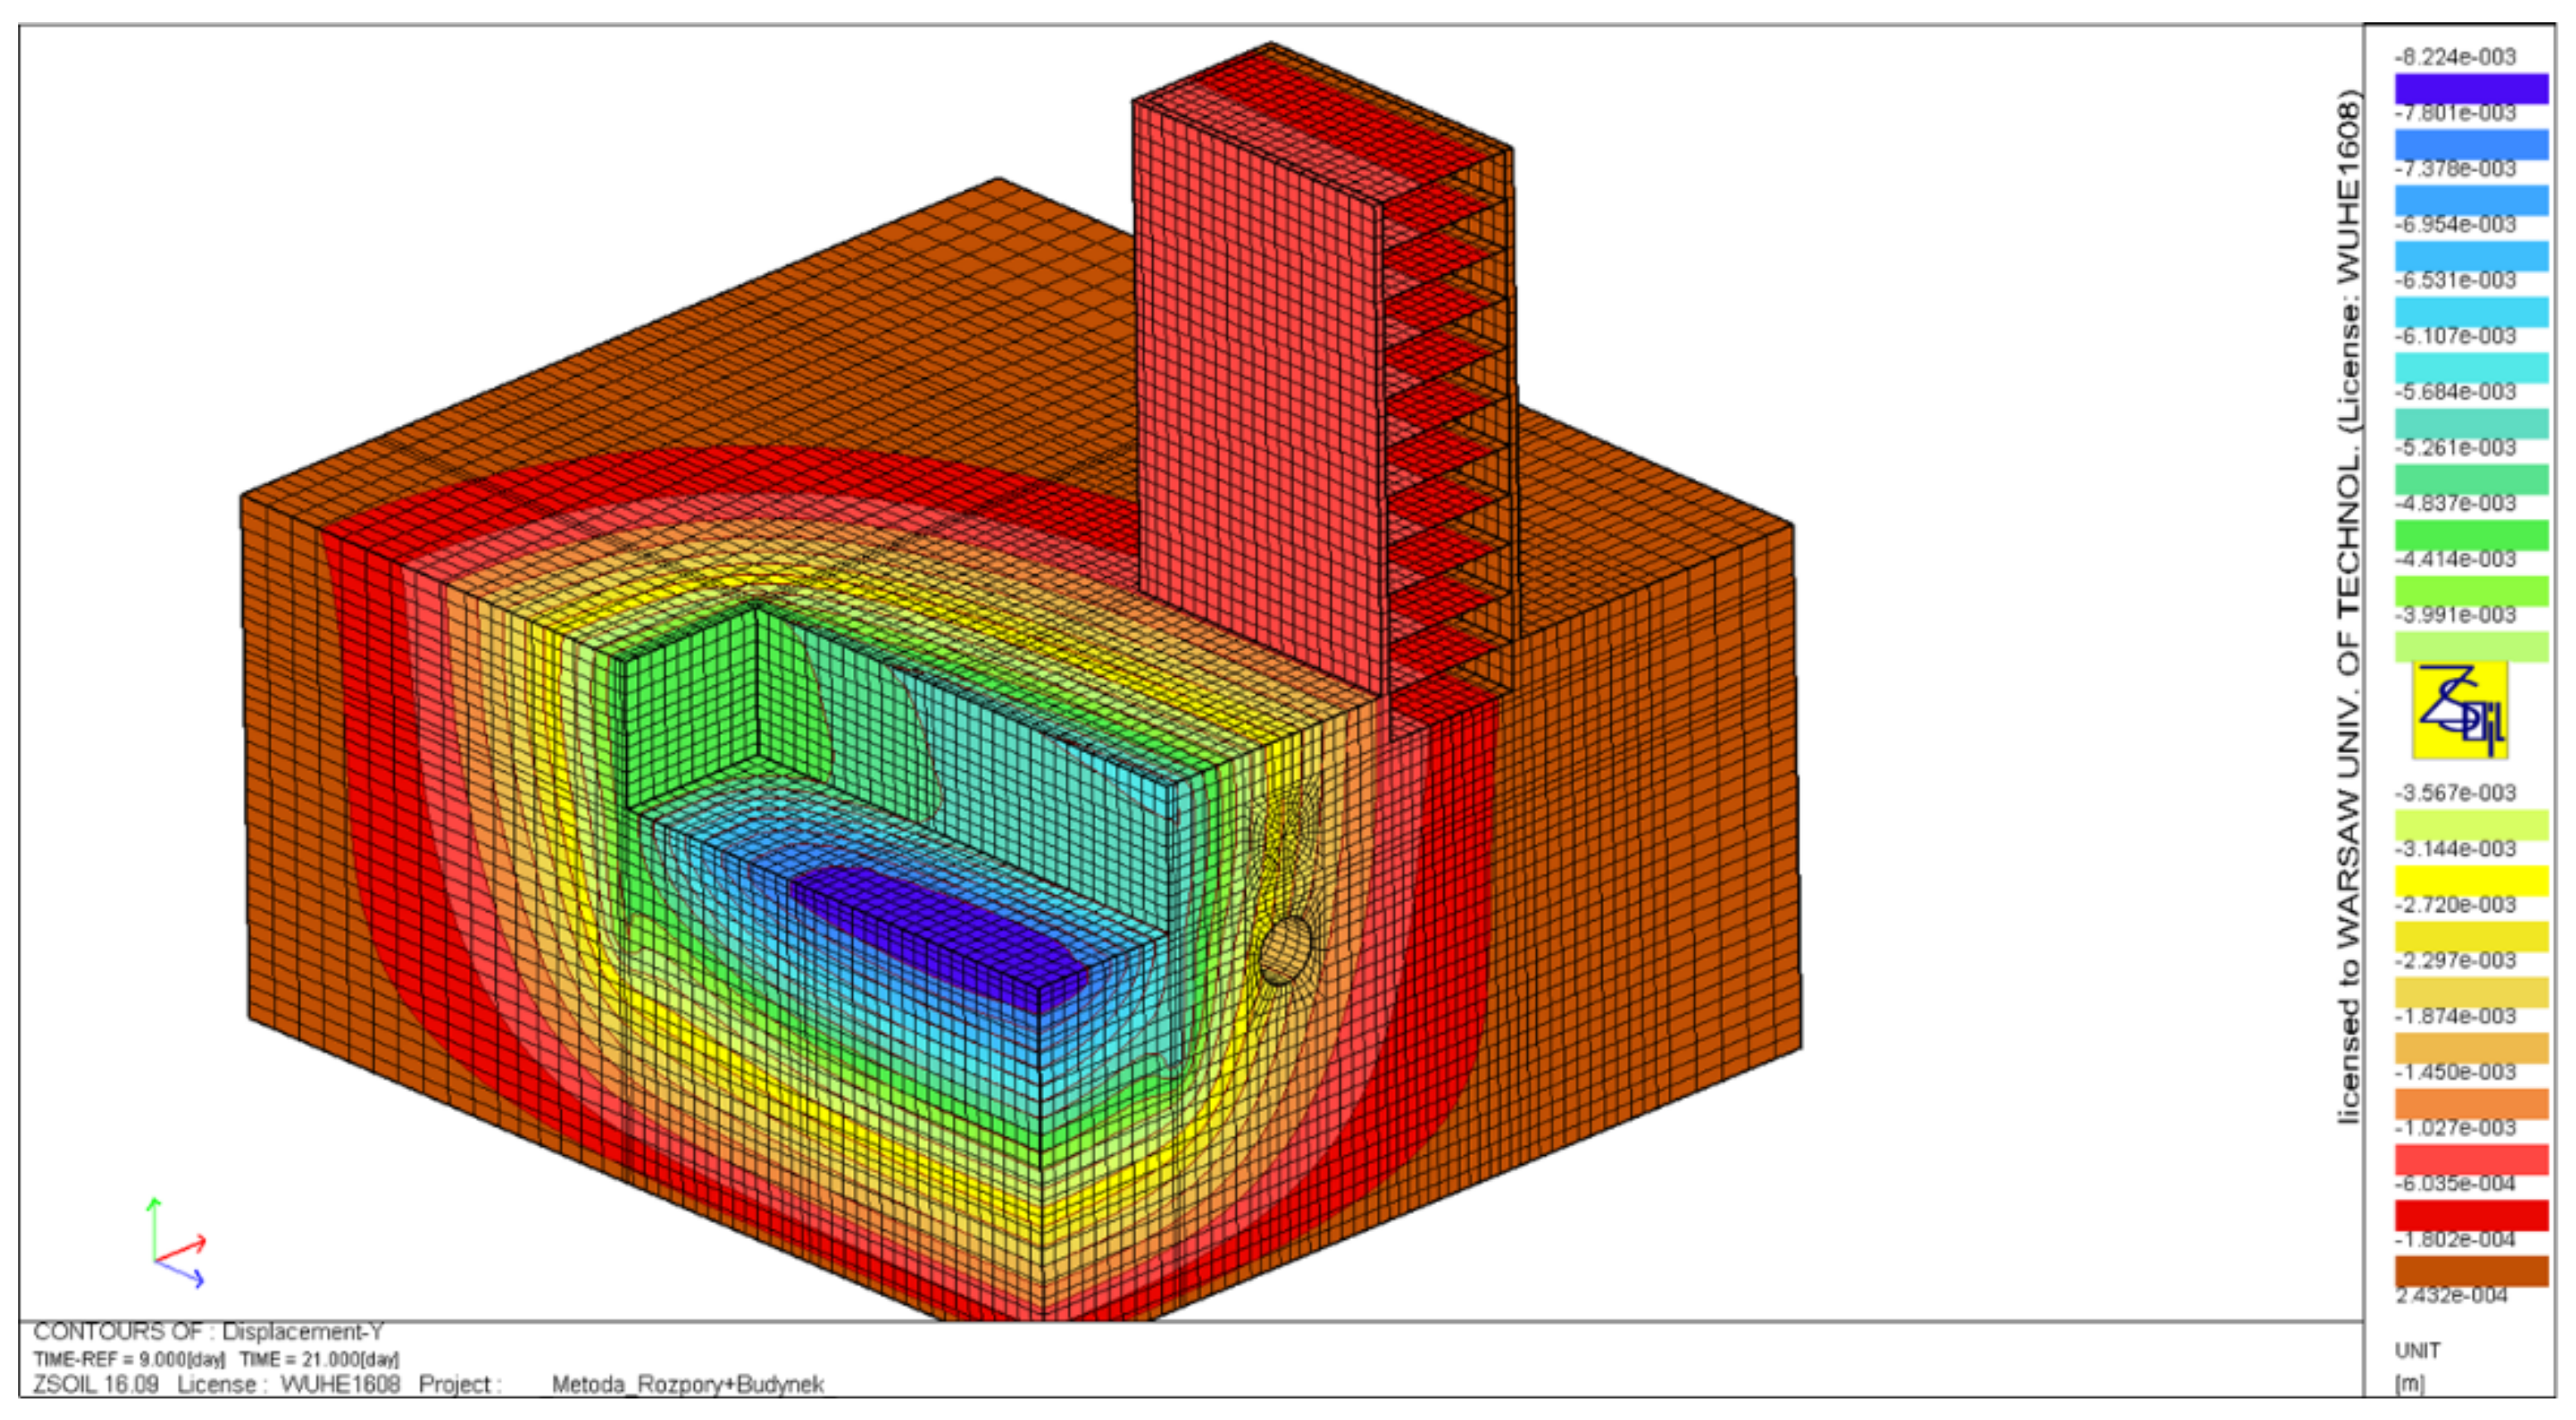
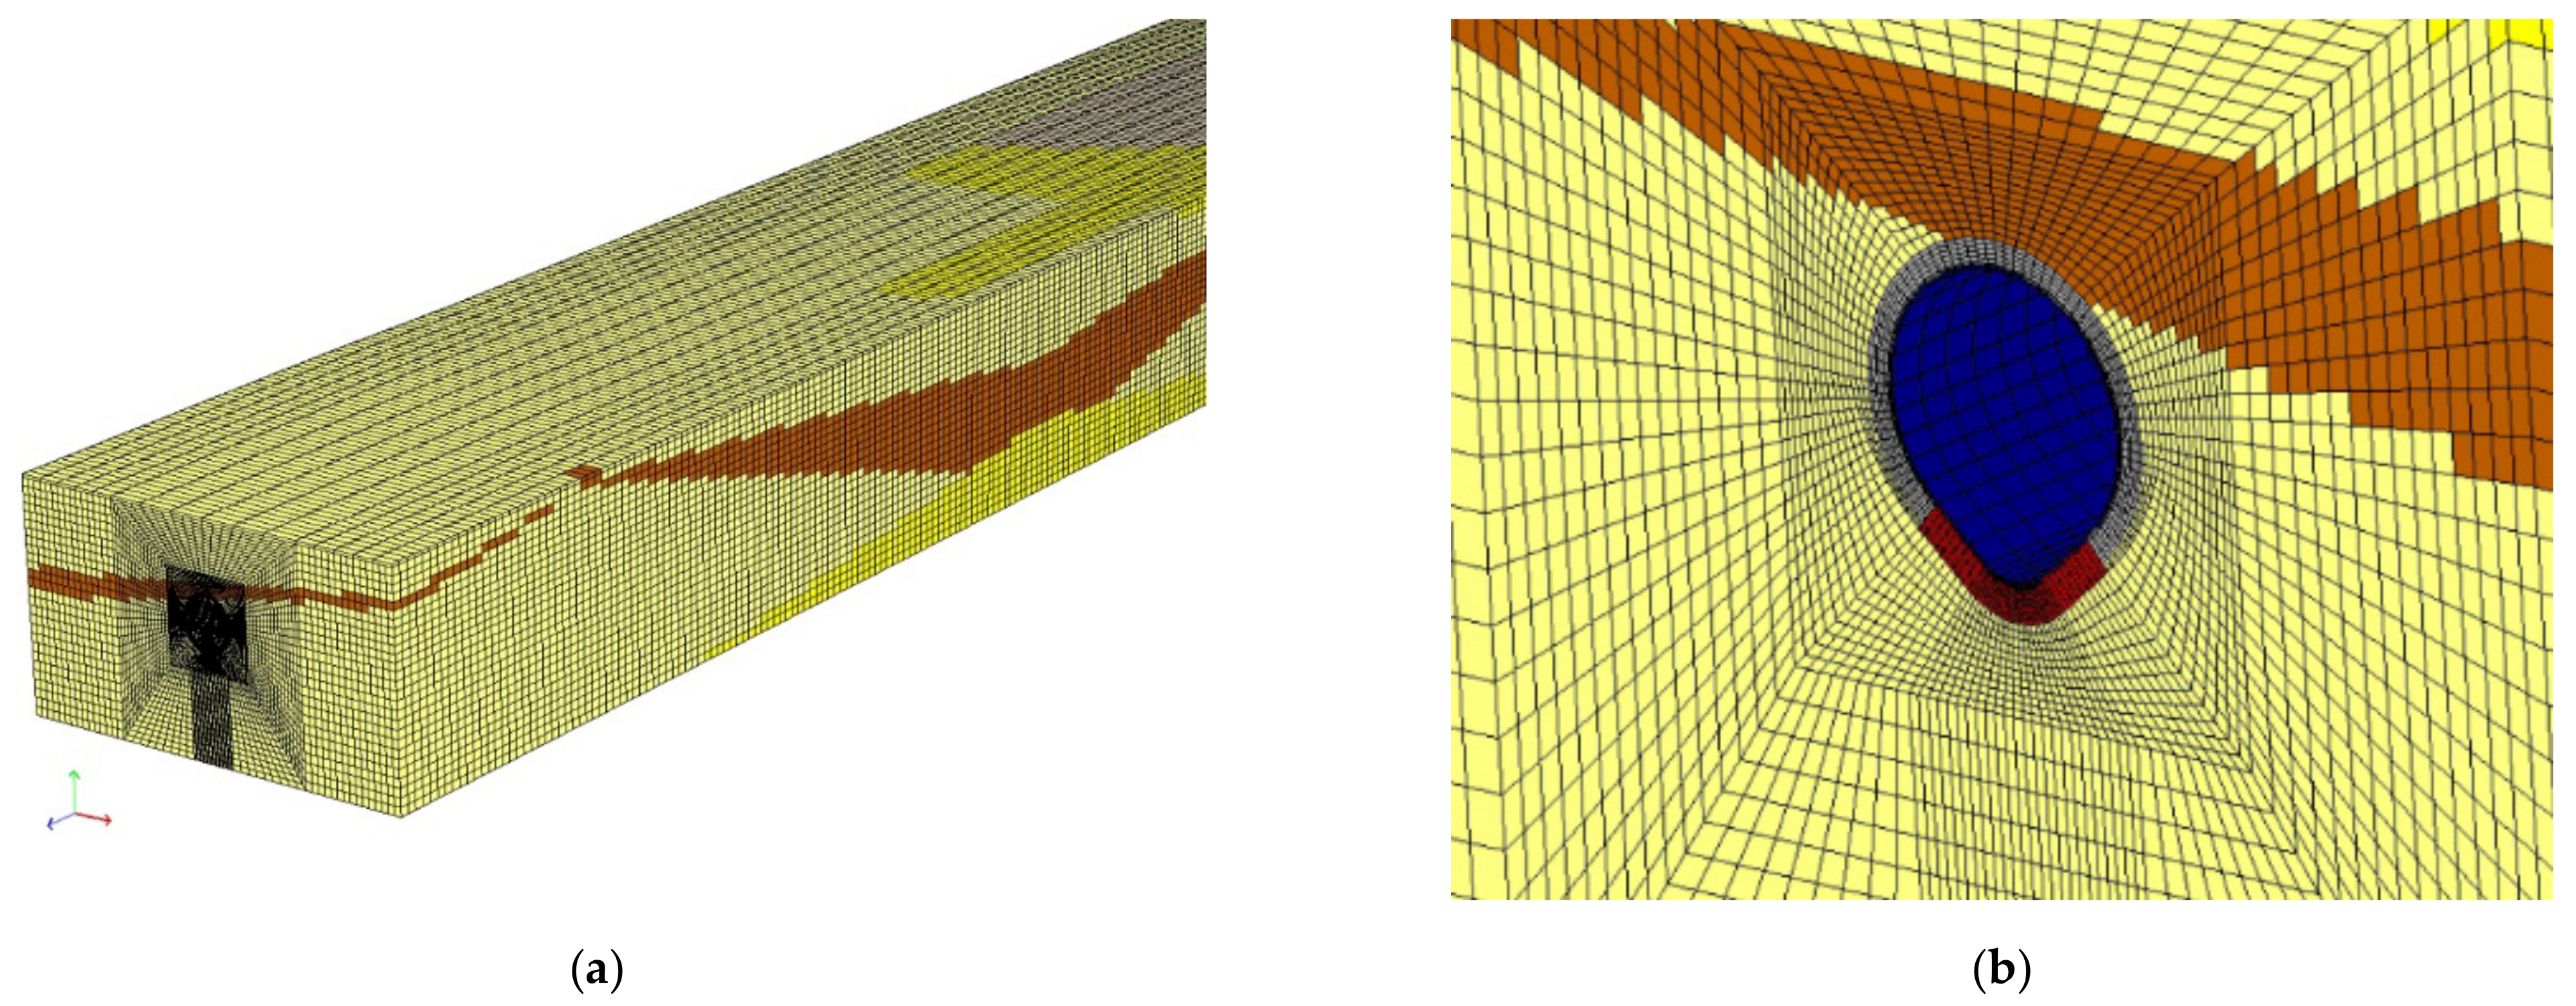
2. Numerical Modelling
- Subsoil initial stress generation;
- Embedded retaining walls execution;
- Dewatering the excavation;
- Excavation with successive wall propping (strutting or anchoring);
- Foundation slab execution;
- Building underground part of structure;
- Completion of excavation dewatering;
- Building above-ground part execution;
- Building operation period.
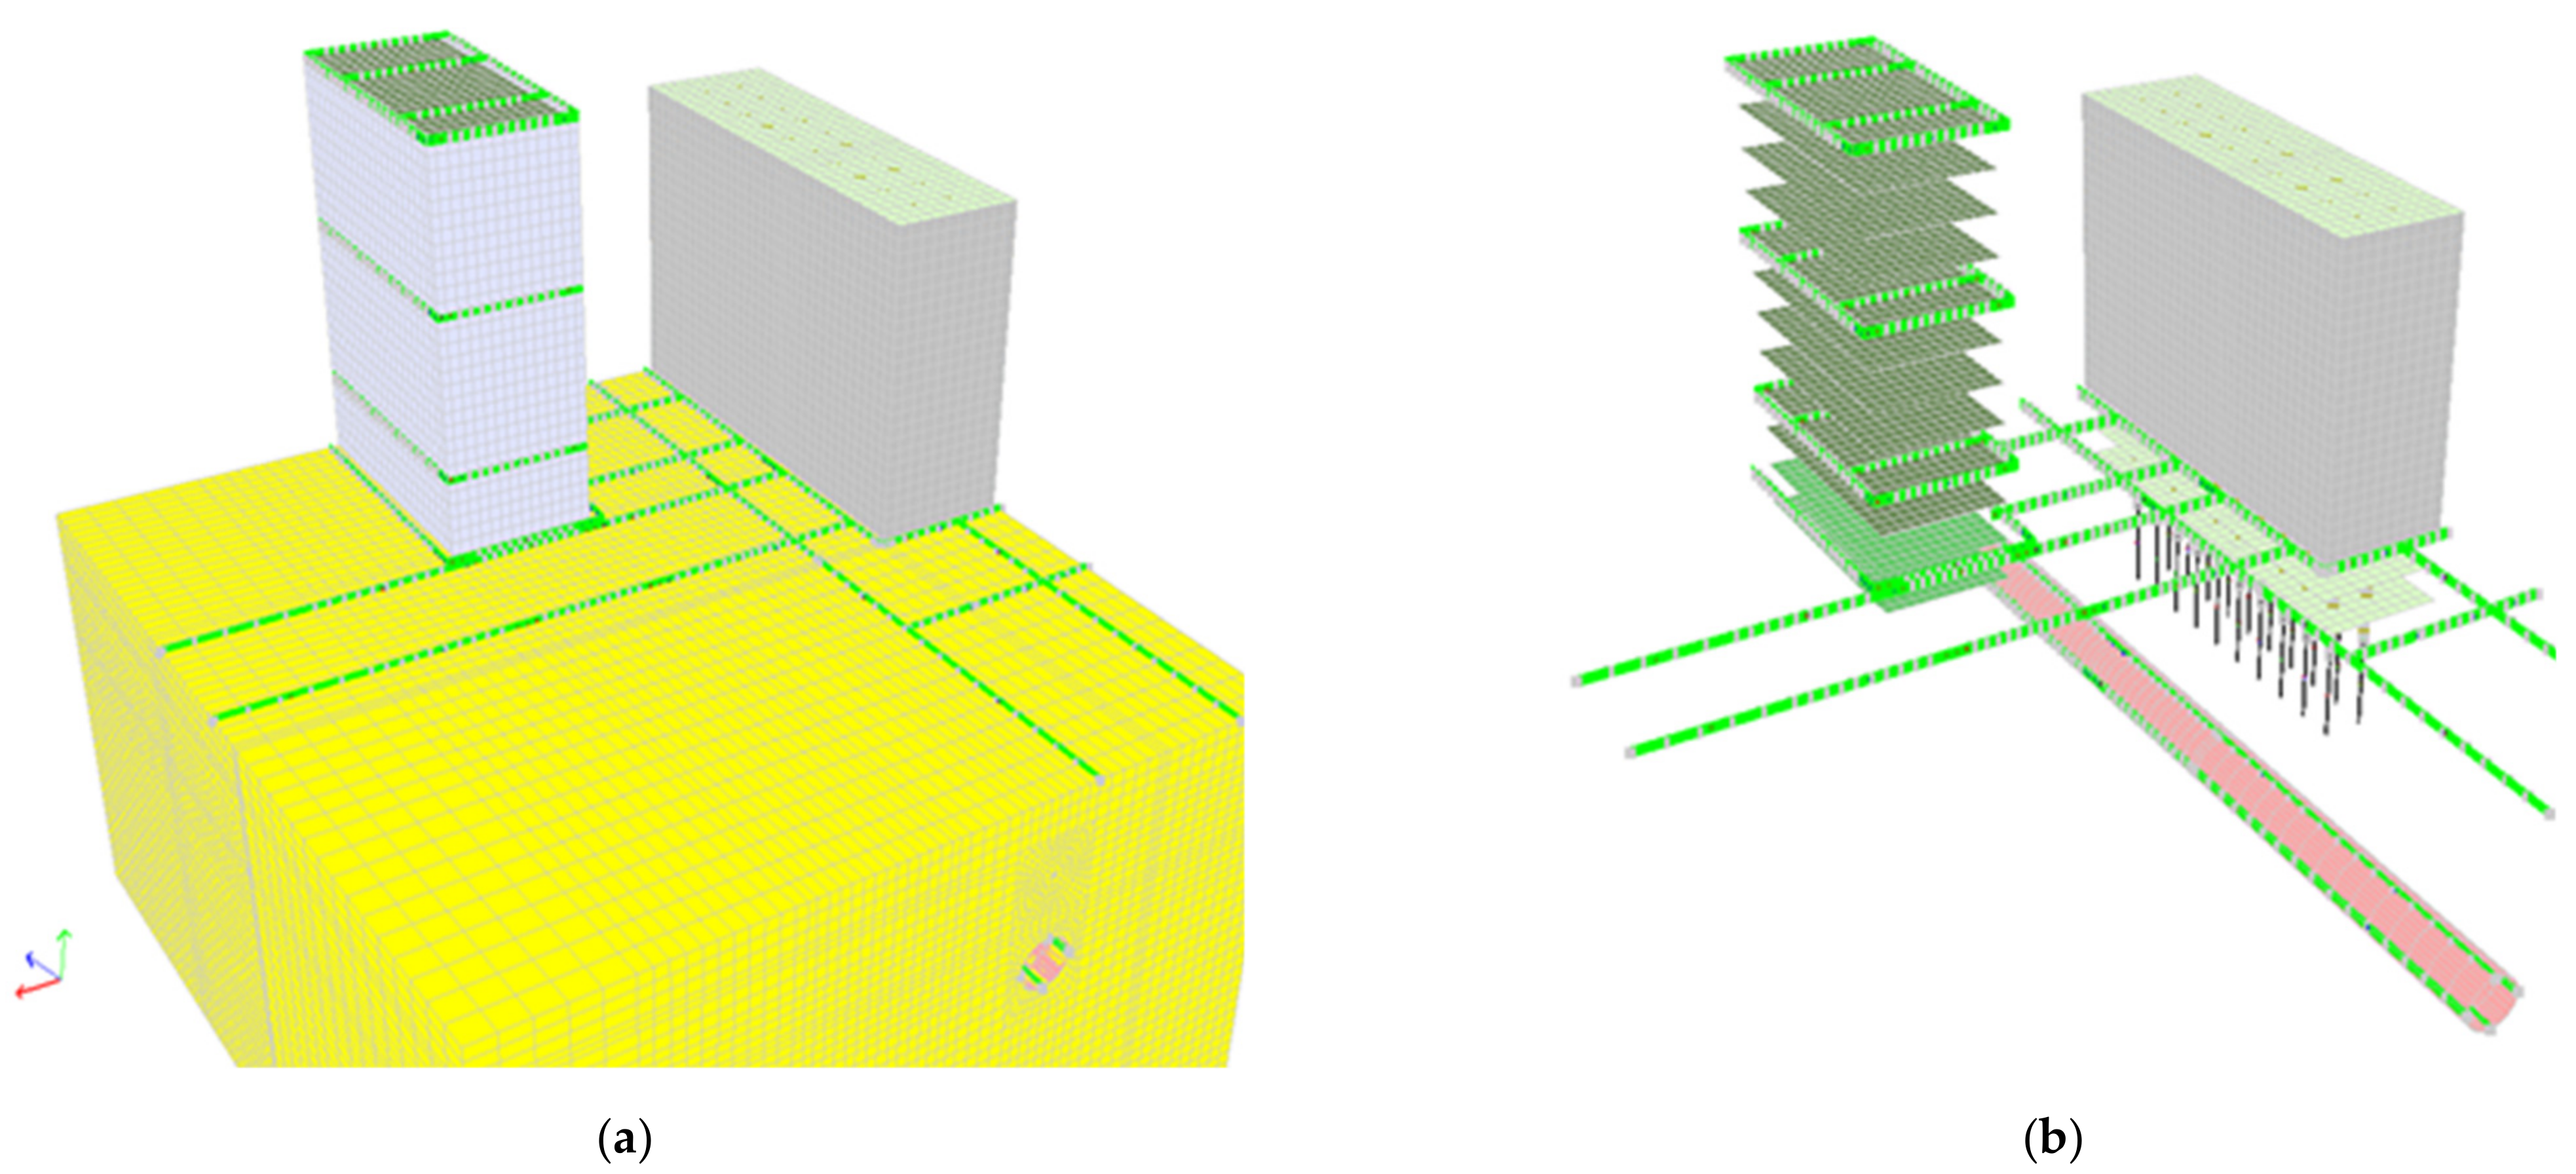
- Subsoil initial stress generation;
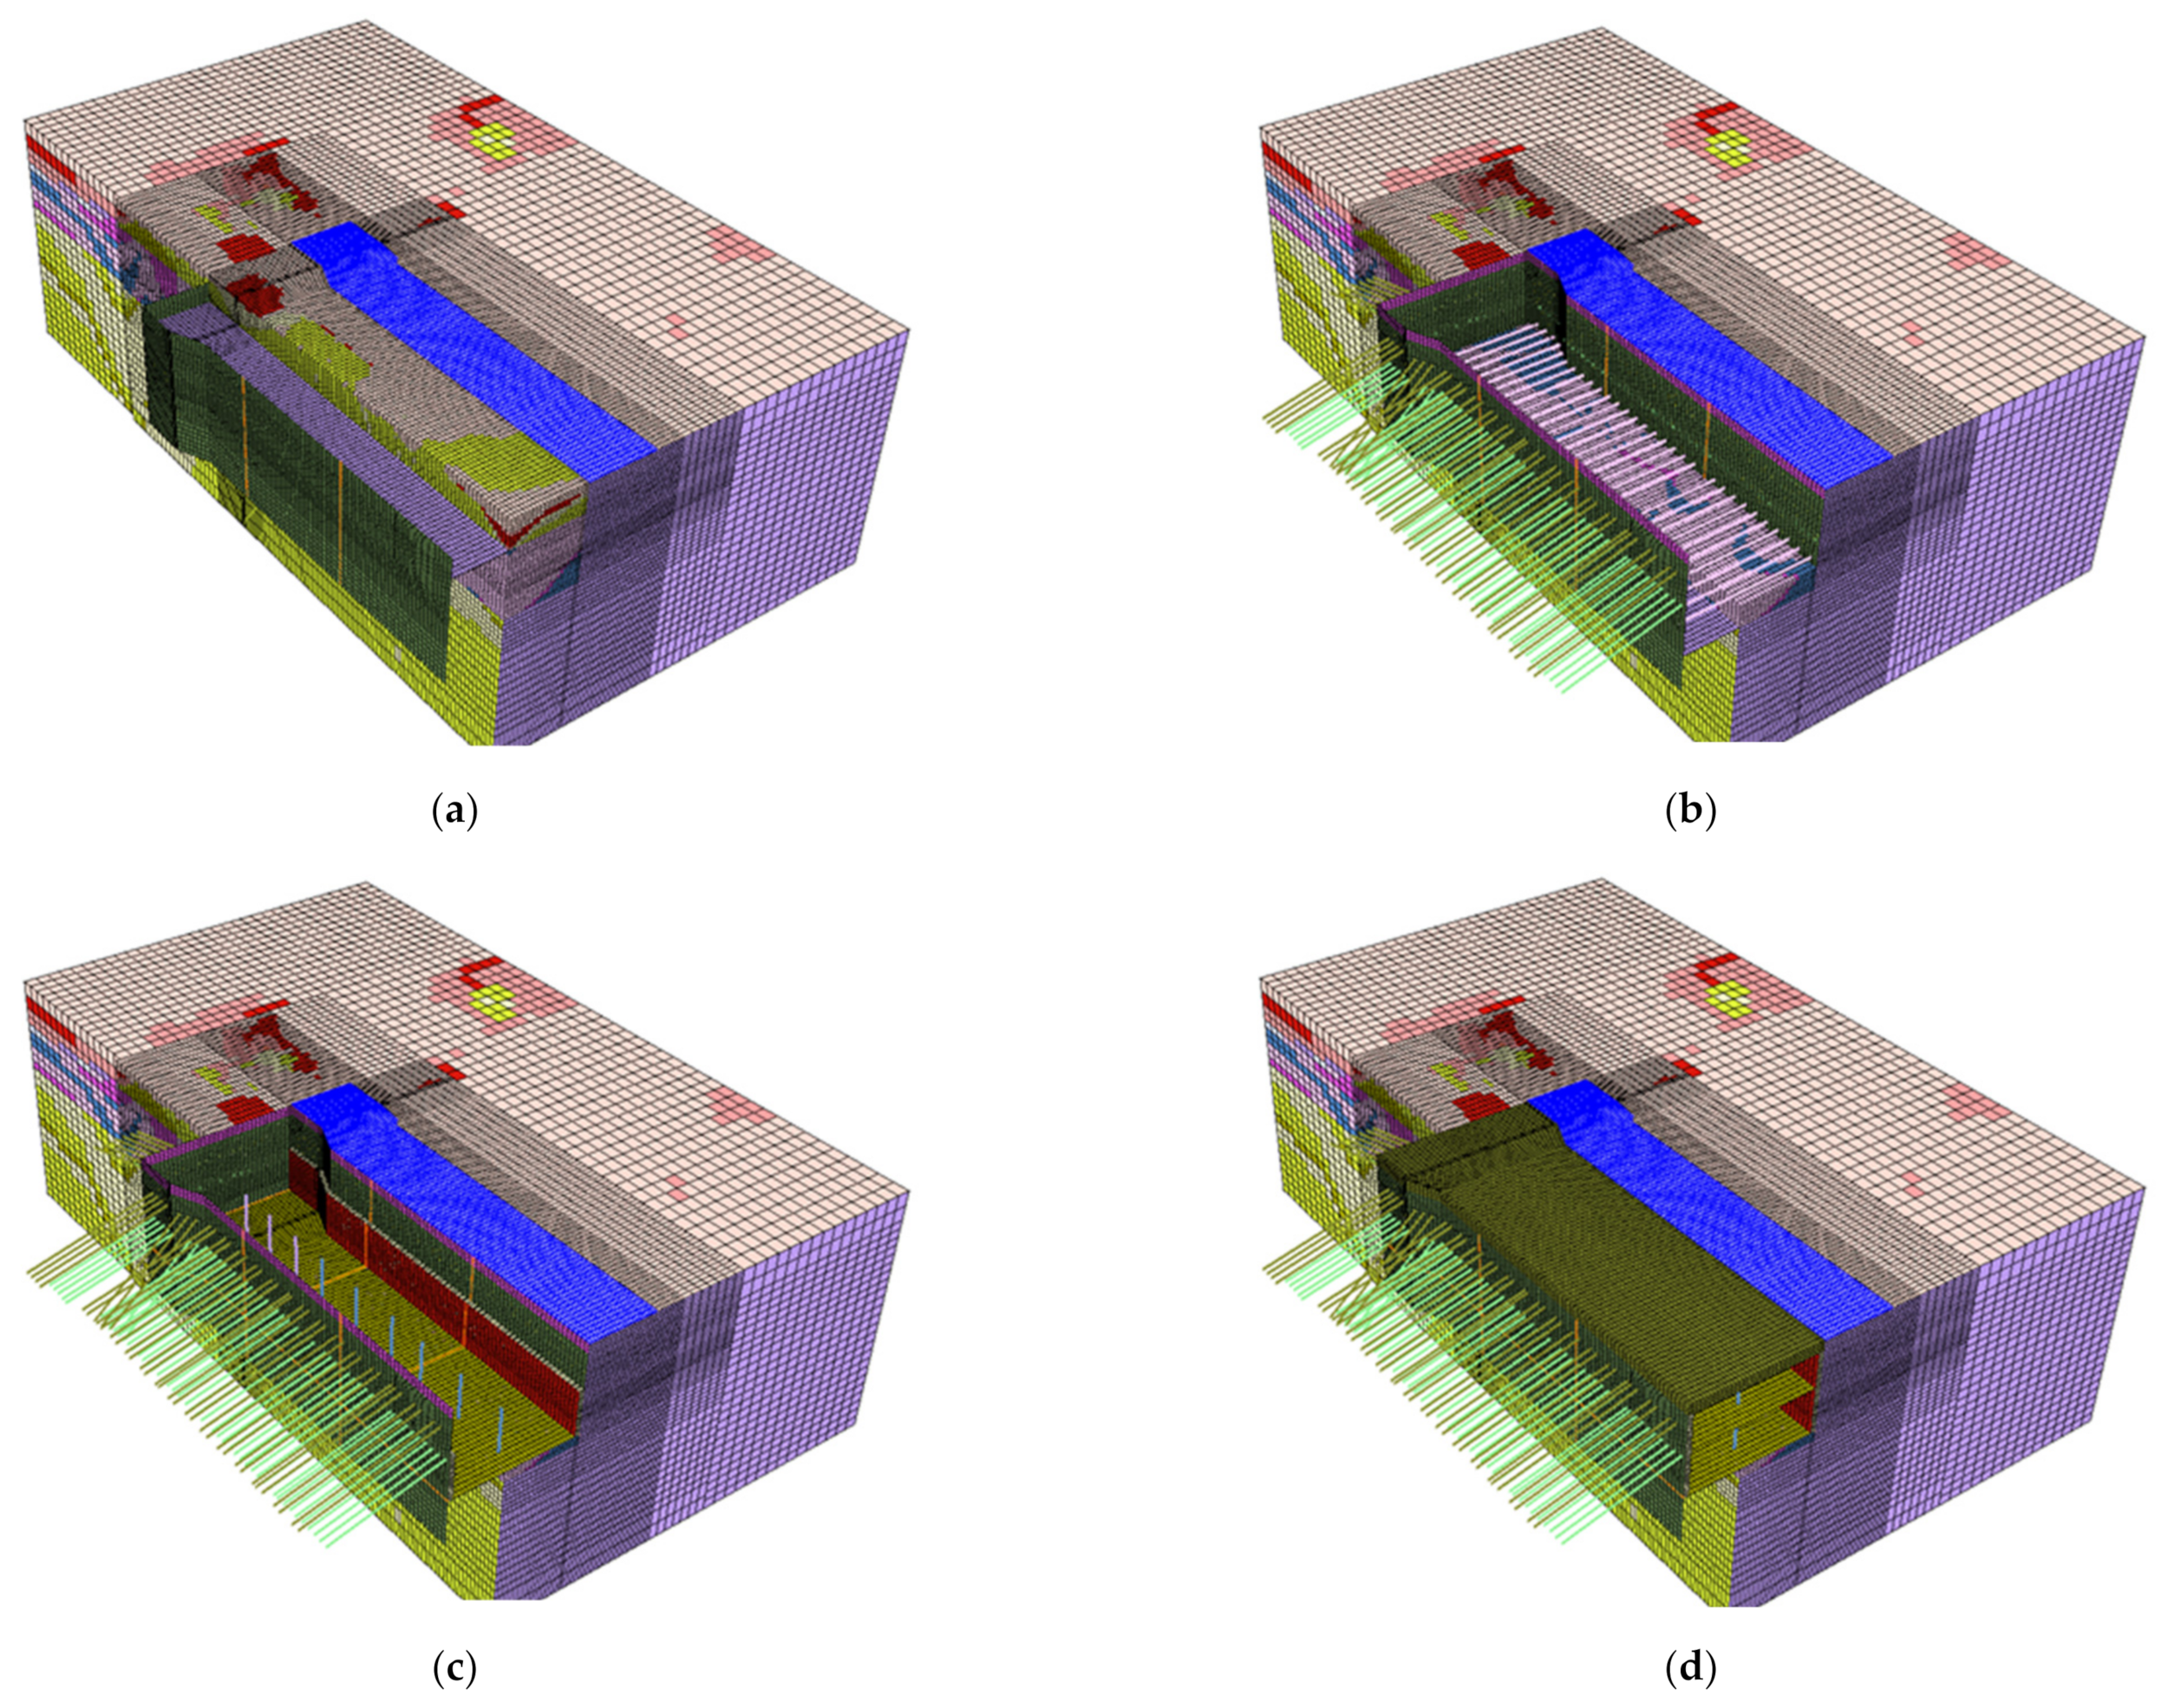
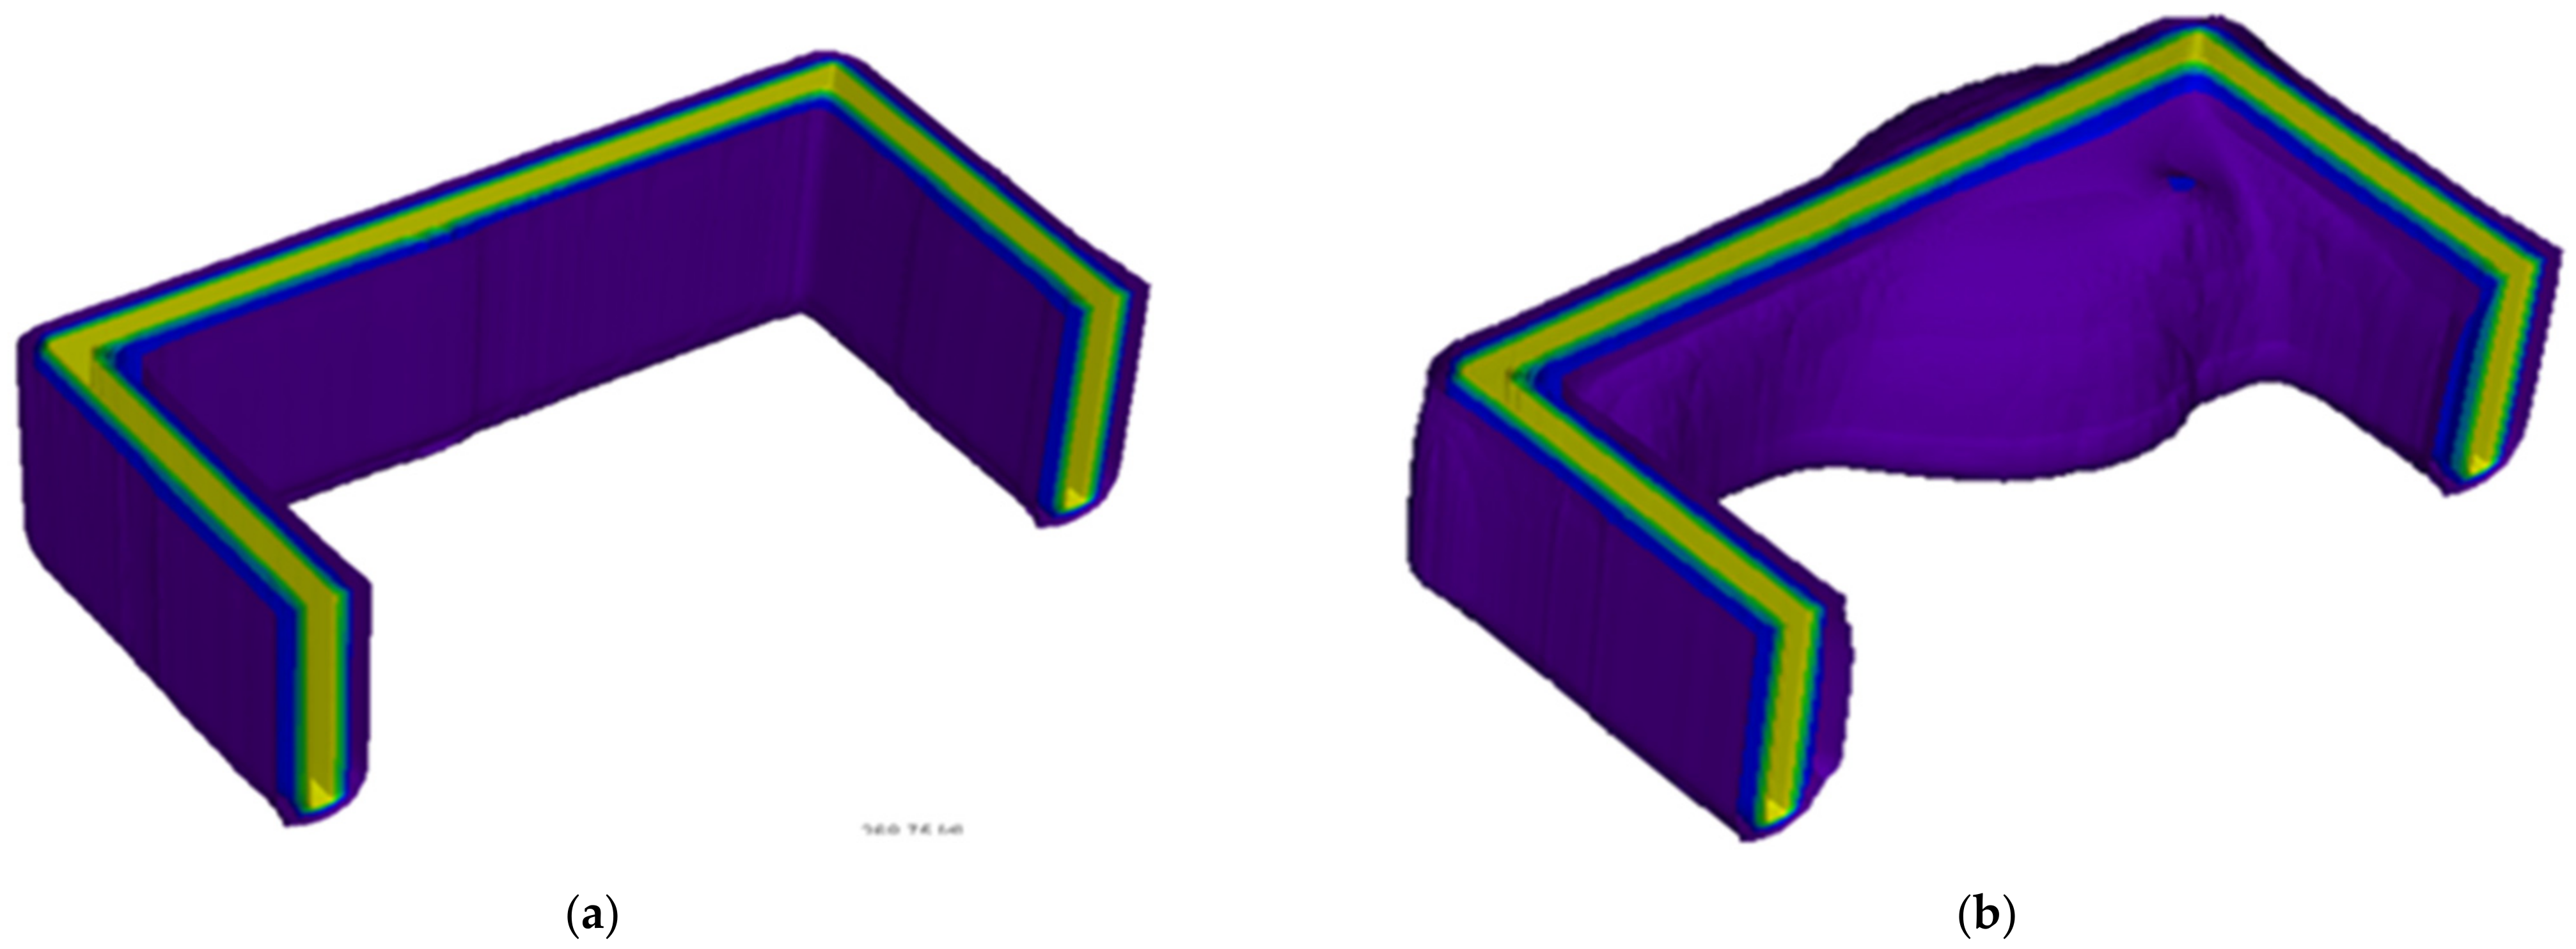
- Execution of diaphragm walls down to −20.7 m b.g.l (below ground level)—Figure 1a;
- Excavation execution to level −4.55 m b.g.l.;
- Execution of the first row of anchors;
- Excavation execution to level −6.65 m b.g.l.;
- Execution of the second row of anchors;
- Excavation execution to level −11.85 m b.g.l.;
- Tubular struts at −10.85 m b.g.l.—Figure 1b;
- Excavation execution to level −14.60 m b.g.l.;
- Execution of foundation slab—Figure 1c;
- Execution of walls and columns to intermediate floor level;
- Execution of walls and columns up to underground station floor—Figure 1d;
- Excavation backfilling.
3. Monitoring Design Principles
- Criteria based on statistically elaborated measurement results, collected in various regions of the world, for various geological and soil conditions, as well as for different execution technologies;
- Local criteria based on statically elaborated measurement results for various soils, technologies and adjacent infrastructure type;
- Relationships based on elaborating numerical modelling results [12];
- Numerical models developed for the analysed investment project [2].
4. Selected Monitoring Technologies
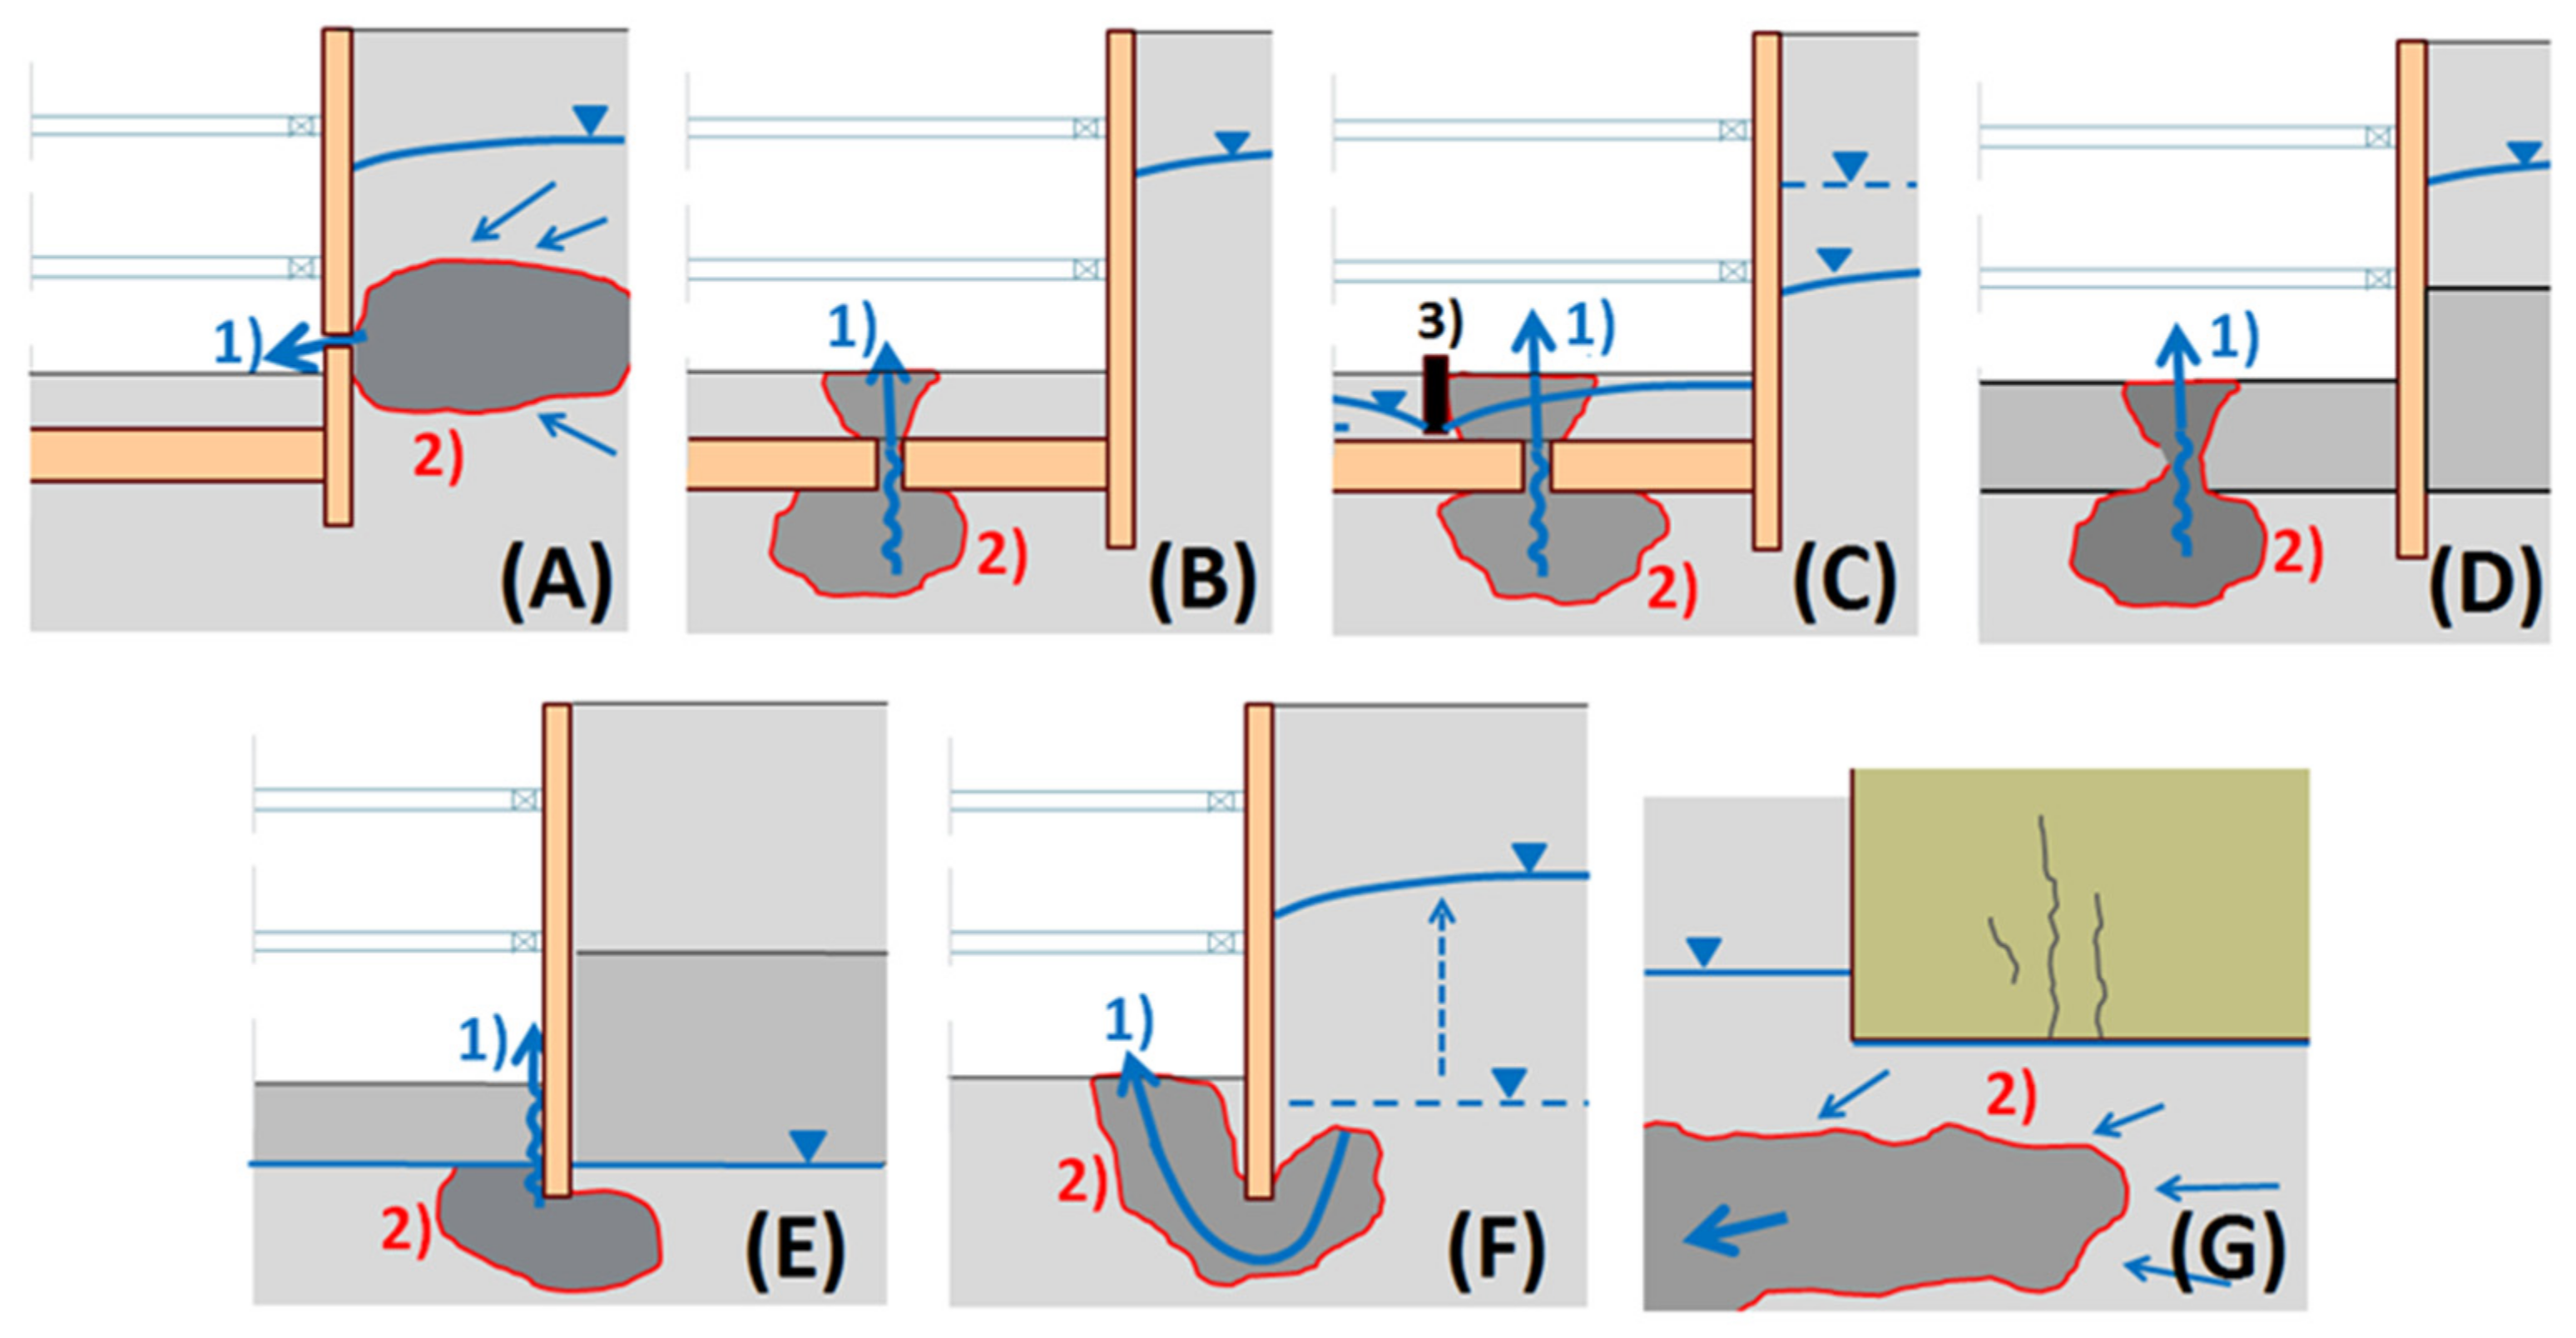
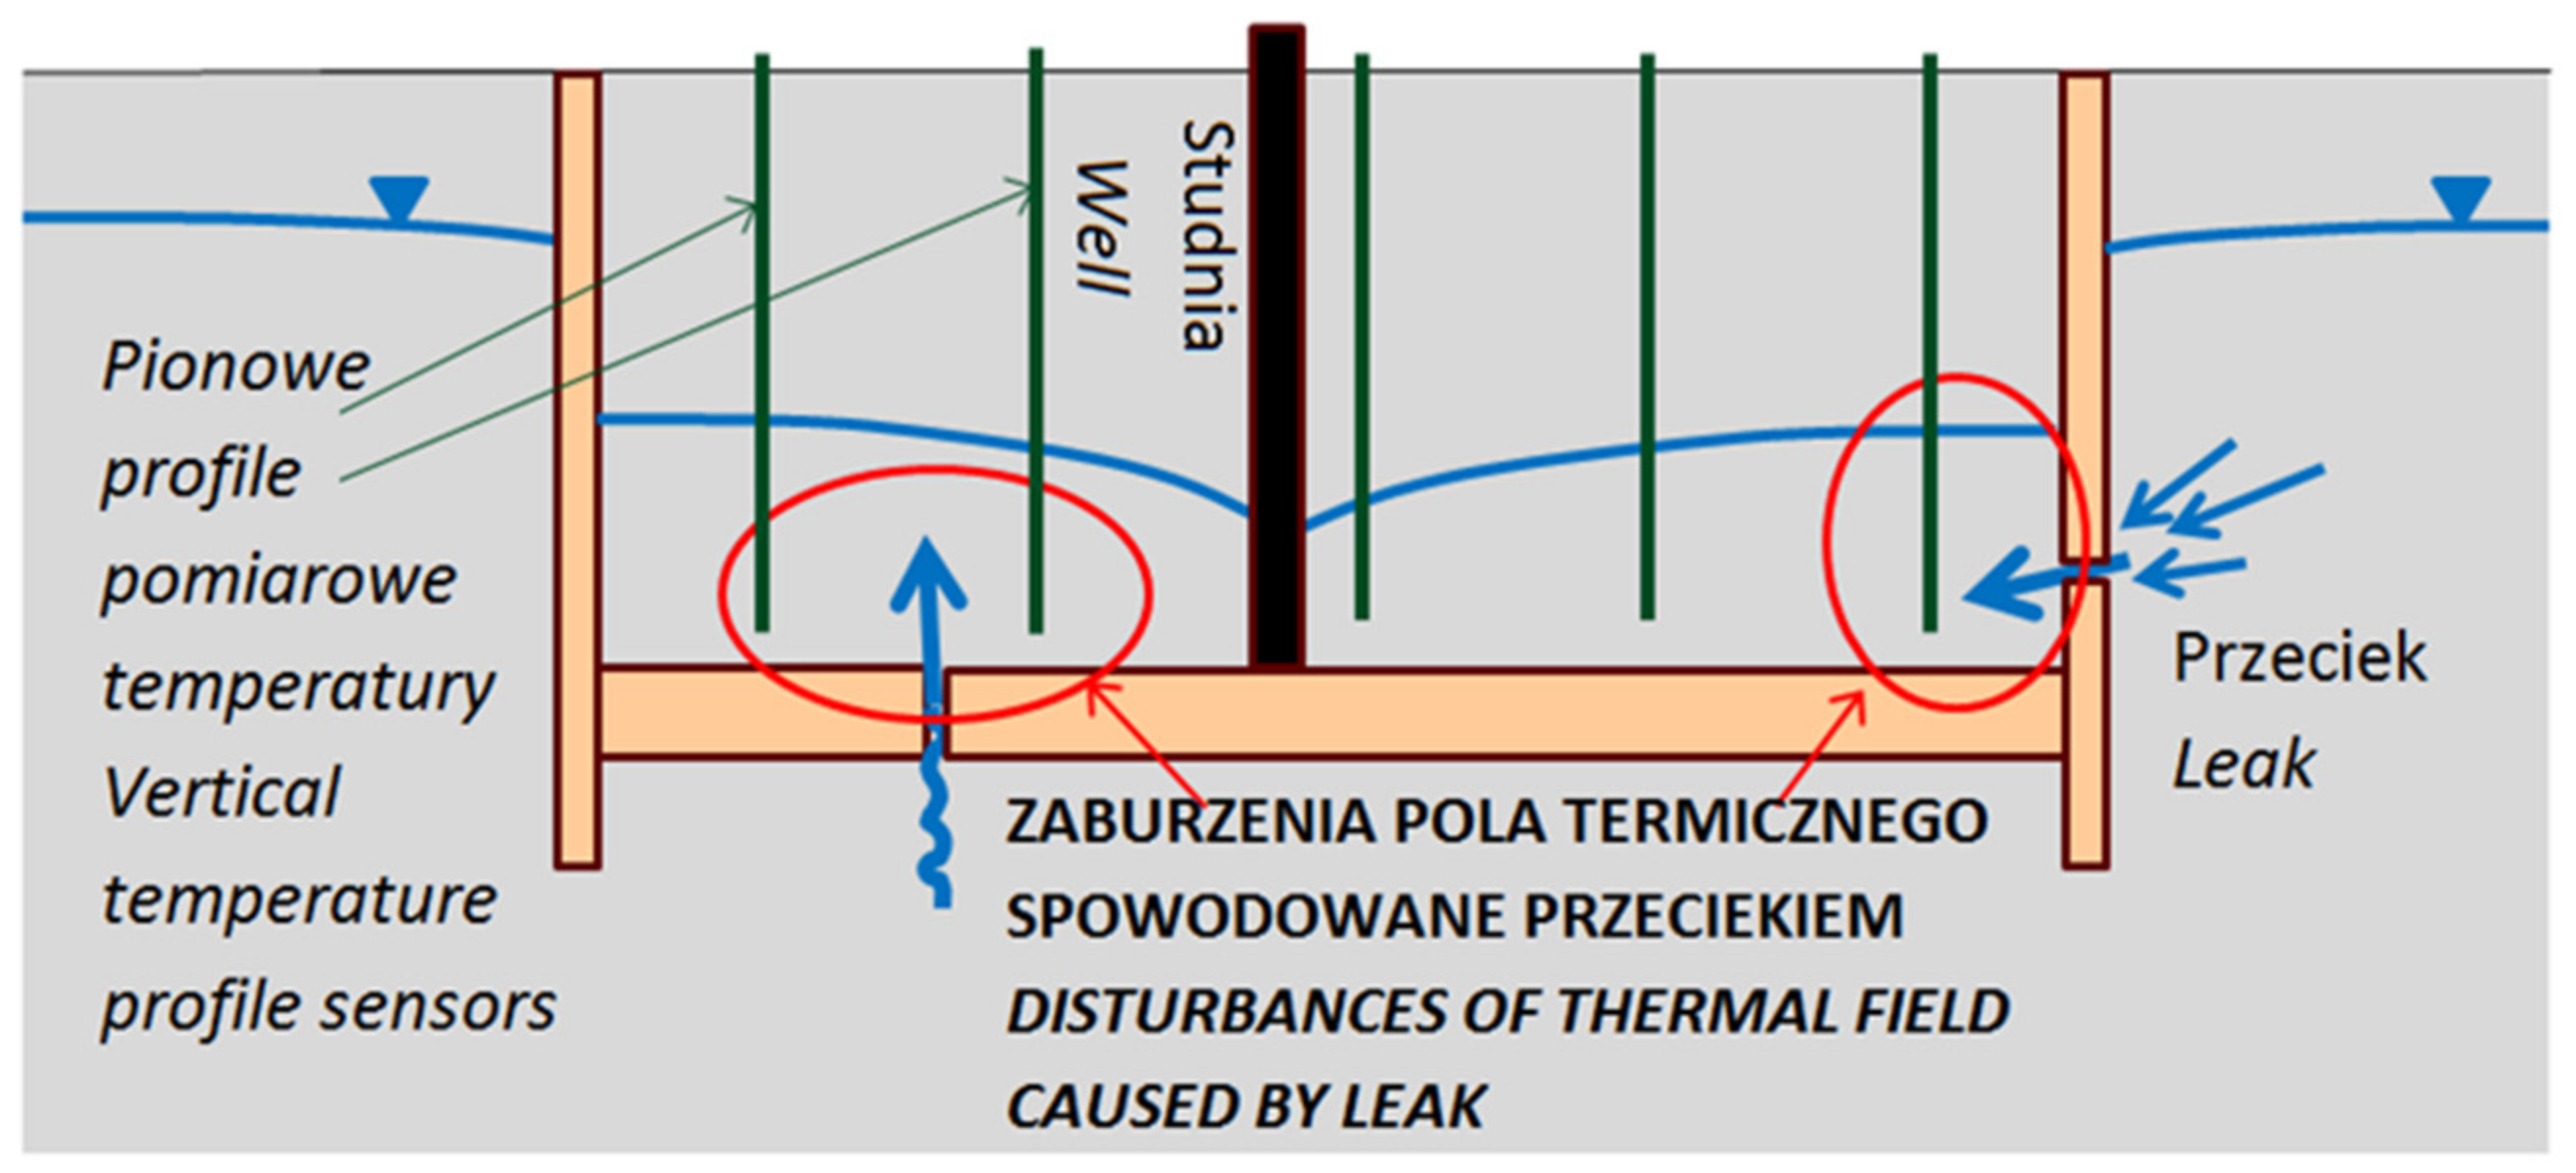
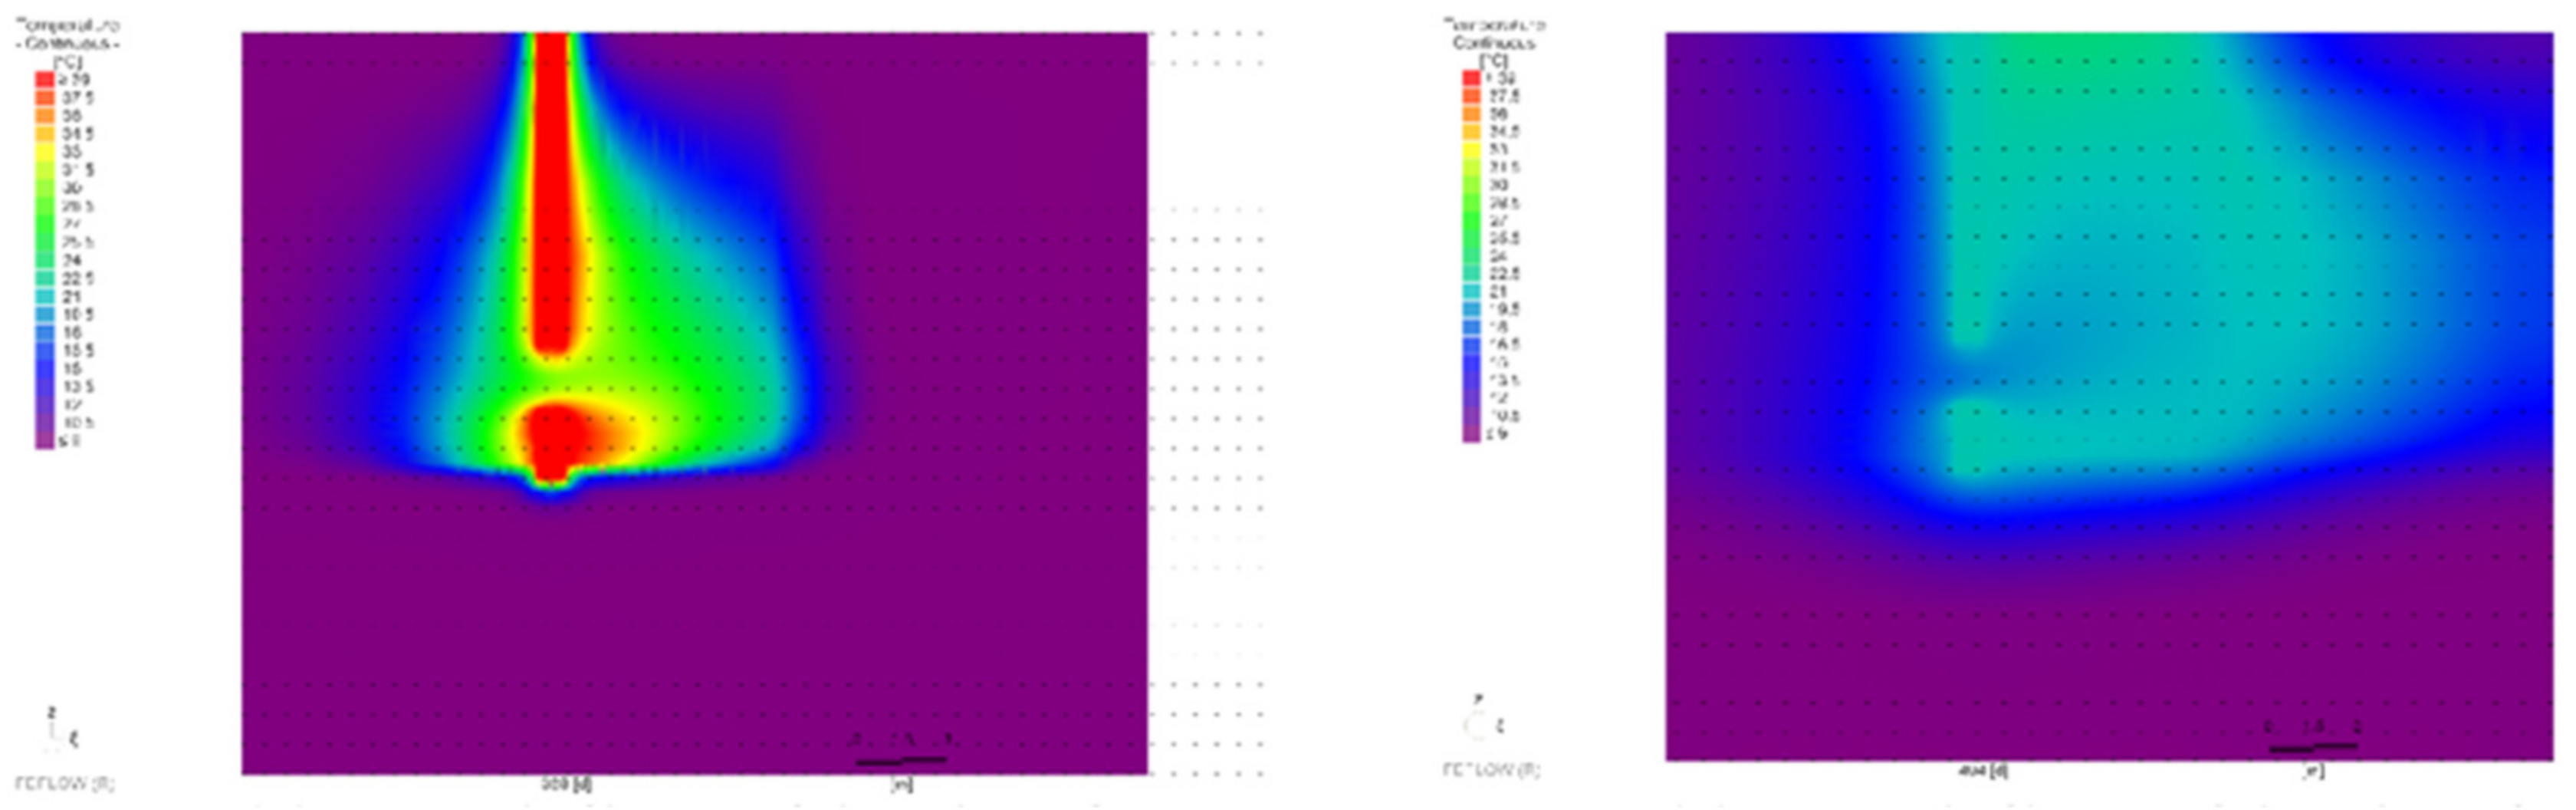
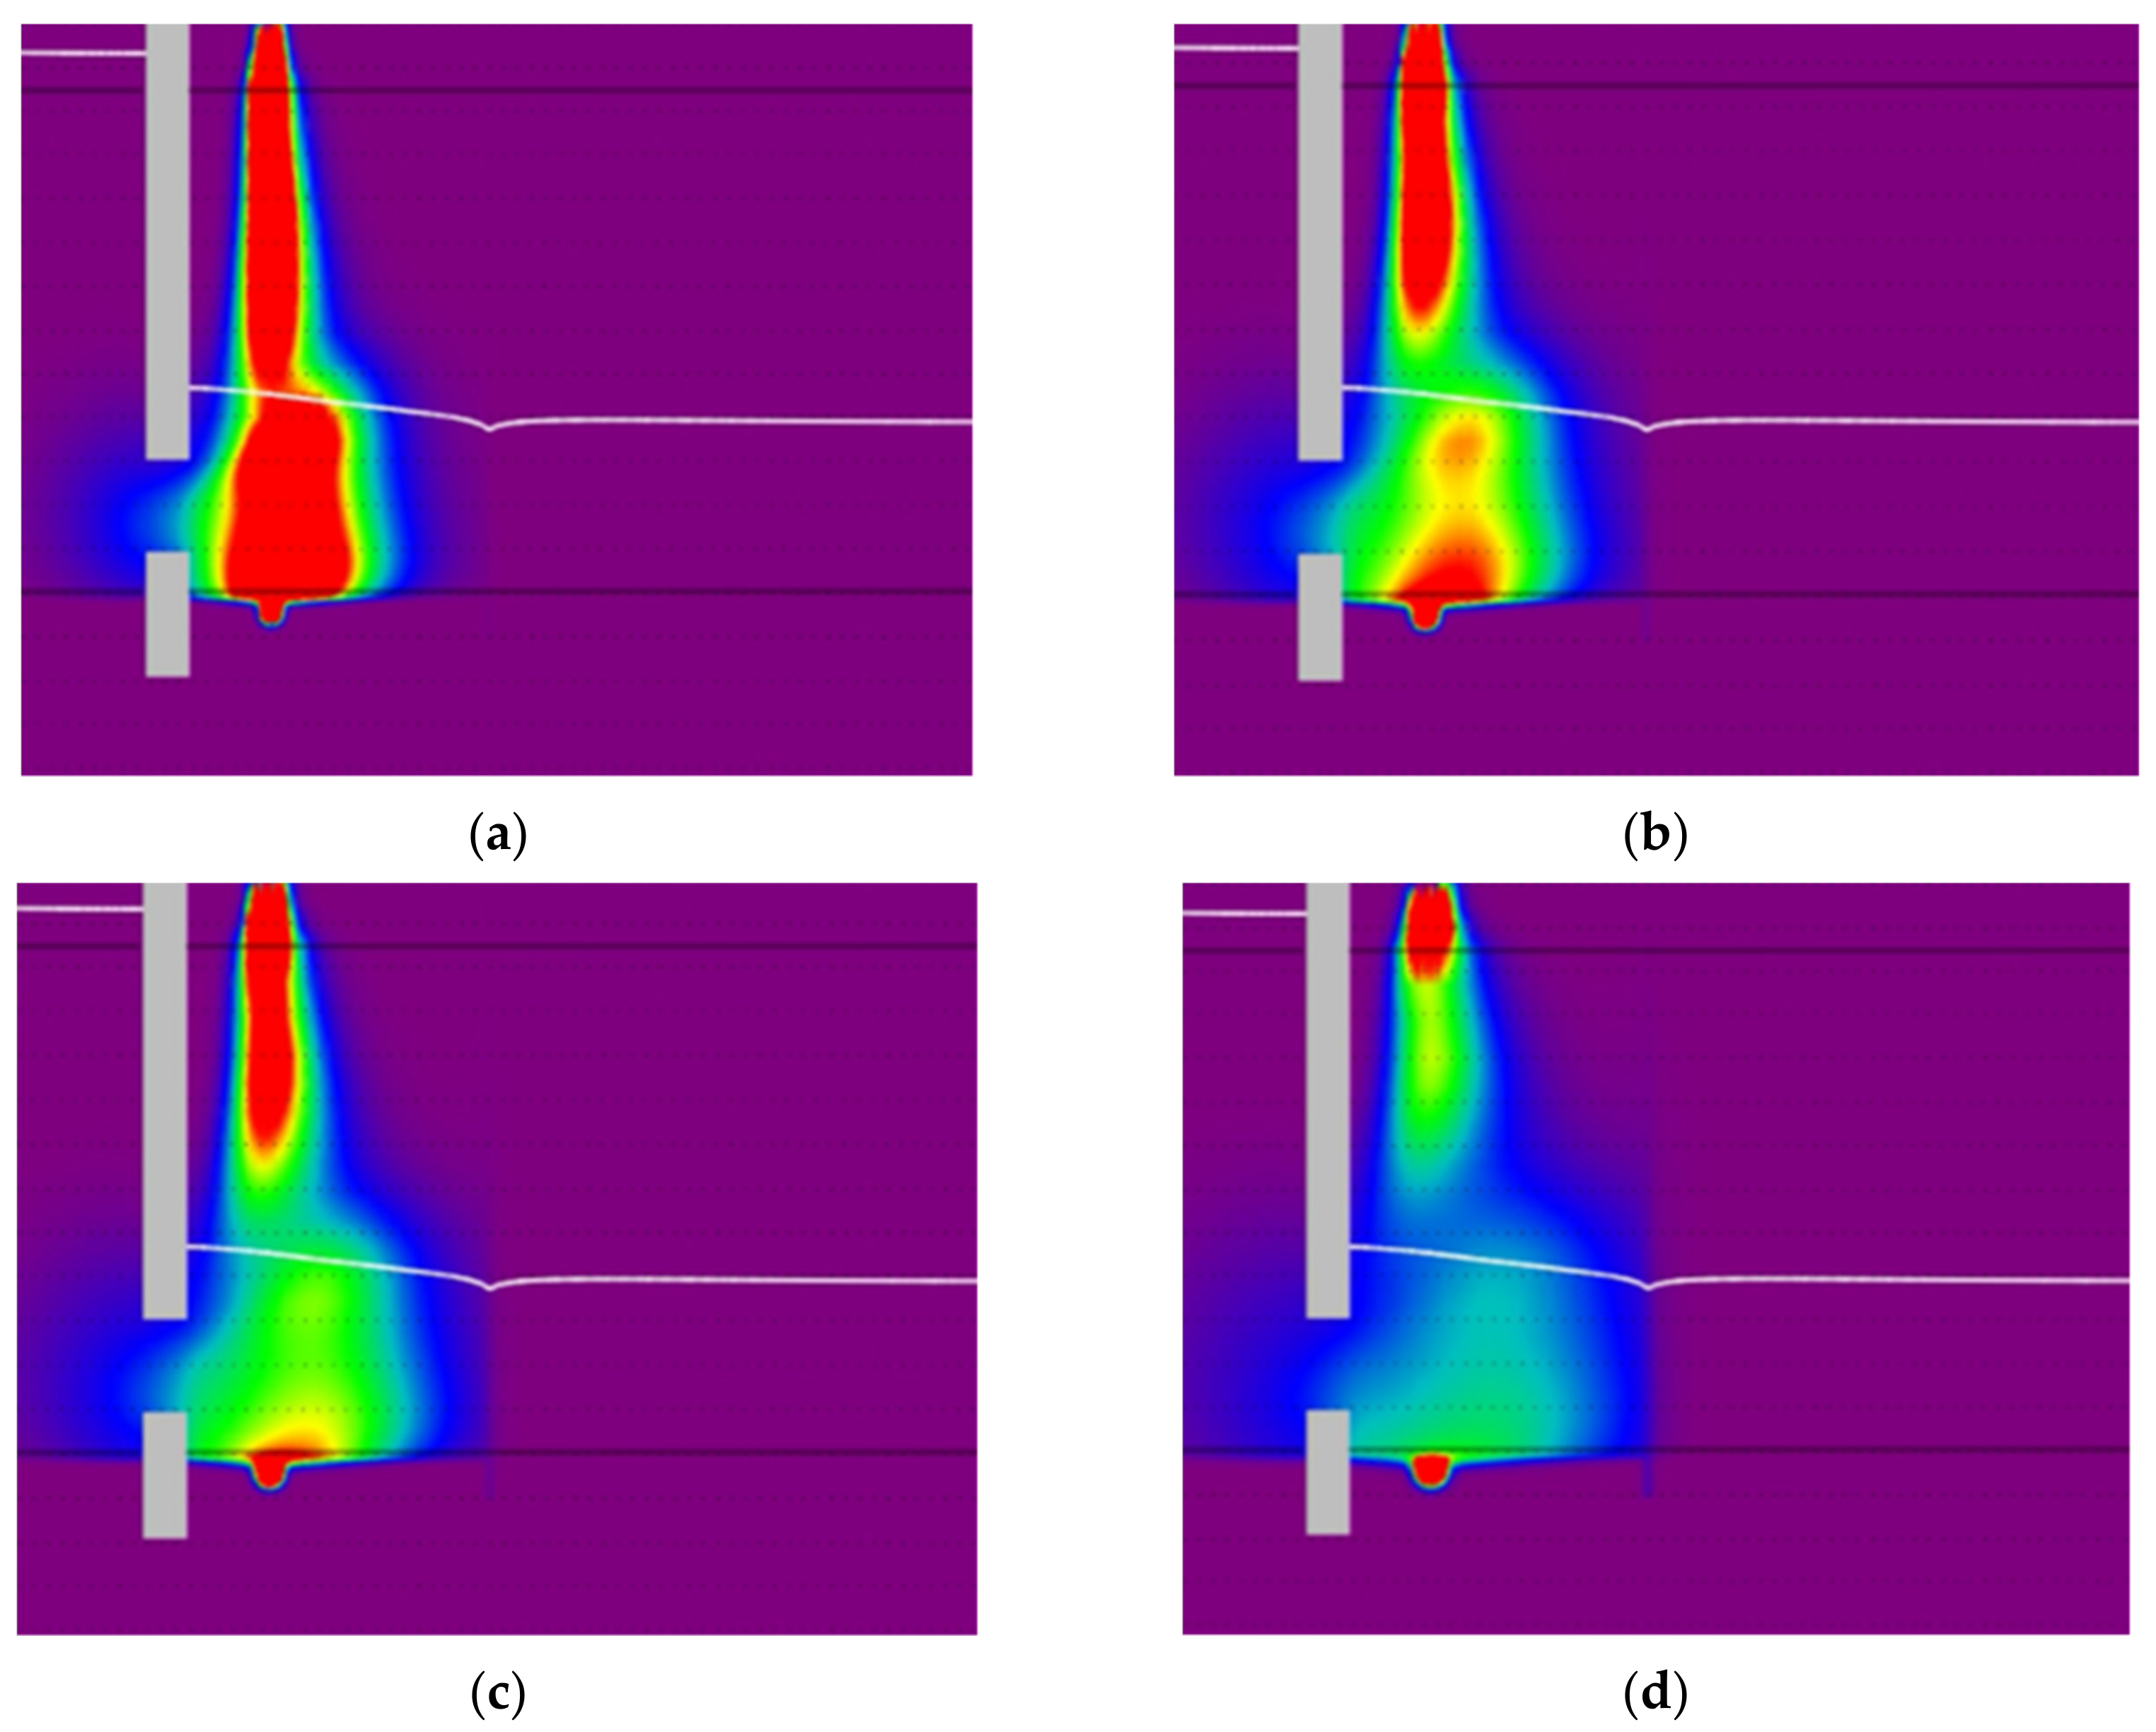
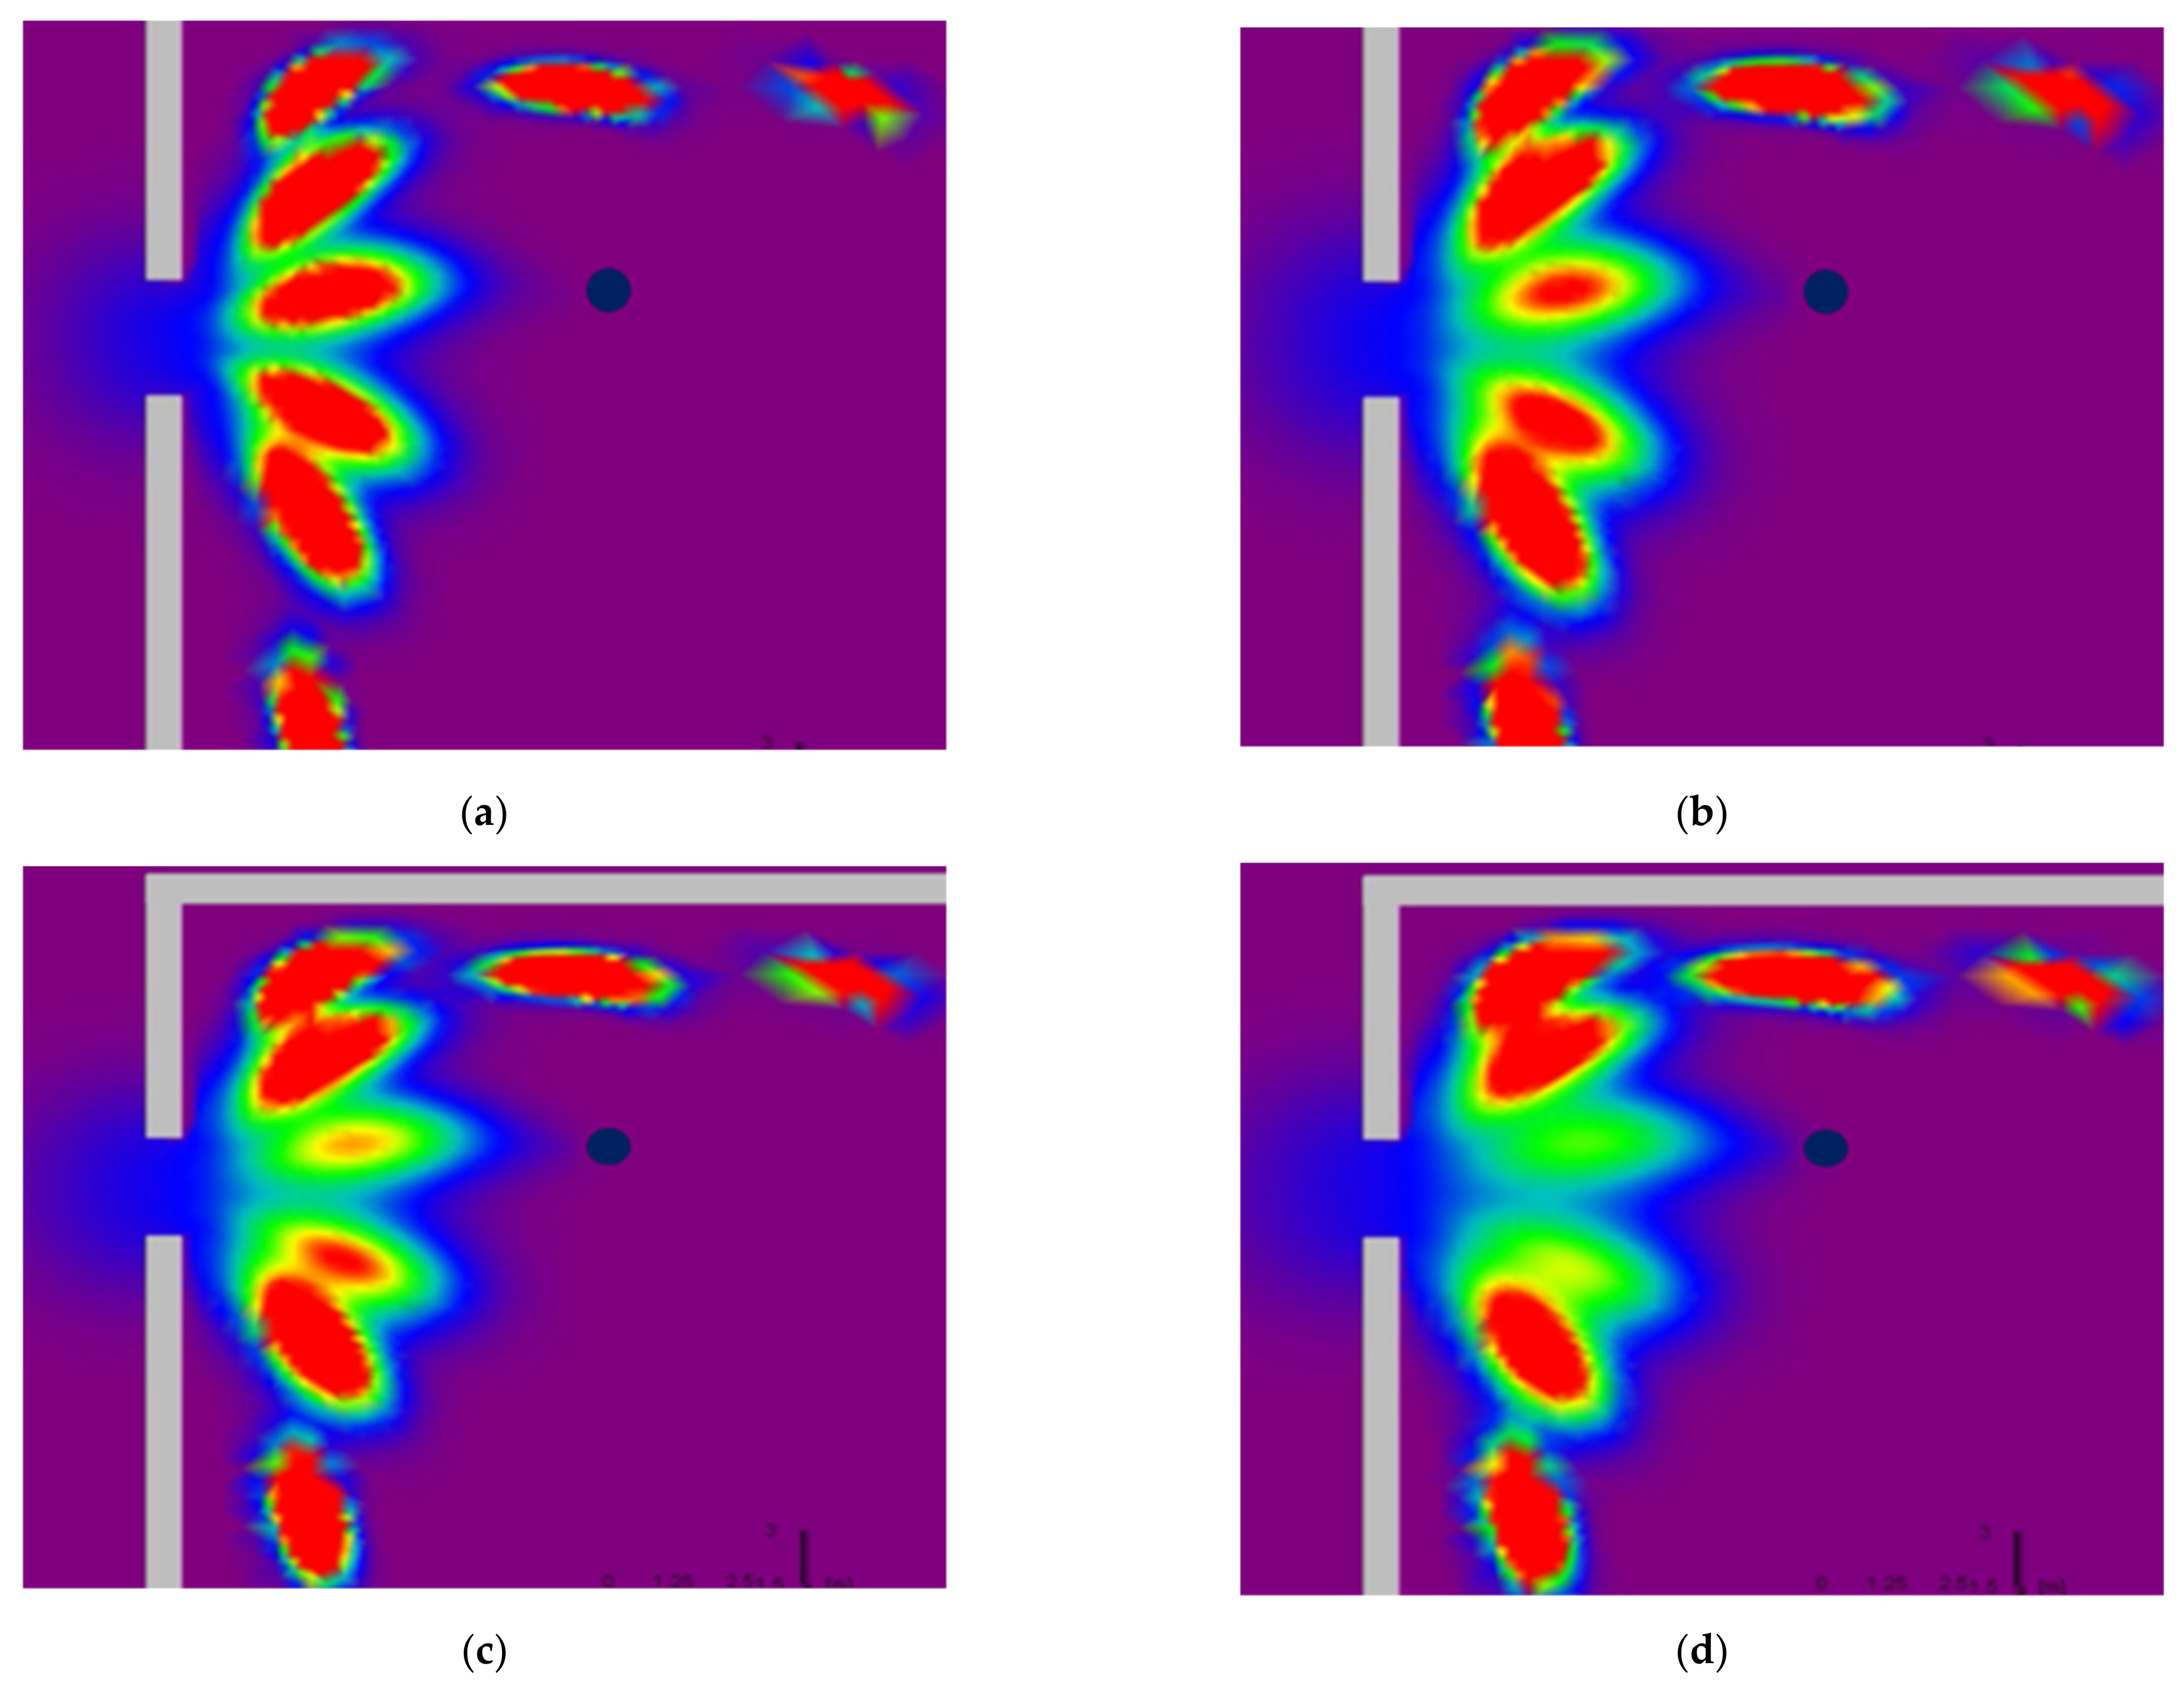
4.1. Thermal Monitoring
- Execution of embedded retaining walls (diaphragm walls);
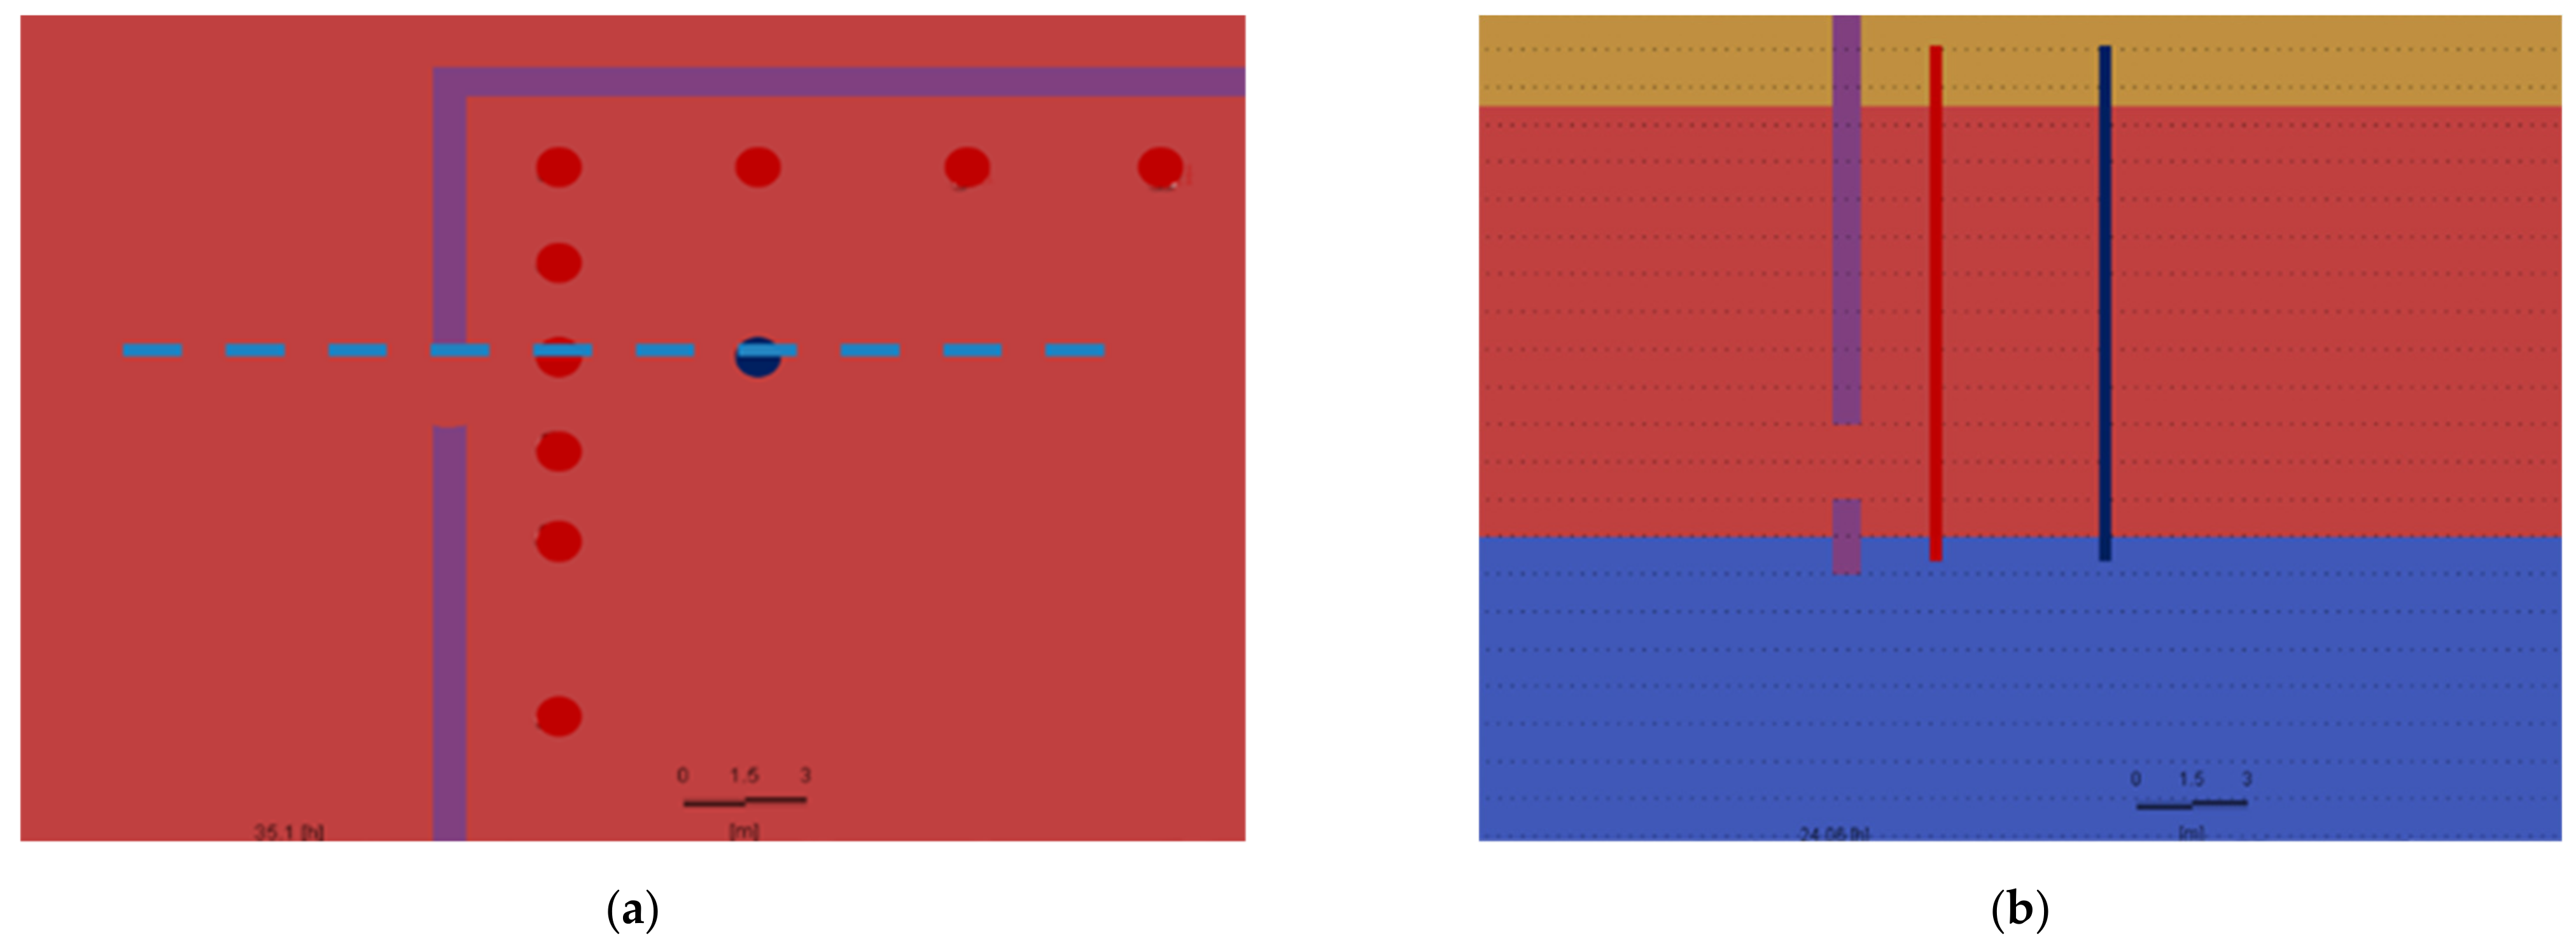
- Installation of vertical temperature measurement profiles within the outline of the planned excavation, drainage wells and piezometers;
- Pumping water from inside the wall, which generates differential pressure between the external and internal water level and its flow at untight wall locations;
- Checking water discharge from the well and water levels in piezometers outside the wall and within the excavation outline;
- Using the thermal monitoring method to detect soil temperature field disturbances caused by leaks;
- Precise sealing of detected leaks from the surface e.g., using grouting;
- Excavation execution.
4.2. Distributed Fibre Optic Sensors
4.2.1. Technology Description
4.2.2. Technology Description II
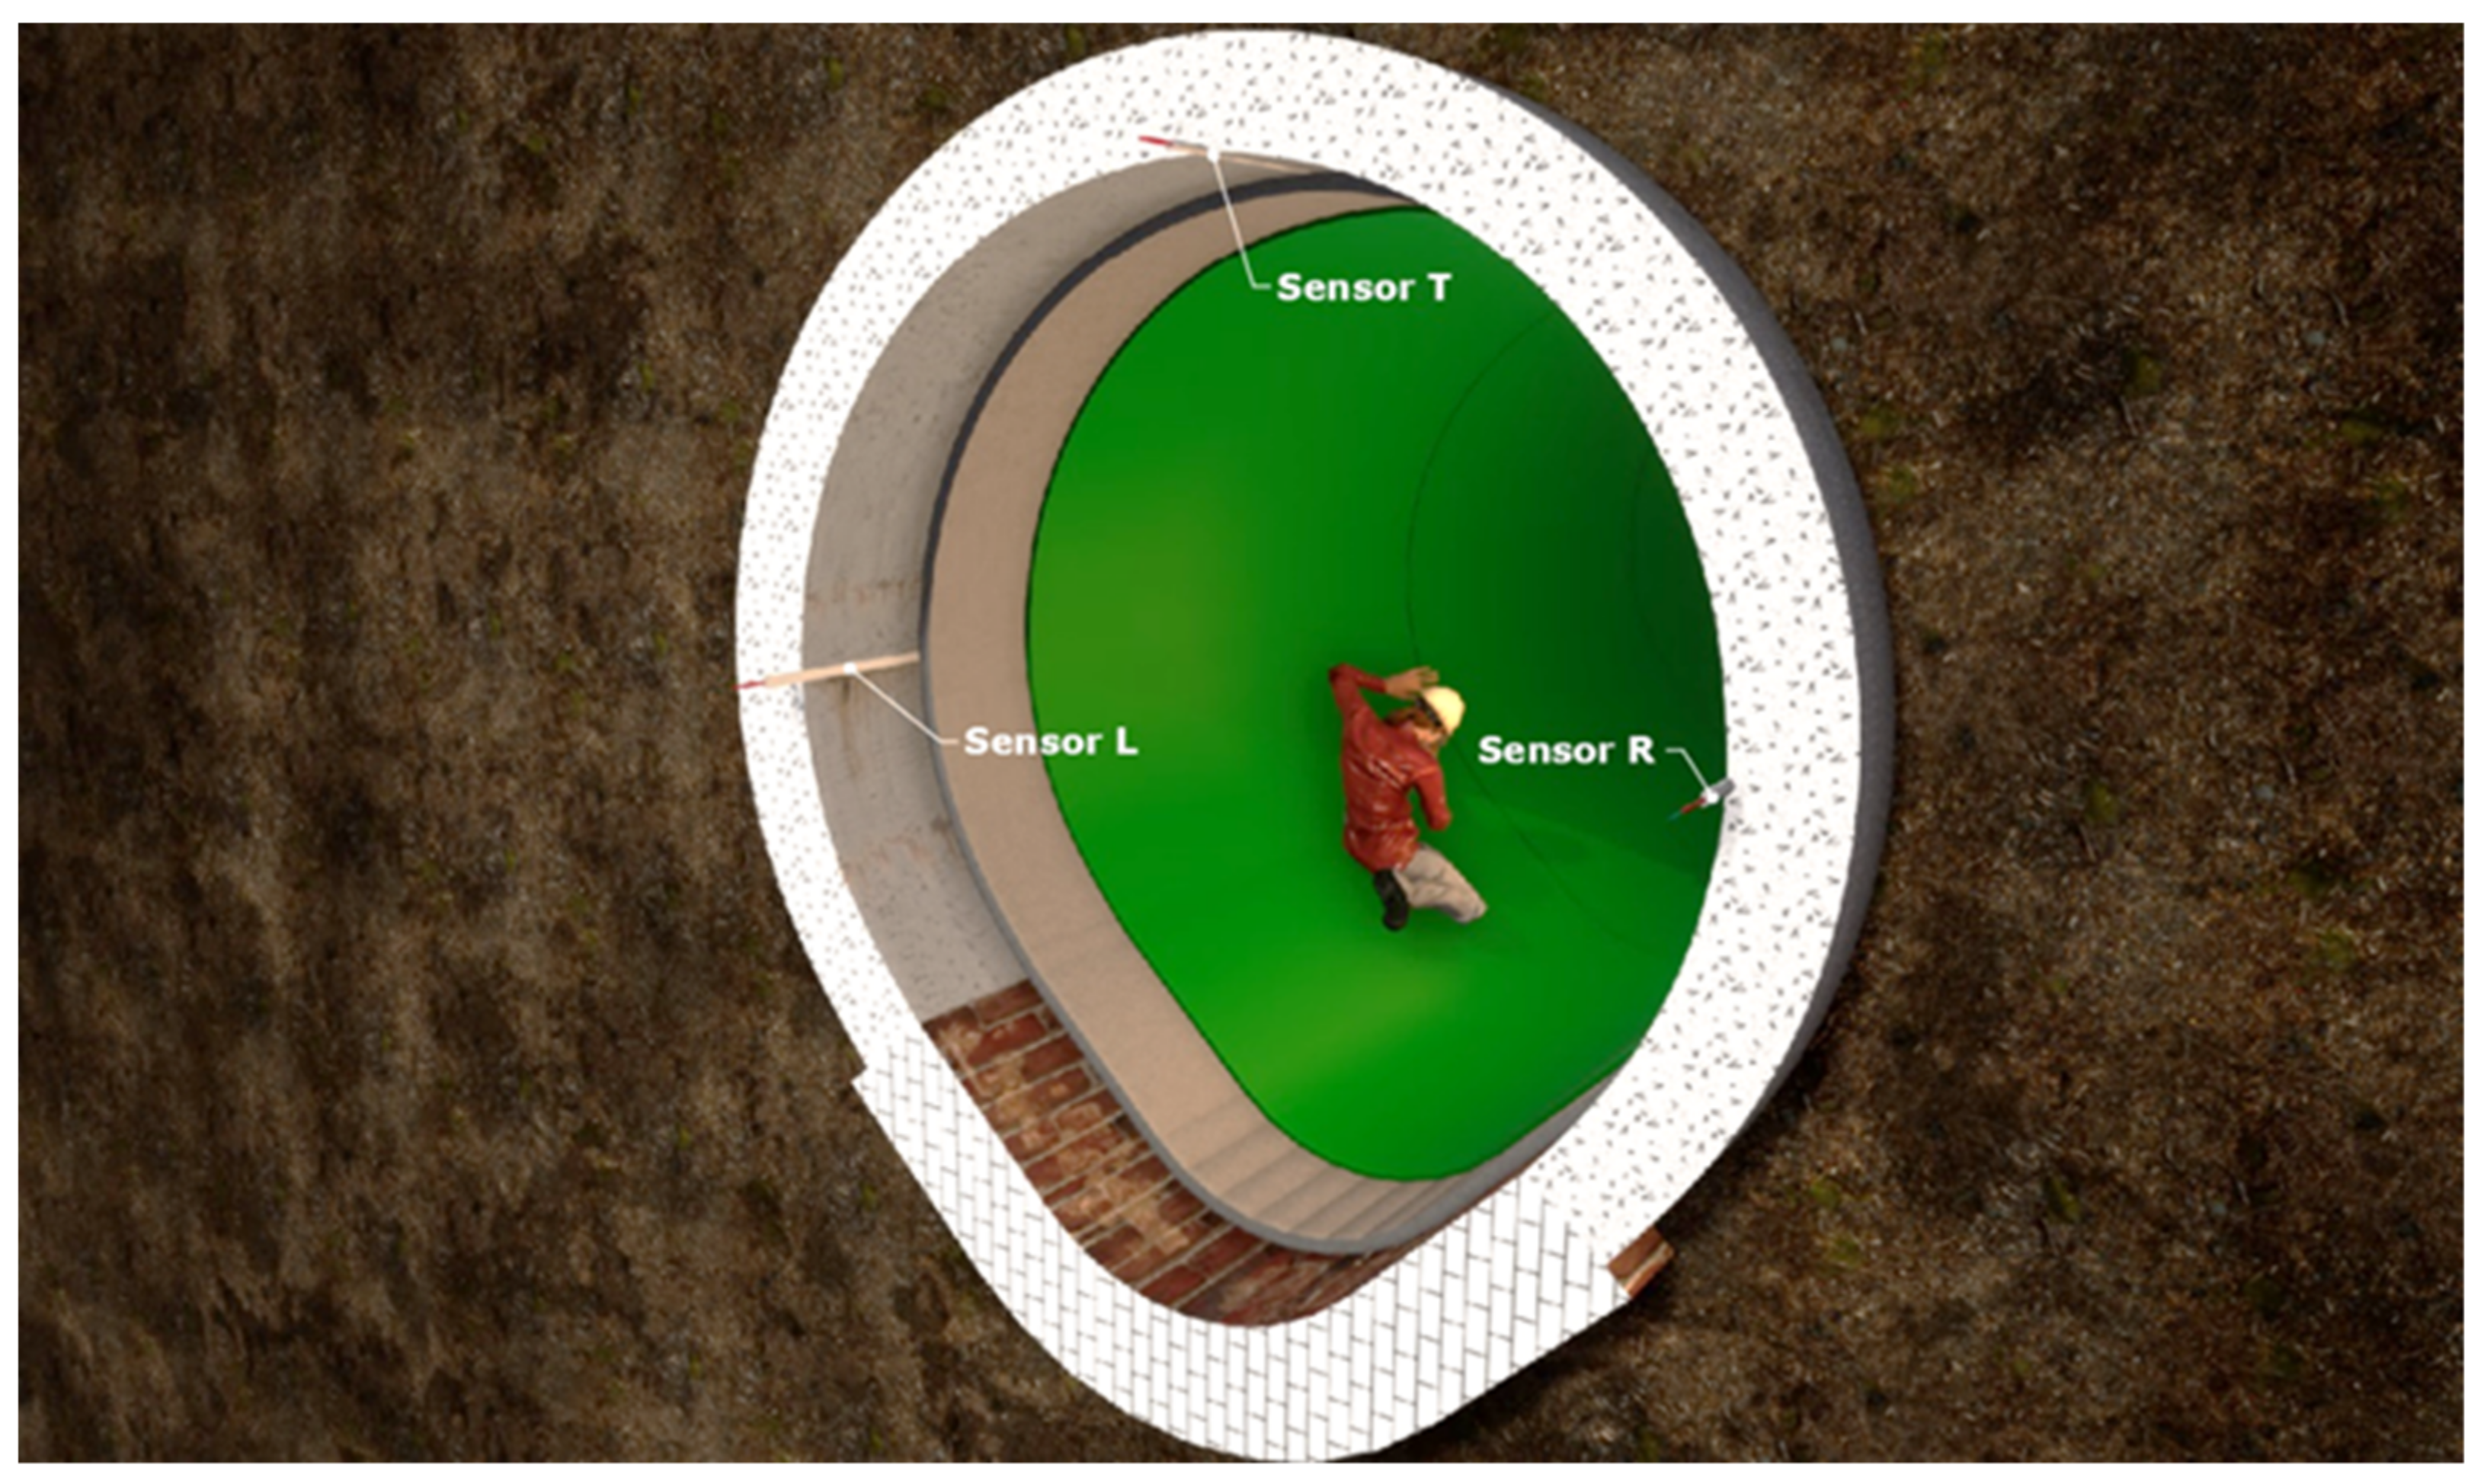
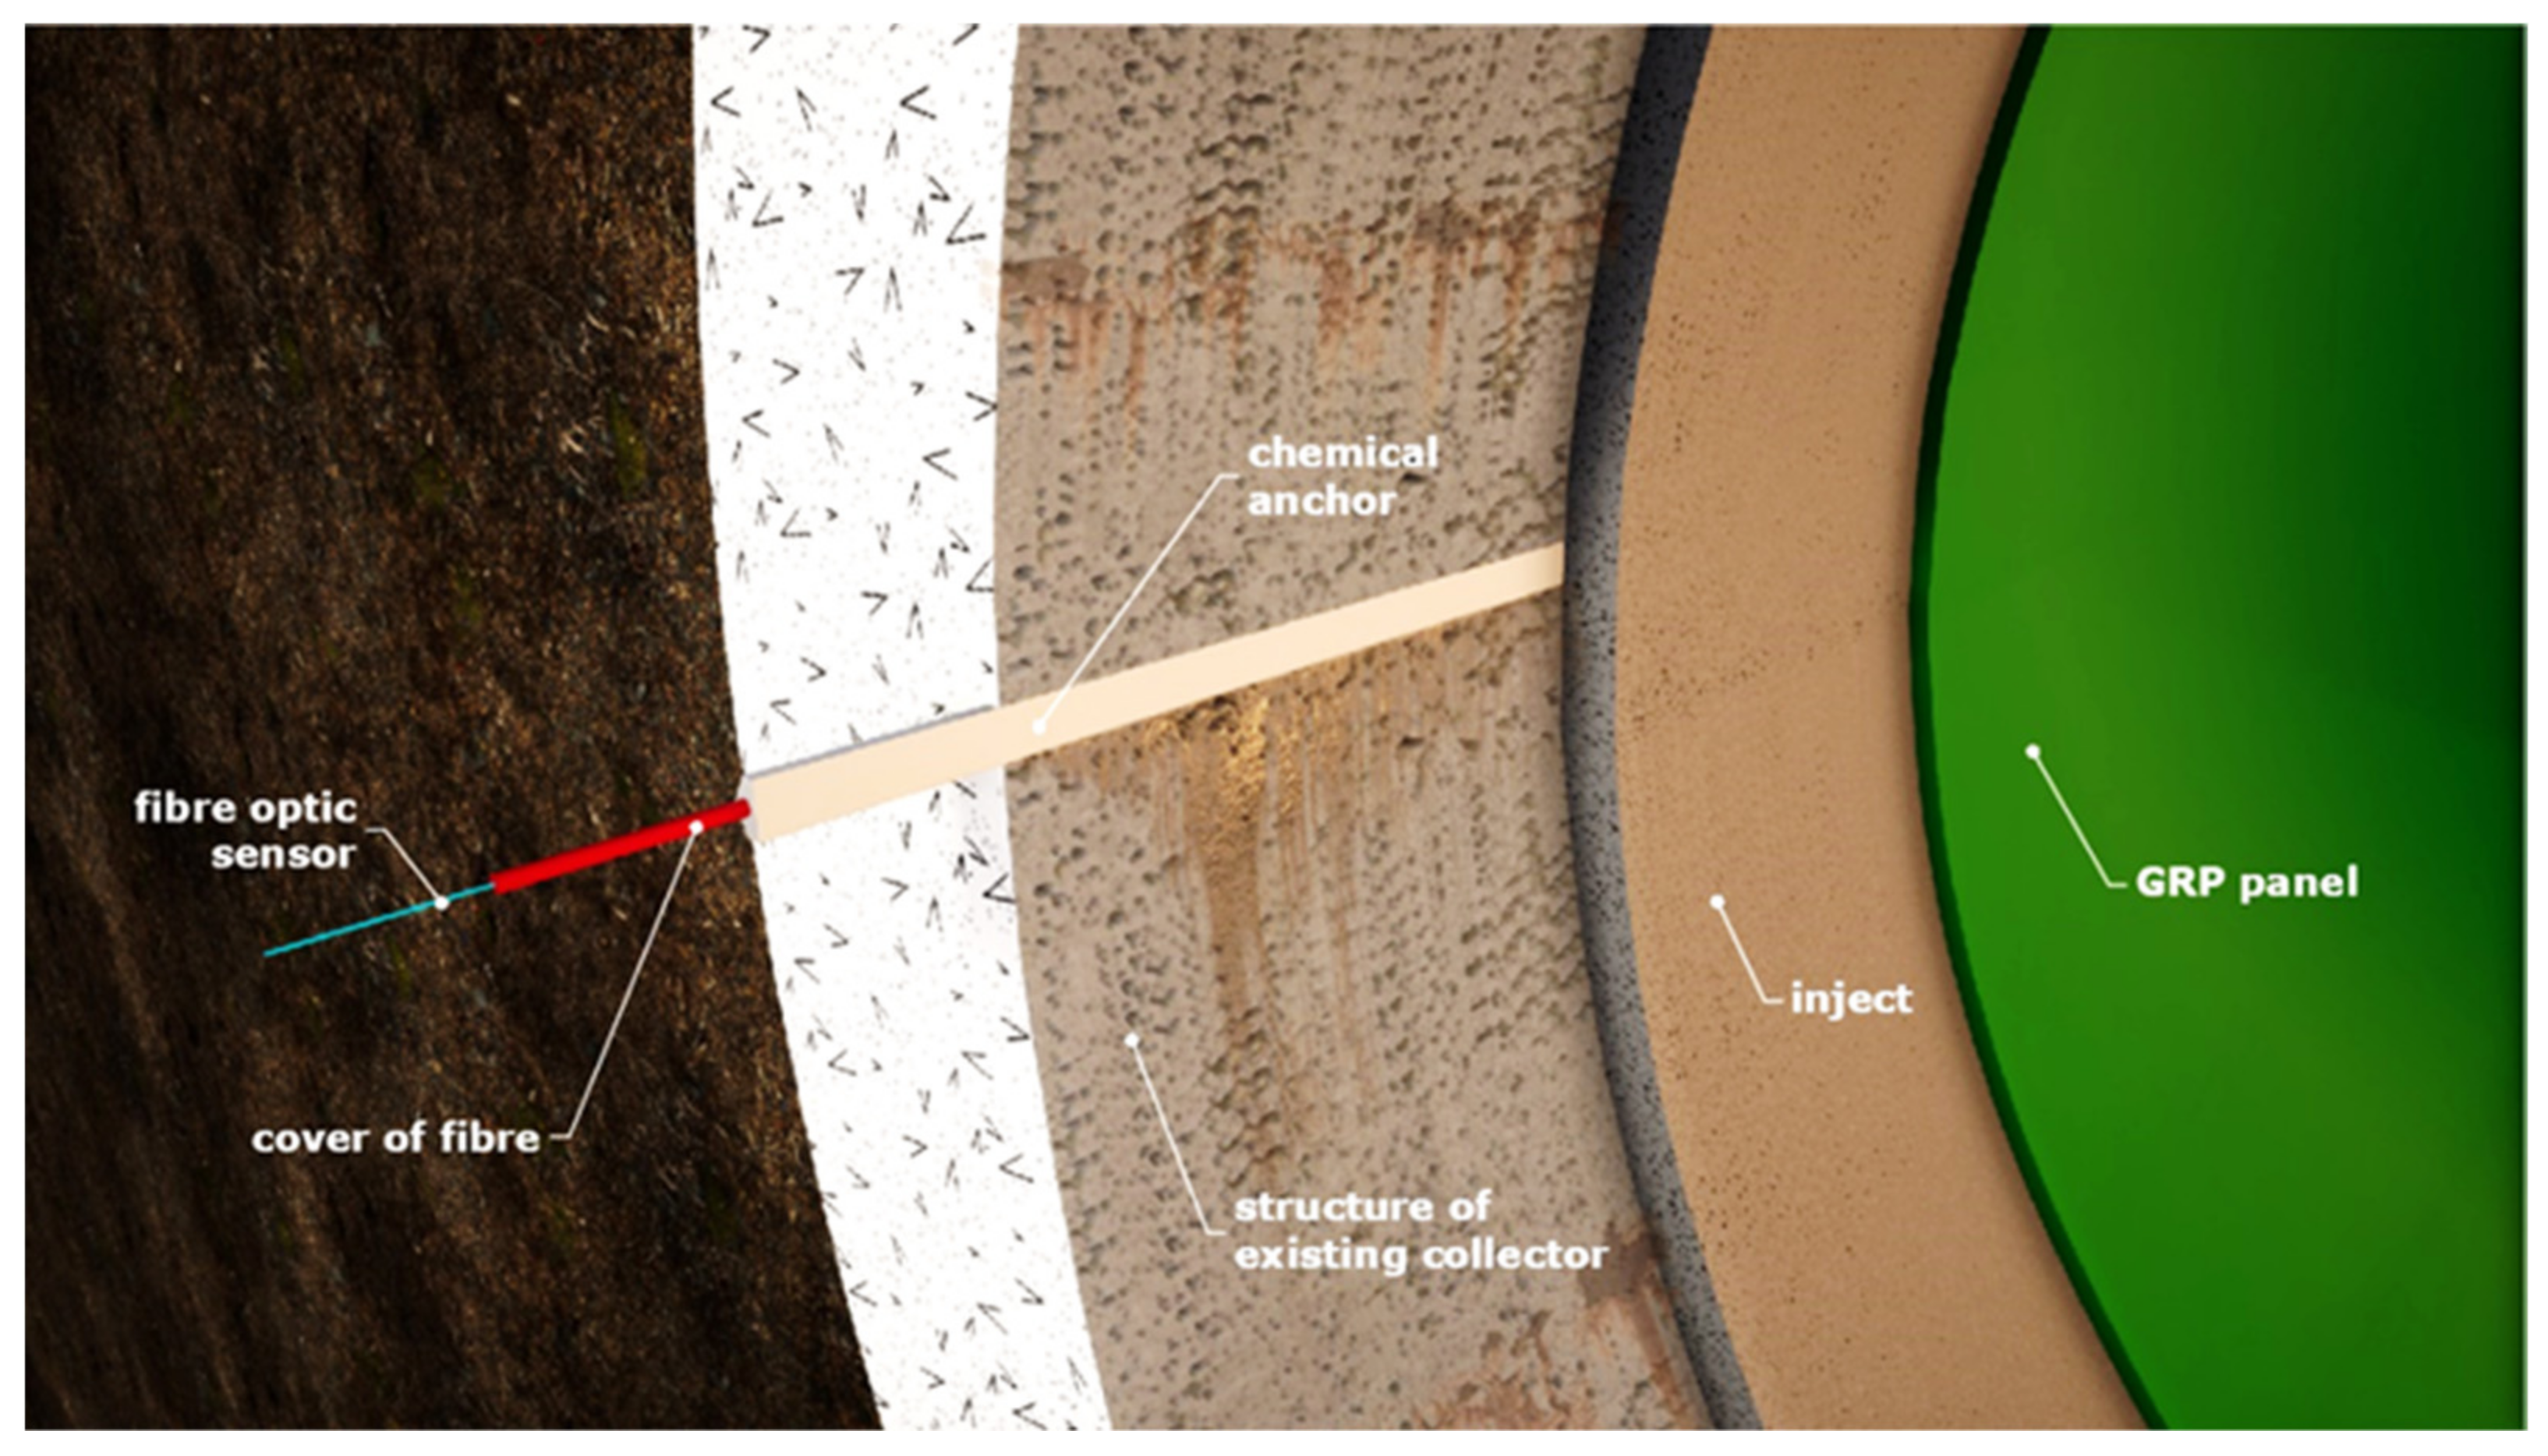
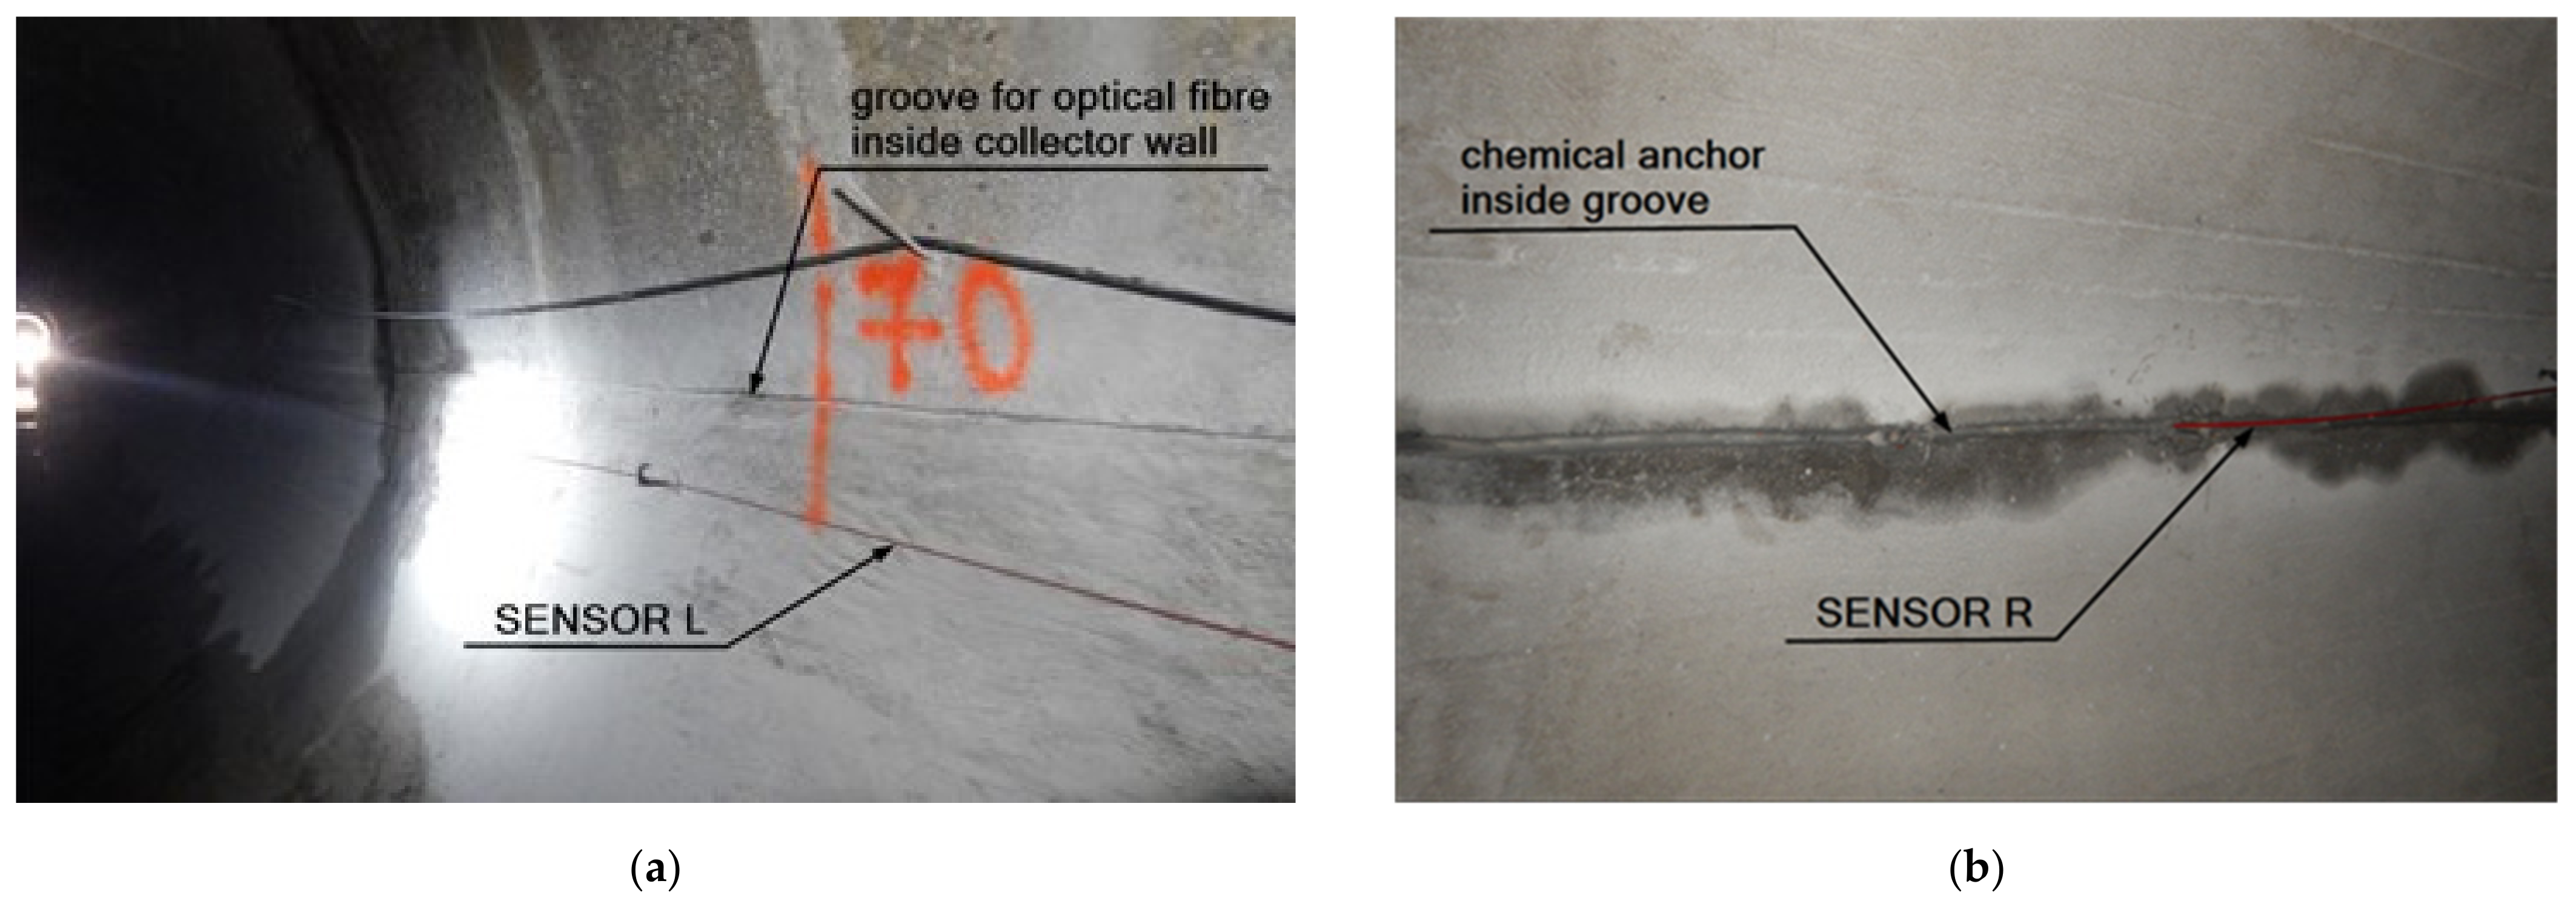
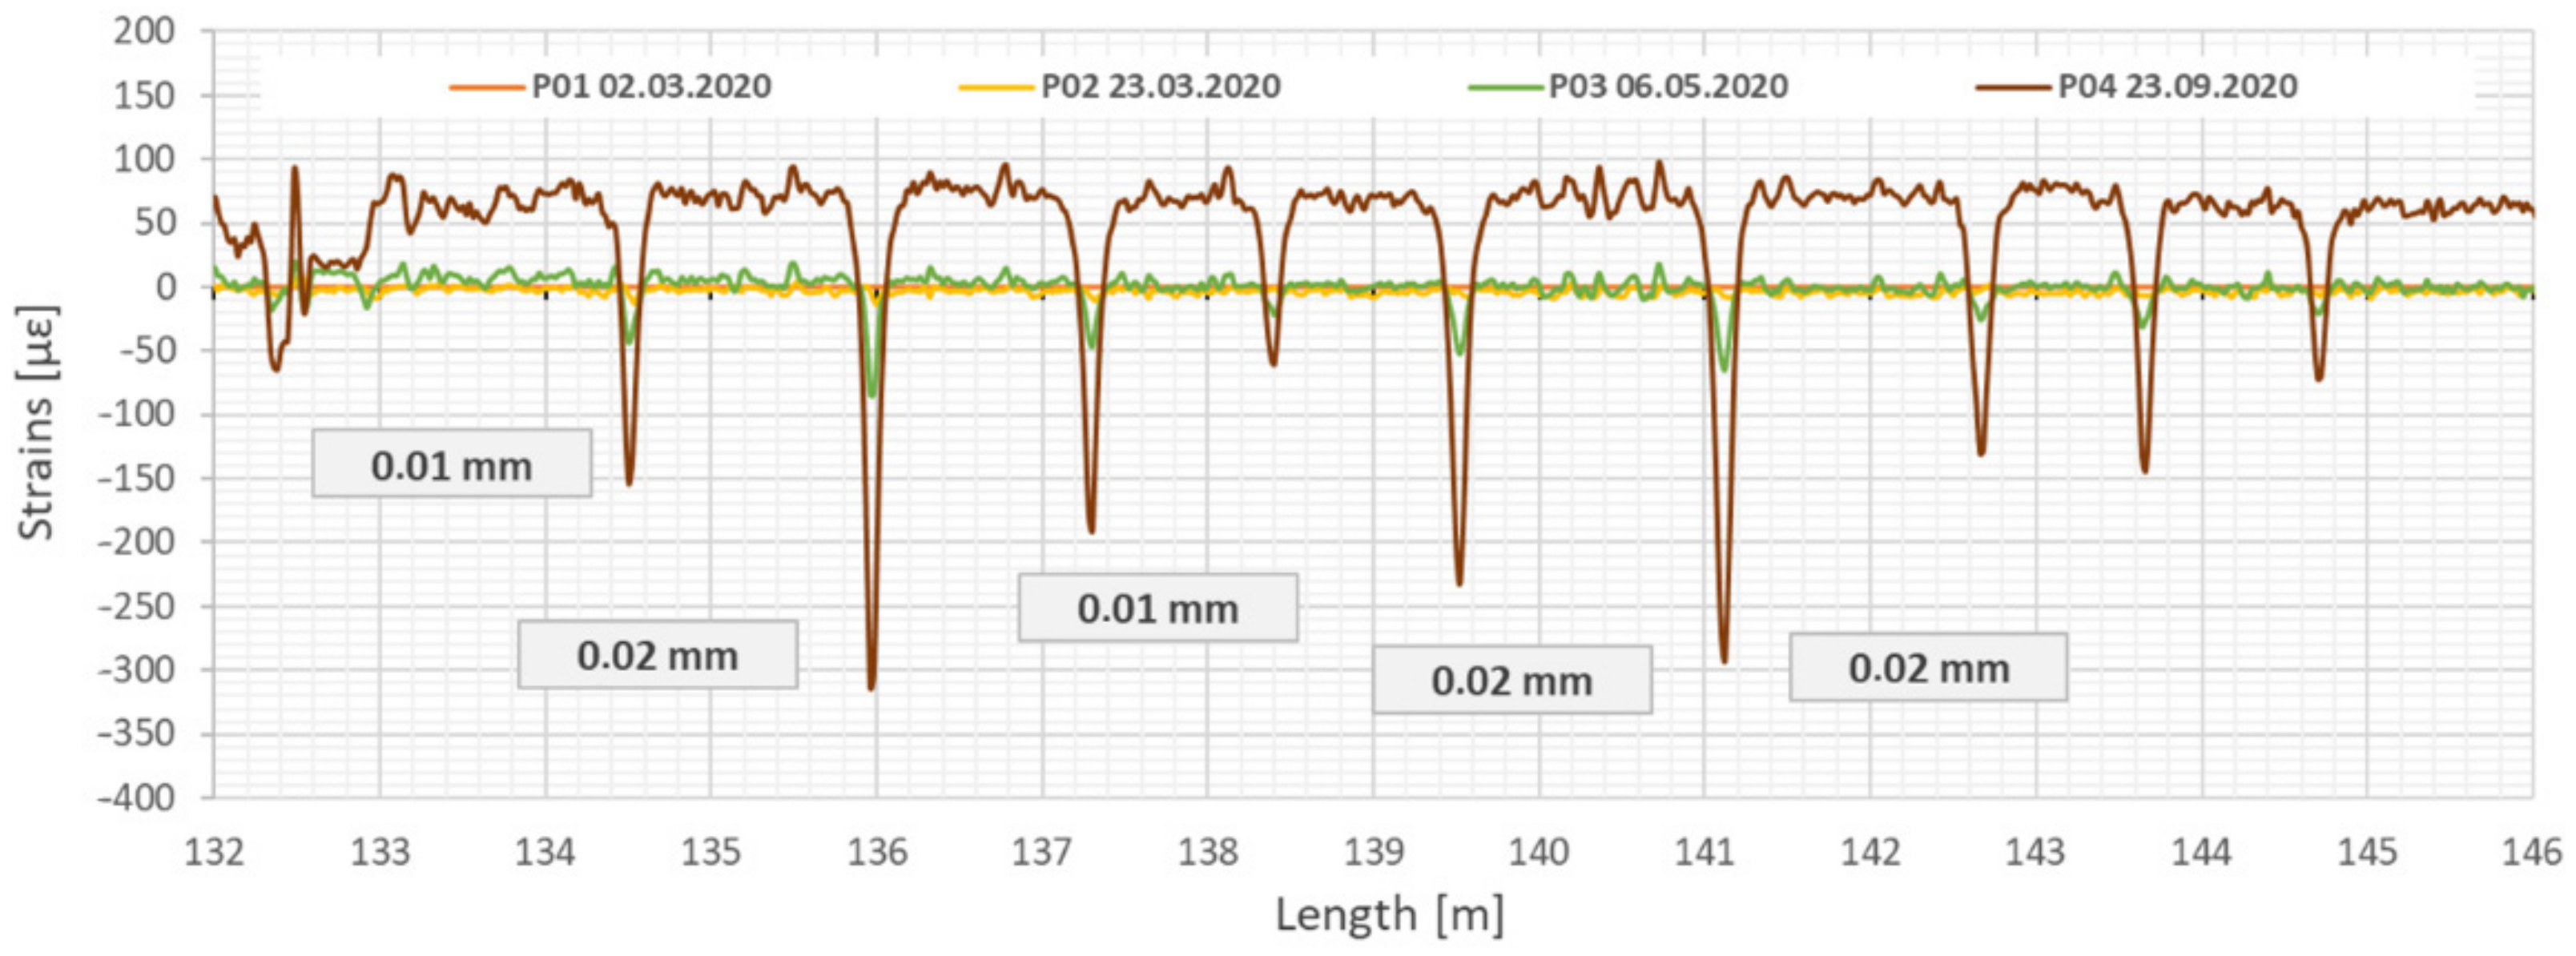
4.2.3. DFOS in the Burakowski Sewage Collector
- Assessment of the modernized collector structure’s technical condition;
- Tracking the development of cracks identified in the course of the technical condition inspection, covering the existing concrete casing of the collector;
- Maintaining the original collector structure during conducted renovation work, especially maintaining identified scratches and cracks, and the tracking of new ones occurring at key work stages, i.e., GRP panel placement inside the collector, diaphragm gap grouting process, grout setting process;
- Monitoring the cooperation between GRP panels and the concrete casing after completed renovation and during operation of the renovated section, e.g., under extreme operating conditions (complete filling).
5. Conclusions
Author Contributions
Funding
Institutional Review Board Statement
Informed Consent Statement
Data Availability Statement
Conflicts of Interest
References
- Popielski, P. Nowoczesne Techniki Monitoringu jako Narzędzie Oceny Stanu Technicznego Wielkośrednicowych Kolektorów Ściekowych. (Modern Monitoring Techniques as a Tool for Assessing the Technical Condition of Large-Diameter Sewage Collectors); Inżynieria Bezwykopowa, Wydawnictwo Inżynieria: Krakow, Poland, 2019; pp. 24–31. [Google Scholar]
- Dornstädter, J.; Huppert, F. Thermische Leckortung an Trogbaugruben mit Tiefliegenden Sohlen, Vorträge der Baugrundtagung 1998 in Stuttgart; Deutsche Gesellschaft für Geotechnik e.V: Essen, Germany, 1998; pp. 179–187. [Google Scholar]
- Breymann, H.; Freiseder, M.; Schweiger, H.F. Deep excavations in soli ground, in-situ measurements and numerical predictions. In Proceedings of the XIV International Conference on Soil Mechanics and Foundation Engineering, Hamburg, Germany, 6–12 September 1997. [Google Scholar]
- Simpson, B. I Inni: Design parameters for stiff clays. In Proceedings of the VII European Conference on Soil Mechanics and Foundation Engineering, Brighton, UK, 23 July 1979. [Google Scholar]
- Finno, R.J.; Cho, W. Recent stress-history effects on compressible Chicago glacial clays. J. Geotech. Geoenviron. Eng. 2011, 137, 197–207. [Google Scholar] [CrossRef]
- Kotlicki, W.; Wysokiński, L. Ochrona zabudowy w sąsiedztwie głębokich wykopów. In Protection of Buildings in the Vicinity of Deep Excavations; No. 376/2002; ITB Instruction: Warsaw, Poland, 2002. [Google Scholar]
- TSN 50-302-2004 Sankt-Peterburg—Proektirovanie fundamentov zdanii i sooruzhenii v Sankt-Peterburge. (Designing the Foundations of Buildings and Structures in St. Petersburg); OAO Izd. Stroiizdat SPb.: St. Petersburg, Russia, 2004.
- SP22.13330.2016. Osnovanija Zdanii i Sooruzhenii. (Soil Bases of Buildings and Structures). Aktualizirovannaya Redakcja SNiP 2.02.01-83*. Available online: http://sniprf.ru/ (accessed on 21 March 2022).
- Truty, A.; Obrzud, R. Komputerowa analiza współdziałania konstrukcji budowlanych z podłożem przy zastosowaniu zaawansowanych modeli konstytutywnych gruntów kalibrowanych na podstawie wyników badań laboratoryjnych i polowych. (Computer Analysis of Interaction between Structures under Construction and the Subsoil Using Advanced Models of Constitutive Soils, Calibrated Based on Laboratory and Field Test Results). In Proceedings of the 27th Polish Workshops for Structural Designers, Wisła, Poland, 5–8 March 2013; PZITB: Kraków, Poland, 2013. [Google Scholar]
- Cudny, M.; Truty, A. Refinement of the Hardening Soil model within the small strain range. Acta Geotech. 2020, 15, 2031–2051. [Google Scholar] [CrossRef] [Green Version]
- Popielski, P. Oddziaływanie Głębokich Posadowień na Otoczenie w Środowisku Zurbanizowanym. (Impact of Deep Foundation on the Surrounding in an Urbanized Environment); Warsaw University of Technology, Scientific Papers in Environmental Engineering no. 61; OWPW: Warsaw, Poland, 2012. [Google Scholar]
- Michalak, H. Kształtowanie Konstrukcyjno-Przestrzenne Garaży Podziemnych na Terenach Silnie Zurbanizowanych. (Structural and Spatial Shaping of Underground Garages within Highly Urbanized Areas); Bulleting No. 2; Oficyna Wydawnicza Politechniki Warszawskiej: Warsaw, Poland, 2006. [Google Scholar]
- Radzicki, K. Bezpieczeństwo Zapór—Nowe Wyzwania, Zastosowanie Termomonitoringu do Detekcji Przecieków oraz Erozji Wewnętrznej w Ziemnych Budowlach Piętrzących. (Safety of Dams—New Challenges. Application of Thermal Monitoring for Detecting Leaks and Internal Erosion in Earthen Damming Structures); Institute of Meteorology and Water Management (IMGW): Warsaw, Poland, 2011; pp. 23–239. [Google Scholar]
- ICOLD. Internal Erosion of Existing Dams, Levees and Dikes, and Their Foundation. In Internal Erosion Processes and Engineering Assessment; Bulletin No.164; Bridle, R., Fell, R., Eds.; International Commission on Large Dams: Paris, France, 2013; Volume 1, p. 151. [Google Scholar]
- Radzicki, K.; Siudy, A.; Stoliński, M. An innovative 3D system for thermal monitoring of seepage and erosion processes and an example of its use for upgrading the monitoring system at the Kozłowa Góra dam in Poland. In Proceedings of the 25th International Congress on Large Dams, Stavanger, Norway, 15–19 June 2015; pp. 85–101. [Google Scholar]
- Radzicki, K.; Bonelli, S. Monitoring of the suffusion process development using thermal analysis performed with IRFTA model. In Proceedings of the 6th International Conference on Scour and Erosion, Paris, France, 27–31 August 2012; pp. 593–600. [Google Scholar]
- Radzicki, K.; Rybiański, Ł.; Popielski, P. Method of thermal detection of leakages in construction of deep excavation: A real case study in Poland. In Proceedings of the MATEC Web of Conferences, 29th International Conference on Structural Failures, Miedzyzdroje, Poland, 20–24 May 2019; Volume 284, pp. 1–8. [Google Scholar] [CrossRef]
- Popielski, P.; Radzicki, K.; Dornstädter, J. Badania szczelności obudowy głębokiego wykopu metodą termomonitoringu. (Tests for Leakage of Deep Excavation Using Thermomonitoring Method). Acta Sci. Pol. Archit. 2016, 15, 127–138. [Google Scholar]
- Popielski, P.; Siemińska-Lewandowska, A. Zakres i dobór parametrów podłoża do opracowania modeli numerycznych głęboko posadowionych obiektów budowlanych—Doświadczenia i wnioski. Acta Sci. Pol. Archit. 2016, 15, 31–42. [Google Scholar]
- Popielski, P.; Radzicki, K.; Kasprzak, A. Analiza zjawisk związanych z niekontrolowanym dopływem wody do głębokiego wykopu z przedstawieniem możliwości oceny szczelności jego obudowy. (Analysis of the phenomena related to uncontrolled water inflows into a deep excavation, presenting the possibility of assessing the tightness of embedded retaining walls). In Naprawy i Wzmocnienia Konstrukcji Budowlanych: Geotechnika; Polski Związek Inżynierów i Techników Budownictwa, Oddział Małopolski w Krakowie: Warszawa, Poland, 2017; Volume 2, pp. 151–170. [Google Scholar]
- Radzicki, K.; Bonelli, S. A possibility to ident ify piping erosion in earth hydraulic works using thermal monitoring. In Proceedings of the 8th ICOLD European Club Symposium, Insbruck, Austria, 22–23 September 2010; pp. 618–623. [Google Scholar]
- Van Beynen, P.; Townsend, K. A disturbance index for karst environments. Environ. Manag. 2005, 36, 101–116. [Google Scholar] [CrossRef] [PubMed]
- Radzicki, K. Analyse Retard des Mesures de Températures Dans les Digues Avec Application À la Détection de Fuites. Ph.D. Thesis, AgroParisTech, Paris, France, 2009. [Google Scholar]
- Siemińska-Lewandowska, A. Głębokie Wykopy Projektowanie i Wykonawstwo (Deep Foundations—Engineering and Execution); Wydawnictwa Komunikacji i Łączności WKŁ: Warsaw, Poland, 2010. [Google Scholar]
- Nazarewicz, M.; Popielski, P. Analiza oddziaływania czasowego odwodnienia w trakcie realizacji głębokich wykopów fundamentowych na budynki sąsiednie. (Analysis of temporary drainage impact on neighbouring buildings in the course of deep foundation excavation execution). Czasopismo Techniczne Środowisko 2010, 107, 14. [Google Scholar]
- Popielski, P. Model Sufozji Mechanicznej W Ujęciu Metody Elementów Skończonych Mechanical Suffosion Model in Terms of the Finite Element Method. Ph.D. Thesis, Faculty of Environmental Engineering, Warsaw, Poland, 2000. [Google Scholar]
- Popielski, P.; Dąbska, A. Numerical model of suffusion, w: Izvestia Vsesouznogo Naucno-Issledovatel’skogo Instituta Gidrotehniki Imenii BE Vedeneeva. Energia 2014, 271, 23–33. [Google Scholar]
- Clough, G.W. Construction induced movements of in situ walls. In Proceedings of the Design and Performance of Earth Retaining Structures, New York, NY, USA, 18–21 June 1990; pp. 439–470. [Google Scholar]
- Kłosiński, B. Sprawdzanie stateczności dna głębokich wykopów Verification of deep excavation bed stability. Geoinżynieria Drogi Mosty Tunele 2014, 46, 38–44. [Google Scholar]
- Budowa-Metra-Niedopilnowana—Kto-Odpowiada-Za-Awarie.Html. Available online: http://warszawa.wyborcza.pl/warszawa/1,34889,12626718 (accessed on 1 May 2016).
- Budzianowska, A.; Popielski, P. Ustalenie kierunku filtracji metodą termomonitoringu aktywnego–badania na modelu fizycznym. (Determination of seepage direction using active thermal monitoring—Test on a physical model). In Bezpieczeństwo Budowli Hydrotechnicznych (Safety of Hydrotechnical Structures); Winter, J., Wita, A., Popielski, P., Sieinski, E., Eds.; Instytut Meteorologii i Gospodarki Wodnej Państwowy Instytut Badawczy: Warszawa, Poland, 2021; pp. 97–107. [Google Scholar]
- Mckenzie, I.; Karafolas, N. Fiber optic sensing in space structures: The experience of the European Space Agency. In Proceedings of the 17th International Conference on Optical Fibre Sensors, SPIE 5855, Bruges, Belgium, 23–27 May 2005. [Google Scholar]
- Beard, S.J.; Kumar, A. Practical Issues in Real-World Implementation of Structural Health Monitoring Systems. In Smart Structures and Materials 2005: Industrial and Commercial Applications of Smart Structures Technologies; International Society for Optics and Photonics: Bellingham, WA, USA, 2005. [Google Scholar]
- Ma, Z.; Chen, X. Fiber Bragg Gratings Sensors for Aircraft Wing Shape Measurement: Recent Applications and Technical Analysis. Sensors 2018, 19, 55. [Google Scholar] [CrossRef] [Green Version]
- Sieńko, R.; Bednarski, Ł.; Howiacki, T. Zastosowanie czujników światłowodowych do monitorowania stanu technicznego obiektów hydrotechnicznych. (Application of optical fibre sensors for structural health monitoring of hydrotechnical structures). In Budowle Piętrzące—Eksploatacja i Monitoring. (Damming Structures—Operation and Monitoring); Instytut Meteorologii i Gospodarki Wodnej, Państwowy Instytut Badawczy: Warszawa, Poland, 2017; pp. 139–154. ISBN 978-83-64979-23-1. [Google Scholar]
- Tanimola, F.; Hill, D. Distributed fibre optic sensors for pipeline protection. J. Nat. Gas Sci. Eng. 2019, 1, 134–143. [Google Scholar] [CrossRef]
- Lebon, G. Fiber Optic Monitoring of Concrete Sewer Near Tunnel Civil Works Grand Paris Express project. In Proceedings of the International Course on Geotechnical and Structural Monitoring, Rome, Italy, 30–31 May 2019. [Google Scholar]
- Bednarz, B.; Popielski, P.; Sieńko, R.; Howiacki, T.; Bednarski, Ł. Distributed Fibre Optic Sensing (DFOS) for Deformation Assessment of Composite Collectors and Pipelines. Sensors 2021, 21, 5904. [Google Scholar] [CrossRef]
- Popielski, P.; Bednarz, B.; Sieńko, R.; Howiacki, T.; Bednarski, Ł.; Zaborski, B. Monitoring of Large Diameter Sewage Collector Strengthened with Glass-Fiber Reinforced Plastic (GRP) Panels by Means of Distributed Fiber Optic Sensors (DFOS). Sensors 2021, 21, 6607. [Google Scholar] [CrossRef]


| Criterion | Source | Range | Additional Remarks |
|---|---|---|---|
| 1 | [3] | 1.5 ÷ 2 Hw | non-cohesive soils: fine and medium sands, gravels |
| 2 | [4] | 2 ÷ 2.5 Hw | London clays and glacial clays |
| 2 ÷ 3 Hw (max. 5 Hw) | stiff cohesive soils | ||
| 3 | [5] | 2 ÷ 4 Hw | London clays and glacial clays |
| 4 | [6] | 2.0 Hw | in sands |
| 2.5 Hw | in clays | ||
| 3.5 Hw | in silts | ||
| 100 m | no subsoil data | ||
| 5 | Russian standard [7] | 30 m | at preliminary analysis |
| 6 | Russian standard [SP22.13330.2016] at preliminary analysis [8] | 5 Hw | with the anchored excavation protection structure, but no more than 2 Lk, where Lk is the anchor length (free and fixed length) |
| 4 Hw | with the sheet pile wall that acts as a cantilever or propped (with steel struts), as well as in the case of an open-pit excavation | ||
| 3 Hw | with the diaphragm wall or pile wall technology, acting as a cantilever or propped (with steel struts) | ||
| 2 Hw | with the diaphragm wall or pile wall technology structure, and using the top-down excavation method |
Publisher’s Note: MDPI stays neutral with regard to jurisdictional claims in published maps and institutional affiliations. |
© 2022 by the authors. Licensee MDPI, Basel, Switzerland. This article is an open access article distributed under the terms and conditions of the Creative Commons Attribution (CC BY) license (https://creativecommons.org/licenses/by/4.0/).
Share and Cite
Popielski, P.; Kasprzak, A.; Bednarz, B. Using Thermal Monitoring and Fibre Optic Measurements to Verify Numerical Models, Soil Parameters and to Determine the Impact of the Implemented Investment on Neighbouring Structures. Sustainability 2022, 14, 4050. https://0-doi-org.brum.beds.ac.uk/10.3390/su14074050
Popielski P, Kasprzak A, Bednarz B. Using Thermal Monitoring and Fibre Optic Measurements to Verify Numerical Models, Soil Parameters and to Determine the Impact of the Implemented Investment on Neighbouring Structures. Sustainability. 2022; 14(7):4050. https://0-doi-org.brum.beds.ac.uk/10.3390/su14074050
Chicago/Turabian StylePopielski, Paweł, Adam Kasprzak, and Bartosz Bednarz. 2022. "Using Thermal Monitoring and Fibre Optic Measurements to Verify Numerical Models, Soil Parameters and to Determine the Impact of the Implemented Investment on Neighbouring Structures" Sustainability 14, no. 7: 4050. https://0-doi-org.brum.beds.ac.uk/10.3390/su14074050