Article

Benchmarking City Layouts—A Methodological Approach and an Accessibility Comparison between a Real City and the Garden City

by
João Monteiro
1,
Nuno Sousa
2,3,
Eduardo Natividade-Jesus
2,4 and
João Coutinho-Rodrigues
2,5,*
1
Research Centre for Territory, Transports and Environment (CITTA), 4200-465 Porto, Portugal
2
Institute for Systems Engineering and Computers of Coimbra (INESCC), 3030-290 Coimbra, Portugal
3
Department of Sciences and Technology, Open University, 1269-001 Lisbon, Portugal
4
Department of Civil Engineering, Coimbra Polytechnic—ISEC, 3030-199 Coimbra, Portugal
5
Department of Civil Engineering, University of Coimbra, 3030-790 Coimbra, Portugal
*
Author to whom correspondence should be addressed.
Sustainability 2022, 14(9), 5029; https://0-doi-org.brum.beds.ac.uk/10.3390/su14095029
Submission received: 13 March 2022 / Revised: 7 April 2022 / Accepted: 17 April 2022 / Published: 22 April 2022
(This article belongs to the Special Issue Spatial Planning and Analysis in Urban Sustainability)

Abstract

:
This article presents a comparative accessibility study between a real city and its redraft as a Garden City. The benchmarking methodology involves defining and evaluating a location-based accessibility indicator in a GIS environment for the city of Coimbra, Portugal, and for the same city laid out as a Garden City, with the same number of inhabitants, jobs, and similar number of urban facilities. The results are derived as maps and weighted average distances per inhabitant to the facilities and jobs, and show that, for the Garden City, average distances drop to around 500 m for urban facilities and 1500 m for the combination of facilities and jobs, making much of the city accessible by walking and practically the whole of it accessible by cycling, with positive impact on transport sustainability and accessibility equity. The methodology can be extended to other benchmarking indicators and city layouts, and the quantitative results it yields make a valuable contribution to the debate on the ideal layout of cities. Moreover, it gives directions on how to improve real cities to address current and future sustainability concerns.

1. Introduction

Cities are the main engines driving our economies, with over half the world’s population living in urban areas [1]. Cities attract people by offering job opportunities, better education, healthcare, and living standards in general [2]. Due to their enormous complexity and importance in the modern society, modelling cities to achieve reliable quantitative predictions, contemplating their evolution and behaviour, and assessing and improving their sustainability, has become a major challenge for the modern world [3,4].
The ideal spatial layout of cities has been an active theme of debate for scholars, organizations concerned about the evolution and sustainability of urban areas, and municipal entities aiming to improve the conditions of living of their citizens [5,6]. The past century has been prolific in such debates, with city models being proposed and studied, such as the Garden City, the Radiant City, the Linear City, and the Transit-Oriented Development or Polycentric Cities [7]. Theoretical debates, however, lacked adequate quantitative analysis tools that could point out objective advantages of the different urban design ideas and provide comparisons, either between the models or between those models and real cities.
Current computer capabilities opened the possibility of putting theories and city models to the test. The bulky quantitative analyses needed to benchmark the various models are now possible using geographic information systems (GIS). Because urban layout, or form, is arguably the most strategic aspect of a city, with deep, lasting impacts at many levels, the capacity to obtain, from those layouts, quantitative figures on relevant indicators is an ability which provides meaningful evidence and guidance on how to plan and develop the city. It also paves the way for further analyses which rely on knowing those quantitative figures. This research makes use of the GIS capabilities of today, proposes a methodology to derive such figures using solely geographic characteristics of the spatial layout of the urban areas, and demonstrates it in a case study. It constitutes a first step towards a comprehensive comparative analysis between real and ideal cities based on the hypothesis that such analyses can provide a better understanding of the advantages of planned urbanism and transpose some of the learnings to practical contexts.

2. Review of Research

Literature discussions on classic and contemporary city models have mostly focused on just one layout, addressing its virtues and shortcomings [8,9,10,11]. Some of these debates included quantitative measures, usually the evaluation of the impact of a particular idea, without implying major changes in the city structure [12,13,14].
Comparative studies between different city layouts were performed almost exclusively in a qualitative way. Classic debates include [15,16,17], whose impact in spatial planning influenced urban planning trends. The comparison made by Frey [16] stands out, concerning the potential performance of six city models: Core City, Star City, Satellite City, Galaxy of settlements (nowadays Transit-Oriented Development), Linear City, and Polycentric Net. The evaluation and comparison were made in terms of sustainability indicators and involved several assumptions. The results show that all models scored similarly, which can be justified by the inaccuracy and assumptions made during the process, as Frey himself recognizes.
Comparative analyses based on quantitative evidence are very scarce. In fact, only one such example was found in the literature, namely Yuan et al. [18], who compared accessibility to green areas between a real city, Zhujiajiao, China, and an urban design based on the Garden City, having found that the Garden City model had better overall accessibility to those areas.
This article expands on previous research by combining quantitative aspects of the urban layout with comparative analyses between multiple layouts, providing new, quantitative arguments to the debate on the ideal city form. To do so, a methodology is proposed, based on the idea of considering the geographic elements of a real city, redisposing them in the layout of a classic or contemporary city model, and using GIS to evaluate benchmarking indicators for the different layouts. The approach contributes to the literature on city-model benchmarking by providing a means to carry out comprehensive comparative analyses between real and ideal cities based on quantitative indicators, which depend solely on the urban spatial layout. Taking accessibility as an indicator, the methodology is applied to the real city of Coimbra, Portugal, and its redraft as a classic city model, the Garden City. This case study shows that quantitative benchmarking of city models is a promising idea, which can open new avenues of research and contribute to the long-standing debate of the ideal layout of cities and its sustainability and planning implications.

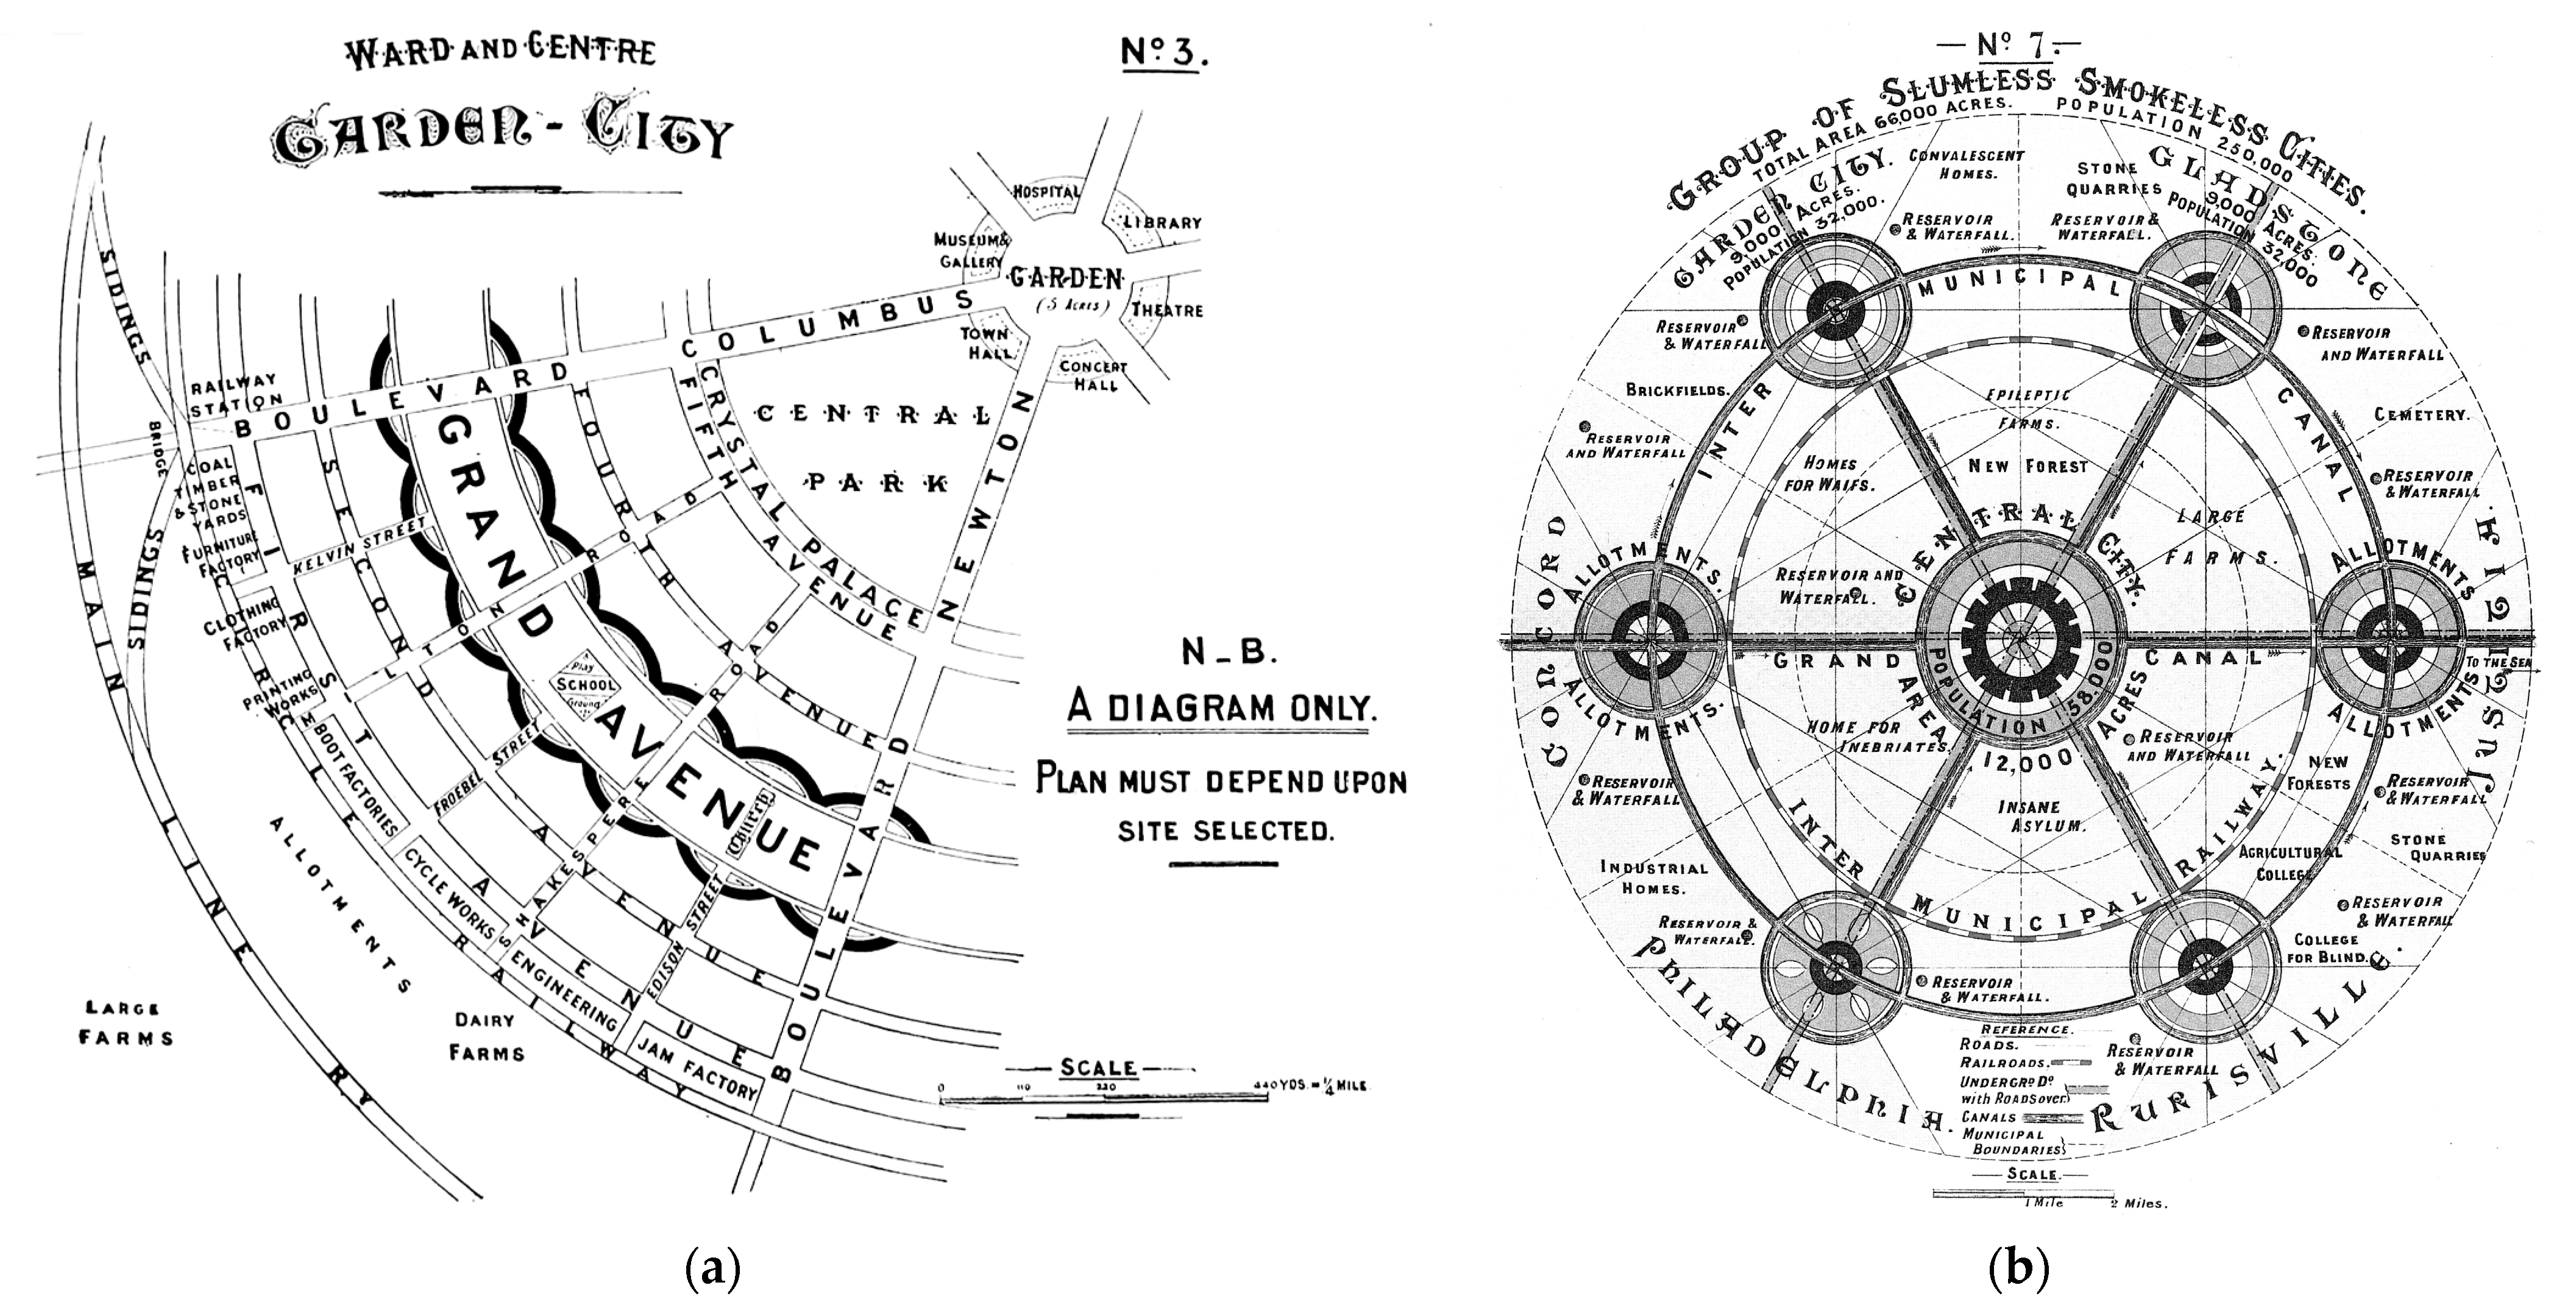
Overview of Real Cities and the Garden City

Real cities evolved and grew based on different ideas and models, incorporating many influences along the years, and leading to organizing layouts that reflect these multiple trends and interests [19,20,21]. A few decades ago, priority was put on big avenues to sustain motorized transport, whereas nowadays those same avenues are receiving bigger sidewalks and cycleways at the cost of traffic lane space, aiming to promote sustainable and active mobility. The city of Coimbra is one such case of long-term evolution, accumulating changes over one millennium, with an urban design influenced by different trends and urbanistic pressures [22].
The Garden City was proposed by Ebenezer Howard over a century ago [23] as a city concept that would combine the attractions of city life, affordable housing, and a pleasant environment. Kremer et al. [24] considered it one of the origin theories of urban sustainability, and it remains inspiring in many aspects [25]. The Garden City was chosen for demonstrating this research because it is one of the most debated city models in academia and frequently used as a paradigm in sustainable urban and spatial planning [7]. It is presented as a theoretical example of an alternative urban layout. No claim is made on it being a goal of urban expansion or a natural endpoint of it.
The Garden City would hold around 30,000 inhabitants in its hallmark circular shape. Ringlike concentric zones of specific land use alternate between urban facilities, residential areas, roads, green spaces, and an exterior railway. Radial boulevards connect the outskirts to the center and divide the city in six wards (Figure 1a). In Howard’s vision, city expansion would be accommodated by establishing new garden cities with connections such as those in Figure 1b, forming a cluster of “Social Cities”, a polycentric city layout. Enlarged versions of Figure 1 can be found in the supplementary materials (Figure S1).
The Garden City remains an active topic of research in urban planning and cities have been built based on this model, such as Letchworth and Welwyn (UK) or Almere (Netherlands) [26]. Modern adaptations were used in city expansions of La Coruña (Spain) and Brøndbyvester (Denmark). Some features of the Garden City, e.g., the abundance of green areas, were adopted in the contemporary concepts of Eco-Cities [7] or Smart Cities [27]. Despite this, Yuan et al. [18] point out that Howard’s theory has only been considered qualitatively, and Morris et al. [28] recognized that few studies have been devoted to confirming the validity of the concept, making it important to revisit the model, especially considering today’s sustainability concerns.

3. Methodological Approach

The main idea of the methodology is as follows: consider the geographical location of the building blocks of a city (buildings, road network, etc.) and evaluate how well they serve the population using a quantitative benchmarking indicator (or several). Then, in a GIS, geographically redistribute those building blocks so that the city assumes the form dictated by the urban layout(s) one wants to compare with one another. The redistribution should be conducted maintaining the same number of inhabitants and a similar number of urban facilities. Finally, recalculate the benchmarking indicator(s) for the different urban layouts under comparison. The layouts can then be compared using the values obtained for the indicators.

3.1. Benchmarking Indicator

In the case study’s Section 4, accessibility was taken as the benchmarking indicator. Other indicators could be used as well, provided they can be calculated on a GIS. This point is essential, as even small cities have very high amounts of geographic data associated with them. The choice of accessibility to demonstrate the methodology was made because it is a very important concept in transport and urban planning [29,30] and recognized as a path in achieving sustainable development [31]. Other benchmarking indicators will be researched in the near future (see Section 6.2).
Accessibility is a wide concept related to urban spatial layout, qualities of the transport and land-use systems, and economic and environmental goals [32], which can be interpreted and calculated via different approaches. This research uses the classic definition of accessibility as the ease, or more widely, the cost of reaching destinations [33]. Cost-based approaches to accessibility use time or distance measures and are frequent in the field of spatial and transport planning, as acknowledged by several authors [34,35,36,37,38]. Specific examples are: Apparicio et al. [39], who used a range of accessibility measures (including cost based) to compare discrepancies in accessibility to healthcare services; Gutiérrez and Urbano [40], where a weight-averaged impedance, i.e., generalized cost of going from origin to destination, usually time or distance, was used to evaluate the impact of the trans-European road network; Ryan and Pereira [41], on which travel time was employed as impedance to estimate accessibility to grocery stores and healthcare centres; and Shen et al. [42] and Zhou et al. [43], which used direct home–facility network distance as accessibility measure. The measure of accessibility used here is based on origin–destination (OD) network distances and was chosen because of its flexibility and ease of interpretation, an important point because for planning purposes accessibility measures must be understandable to policy makers [44]. Other measures or formulations of accessibility could be used as well, without any loss of generality, provided their evaluation in a GIS is feasible. In Vale and Pereira [45], a review on other measures was carried out focusing on exponential, power-law, Gaussian, and cumulative Gaussian probability decay functions, which have impedance as argument. Accessibility was then evaluated as trip probability times the number of opportunities at the destination zone.
The accessibility indicator selected was inspired by the above references and is akin to that used in [46]. It is given by:
A i = j k w j L k ( j ) d i j k j w j k L k ( j )
where
A i : accessibility score of origin i.
i : 1 , , I number of origins.
j : 1 , , J number of types of destinations.
k : 1 , , K number of closest destinations of each type, in this article K = 3 .
d i j k : network distance from origin i to the kth closest destination of type j.
w j : attractiveness weight of destination of type j.
L k ( j ) : choice factor for the kth closest destination of type j; L k ( j ) > L k + 1 ( j ) .
This indicator can be interpreted as the average distance from origins to destinations, weighted by destination attractiveness and by choice factor. Its interpretation as a distance allows for important conclusions to be readily derived, which was the main reason this indicator was selected. Other accessibility indicators could be used, such as the decay functions of [45] or log-logistic decays. These are programmable in GIS but would require parameterization of the decay functions. Moreover, their A i output values would be harder to interpret. The L k ( j ) can be interpreted using L k ( j ) = { 70 ,   20 ,   10 } , as an example, a 70% preference for the closest facility, 20% preference for the second closest, and 10% preference for the third closest. The reason for including this factor is related to the cost nature of accessibility as measured by Equation (1) and is discussed further below.

3.1.1. Building Blocks for Evaluating Accessibility

The origins are residential locations and destinations are jobs and urban facilities, segregated by type and weighted by attractiveness. A street’s network connects origins and destinations, and distance is evaluated along this network. Attractiveness weights need to be considered when evaluating accessibility [30,46] and are assigned by the decision maker for each destination type based on trip frequency. Table 1 shows the weights chosen for this research, with higher weights meaning trips to the corresponding destinations are likely to be more frequent. For urban facilities, these weight values are consistent with trip frequencies per facility type found by the UK Government [47] and were also used in [48,49]. For jobs, the percentage of commuting trips was considered, and a weight was assigned accordingly. For Coimbra, this percentage is 37% (survey data), leading to w j = 22 ,   j : jobs , as for this value, one has w jobs j w j = 22 60 37 % .
Multiple facilities (opportunities) should be considered in accessibility [35]. However, when accessibility is a distance, higher values of A i are generated as more destinations are considered, leading to the degradation of the indicator. Thus, instead of considering all facilities of a given type, the OD distance is calculated for the k-closest facilities of that type and weighted by the L k ( j ) factors. These factors are monotonously decreasing in k because the further a facility is, the less likely it is to be visited. This approach, also used by Brimberg et al. [50], models demand for multiple facilities while preserving the interpretation of accessibility as a distance. However, for some facility types only the closest one is relevant (type 1 facilities, j 1 , marked in Table 1). Type 1 facilities always have L k ( j 1 ) = { 100 ,   0 ,   0 } and for other facilities (type 3, j 3 ), three sets of L k were used: L k ( j 3 ) = { 100 ,   0 ,   0 } , L k ( j 3 ) = { 70 ,   20 ,   10 } , and L k ( j 3 ) = { 50 ,   35 ,   15 } (ascending order of k).

3.1.2. Accessibility to Jobs

Accessibility to jobs requires a different treatment for two reasons. First, jobs are at fixed locations: there is no “closest job”. Second, knowing where the people from each origin work requires large scale surveys, which are in general not available. To deal with these issues, the following approach was used, inspired by Traffic Analysis Zone [36,51]: identify job locations and employee count, divide the city into zones, count jobs in each zone, and find the geometric average job location of each zone. Finally, for each origin, calculate distance to each average job location and ponder it by the percentage of jobs in the respective zone. Equation (2) summarizes this.
d i j 1 = z p z d i z ,     j : jobs
where
d i j 1   ( j : jobs ) : distance from origin i to jobs.
z : 1 , , Z number of job location zones.
p z : percentage of jobs in zone z.
d i z : distance from origin i to average job location in zone z.
Jobs are type 1 destinations, and d i j 2   and   d i j 3 are defined as zero. High distances to jobs affect the choice of residence location, so p z job percentages may need to be corrected by decay factors, depending on the origin. However, average job distance in Coimbra is around 5 km, which is below the 6–10 km thresholds presented by de Vries et al. [52] and Goel [53] for that effect to start, so no corrections to p z were needed. Alternative treatments to job accessibility include, e.g., simulation-based methods [54,55].

4. Case Study

The case study consists of a comparison between the city of Coimbra, Portugal, as it stands and its redraft as a Garden City, using Equation (1) as the benchmark. The building blocks considered for the two layouts were those of Section 3.1.1, namely origins, destinations, and the road network. Details on the methodology implementation are now described. All the operations were carried out in the ESRI ArcGIS 10.7 environment.

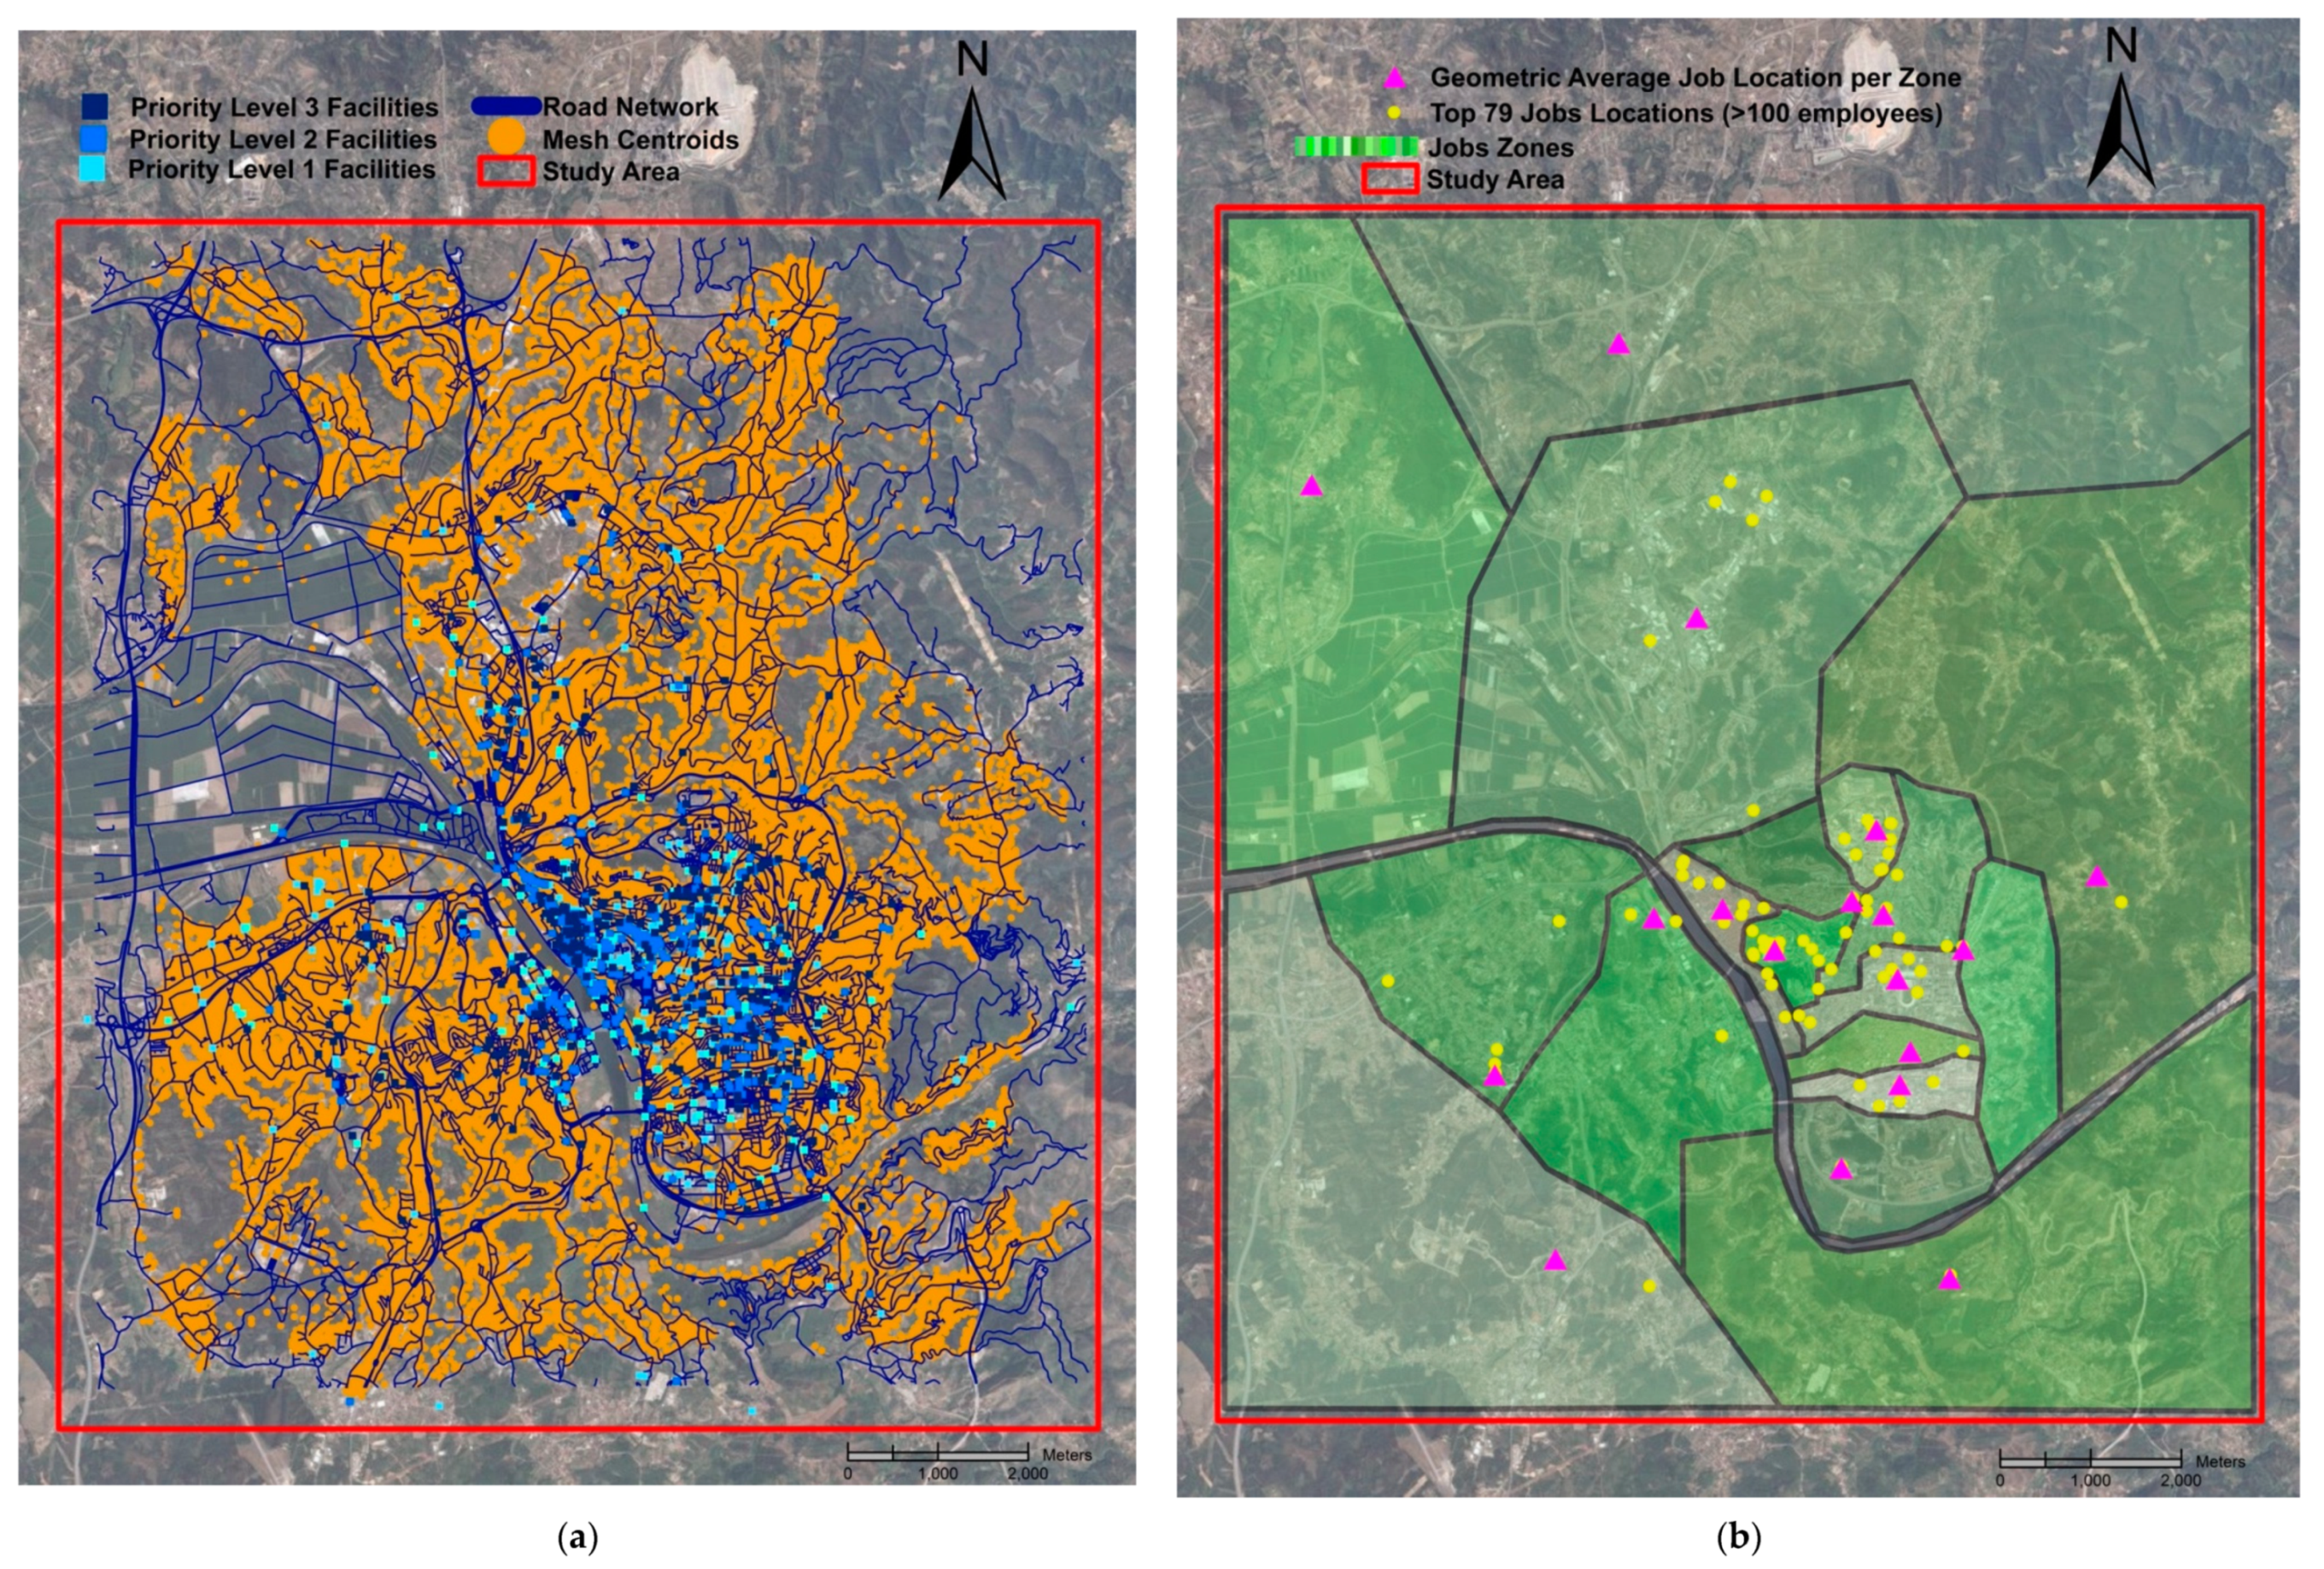
4.1. The City of Coimbra

4.1.1. Origins

A square mesh of size 25 m × 25 m and respective centroids were created over the study area. Official Portuguese GIS databases were used to distribute the population (circa 104,000) by the centroids, after which empty centroids were removed. The mesh centroids are the set of origins i (Figure 2a).

4.1.2. Destinations: Urban Facilities and Job Locations

The location of and type urban facilities of Coimbra was obtained (Figure 2a), as well as job locations and employee count. Job locations with over 100 employees and zones are depicted in Figure 2b. Zones were drawn considering population density, buildings, jobs, and existing administrative divisions.

4.1.3. Road Network

The detailed road network of Coimbra was obtained from OpenStreetMap and is displayed in Figure 2a.

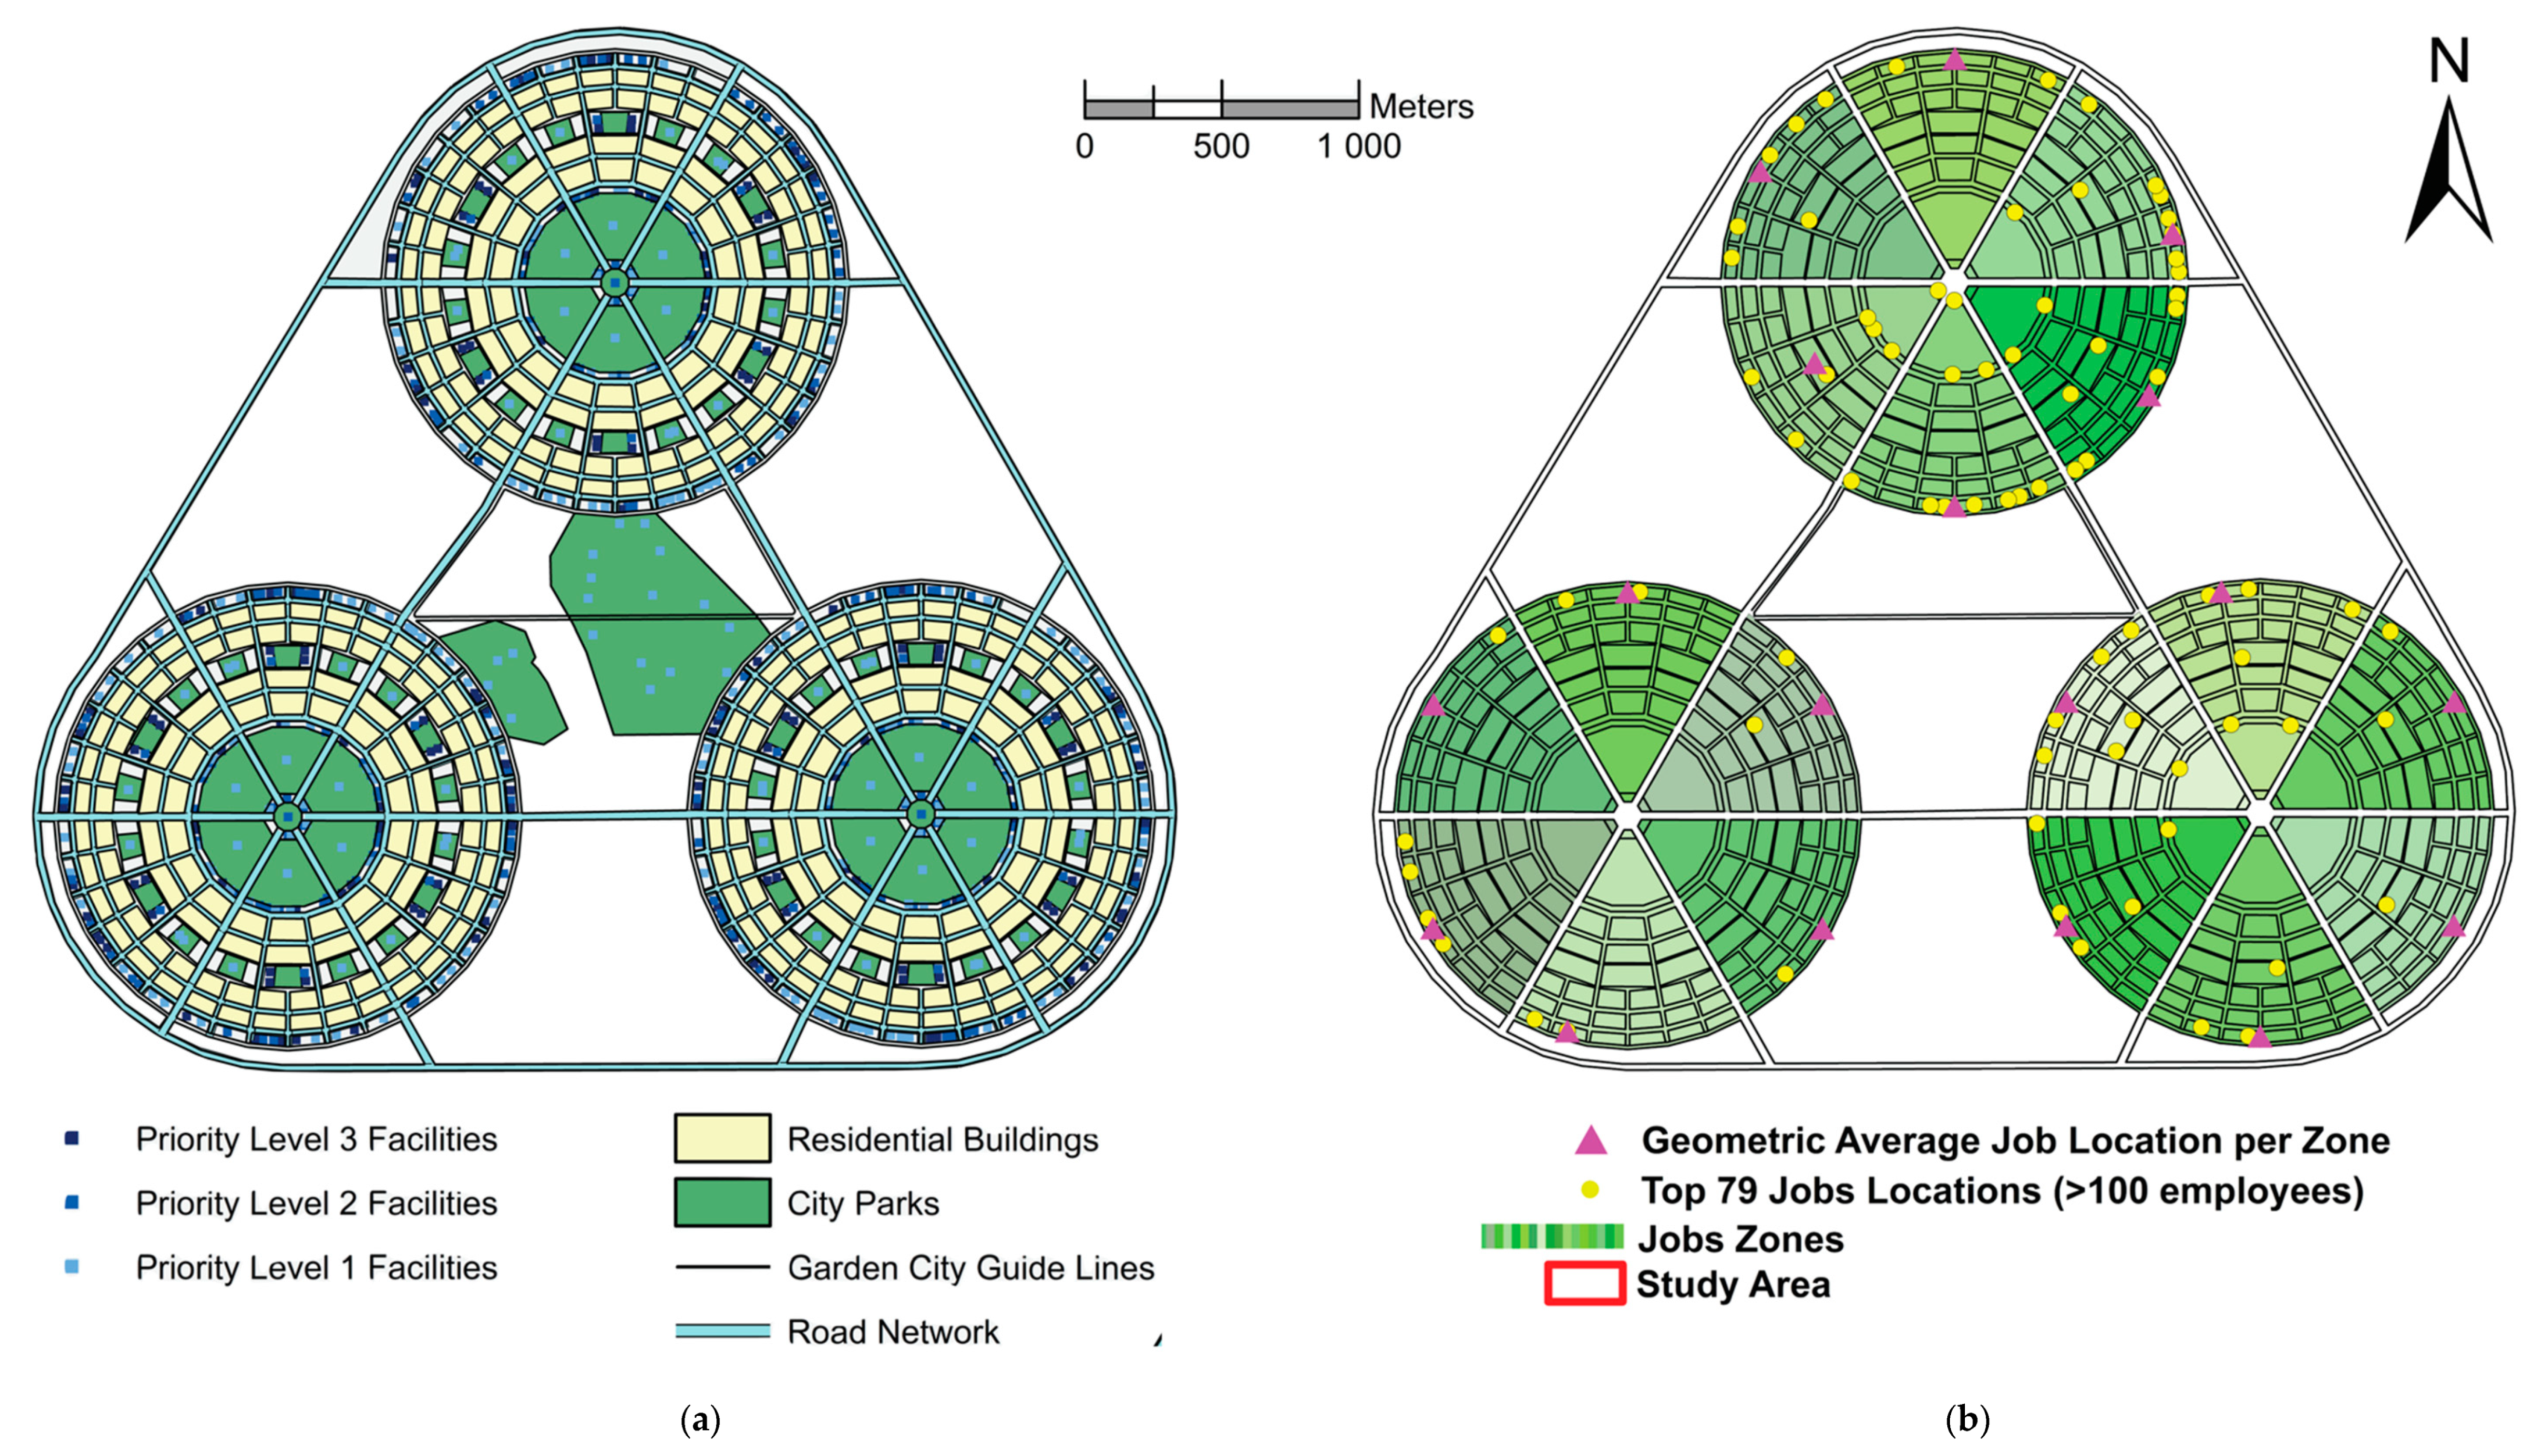
4.2. Coimbra as Garden City

To redraft Coimbra as a Garden City, the description and blueprints of Howard [23] were followed, with adaptations stemming from Coimbra being a city of services, with healthcare and higher education as main activities. Since Coimbra has 104,000 inhabitants, in the redraft, Coimbra was extended from a Garden City to a Social City of three interconnected garden cities, placed in overlap with the main urban zones of real Coimbra. This was performed so that the two layouts would be closer to each other.

4.2.1. Origins

Residential buildings were located in the two circular rings allocated to this land use in each garden city. Area calculations show that each inhabitant has around 61.5 m2 living space, which compares with 47 m2 in real Coimbra (see supplementary materials Section S1 for details).

4.2.2. Destinations: Urban Facilities

Facilities were distributed by the four ringlike areas corresponding to their land use, with the necessary adaptations, following Table 2. The number of facilities of each type, dimensions, and construction areas were defined using information for Coimbra and the space available in Coimbra as a Social City. The Social City has more post offices and parks than Coimbra but fewer neighborhood facilities because it is more compact and requires fewer of these facilities to be distributed. The location of some larger facilities was based on their homologous location in Coimbra: regional hospitals were placed in the outerings, close to the same place where they sit in the real city.

4.2.3. Destinations: Job Locations

Top job locations of Coimbra (100+ employees) totalize 41% of jobs. Some of these correspond to large urban facilities with precise location (e.g., hospitals and universities), others to private companies which were placed in the outerings. The remaining 59% of jobs were placed in the ringlike areas of the Social City, distributed according to ring area. The job zone division coincides with the wards (6 per garden city, 18 total).

4.2.4. Road Network

The road network was drawn based on Howard’s specifications, and all streets are two way.
The result, Coimbra as a Garden City, is seen on Figure 3. Real Coimbra has circa 11 km size (Figure 2), which compares with 5 km for the more compact Garden City. See supplementary materials Section S2 for a side-by-side comparison (Figure S2). The urban sprawl of Coimbra suggests higher average distances to facilities and jobs, but since the city center has high population density and the suburbs have neighborhood facilities, it is not clear beforehand what the differences will be.

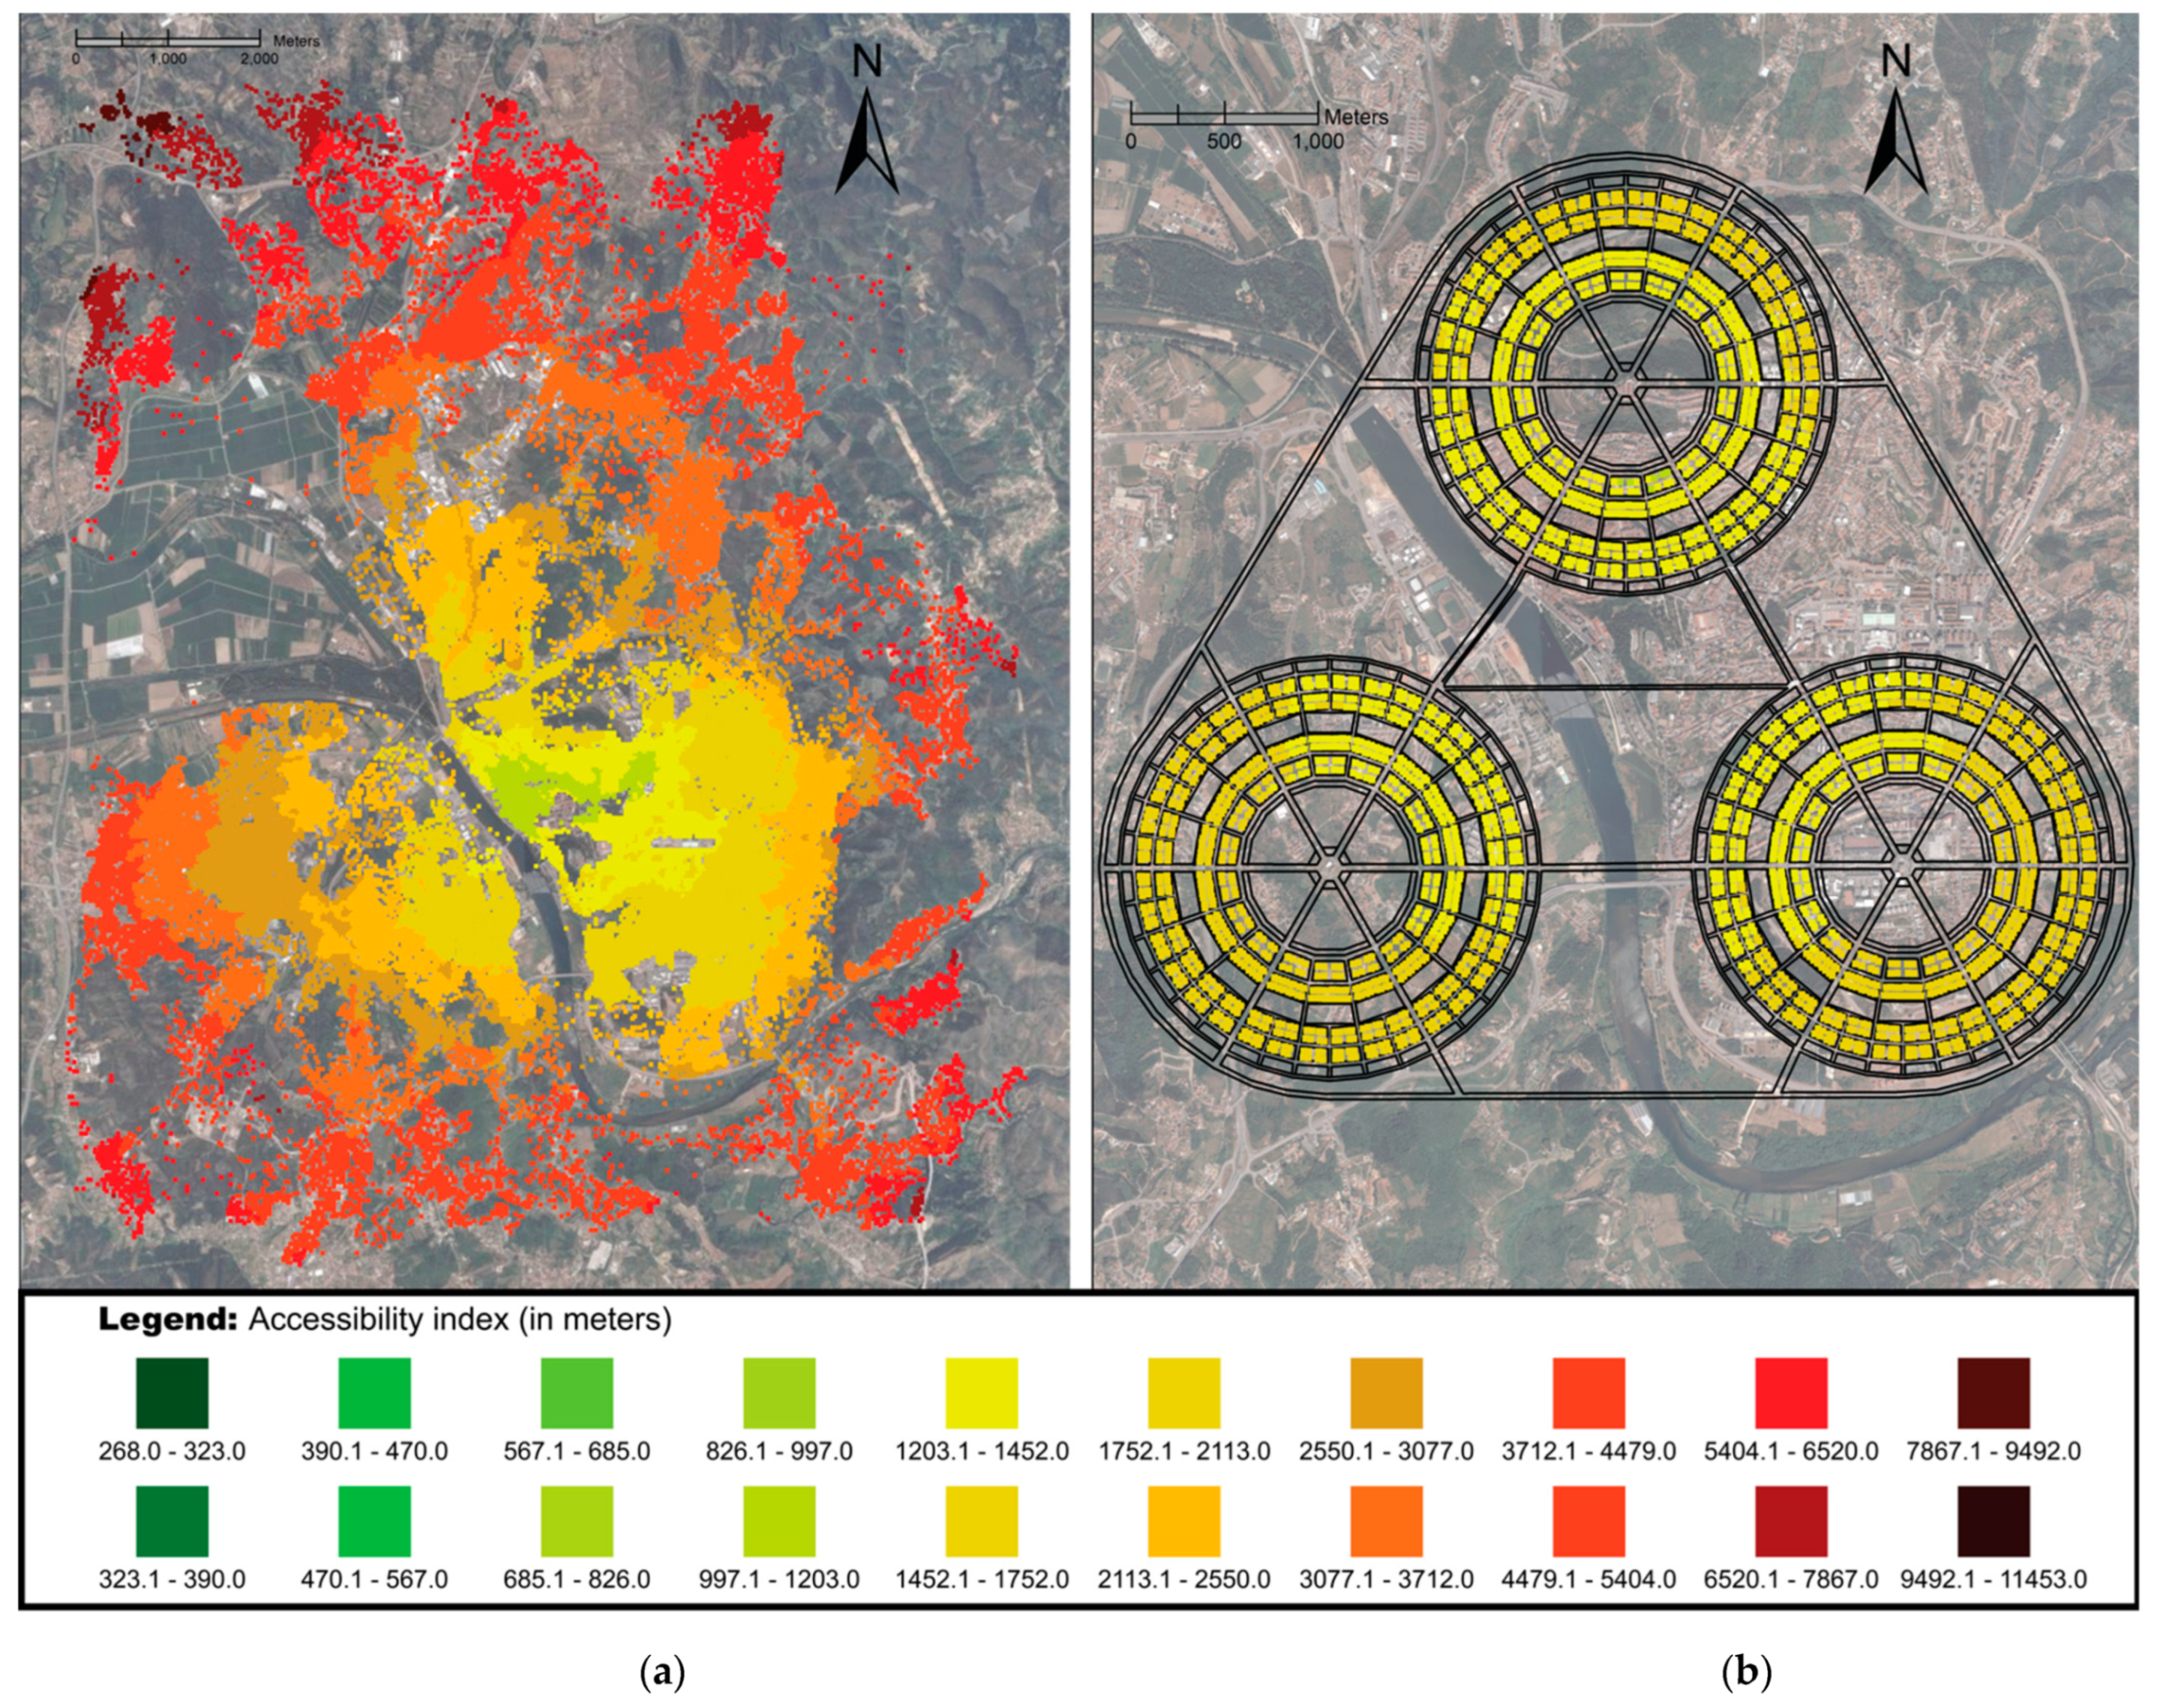
4.3. Accessibility Analyses

Network distances to the closest facilities and average job locations were obtained in ArcGIS for every origin. A base scenario with L k ( j 3 ) = { 70 ,   20 ,   10 } was considered, and three sets of results for A i were derived for each layout implementing Equation (1): accessibility to (i) urban facilities; (ii) jobs; and (iii) facilities and jobs (overall accessibility). Analysis (i) is justified because a significant fraction of the population is retired or not in the job market. In addition, people who live in Coimbra but work outside the study area are mostly interested in accessibility to facilities only. Analysis (ii) was made for completeness. A sensitivity analysis for the other sets of L k ( j ) was also carried out.

5. Results

Base scenario maps for overall accessibility are shown in Figure 4. Full maps for all results are given in the supplementary materials Section S3 (Figures S3–S9). Table 3 displays summarizing statistics for all analyses. The statistical measures are calculated over the set of A i values, except for “average per inhabitant”, which was calculated from i h i A i i h i with h i the population of origin i. The bold highlighted values are the main result for the base scenario.
Table 3 shows that the Garden City layout provides better accessibility scores in all cases, proving that urban sprawl has a large impact on accessibility, in line with similar results in the literature [56]. This difference is especially relevant when only the urban facilities are considered, as inhabitants in the Garden City would be, on average, almost one-third the distance to those facilities, as compared with Coimbra (530 m vs. 1440 m, three significant digits; see Figure S3 for a map). This result shows that for most trips to facilities, inhabitants of the Social City stay within their garden city of residence. When jobs are considered, this drop in distance also appears, with the Garden City exhibiting on average 59% of the distances of Coimbra for overall accessibility (1490 m vs. 2530 m) and 71% for jobs only (3160 m vs. 4420 m; Figure 4). The average distances for jobs show that, more often than not, inhabitants commute between different Garden Cities of the Social City, making it important to provide for adequate mass transit systems in the social city. As the Garden City is more compact, the result of shorter trip distances is not surprising and is expected hold for other compact layouts. However, the actual value of the difference is important and novel, as it required making the methodological calculations using the benchmark, Equation (1). Travel distance reduction also means a reduction in travel time and can impact quantities beyond accessibility, such as energy consumption or GHG emissions, which are not linear with travel distance because, as distances shorten, active mode trips (efficient and emissions-free) become more likely. Active modes may also lead to better travel satisfaction [57], so the Garden City has the potential to become a more pleasant and energy-efficient city model.
To quantify this potential, note that the average distance per inhabitant to facilities in the Garden City ranges from 460 m to 570 m. This is slightly above traditional guidelines of a quarter mile (400 m) for walking distance but is below recent research that points to 800 m [58] and 700 m [59] as acceptable distances. So, with respect to facilities, Coimbra as Garden City is mostly a walkable city. This conclusion is also important, as commerce and service activities available close to home are likely to be more important than a short commute [60,61]. Concerning cycling, [54] reported average cycled distances of 3800 m in the USA, while [57] mention 3890 m averages for commuting trips, with 3070 m median, in Canada (figures are similar in Europe). The maximum overall accessibility travel distance for the worst-located inhabitants in the garden city sits between 1890 m and 1930 m, well within cycling range. With trip distances of 5 km between far away points in the Social City, the bicycle is a viable option for most trips within the social city and a strong candidate for commuting trips. The high number of green spaces in the social city may also foster cycling [62,63].
The situation for Coimbra is quite different. With average distances per inhabitant to facilities ranging between 1350 m and 1500 m, Coimbra is far from walkable for everyone. Looking at overall accessibility, average distances sit around 2530 m and maximum distances raise to 9330 m. For jobs, these climb to 4100 m and 11,450 m. The bicycle may still be a viable mode for the average citizen of Coimbra, but the worst-located inhabitants clearly live outside cycling range. With 83/52/29% of inhabitants living more than, respectively, 3070/3890/5000 m away from their job (GIS calculations), the potential for commuting by cycling is significantly more limited than that of the Garden City, whose homologous percentages are 53/7/0%. This is an important conclusion, as it shows that motorized transport modes are almost inescapable for many inhabitants of Coimbra, with the inevitable consequences of increased GHG emissions, rush hour traffic jams, and parking space use. While some neighborhoods in the outskirts of Coimbra have grown to the point where small businesses and local facilities started to appear, results show this urbanization of the suburbs was insufficient to provide for all the services needed.
Another insight that is very visible from Figure 4 is that the Garden City provides much more accessibility equity than the real city. This social impact is confirmed by Table 3, which exhibits much lower values of dispersion measures for the Garden City, in striking contrast with Coimbra, where a clear difference exists between those who live close to most facilities and those who live far away from just about everything.

5.1. Impact on the Environment and Sustainability

In what concerns transport sustainability, the Garden City is arguably a more sustainable layout than the real city, due to reduced sprawl and higher potential for active travel, as argued above. More sustainability aspects exist, however, and further research is needed to know how Coimbra compares with the Garden City in those aspects. Transport-related aspects are, however, important given that cities consume 78% of the energy and emit 60% of greenhouse gases [64], so any action which can reduce urban energy consumption and emissions has a large impact on the environment and sustainability. The fact that the methodology provides quantitative measurements makes it possible to estimate that impact in terms of miles travelled, which can then be translated into energy and emissions savings, and reduction in air pollution.
The ringlike regular geometric layout of Garden City also makes it easier to plan for public transport. Natural two-way bus lines flow through the circular avenues and across radial directions within each Garden City and the Social City. With adequate scheduling, it is conceivable that more passengers use mass transit rather than a private car, leading to further energy efficiency and benefits to the city and its inhabitants.

5.2. Sensitivity Analysis

The three L k ( j ) cases analysed yield similar results for all measures, as Table 3 shows. The differences can be explained as follows. As per Equation (1), as accessibility indicators degrade, L 1 ( j ) decreases. For accessibility to urban facilities, this degradation is about 14% for Coimbra and 27% for Coimbra as a Garden City, slightly hinting that the Garden City is more geared towards having some facility of a given type nearby, rather than a variety of choices of facility type. For the overall accessibility, this degradation drops to 3–4% in both cases because of the impact of jobs, a fixed location effect. See supplementary materials for maps.

6. Discussion

The past few decades brought forth new perspectives on sustainability, and urban areas should be prepared for the future [65,66]. Such paradigms include better accessibility and overall proximity [67,68,69], compacting cities and fighting back urban sprawl [70,71], citizen equity [72], and a rising importance of public green spaces and recreational areas [73,74]; the latter having an impact on quality of life, city pleasantness, and the environment. A good urban design also leads directly to better transport planning opportunities [75,76,77,78] and, currently, one of the main focuses of transport planning is the active modes, its health benefits, and potential for lower energy consumption [79,80,81,82,83,84]. The accessibility comparison between Coimbra and its redraft as a Garden City provides quantitative evidence which can help judge the pros and cons of the two layouts considering those new paradigms. The better accessibility of the Garden City layout arguably puts it as the frontrunner in some of them, while not being excessively compact, a characteristic which research mentions as desirable only up to a point [10]. Nevertheless, trends exist which advocate that the city is akin to a living, self-evolving organism, much reflecting the people who live in them [85], and whose growth is not likely to follow predefined theoretical layouts. This research presents quantitative elements for all to judge, foresee, and ultimately make decisions, regardless of what the future may bring. The Garden City scores well in accessibility and equity, but other aspects exist which determine whether an urban layout becomes successful or is abandoned. These also need to be looked at in urban planning and, all things considered, it may turn out that the Garden City is not ideal or has a limited scope of appeal.

6.1. Impact in City Planning

Despite the good accessibility and equity scores of garden cities, it is not expectable that real cities are rebuilt in a more efficient manner, as the costs and resource spending would be prohibitive, as well as the associated inconveniences. Still, practical applications of the results found in this research may come in two ways:

6.1.1. Cities Expansion Programs

Social movements from the countryside to cities and among cities make city growth the main trend nowadays. This inevitably leads to the development of new city areas. This research suggests the Garden City is one possible way of planning city expansions if the sought-after emphasis is on efficiency, sustainability, and promotion of active travel modes and healthier lifestyles. This layout is being considered for the expansion of the suburbs of London to the greenbelt [86], as well as all around England [87,88]. The methodology also enables decision makers to analyze past layouts of expansions and compare them with new proposals to make predictions about the future of cities, a point Günaydin and Yücekaya [89] deemed as very important.

6.1.2. Building New Cities

Albeit rarer than expansions, examples exist of new cities sprouting up, mainly in Asia and Africa [90], offering a natural stage for implementing new city models based on purposeful long-term planning. The challenges faced decades ago are vastly different from today’s challenges, but the priorities are still the same: quality of life, economic growth, and a clean and green environment. The present study shows that old ideas such as the Garden City remain current and worthy of attention by decision makers. China in particular has developed a national Garden City program, aiming at building pilot low-carbon cities [91].

6.2. Future Work

Future developments involve researching quantitative indicators that go beyond accessibility, as transport-oriented benchmarks tend to favor city compactness. Other measures are necessary for a wider, holistic view. For instance, people tend to avoid excessive concentration, so a benchmarking indicator should be sought after that relates the urban layout and its compactness to how satisfied citizens might be with the city where they live, i.e., an urban pleasantness indicator. A mix land-use indicator can also be used as benchmark.
Transport-oriented benchmarks remain nonetheless important, and more indicators that go beyond network distances could be developed based on the methodology, such as, e.g., the active modes share or the quantification of the potential impact of this share on energy expenditure and GHG emissions, the latter exhibiting a double effect as distances shorten: less distance per se and more active travel. Two mobility-related indicators can also be developed and tested for: network directness [92], i.e., the quotient of network distances by Euclidean distances, and a benchmark of the road hierarchy. The latter could be evaluated by looking at the route profiles of accessibility-related trips and checking to what point they may promote traffic flow, prevent jams, and avoid rat-running, i.e., the use of local access roads by long distance traffic.
All these indicators can then be tested using Coimbra and Coimbra as a Garden City as prototypes, as well as others in classic and contemporary city models (e.g., TOD, compact city, or transect planning) with an aim at creating a complete city model benchmarking methodology.

6.3. Limitations

While the application of the methodology to multiple cities (real and/or classic and contemporary models) and benchmarking indicators may shed light on the debate of ideal city layout and provide quantitative elements for decisionmakers and the public, its application at a practical level is limited by the fact that real cities’ layouts are typically very static or evolve slowly and are unlikely to change based solely on benchmarking results. This is the main limitation of the methodology because it restricts its practical use to the situations of Section 6.1 (city expansions and new cities), and even then, driving forces may exist that are stronger than planned urbanism.
From a more theoretical point of view, methodology limitations stem mainly from the assumptions on how the indicators are modelled and evaluated. For example, the accessibility indicator used in this research requires some parameterization and does not cater for chained trips, i.e., round trips which include stopovers at multiple facilities (jobs included or not). Moreover, it does not consider orography, floodplains, and other geographic facts, which are nontrivial determinants of city growth and may constrain constructive solutions. Finally, for large cities, job distance decay functions need to be considered, complexifying the analysis.

7. Conclusions

In this article, a quantitative comparison between the accessibility of a real city and its redraft as a Garden City was made. The benchmarking methodology took the building blocks of the real city of Coimbra, Portugal, and redisposed them geographically in a Garden City layout with three centers in a GIS environment. After defining a distance-based accessibility measure, the two layouts, real Coimbra and Coimbra as a Garden City, were then compared. The benchmarking methodology and the accessibility comparison are the two main and novel results of this research.
The results show that accessibility of the Garden City is superior to that of Coimbra, with average distances to urban facilities dropping from 1500 m in Coimbra to circa 500 m in the Garden City, a walkable distance. When jobs are considered, average commuting distance drops from 4500 m to 3000 m and the overall accessibility (facilities plus jobs) drops from 2500 m to 1500 m. The distance reduction is mostly due to the Garden City having less urban sprawl, showing this layout is mostly walkable and fully cyclable, thus exhibiting a high potential for a shift to active transport modes. These provide for more efficient, sustainable, and healthier lifestyles that are also environmentally friendly. The extent to which a real city could be organized in a walkable/cyclable way is a nontrivial result and could only be reached by performing the bulky calculations mandated by the methodology.
This study shows that benchmarking real cities versus classic and contemporary city models is possible with the proposed methodology, which can (and should) be extended to other benchmarking indicators and city layouts. This would open new windows of research on the debate on the ideal form of cities, as well as allowing for a better understanding of how to plan upcoming city expansions.

Supplementary Materials

The following supporting information can be downloaded at: https://0-www-mdpi-com.brum.beds.ac.uk/article/10.3390/su14095029/s1, Figure S1. Layout of a Garden City ward and Social City (enlarged versions); Figure S2: Comparison in size between the city of Coimbra and Coimbra as a Garden City; Figure S3. Accessibility to urban facilities for Lk(j3) 100/0/0; Figure S4. Accessibility to urban facilities for Lk(j3) 70/20/10; Figure S5. Accessibility to urban facilities for Lk(j3) 50/35/15; Figure S6. Overall accessibility for Lk(j3) 100/0/0; Figure S7. Overall accessibility for Lk(j3) 70/20/10; Figure S8. Overall accessibility for Lk(j3) 50/35/15; Figure S9. Job accessibility.

Author Contributions

Conceptualization, J.M. and N.S.; methodology, N.S.; software, J.M. and N.S.; validation, J.M. and N.S.; formal analysis, N.S.; investigation, J.M.; resources, J.C.-R.; data curation, J.M.; writing—original draft preparation, J.M.; writing—review and editing, N.S., E.N.-J. and J.C.-R.; visualization, J.M. and E.N.-J.; supervision, J.C.-R.; project administration, J.C.-R.; funding acquisition, E.N.-J. and J.C.-R. All authors have read and agreed to the published version of the manuscript.

Funding

This research was partially funded by the Portuguese Foundation for Science and Technology (FCT), grant numbers UIDB/00308/2020 and PD/BD/150589/2020. The APC was funded by FCT, grant number UIDB/00308/2020.

Institutional Review Board Statement

Not applicable.

Conflicts of Interest

The authors declare no conflict of interest. The funders had no role in the design of the study; in the collection, analyses, or interpretation of data; in the writing of the manuscript, or in the decision to publish the results.

References

  1. UN—United Nations. 2018. Available online: https://www.un.org/development/desa/en/news/population/2018-revision-of-world-urbanization-prospects.html (accessed on 10 January 2022).
  2. Tsui, R.; Wu, S.; Siu, A. Holistic Approach to Shape Future Cities. In Future City Architecture for Optimal Living; Springer: Cham, Switzerland, 2015; pp. 117–140. ISBN 978-3319150307. [Google Scholar] [CrossRef]
  3. Barthelemy, M. Modeling cities. Comptes Rendus. Phys. 2019, 20, 293–307. [Google Scholar] [CrossRef]
  4. Phillis, Y.A.; Kouikoglou, V.S.; Verdugo, C. Urban sustainability assessment and ranking of cities. Comput. Environ. Urban Syst. 2017, 64, 254–265. [Google Scholar] [CrossRef]
  5. Kristjánsdóttir, S. Roots of Urban Morphology. Iconarp Int. J. Arch. Plan. 2019, 7, 15–36. [Google Scholar] [CrossRef] [Green Version]
  6. Tellier, L. Urban World History: An Economic and Geographical Perspective; Springer: Berlin/Heidelberg, Germany, 2019; ISBN 978-3030248420. [Google Scholar] [CrossRef]
  7. Sharifi, A. From Garden City to Eco-urbanism: The quest for sustainable neighborhood development. Sustain. Cities Soc. 2016, 20, 1–16. [Google Scholar] [CrossRef]
  8. Cervero, R.; Murphy, S.; Ferrell, C.; Goguts, N.; Tsai, Y.-H.; Arrington, G.; Boroski, J.; Smith-Heimer, J.; Golem, R.; Peninger, P.; et al. Transit-oriented development in the United States: Experiences, challenges, and prospects. In Transit Cooperative Research Program (TCRP) Report 102; Transportation Research Board: Washington, DC, USA, 2004; ISBN 978-0309087957. [Google Scholar] [CrossRef]
  9. Correa, J. Counterpoint: Transect transgressions. Places 2006, 18, 24–25. Available online: https://escholarship.org/uc/item/1d9746r1 (accessed on 10 February 2022).
  10. Neuman, M. The Compact City Fallacy. J. Plan. Educ. Res. 2005, 25, 11–26. [Google Scholar] [CrossRef]
  11. Schrader, B. Avoiding the mistakes of the “mother country”: The New Zealand garden city movement, 1900–1926. Plan. Perspect. 1999, 14, 395–411. [Google Scholar] [CrossRef]
  12. Lin, J.-J.; Yang, A.-T. Does the Compact-City Paradigm Foster Sustainability? An Empirical Study in Taiwan. Environ. Plan. B Plan. Des. 2006, 33, 365–380. [Google Scholar] [CrossRef]
  13. Lyu, G.; Bertolini, L.; Pfeffer, K. Developing a TOD typology for Beijing metro station areas. J. Transp. Geogr. 2016, 55, 40–50. [Google Scholar] [CrossRef] [Green Version]
  14. Ratner, K.A.; Goetz, A.R. The reshaping of land use and urban form in Denver through transit-oriented development. Cities 2013, 30, 31–46. [Google Scholar] [CrossRef]
  15. Fishman, R. Urban Utopias in the Twentieth Century: Ebenezer Howard, Frank Lloyd Wright, Le Corbusier; The MIT Press: Cambridge, MA, USA, 1982; ISBN 978-0262560238. [Google Scholar]
  16. Frey, H. Designing the City: Towards a More Sustainable Urban Form; Taylor & Francis Routledge: London, UK; New York, NY, USA, 1999; ISBN 978-0419221104. [Google Scholar]
  17. Lynch, K. The Image of the City; The MIT Press: Cambridge, MA, USA, 1960; ISBN 978-0-262-62001-7. [Google Scholar]
  18. Yuan, Z.; Zheng, X.; Lv, L.; Xue, C. From design to digital model: A quantitative analysis approach to Garden Cities theory. Ecol. Model. 2014, 289, 26–35. [Google Scholar] [CrossRef]
  19. Adolphe, L. A Simplified Model of Urban Morphology: Application to an Analysis of the Environmental Performance of Cities. Environ. Plan. B Plan. Des. 2001, 28, 183–200. [Google Scholar] [CrossRef]
  20. Gauthiez, B. The history of urban morphology. Urban Morphol. 2004, 8, 71–89. Available online: http://www.urbanform.org/online_unlimited/pdf2004/200482_71-89.pdf (accessed on 15 February 2022).
  21. Li, Y. Towards concentration and decentralization: The evolution of urban spatial structure of Chinese cities, 2001–2016. Comput. Environ. Urban Syst. 2019, 80, 101425. [Google Scholar] [CrossRef]
  22. Silva, C.N. Urban Planning in Portugal in the Twentieth Century. Int. J. Reg. Local Stud. 2008, 4, 23–39. [Google Scholar] [CrossRef]
  23. Howard, E. TO-MORROW: A Peaceful Path to Real Reform; Cambridge University Press: Cambridge, UK, 1898; ISBN 978-0511706257. [Google Scholar] [CrossRef]
  24. Kremer, P.; Haase, A.; Haase, D. The future of urban sustainability: Smart, efficient, green or just? Introduction to the special issue. Sustain. Cities Soc. 2019, 51, 1–5. [Google Scholar] [CrossRef]
  25. Amado, M.; Poggi, F.; Amado, A.R. Energy efficient city: A model for urban planning. Sustain. Cities Soc. 2016, 26, 476–485. [Google Scholar] [CrossRef]
  26. Van Der Gaast, K.; Van Leeuwen, E.; Wertheim-Heck, S. City-Region Food Systems and Second Tier Cities: From Garden Cities to Garden Regions. Sustainability 2020, 12, 2532. [Google Scholar] [CrossRef] [Green Version]
  27. Hügel, S. From the Garden City to the Smart City. Urban Plan. 2017, 2, 1–4. [Google Scholar] [CrossRef]
  28. Morris, K.I.; Salleh, S.A.; Chan, A.; Ooi, M.; Abakr, Y.A.; Oozeer, Y.; Duda, M. Computational study of urban heat island of Putrajaya, Malaysia. Sustain. Cities Soc. 2015, 19, 359–372. [Google Scholar] [CrossRef]
  29. Deboosere, R.; El-Geneidy, A.M.; Levinson, D. Accessibility-oriented development. J. Transp. Geogr. 2018, 70, 11–20. [Google Scholar] [CrossRef] [Green Version]
  30. Handy, S. Is accessibility an idea whose time has finally come? Transp. Res. Part D Transp. Environ. 2020, 83, 102319. [Google Scholar] [CrossRef]
  31. Bertolini, L.; le Clercq, F.; Kapoen, L. Sustainable accessibility: A conceptual framework to integrate transport and land use plan-making. Two test-applications in the Netherlands and a reflection on the way forward. Transp. Policy 2005, 12, 207–220. [Google Scholar] [CrossRef]
  32. Papa, E.; Bertolini, L. Accessibility and Transit-Oriented Development in European metropolitan areas. J. Transp. Geogr. 2015, 47, 70–83. [Google Scholar] [CrossRef] [Green Version]
  33. Boisjoly, G.; El-Geneidy, A.M. The insider: A planners’ perspective on accessibility. J. Transp. Geogr. 2017, 64, 33–43. [Google Scholar] [CrossRef]
  34. Bruinsma, F.; Rietveld, P. The Accessibility of European Cities: Theoretical Framework and Comparison of Approaches. Environ. Plan. A: Econ. Space 1998, 30, 499–521. [Google Scholar] [CrossRef]
  35. Geurs, K.T.; van Wee, B. Accessibility evaluation of land-use and transport strategies: Review and research directions. J. Transp. Geogr. 2003, 12, 127–140. [Google Scholar] [CrossRef]
  36. Jiao, H.; Li, C.; Yu, Y.; Peng, Z. Urban Public Green Space Equity against the Context of High-Speed Urbanization in Wuhan, Central China. Sustainability 2020, 12, 9394. [Google Scholar] [CrossRef]
  37. Miller, E.J. Accessibility: Measurement and application in transportation planning. Transp. Rev. 2018, 38, 551–555. [Google Scholar] [CrossRef]
  38. Vale, D.S.; Saraiva, M.; Pereira, M. Active accessibility: A review of operational measures of walking and cycling accessibility. J. Transp. Land Use 2016, 9, 209–235. [Google Scholar] [CrossRef]
  39. Apparicio, P.; Abdelmajid, M.; Riva, M.; Shearmur, R. Comparing alternative approaches to measuring the geographical accessibility of urban health services: Distance types and aggregation-error issues. Int. J. Health Geogr. 2008, 7, 7. [Google Scholar] [CrossRef] [PubMed] [Green Version]
  40. Gutiérrez, J.; Urbano, P. Accessibility in the European Union: The impact of the trans-European road network. J. Transp. Geogr. 1996, 4, 15–25. [Google Scholar] [CrossRef]
  41. Ryan, J.; Pereira, R.H. What are we missing when we measure accessibility? Comparing calculated and self-reported accounts among older people. J. Transp. Geogr. 2021, 93, 103086. [Google Scholar] [CrossRef]
  42. Shen, G.; Zhou, L.; Wang, Z.; Liu, Y.; Yan, X. Home-Based Locational Accessibility to Essential Urban Services: The Case of Wake County, North Carolina, USA. Sustainability 2020, 12, 9142. [Google Scholar] [CrossRef]
  43. Zhou, L.; Shen, G.; Wu, Y.; Brown, R.; Chen, T.; Wang, C. Urban Form, Growth, and Accessibility in Space and Time: Anatomy of Land Use at the Parcel-Level in a Small to Medium-Sized American City. Sustainability 2018, 10, 4572. [Google Scholar] [CrossRef] [Green Version]
  44. Straatemeier, T.; Bertolini, L. Joint Accessibility Design Framework Developed with Practitioners to Integrate Land Use and Transport Planning in the Netherlands. Transp. Res. Rec. J. Transp. Res. Board 2008, 2077, 1–8. [Google Scholar] [CrossRef]
  45. Vale, D.S.; Pereira, M. The influence of the impedance function on gravity-based pedestrian accessibility measures: A comparative analysis. Environ. Plan. B Urban Anal. City Sci. 2016, 44, 740–763. [Google Scholar] [CrossRef]
  46. Schläpfer, M.; Dong, L.; O’Keeffe, K.; Santi, P.; Szell, M.; Salat, H.; Anklesaria, S.; Vazifeh, M.; Ratti, C.; West, G.B. The universal visitation law of human mobility. Nature 2021, 593, 522–527. [Google Scholar] [CrossRef]
  47. UK Government. 2018. Available online: https://www.gov.uk/government/statistical-data-sets/tsgb01-modal-comparisons (accessed on 21 January 2022).
  48. Sousa, N.; Natividade-Jesus, E.; Coutinho-Rodrigues, J. Bike-Index—Um índice de acessibilidade velocípede recorrendo a programação em ambiente SIG. Rev. Ciências Comput. 2018, 13, 67–88. Available online: https://journals.uab.pt/index.php/rcc/article/view/151 (accessed on 20 January 2022). (In Portuguese).
  49. Sousa, N.; Pais, F.; Natividade-Jesus, E.; Coutinho-Rodrigues, J. Design of pedestrian network friendliness maps. Proc. Inst. Civ. Eng.—Munic. Eng. 2019, 172, 224–232. [Google Scholar] [CrossRef]
  50. Brimberg, J.; Maier, A.; Schöbel, A. When closest is not always the best: The distributed p-median problem. J. Oper. Res. Soc. 2019, 72, 200–216. [Google Scholar] [CrossRef]
  51. Wang, F. Modeling Commuting Patterns in Chicago in a GIS Environment: A Job Accessibility Perspective. Prof. Geogr. 2000, 52, 120–133. [Google Scholar] [CrossRef] [Green Version]
  52. de Vries, J.J.; Nijkamp, P.; Rietveld, P. Exponential or Power Distance-Decay for Commuting? An Alternative Specification. Environ. Plan. A Econ. Space 2009, 41, 461–480. [Google Scholar] [CrossRef] [Green Version]
  53. Goel, R. Distance-decay functions of travel to work trips in India. Data Brief 2018, 21, 50–58. [Google Scholar] [CrossRef]
  54. Huang, R. Transit-based job accessibility and urban spatial structure. J. Transp. Geogr. 2020, 86, 102748. [Google Scholar] [CrossRef]
  55. Huang, R. Simulating individual work trips for transit-facilitated accessibility study. Environ. Plan. B Urban Anal. City Sci. 2017, 46, 84–102. [Google Scholar] [CrossRef]
  56. Tannier, C.; Vuidel, G.; Houot, H.; Frankhauser, P. Spatial accessibility to amenities in fractal and nonfractal urban patterns. Environ. Plan. B Plan. Des. 2012, 39, 801–819. [Google Scholar] [CrossRef]
  57. Mouratidis, K.; Ettema, D.; Næss, P. Urban form, travel behavior, and travel satisfaction. Transp. Res. Part A Policy Pract. 2019, 129, 306–320. [Google Scholar] [CrossRef]
  58. Buehler, R.; Pucher, J.; Bauman, A. Physical activity from walking and cycling for daily travel in the United States, 2001–2017: Demographic, socioeconomic, and geographic variation. J. Transp. Health 2020, 16, 100811. [Google Scholar] [CrossRef]
  59. Hsu, C.-I.; Tsai, Y.-C. An Energy Expenditure Approach for Estimating Walking Distance. Environ. Plan. B Plan. Des. 2014, 41, 289–306. [Google Scholar] [CrossRef]
  60. Boarnet, M.G.; Joh, K.; Siembab, W.; Fulton, W.; Nguyen, M.T. Retrofitting the Suburbs to Increase Walking: Evidence from a Land-use-Travel Study. Urban Stud. 2010, 48, 129–159. [Google Scholar] [CrossRef] [PubMed] [Green Version]
  61. van Wee, B. Accessible accessibility research challenges. J. Transp. Geogr. 2016, 51, 9–16. [Google Scholar] [CrossRef] [Green Version]
  62. Campos-Sánchez, F.S.; Valenzuela-Montes, L.M.; Abarca-Álvarez, F.J. Evidence of Green Areas, Cycle Infrastructure and Attractive Destinations Working Together in Development on Urban Cycling. Sustainability 2019, 11, 4730. [Google Scholar] [CrossRef] [Green Version]
  63. Sultana, S.; Salon, D.; Kuby, M. Transportation sustainability in the urban context: A comprehensive review. Urban Geogr. 2017, 40, 279–308. [Google Scholar] [CrossRef]
  64. UN—United Nations. 2021. Available online: https://www.un.org/en/climatechange/climate-solutions/cities-pollution (accessed on 15 January 2022).
  65. Loorbach, D.; Shiroyama, H. The Challenge of Sustainable Urban Development and Transforming Cities. In Governance of Urban Sustainability Transitions; Springer: Tokyo, Japan, 2016; pp. 3–12. [Google Scholar]
  66. Klopp, J.M.; Petretta, D.L. The urban sustainable development goal: Indicators, complexity and the politics of measuring cities. Cities 2017, 63, 92–97. [Google Scholar] [CrossRef]
  67. Da Silva, D.C.; King, D.A.; Lemar, S. Accessibility in Practice: 20-Minute City as a Sustainability Planning Goal. Sustainability 2019, 12, 129. [Google Scholar] [CrossRef] [Green Version]
  68. Gil Solá, A.; Vilhelmson, B.; Larsson, A. Understanding sustainable accessibility in urban planning: Themes of consensus, themes of tension. J. Transp. Geogr. 2018, 70, 1–10. [Google Scholar] [CrossRef]
  69. Duranton, G.; Guerra, E. Developing a Common Narrative on Urban Accessibility: An Urban Planning Perspective; Moving Access—Brooking; The National Academies of Sciences, Engineering, and Medicine: Washington, DC, USA, 2016; pp. 1–43. [Google Scholar]
  70. Haaland, C.; van den Bosch, C.K. Challenges and strategies for urban green-space planning in cities undergoing densification: A review. Urban For. Urban Green. 2015, 14, 760–771. [Google Scholar] [CrossRef]
  71. Mouratidis, K. Is compact city livable? The impact of compact versus sprawled neighborhoods on neighborhood satisfaction. Urban Stud. 2018, 55, 2408–2430. [Google Scholar] [CrossRef]
  72. Fitzgibbons, J.; Mitchell, C.L. Just urban futures? Exploring equity in “100 Resilient Cities”. World Dev. 2019, 122, 648–659. [Google Scholar] [CrossRef]
  73. Baycan-Levent, T.; Vreeker, R.; Nijkamp, P. A Multi-Criteria Evaluation of Green Spaces in European Cities. Eur. Urban Reg. Stud. 2009, 16, 193–213. [Google Scholar] [CrossRef]
  74. Gaston, K. Urban Ecology; Cambridge University Press: Cambridge, UK, 2010; pp. 1–332. ISBN 978-0-521-74349-5. [Google Scholar]
  75. Rode, P. Urban planning and transport policy integration: The role of governance hierarchies and networks in London and Berlin. J. Urban Aff. 2017, 41, 39–63. [Google Scholar] [CrossRef] [Green Version]
  76. Giles-Corti, B.; Vernez-Moudon, A.; Reis, R.; Turrell, G.; Dannenberg, A.L.; Badland, H.; Foster, S.; Lowe, M.; Sallis, J.F.; Stevenson, M.; et al. City planning and population health: A global challenge. Lancet 2016, 388, 2912–2924. [Google Scholar] [CrossRef]
  77. Hu, N.; Legara, E.F.; Lee, K.K.; Hung, G.G.; Monterola, C. Impacts of land use and amenities on public transport use, urban planning and design. Land Use Policy 2016, 57, 356–367. [Google Scholar] [CrossRef]
  78. Hickman, R.; Halcrow Group. Transport and Reduced Energy Consumption: What Role Can Urban Planning Play? Transport Studies Unit, University of Oxford: Oxford, UK, 2007; pp. 1–28. [Google Scholar]
  79. Goenka, S.; Andersen, L.B. Urban design and transport to promote healthy lives. Lancet 2016, 388, 2851–2853. [Google Scholar] [CrossRef]
  80. Avila-Palencia, I.; Panis, L.I.; Dons, E.; Gaupp-Berghausen, M.; Raser, E.; Götschi, T.; Gerike, R.; Brand, C.; de Nazelle, A.; Orjuela, J.P.; et al. The effects of transport mode use on self-perceived health, mental health, and social contact measures: A cross-sectional and longitudinal study. Environ. Int. 2018, 120, 199–206. [Google Scholar] [CrossRef]
  81. de Nazelle, A.; Nieuwenhuijsen, M.J.; Antó, J.M.; Brauer, M.; Briggs, D.; Braun-Fahrlander, C.; Cavill, N.; Cooper, A.; Desqueyroux, H.; Fruin, S.; et al. Improving health through policies that promote active travel: A review of evidence to support integrated health impact assessment. Environ. Int. 2011, 37, 766–777. [Google Scholar] [CrossRef]
  82. Pucher, J.; Buehler, R.; Bassett, D.R.; Dannenberg, A.L. Walking and Cycling to Health: A Comparative Analysis of City, State, and International Data. Am. J. Public Health 2010, 100, 1986–1992. [Google Scholar] [CrossRef]
  83. Lindsay, G.; Macmillan, A.; Woodward, A. Moving urban trips from cars to bicycles: Impact on health and emissions. J. Health Promot. 2010, 35, 54–60. [Google Scholar] [CrossRef]
  84. Woodcock, J.; Edwards, P.; Tonne, C.; Armstrong, B.; Ashiru, O.; Banister, D.; Beevers, S.; Chalabi, Z.; Chowdhury, Z.; Cohen, A.; et al. Public health benefits of strategies to reduce greenhouse-gras emissions: Urban land transport. Lancet 2009, 374, 1930–1943. [Google Scholar] [CrossRef]
  85. Williams, T. Archaeology: Reading the City through Time. In Reconnecting the City: The Historic Urban Landscape, Approach and the Future of Urban Heritage; Wiley: Blackwell, UK, 2015; pp. 19–44. ISBN 978-1118383988. [Google Scholar]
  86. Duxbury, C. 2019. Available online: https://www.politico.eu/article/home-truths-europes-housing-challenge-to-build-housing-for-the-future-britain-turns-to-the-past/ (accessed on 6 November 2021).
  87. UK Government. 2019. Available online: https://www.gov.uk/government/news/37-million-to-fund-5-new-garden-towns-across-the-country (accessed on 15 February 2022).
  88. PBC Today. 2019. Available online: https://www.pbctoday.co.uk/news/planning-construction-news/garden-communities-delivery/68951/ (accessed on 10 February 2022).
  89. Günaydin, A.S.; Yücekaya, M. Evaluation of the history of cities in the context of spatial configuration to preview their future. Sustain. Cities Soc. 2020, 59, 102202. [Google Scholar] [CrossRef]
  90. Lynch, C.R. Representations of utopian urbanism and the feminist geopolitics of “new city” development. Urban Geogr. 2018, 40, 1148–1167. [Google Scholar] [CrossRef]
  91. Khanna, N.; Fridley, D.; Hong, L. China’s pilot low-carbon city initiative: A comparative assessment of national goals and local plans. Sustain. Cities Soc. 2014, 12, 110–121. [Google Scholar] [CrossRef]
  92. Stangl, P. Overcoming flaws in permeability measures: Modified route directness. J. Urban. Int. Res. Placemaking Urban Sustain. 2017, 12, 1–14. [Google Scholar] [CrossRef]
Figure 1. Layout of a Garden City ward (a) and Social City (b) [23].
Sustainability 14 05029 g001
Figure 2. Coimbra origins, urban facilities, and road network (a); Coimbra job zones and main job locations (b).
Sustainability 14 05029 g002
Figure 3. Coimbra as Garden City (a), job zones, and main job locations (b).
Sustainability 14 05029 g003
Figure 4. Overall accessibility (facilities and jobs) for Lk(j3) 70/20/10, Coimbra (a), and Coimbra as Garden City (b).
Sustainability 14 05029 g004
Table 1. Facility types and jobs weights.
Weight 1 Facilities
wj = 1
Weight 2 Facilities
wj = 2
Weight 3 Facilities
wj = 3
Jobs
wj = 22
Post offices 1High SchoolsKindergartens 1Average job
Sports facilitiesShopping centersPrimary schools 1locations
Cultural organizationsEntertainment sitesMiddle Schools 1(Section 3.1.2)
Universities and institutesPrimary healthcare services 1Grocery stores
Elderly care centersPharmacies 1Supermarkets
ChurchesRestaurantsBakeries and pastries
Parks and green areas
1 Type 1 facility.
Table 2. Facility distribution in Coimbra as Garden City.
AreaFunction [19]Facilities on Coimbra as a Garden City
Inner RingCivil service, healthcare, and cultural buildingsCivil service, healthcare, and cultural buildings
Crystal PalaceCultural and recreational areas and small shopsSmall shops, cultural spaces and associations, post offices, pharmacies, restaurants, and pastries/bakeries
Grand AvenueGreen spaces, schools, and places of cultParks, schools, and places of cult
OuteringIndustryShopping centers, supermarkets, entertainment sites, sports facilities, cultural organizations, restaurants, bakeries, regional hospitals, and elderly care centers
Green BeltAgricultureParks, cultural spaces, and sports facilities
Table 3. Accessibility summarizing statistics.
Average Accessibility per Inhabitant (m)Urban FacilitiesUrban Facilities and Jobs
(Overall Accessibility)
Jobs Only
Lk(j3)MeasureGarden CityCoimbraGarden CityCoimbraGarden CityCoimbra
100/0/0Min3322231143104124032427
Max629790818849208410011,453
Average per inhabitant46213521452247831614421
Average46118331451302331595078
Standard deviation57132117314614401766
Coefficient of variation (no unit)0.120.720.120.480.140.35
70/20/10Min4112681194106324032427
Max705809919149329410011,453
Average per inhabitant52914401487253331614421
Average52819361486308831595078
Standard deviation56135217114834401766
Coefficient of variation (no unit)0.110.700.120.480.140.35
50/35/15Min4612951228107624032427
Max761823019349412410011,453
Average per inhabitant57314981511257031614421
Average57220031510313031595078
Standard deviation58137417014974401766
Coefficient of variation (no unit)0.100.690.110.480.140.35
Publisher’s Note: MDPI stays neutral with regard to jurisdictional claims in published maps and institutional affiliations.

