A New Long Term Assessment of Energy Return on Investment (EROI) for U.S. Oil and Gas Discovery and Production

Abstract
: Oil and gas are the main sources of energy in the United States. Part of their appeal is the high Energy Return on Energy Investment (EROI) when procuring them. We assessed data from the United States Bureau of the Census of Mineral Industries, the Energy Information Administration (EIA), the Oil and Gas Journal for the years 1919–2007 and from oil analyst Jean Laherrere to derive EROI for both finding and producing oil and gas. We found two general patterns in the relation of energy gains compared to energy costs: a gradual secular decrease in EROI and an inverse relation to drilling effort. EROI for finding oil and gas decreased exponentially from 1200:1 in 1919 to 5:1 in 2007. The EROI for production of the oil and gas industry was about 20:1 from 1919 to 1972, declined to about 8:1 in 1982 when peak drilling occurred, recovered to about 17:1 from 1986–2002 and declined sharply to about 11:1 in the mid to late 2000s. The slowly declining secular trend has been partly masked by changing effort: the lower the intensity of drilling, the higher the EROI compared to the secular trend. Fuel consumption within the oil and gas industry grew continuously from 1919 through the early 1980s, declined in the mid-1990s, and has increased recently, not surprisingly linked to the increased cost of finding and extracting oil.1. Introduction
Petroleum, including crude oil, natural gas, and natural gas liquids, is industrialized society's most important fuel. Since its discovery in the United States in 1859, the use of petroleum has increased rapidly in both absolute terms and relative to other fuels. It accounted for about two thirds of total fuel use in the 1970s [1]. Since the oil crises of the 1970s, many entities within the United States have attempted to devise alternatives to oil. Nevertheless we consume today about the same proportion of petroleum as in the 1970s. As the easier-to-find and exploit resources are increasingly depleted, we have to turn to other, more difficult and expensive resources. The deep water Gulf of Mexico exploration and exploitation efforts are but one example. Getting oil from these more difficult environments is more expensive, and any oil company will tell you that the easy oil is gone.
It takes energy as well as money to produce energy. One important issue pertaining to petroleum availability in the United States is Energy Return on Investment (EROI), the ratio of energy returned compared to the energy used to get it. A more energy-intensive process of production, other things being equal, results in a lower energy return on energy (and dollar) investment. In theory, EROI takes into consideration all energies produced and all energies consumed to get that production. In practice, EROI is usually calculated from the direct and indirect energy used to produce a given amount of energy Murphy et al. in press [2].
The U.S. oil and gas industry is traditionally the most energy-using industry in the United States, and the energy intensity of getting energy did not escape the notice of M. King Hubbert, the most important analyst of oil production patterns in the United States, who mentioned it in his notes for his deposition before the 93rd U.S. Congress. However, few or no analysts attempted to quantify that relation until Hall and Cleveland undertook this analysis in 1981 [3]. They concluded that the energy found per foot of all types of drilling while seeking and producing oil and gas declined from about 50 barrels of oil (including gas on an energy basis) in 1946 to about 15 in 1978. They also found that the energy cost increased from about 0.1 to 2 barrels equivalent per foot. EROI was not calculated explicitly in that paper, but one can infer that the EROI implied by these data declined during that period from at least 50:1 to about 8:1. They also found that while the (inferred) EROI declined over time it was greatly influenced by the amount of drilling, and that a large amount of drilling effort in any given year was associated with a low EROI relative to the secular trend and the converse. Previously Davis had reported on a similar relation for return per drilling effort [4]. An update to the Hall and Cleveland study was published by Cleveland in 2005 [5] that estimated that the EROI for oil and gas for the United States had declined from a peak of about 30:1 in 1972 to about 13:1 in 1982, during a period of very intense drilling, but that the ratio had recovered to about 18:1 in 1997. He also found that if corrections were made for the quality of the different fuels the ratio had declined from 20:1 to about 11:1 from 1954–1997. Since the data that have been analyzed previously covered only a short time span (1946–1977 or 1954–2002 at best) our objective is to analyze the data, including earlier and more recent data for a longer time span using a consistent methodology. We also compared the energy return on investment for both finding oil and producing it.
2. Methods
We derived a series of 13 point estimates for the EROI for U.S. oil and gas at mostly five-year intervals over the past 90 years. We did this for both discovery and for producing oil and gas. In each case the energy equivalent of the oil and gas found or produced was dividing by the sum of energy values of the estimates of the direct and indirect energy used in that year to produce that energy. We consider oil and gas together as the data on inputs are aggregated that way. While some of the petroleum produced or found for a given year came from past investments, and some of today's investments will not be reflected in production for a number of years, we believe this technique appropriate because most of the energy used in an oil field goes for pumping and pressurizing fields, so is related to contemporary production.
There are three analyses reported in this paper:
Oil and Gas discoveries: undertaken by Guilford and Hall;
Oil and Gas production undertaken by Guilford and Hall and independently by O'Connor and Cleveland, and considered preliminary.
When Guilford and Hall finished their analysis they found that O'Connor and Cleveland had begun the same analysis with some different assumptions. We include their preliminary analysis here as a sensitivity analysis of our own.
2.1. Methods to Derive EROI for Oil and Gas Discovery
We calculated the EROI of discovery of oil and gas from:
Equation:
Numerator:
We derived a five-point mean value of oil and gas discoveries (i.e., mean of discoveries for the year in question and the two years before and two years after each year analyzed) from 1919 to 2007. Barrels of oil and barrels of oil equivalent of gas discovered were converted into GJ by multiplying by 6.118 GJ/BOE. Discovery data was supplied courtesy of Jean Laherrere (Table 3).
Denominator:
There is no clear procedure to derive how much of total effort is used for discovery and how much for development and production. In general about one third of the feet drilled are for exploratory, not development wells2. But drilling is only part of the effort, and other uses of energy (e.g., pumping and pressurizing) are more concentrated in production. We estimated energy used by the exploratory wells from dollar cost data from 1992 to 2006 from John S. Herold[5] by dividing exploratory dollar costs by total costs (exploratory + developmental + production). We estimated energy used to find (vs. develop or produce) oil and gas by the average of the above quotient 16%, multiplied by the total energy use.
EROI for Oil and gas production (by Guilford and Hall):
Both groups compiled data sets of the direct and indirect energy used for producing oil and gas for the United States from official government sources including publications and websites. We all calculated EROI from the following equation:
Numerator:
We all used production data (total energy gained through production) for the United States from two data sources: the Energy Information Administration [1] and the production summary table from the Oil and Gas Journal and from online versions of each last issue of February from 1978 and earlier until 2010 in print at Cornell University (Table 5). We then converted the raw physical units of output to Joules using the conversion factors from Table 1.
Denominator:
Guilford and Hall estimated oil and gas industry-specific energy costs from data from the United States Bureau of the Census of Mineral Industries from 1919 to 2007 (Tables 5 and 6). The publications of the Census of Mineral industries are in print until only 1992. More recent data were derived from the Energy Information Administration (EIA) website as well as the online version of the Census of Mineral Industries. There were major changes in their format, but we believe we interpreted the new data correctly. In some few cases, as identified in A-1, we had to make educated guesses.
More specifically, we used summary tables from the Census of Mineral Industries (CMI) from 1919 to 1992 for on-site energy use. The Bureau of the Census of Mineral Industries publishes data every five years; however the criteria used to organize the data changed periodically, especially for 1997 and following, sometimes making it very difficult to interpret their tables. For example, the online version of the CMI, which was used for more recent data, is in a different format than the print version for years in which they overlap (e.g., 1992). CMI continues to supply estimates of physical quantities of natural gas (the most important fuel) used, but for some reason (apparently “insufficient data quality”), it gives the quantity of oil only in monetary terms subsequent to 1992, which we converted to physical quantities from mean annual price Appendix (A-1). Electricity is electricity not generated on site but purchased. We next converted these raw physical units (barrels, billion cubic feet, kilowatt-hours, etc.) into Joules using conversion factors from Table 1.
Indirect (offsite) energy costs were derived by multiplying inflation-corrected expenditures for capital goods and materials bought by the oil and gas industry by a factor approximating the energy intensity of the oil and gas industry expenditures (14 MJ/$ per 2005 dollar [6]) with a sensitivity analysis using a low estimate (8.3 MJ/$, the mean energy use for the society as a whole) and high energy use (20 MJ/$ for the oil and gas industry [6]). After 1972 the energy associated with producing and supplying these indirect costs often were higher than the direct use (A-1, in Appendix, summarized in Table 3). We then summed all of these energy values from the direct and indirect energy costs to give a total energy cost. This is equivalent to the standard assessment (EROIst) recommended by Murphy et al. in press [2].
After converting the raw physical units of both the energy costs and gains to energy we divided the total energy gains (finding or production data) by the total direct and indirect energy cost (fuel consumed) to calculate an EROI value for each year at five-year intervals from 1919 to 2007. Annual drilling intensity data (exploratory plus production, in million feet per year) is from the Energy Information Administration [1] website.
2.2. Difficulties with Missing Data
Generally the Census of Mineral Industries (CMI) gave quite complete energy cost analyses, especially in the middle years of this analysis, but sometimes, and increasingly in recent years, data was omitted for direct energy consumption in order to “avoid disclosing proprietary information”. In some cases CMI stated energy expenditures for specific fuels, in others CMI stated dollar energy expenditures, and in a few cases no inference from expenditures was possible. The inferences of missing values are uncertain, but we present them here as a secondary analysis.
Where CMI gave only dollar amounts for specific fuels within some sub-sectors, we used monetary costs by multiplying adjacent energy dollar rankings to derive the physical quantities consumed. Where sub-sectors had quantities reported but no price associated, we used EIA price series (annual averages) to determine the dollar value. Occasionally neither expenditures nor quantities were available for self-use of natural gas, so we interpolated as best we could.
We assumed that self-use of natural gas in the Natural Gas Liquid (NGL) Extraction sub-sector in 2007 was proportional to the electricity consumption in that sector, at the same ratio as in 2002. Therefore, we estimated that because electricity use decreased 14.5% from 2002 to 2007, the amount of natural gas for “self-use” was 14.5% below 2002 levels. This is a fairly large value, equal to 30% of the gas consumed in that year, and it is relatively uncertain. As it is self-use, no cost information is available to make a better estimate. Self-use of crude petroleum is seen in the Petroleum and Natural Gas Extraction sub-sector for 1992 and 1997, but no values are reported for 2002 or 2007. However, this is a small fraction of energy use, accounting for less than 1% of overall energy use in 1992 and 1997. Therefore, we have not attempted to estimate self-use of crude petroleum. Note that consideration of self-use of natural gas raises the issue of whether to look at “External Energy Return” (EER) or “Net Energy Return” (NER). We assume that there is an opportunity cost to using the natural gas in most cases of domestic oil production, and so include self-use in our EROI, making it an NER analysis. It would be omitted for an EER analysis, leading to a higher value for EROI.
Where specific energy quantities were unknown, but the total energy expenditures were known, we distributed the unaccounted-for energy among the various unknown categories equal to the distribution in nearby years. The amount of energy so distributed never exceeded 7% of total energy cost. For example, in 2002, the “Support Services” sub-sector listed neither expenditures nor quantities for natural gas, nor for residual and heavy diesel. There was $93,311,000 in energy costs unaccounted for in that sub-sector. We divided the residual cost among the two fuels based on their 2007 ratio, with 47.5% going to residual and heavy diesel, and 52.5% going to natural gas. We then used total price data from EIA to determine the quantities of those fuels consumed.
A considerable amount of energy is categorized as either “other” (possibly including minor fuels such as petroleum coke), or “undistributed” (reported by small firms on a shorter survey form). These range from 8–16% of total energy consumption over the years 1992–2007. We assumed that these other fuels were natural gas and added them to gas, as natural gas represents the overwhelming majority of known direct energy consumption by the “other” and “undistributed” fuels. This increases the direct energy consumption slightly compared to the case in which these expenditures are distributed among the various energy resources, because natural gas is the least expensive per BTU of the fuels used over the period 1992-2007. The total effect of these assumptions is shown in Table 2.
For capital expenditures, O'Connor and Cleveland's analysis uses the current-cost depreciation series from the Bureau of Economic Analysis for Sector 2110, Oil and Gas Extraction, rather than the capital expenditures from the CMI. The use of the depreciation series produces the changes seen in Table 3, below.
2.3. Avoidance of Double-Counting
For materials and supplies, the Census of Mineral Industries is used as in the primary analysis, but the series is corrected to eliminate the feedstock inputs. The natural gas liquids extraction sector purchases large amounts of natural gas as a feedstock, not as a fuel; it extracts the liquids and then sells both of the products. Because the energy involved in producing the gas has already been accounted for in the “direct energy inputs,” it is not appropriate to include it as a material expenditure for calculating indirect energy inputs. Therefore, we subtract the estimated proportions of natural gas feedstocks from the cost of materials purchased by the sector. For the years 1972–1982, the specific cost of natural gas feedstocks was not available, so we applied feedstock's share of NGL materials cost in 1987–2007 to the known NGL materials cost for 1972–1982. The feedstock represents about 43% of total materials expenditures (all sub-sectors) over the period 1972–2007. The effect is shown in Table 4.
A second issue of possible double-counting could not be easily avoided. The Census of Mineral Industries includes “Contract Work” in the overall category of “Total Cost of Supplies”. If a company within the sector outsources work to another company in the sector, the energy use of the contractor is already included in the direct energy consumed by the sector. It would then be inappropriate to apply the indirect emissions factor of 14 MJ/$ to the Contract Work, and the “Total Cost of Supplies” would have to be reduced by this amount. On the other hand, if the contracting company does not report to CMI in the oil and gas production sector (perhaps it is a general engineering firm, an engine manufacturer, a road-building firm, or some other sort of company), then it is appropriate to apply the indirect emissions factor. However, we have not yet identified a means to separate the Contract Work into work done by companies in this sector and work done by companies not in this sector. The analysis at present includes the “Total Cost of Supplies” without removing the within-sector Contract Work, and so likely overstates this indirect energy cost. “Contract Work” is roughly 20% of “Total Cost of Supplies” in 1997, 2002, and 2007. If half of the contract work was double-counted, then the actual indirect energy would be reduced by about 10%, and so the actual total energy inputs would be reduced by perhaps 5% (if indirect energy were half of all energy).
The three major changes we made in the empirical data set from CMI are then:
Missing values are inferred for direct energy consumption, and “other” and “undistributed” fuels are included for 1992–2007;
Depreciation series from BEA are used instead of CMI for capital; and, CMI data series for materials were corrected to eliminate NGL feedstock. The cumulative effect of these three changes is given in “sensitivity analysis”, below.
3. Results
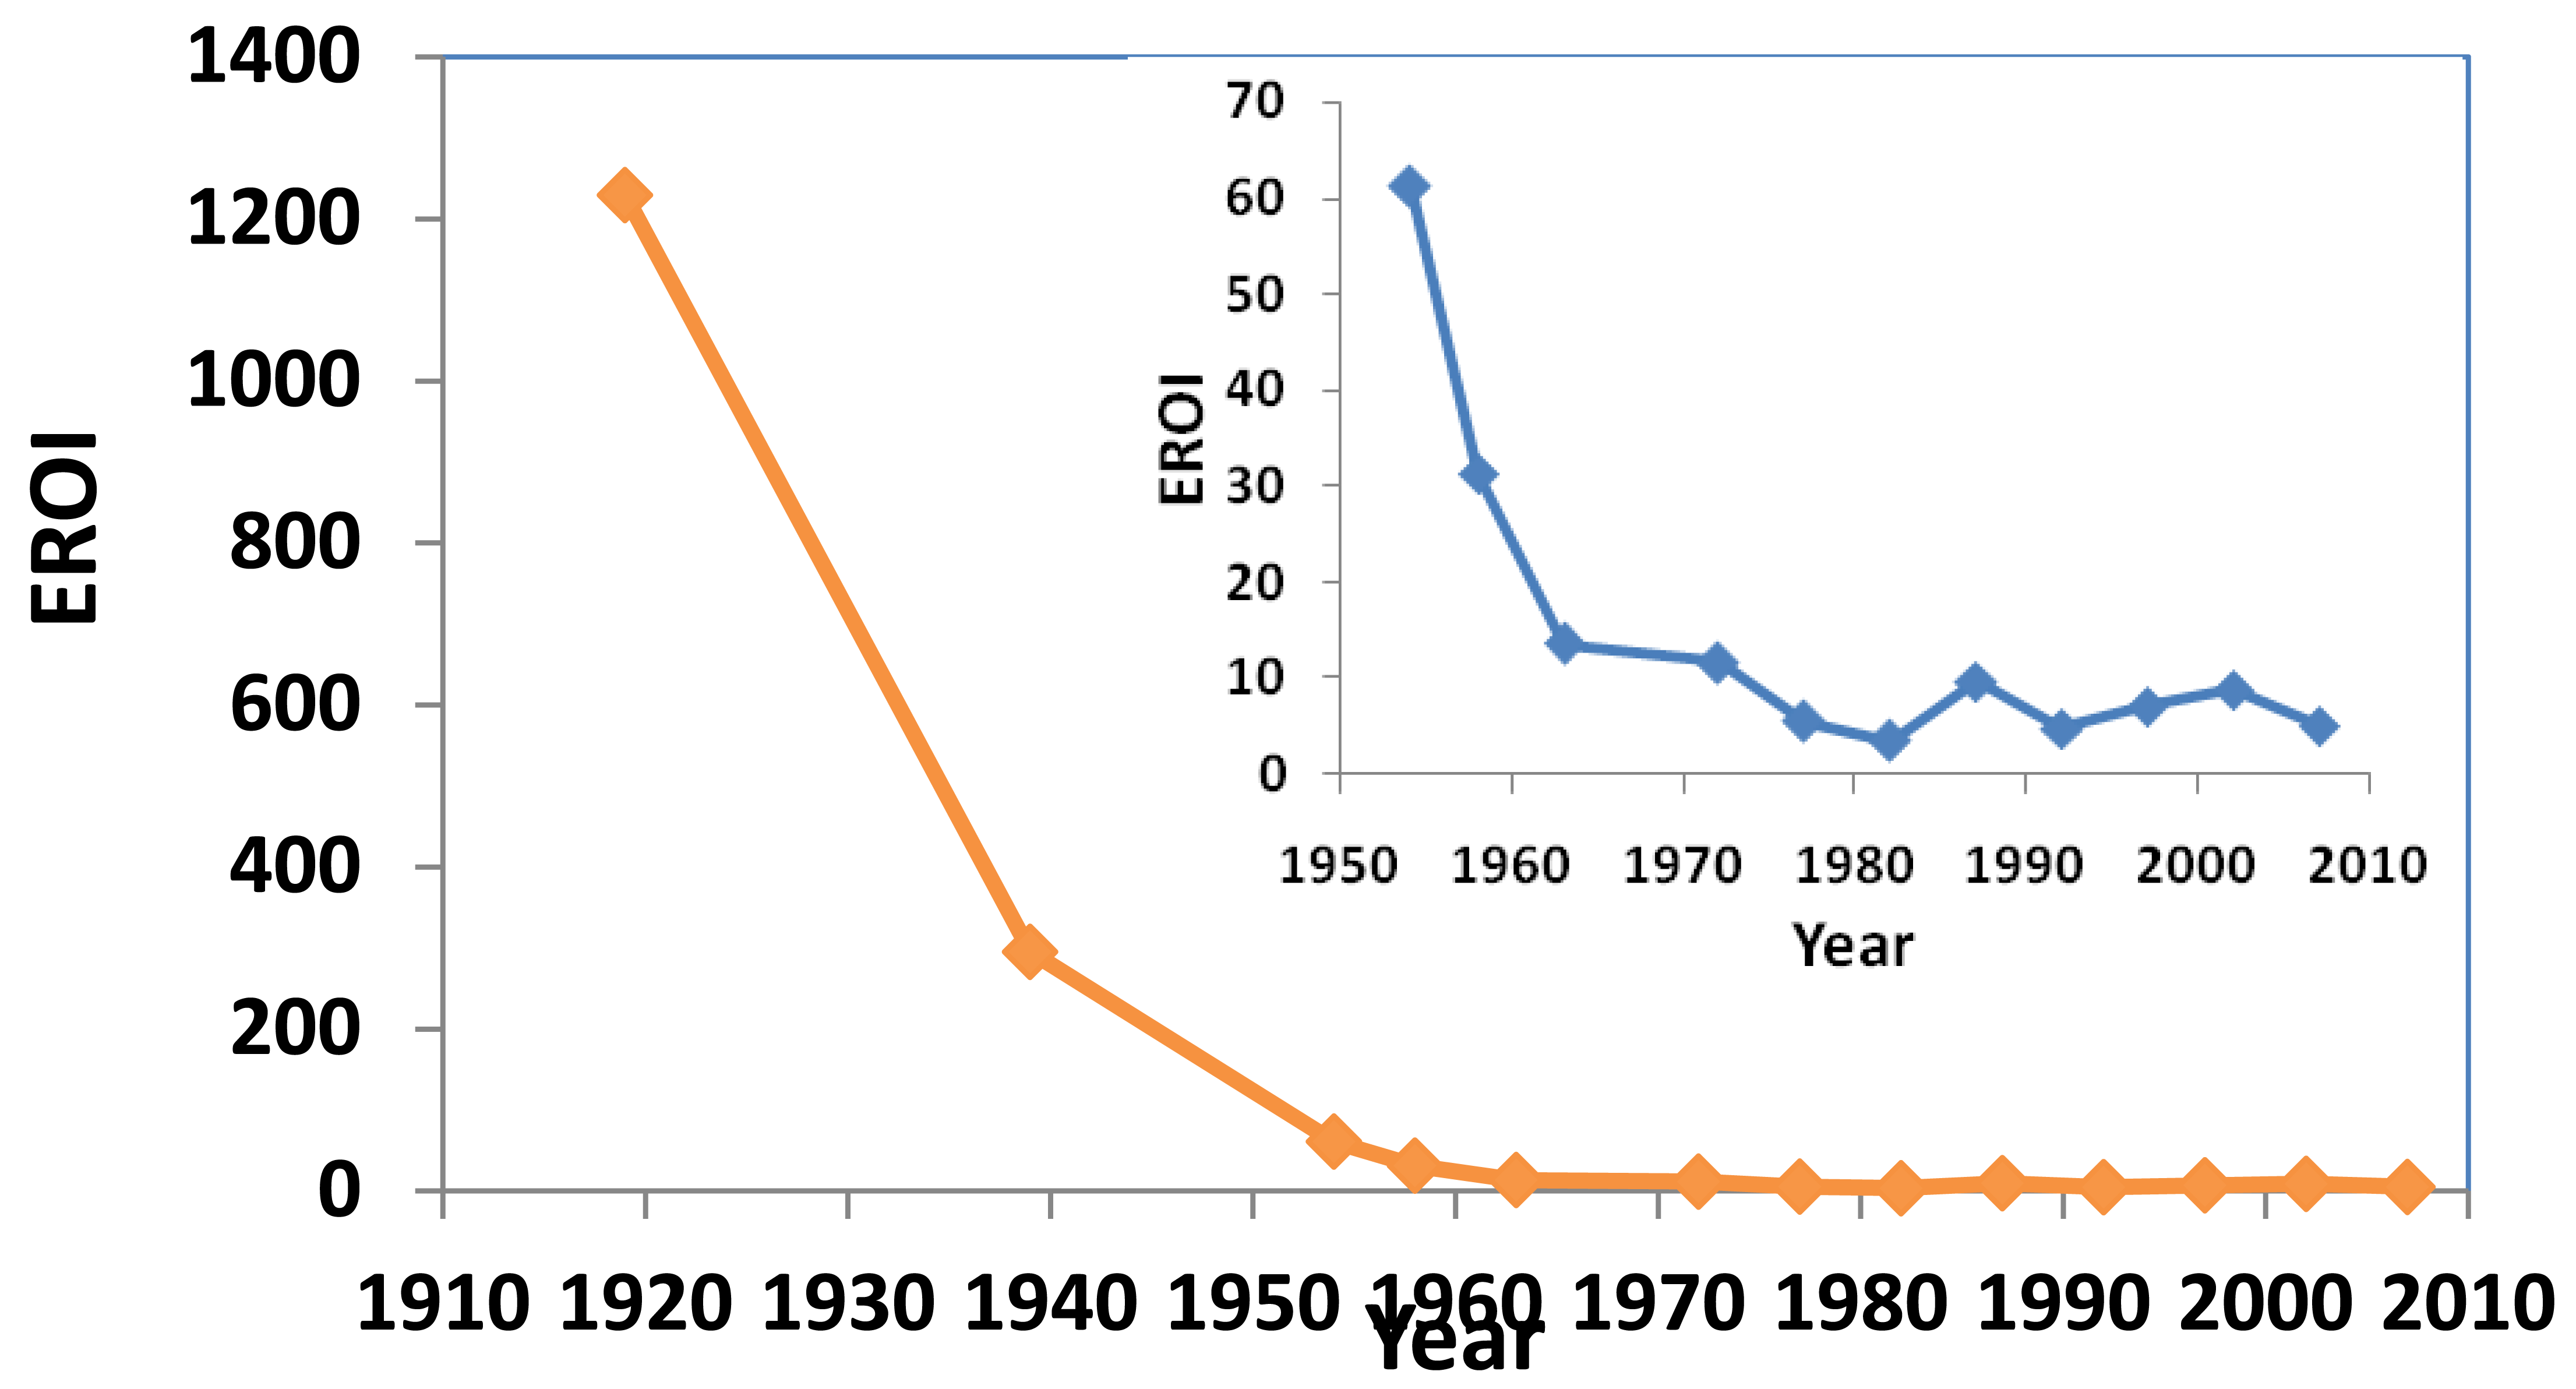
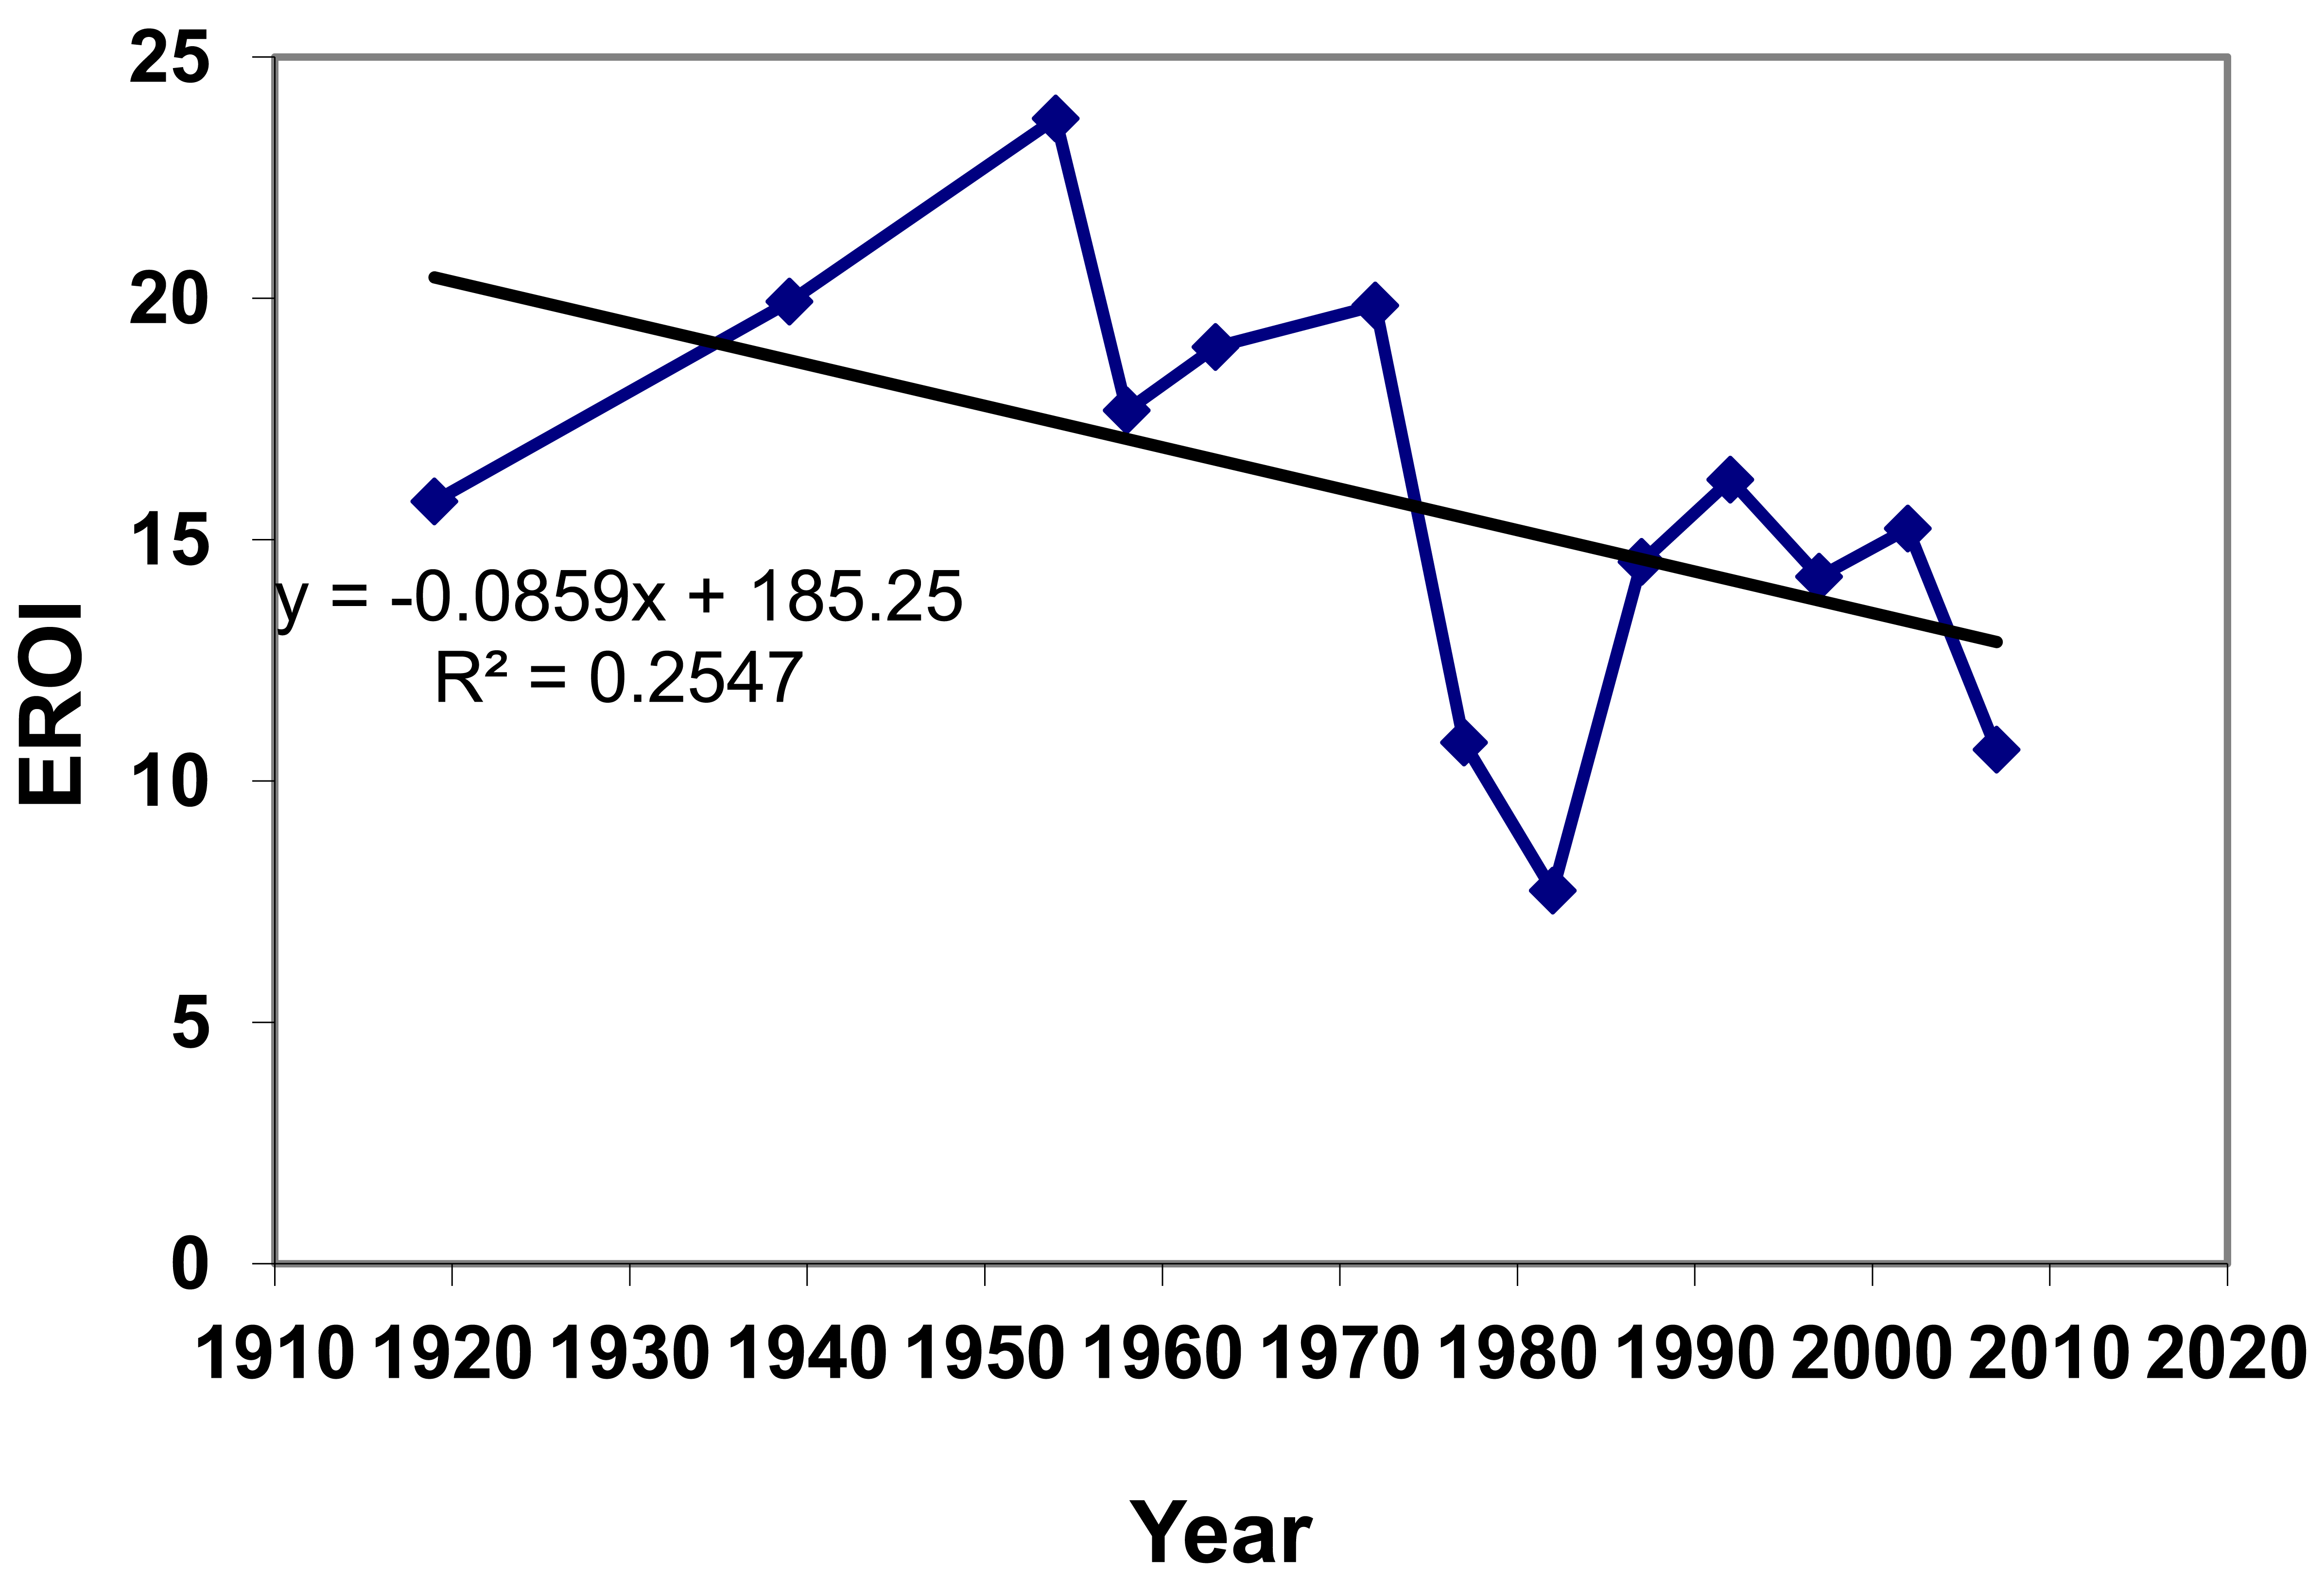
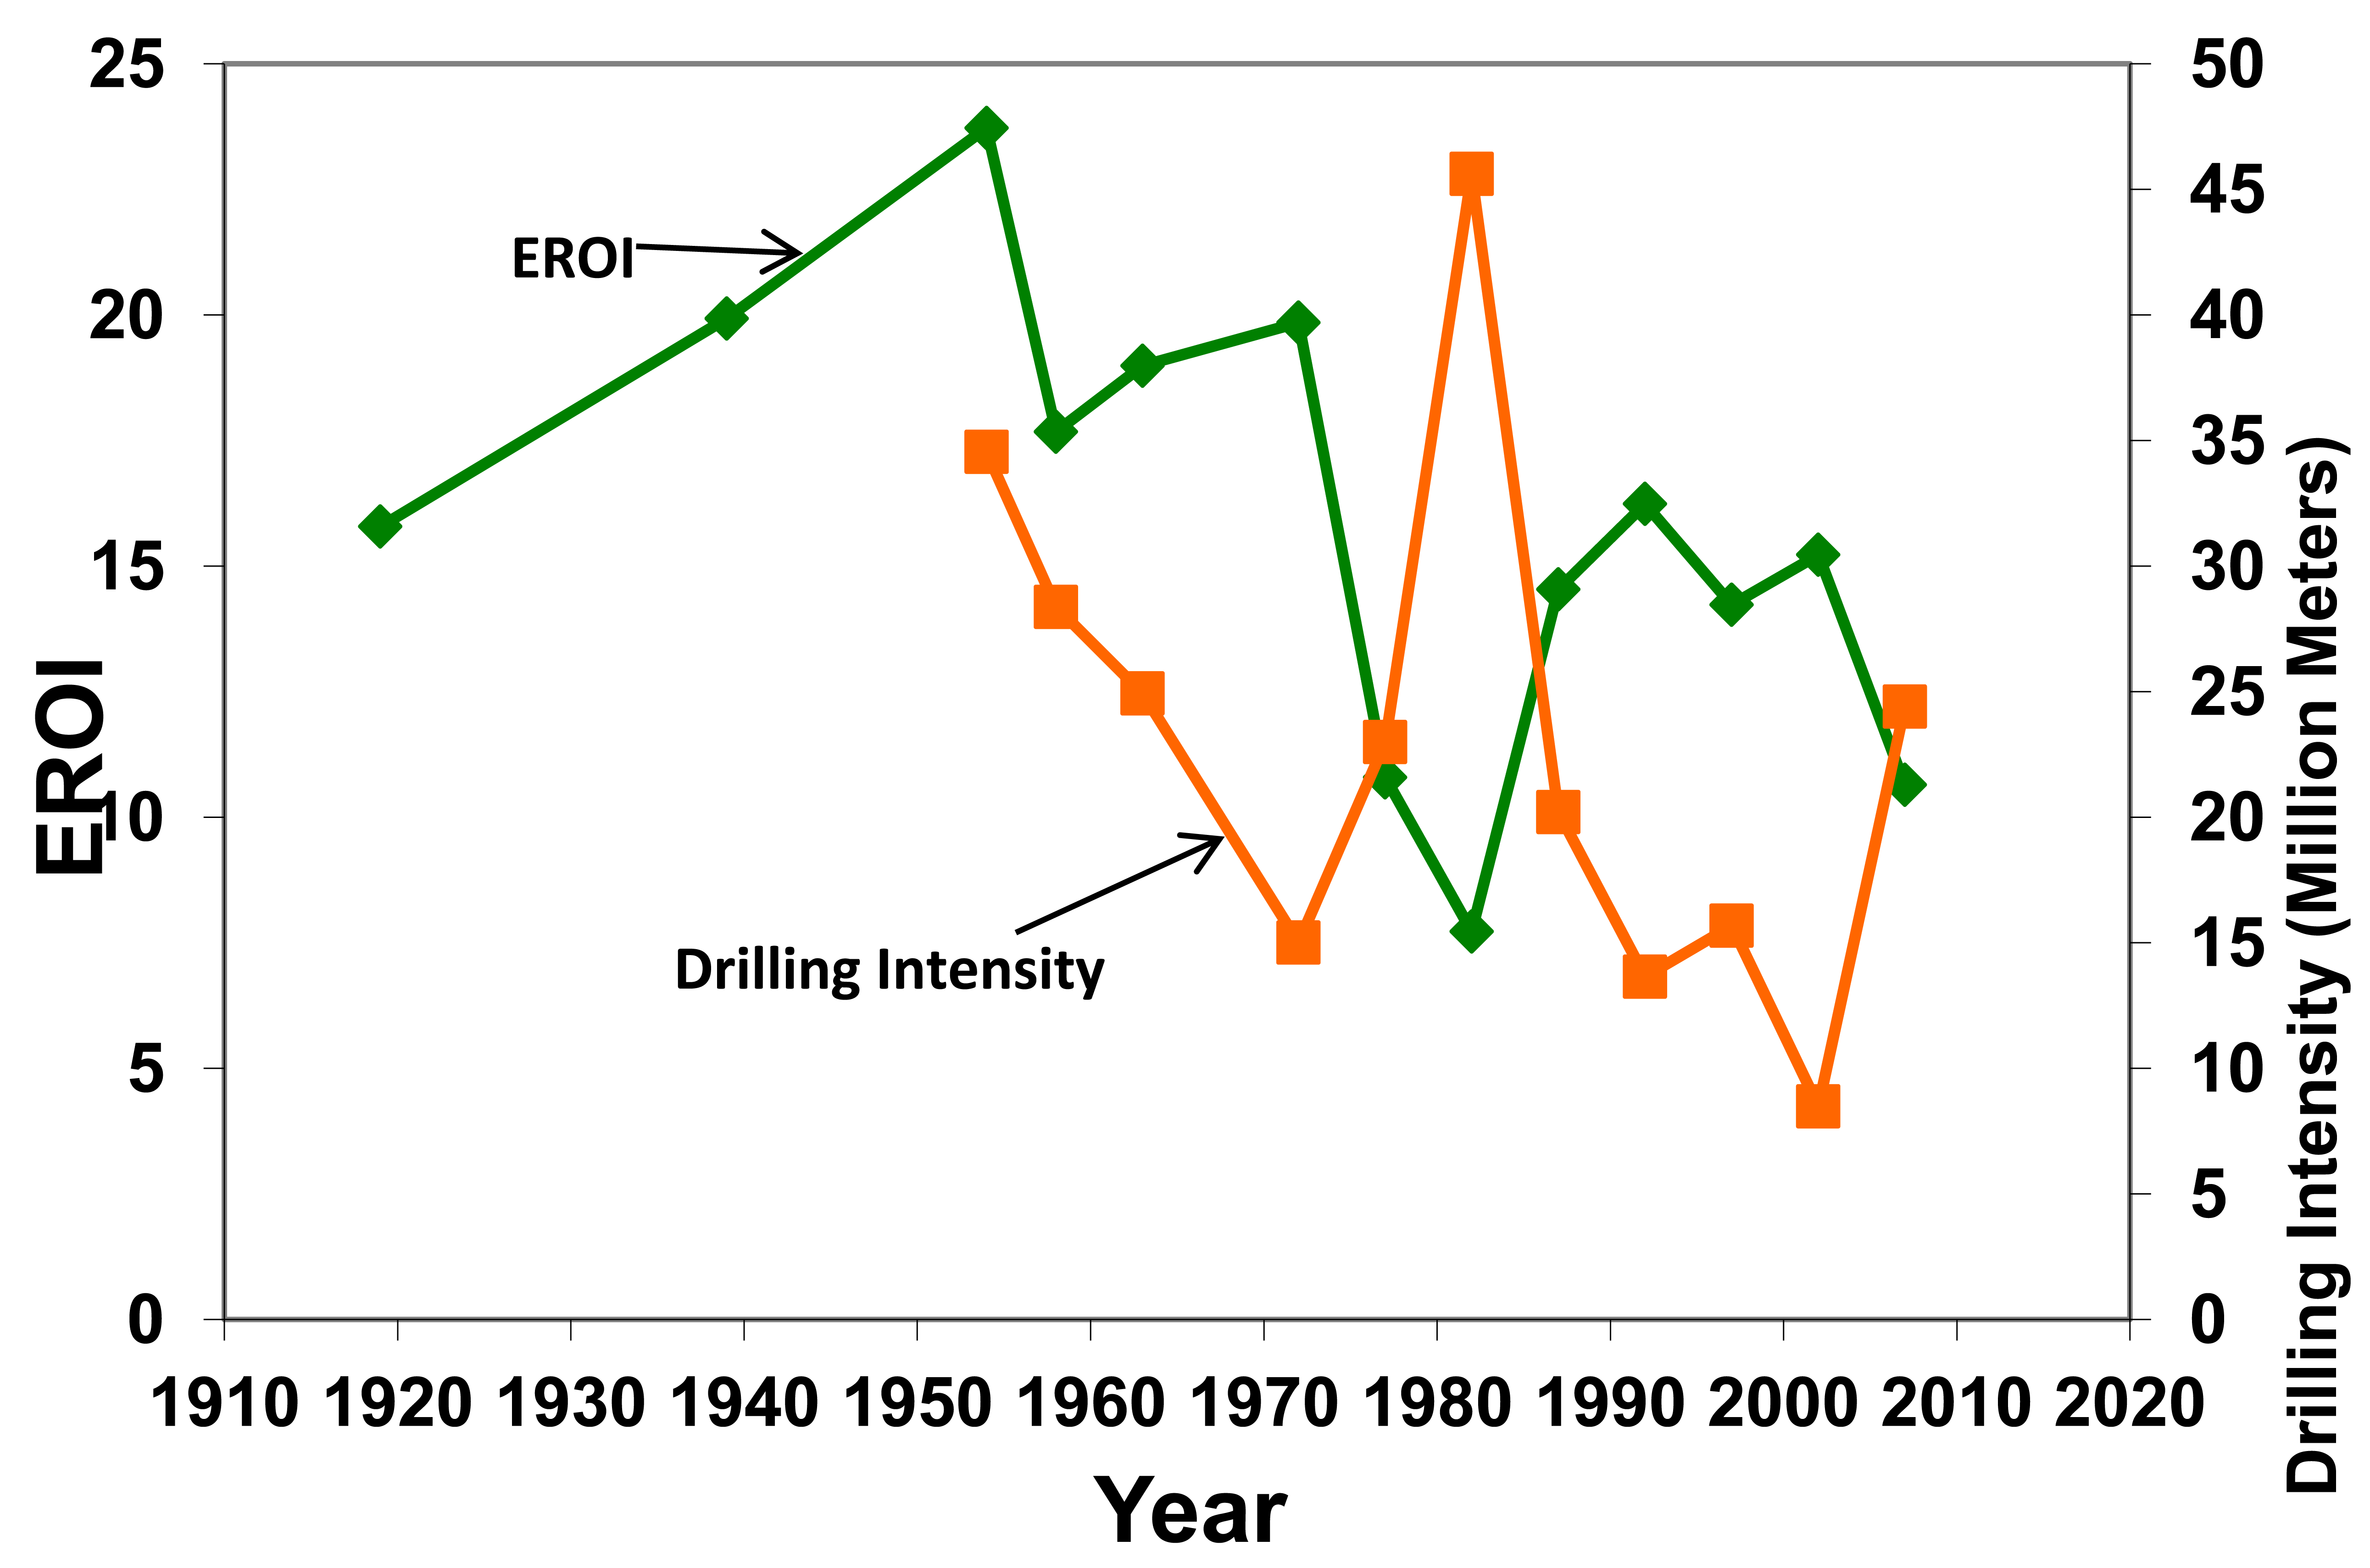
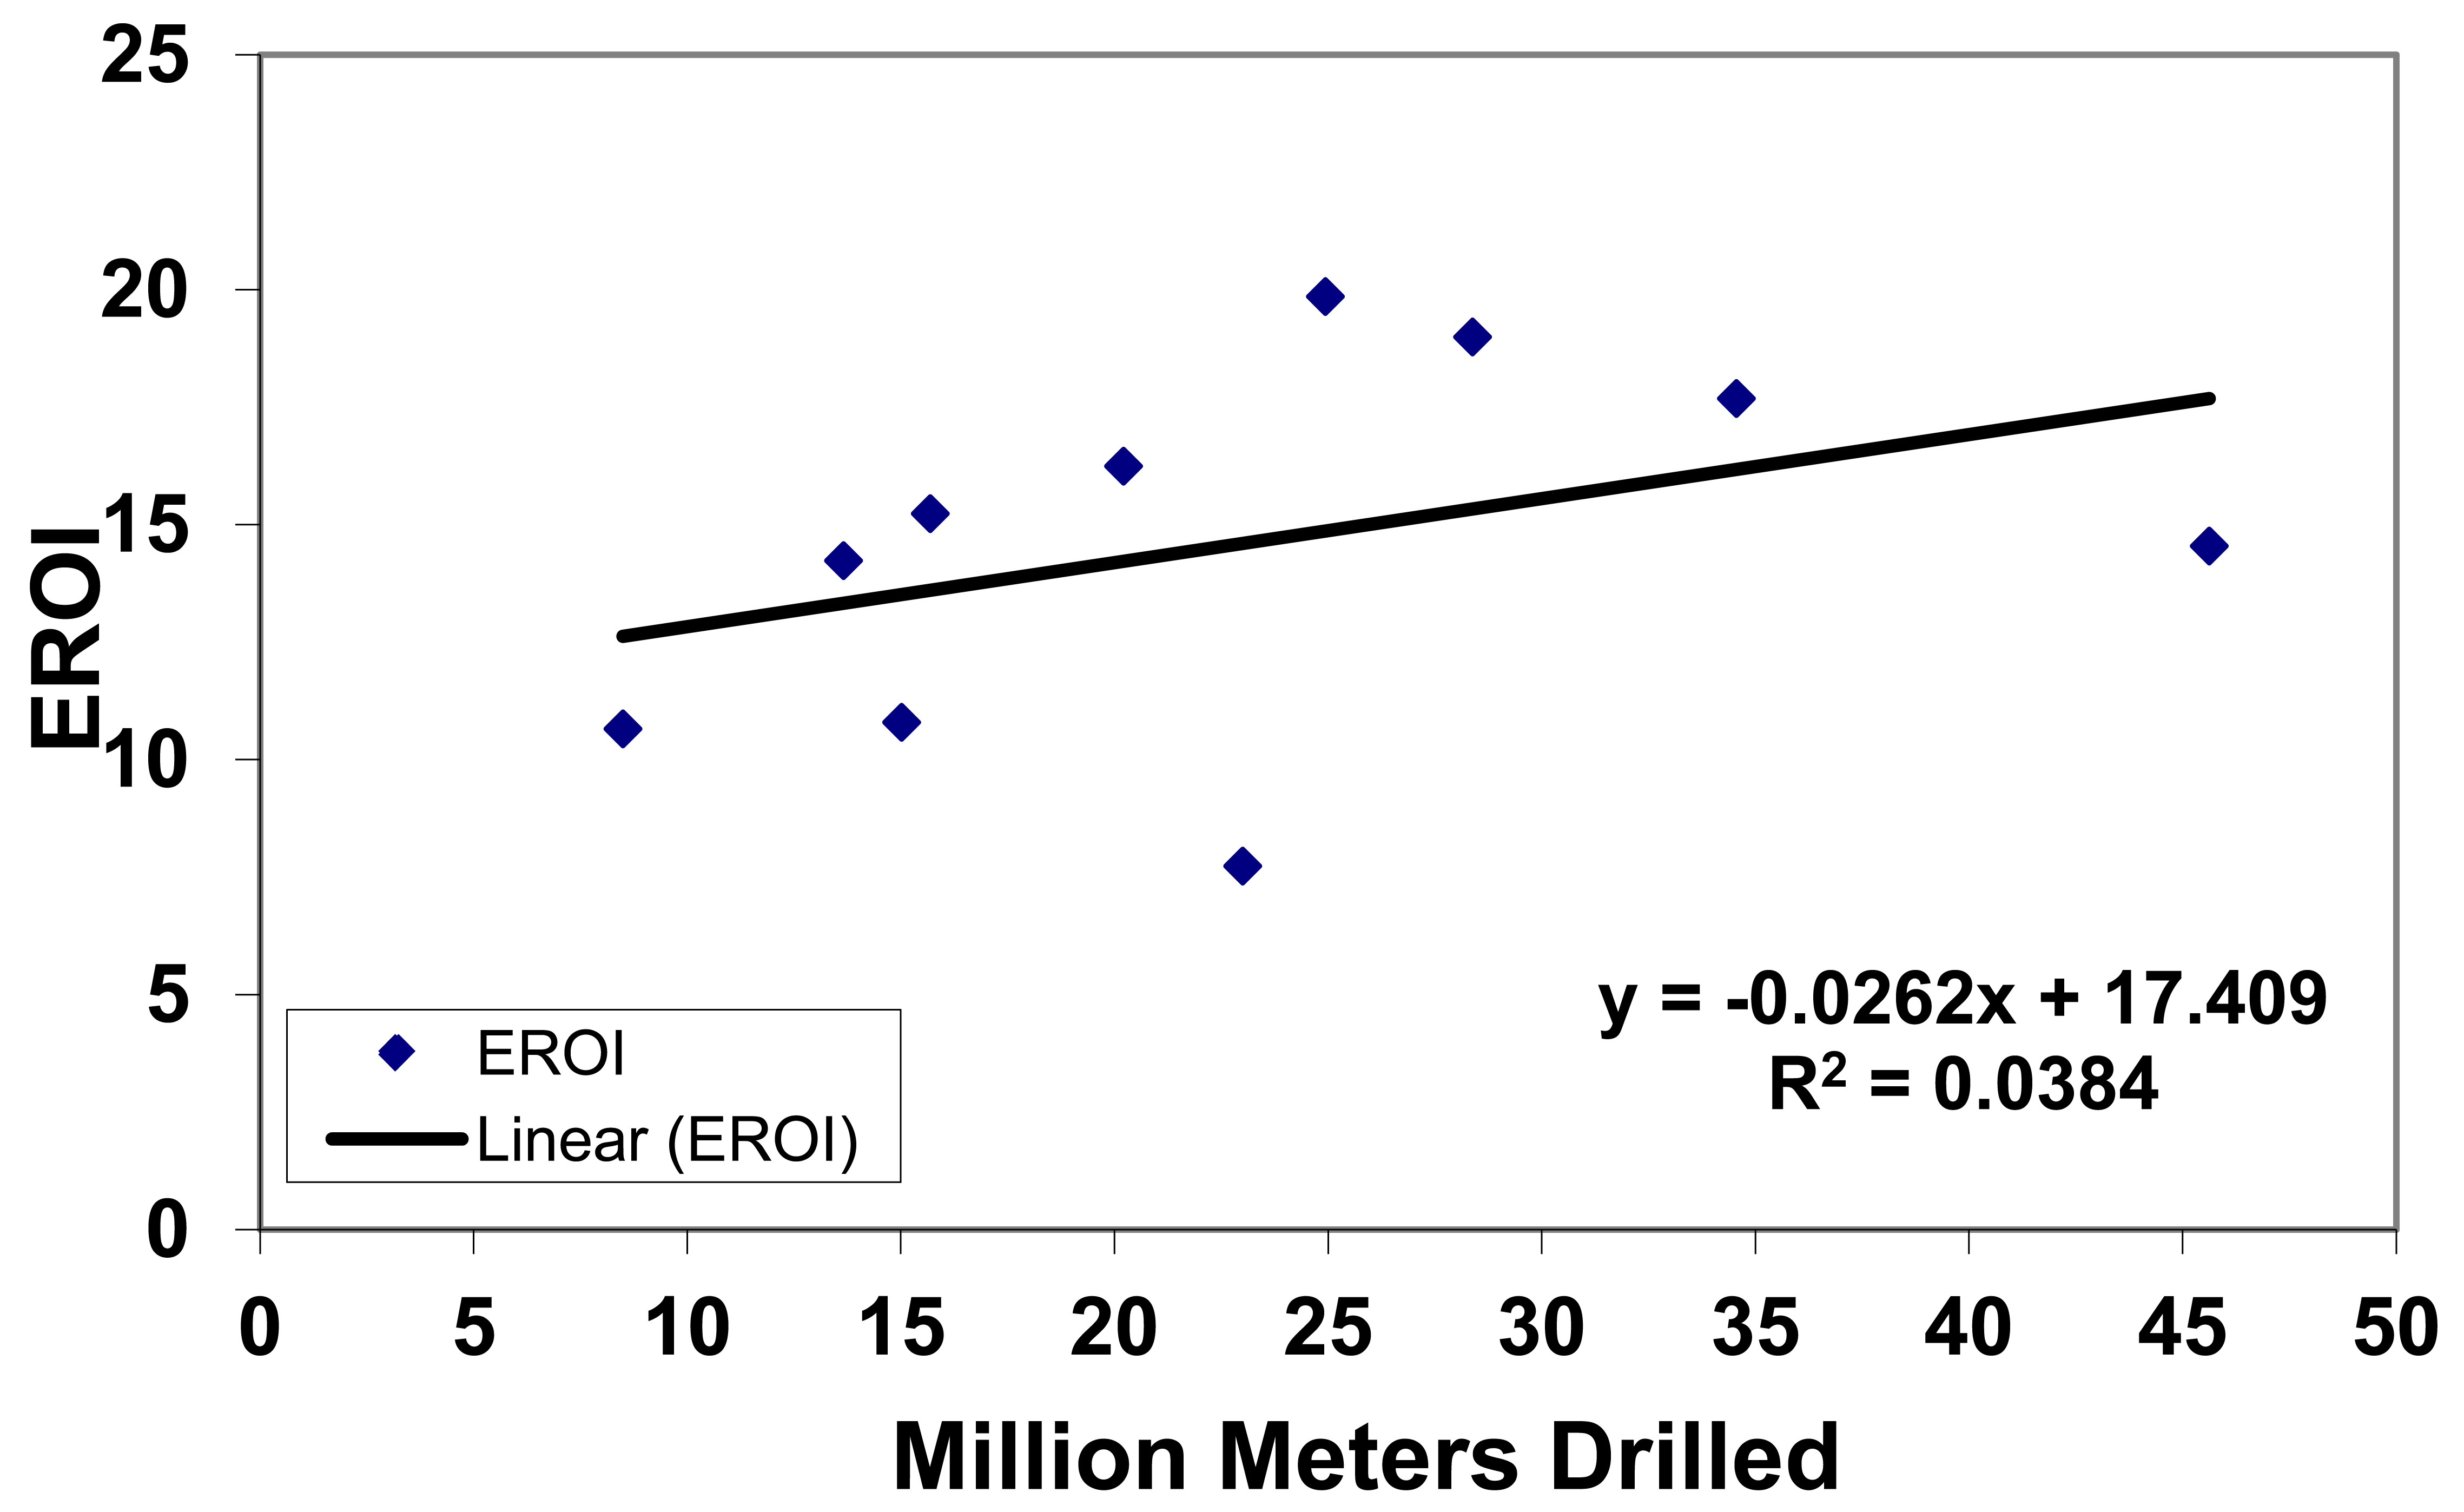
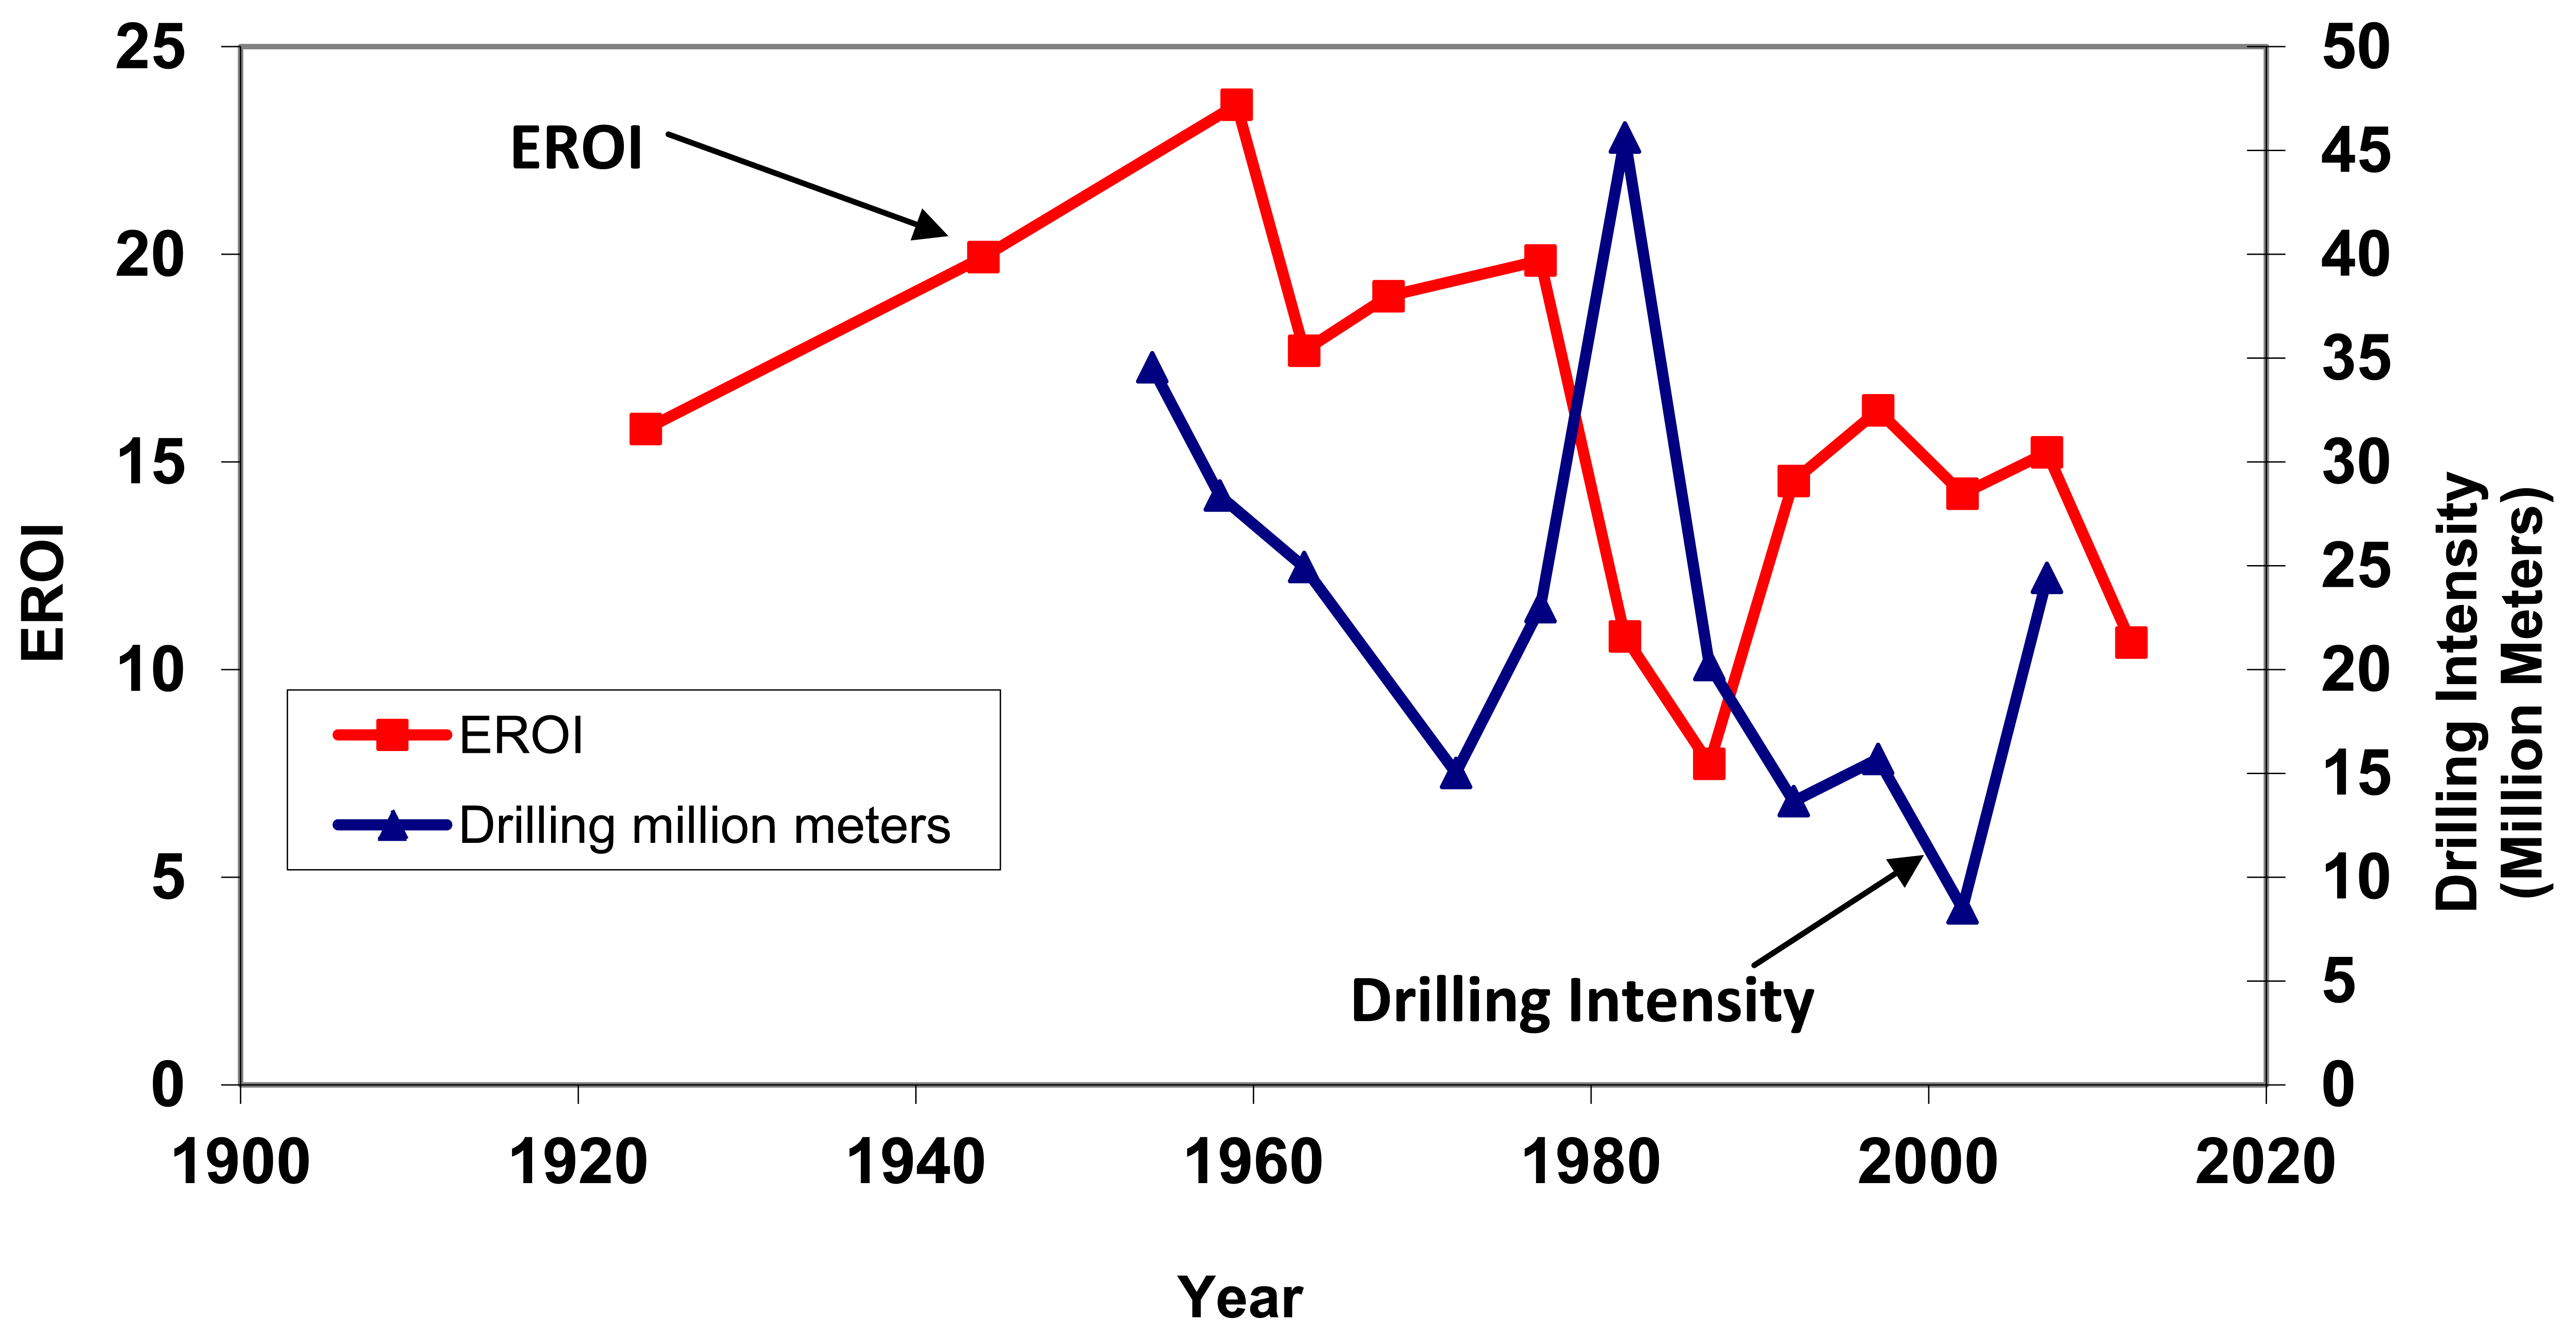
EROI for discoveries declined sharply from over 1200 to 1 for 1919 to 5:1 in 2007 (Figure 1 and Table 5). EROI for production of the oil and gas industry (with no quality corrections) were about 20:1 from 1919 to 1972, declined to about 8:1 in 1982, when peak drilling occurred, recovered to about 17:1 during low drilling years 1986–2002 and declined sharply to about 11:1 in the mid-late 2000s (Figure 2). There is an inverse relation between the energy return on investment and the drilling rates so that after 1957 EROI tends to be higher when the drilling rate is lower (Figure 3 and 3b).
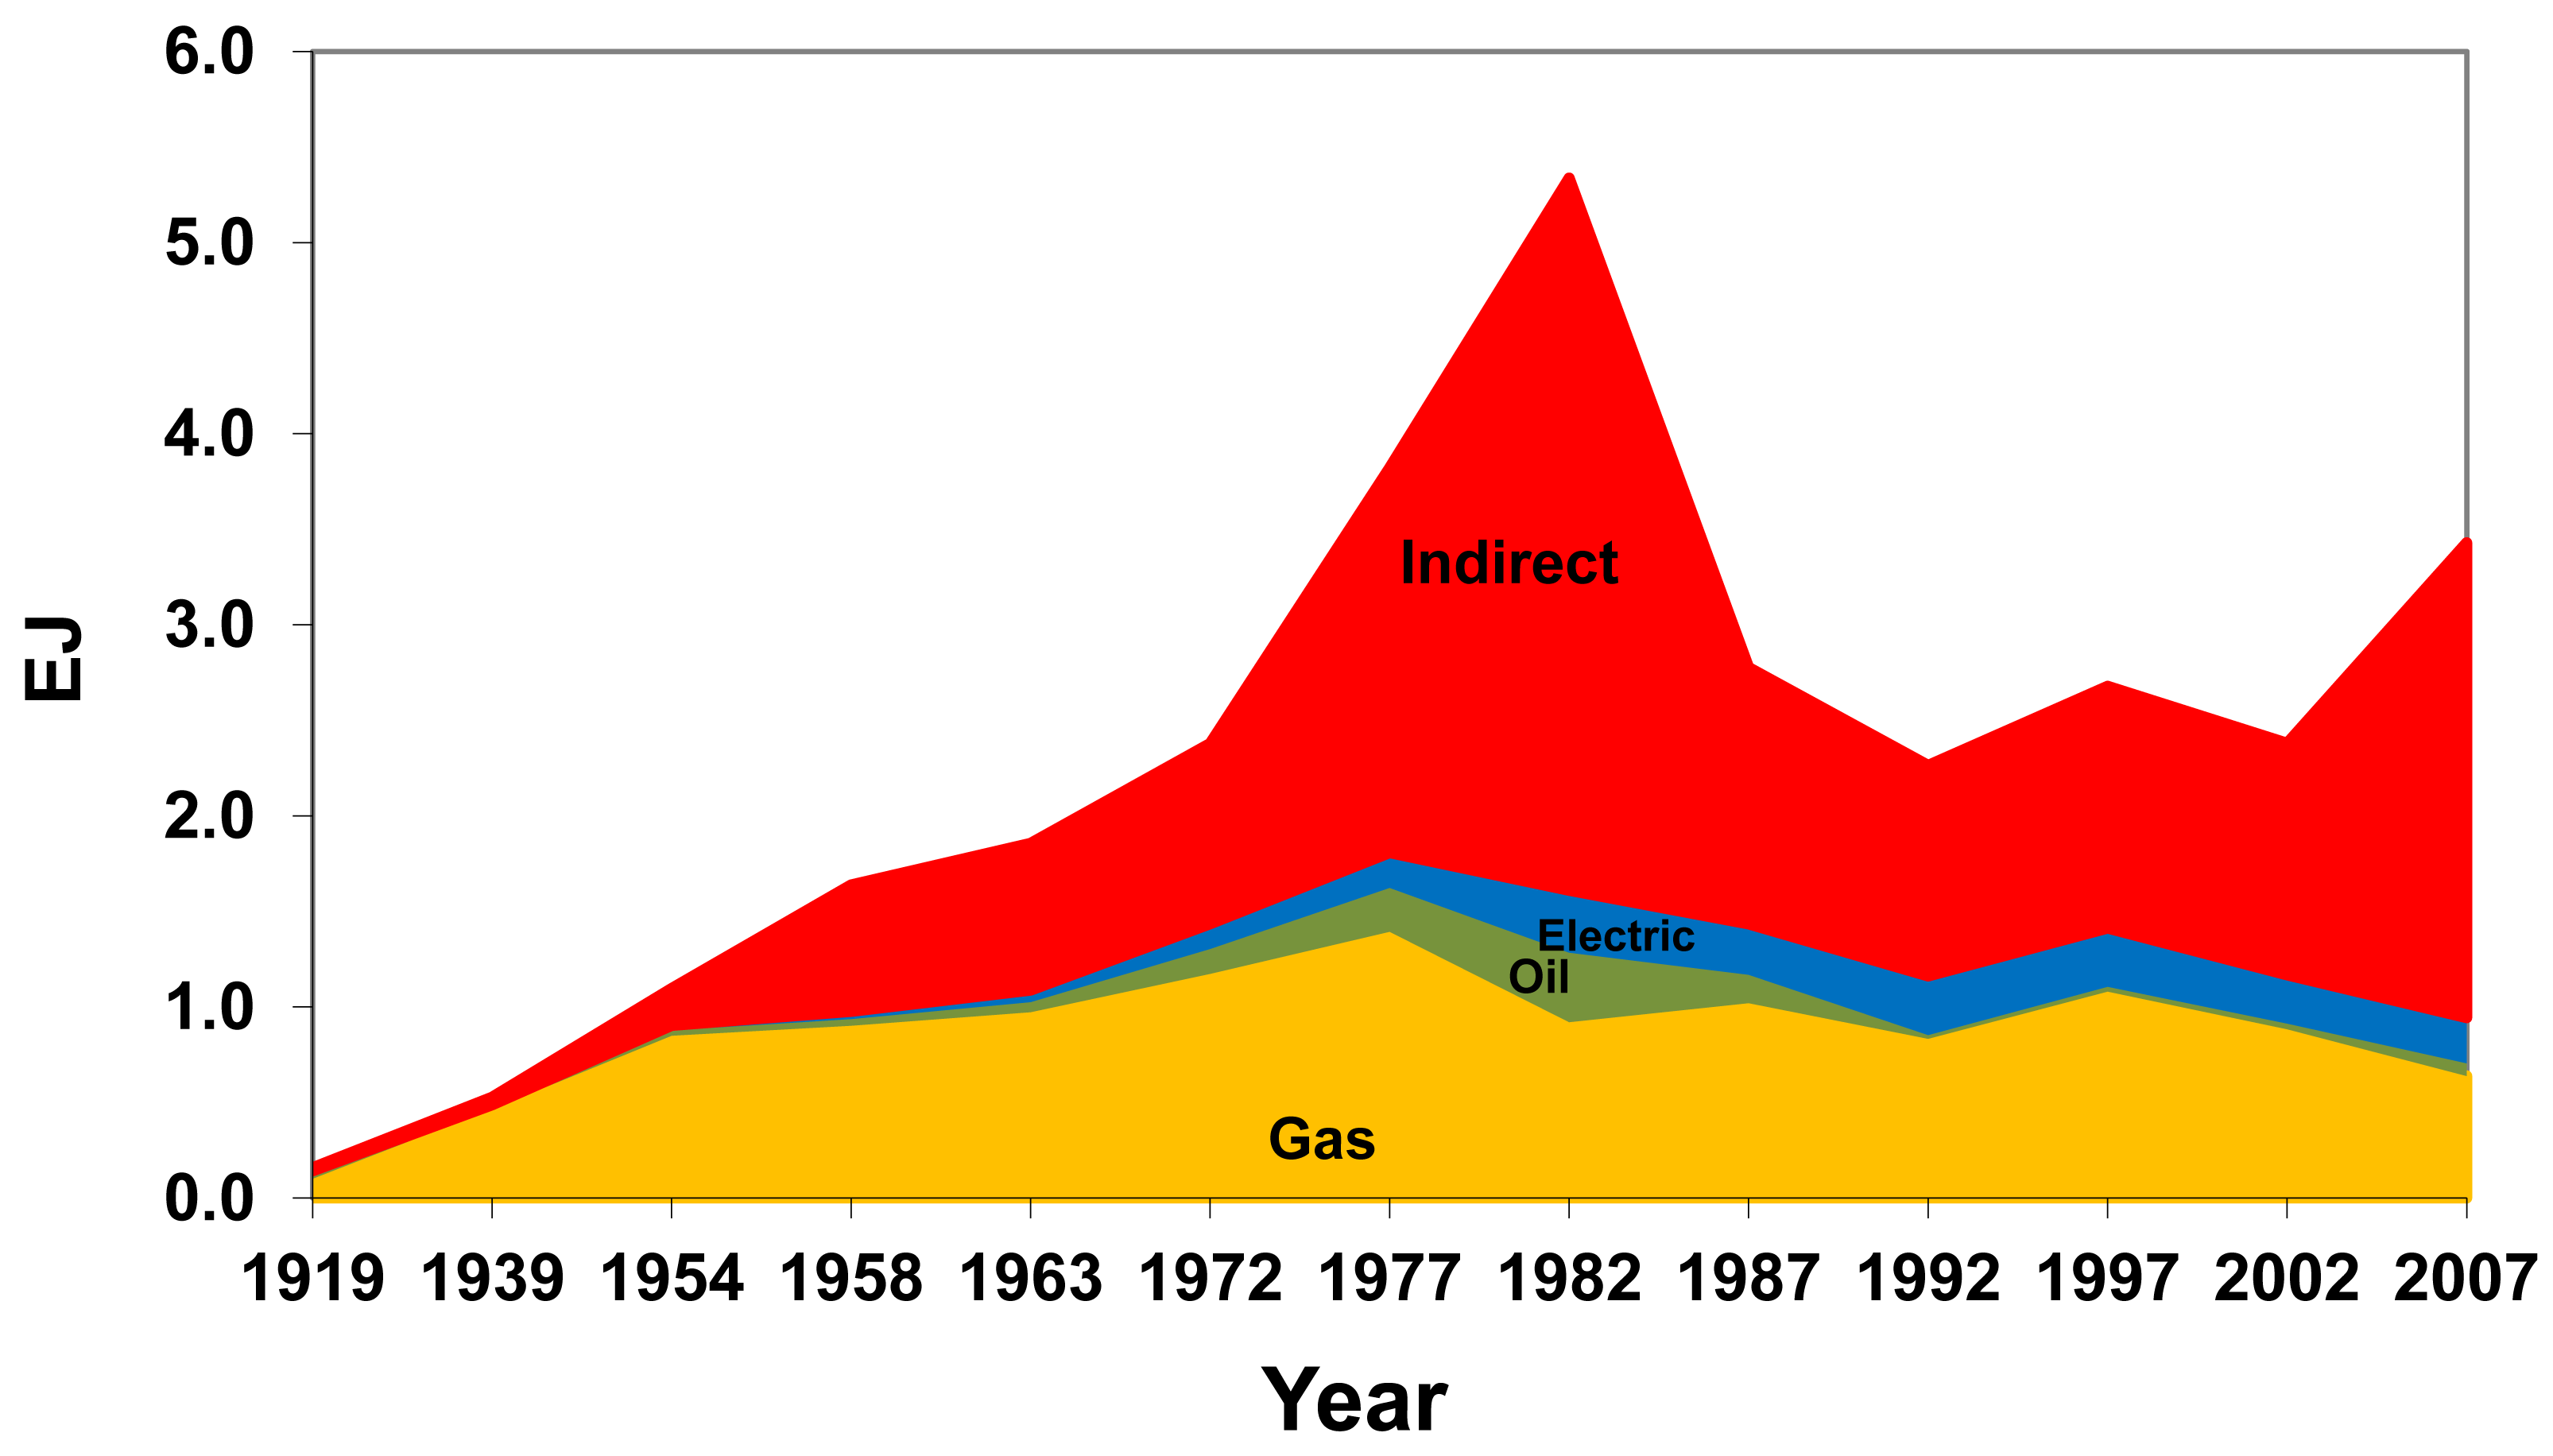
Energy input: The input of energy is dominated by the energy required to make equipment and then natural gas used on site. There was a sharp peak in 1982 following the price increases of the 1970s and a second, smaller peak in 2007 (Figure 5 and Table A-1 in Appendix).
3.1. Sensitivity Analysis of Results
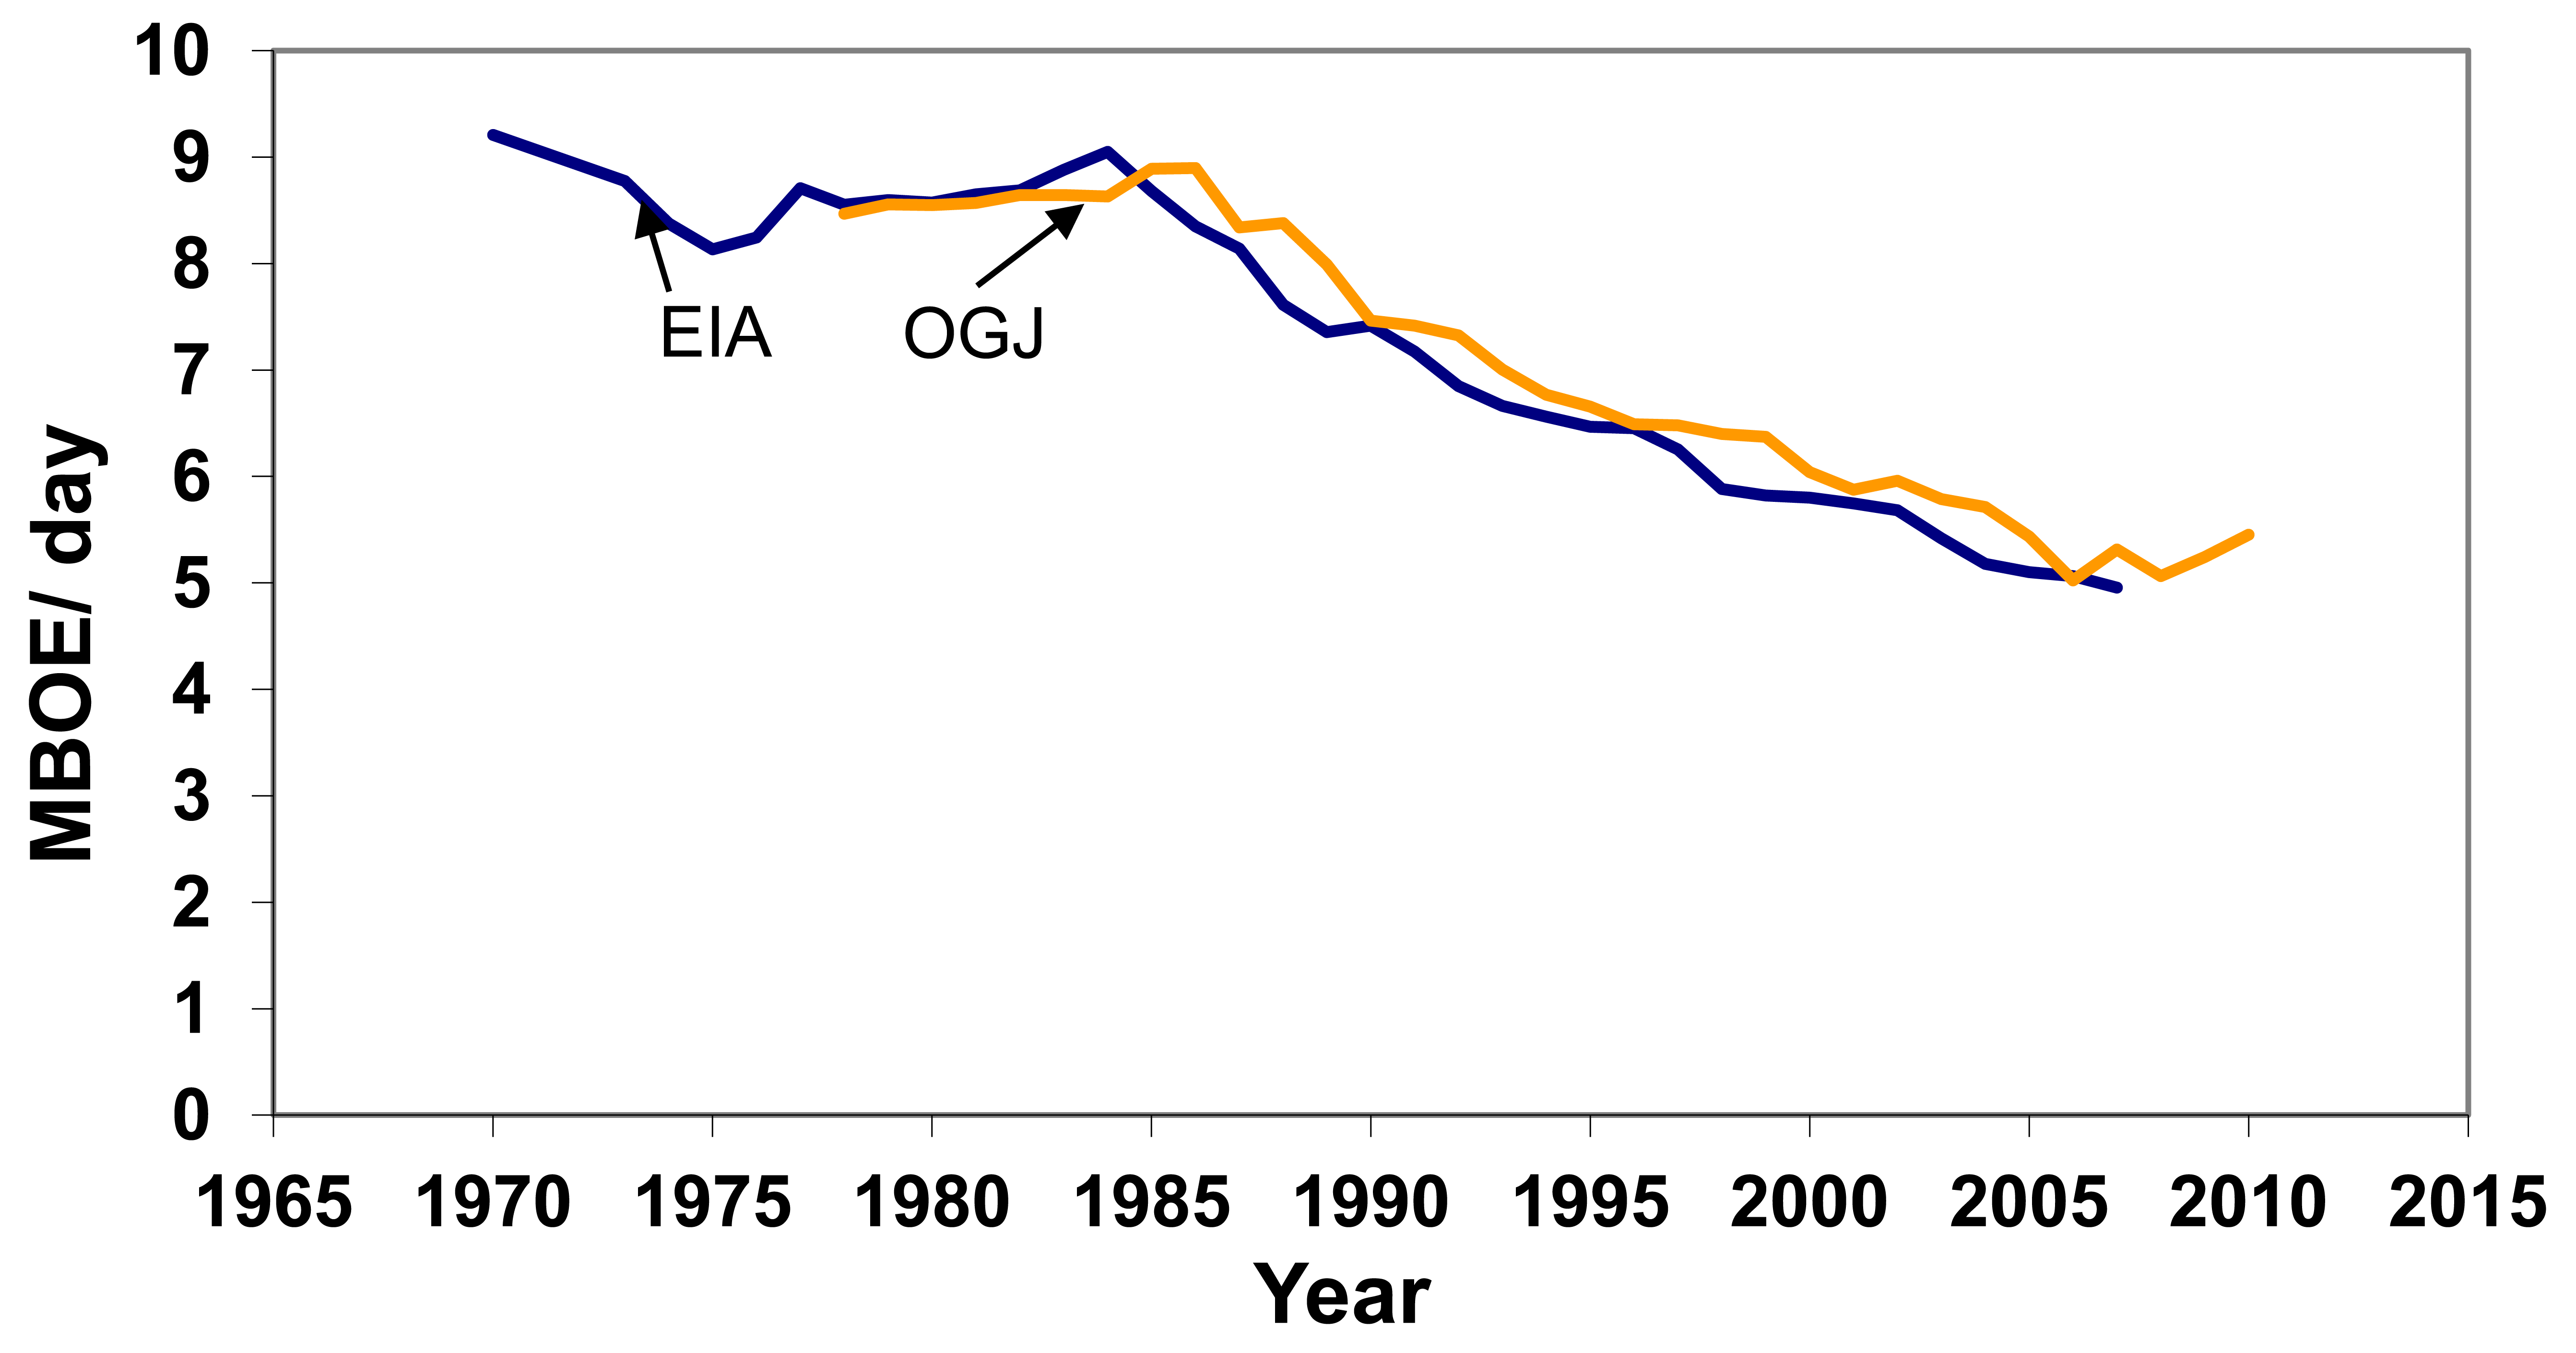
Energy output: The production of oil and gas increased from 422 million barrels oil equivalent (BOE) in 1919 to a peak of 3,517 in 1970 and then declined to 1,811 in 2008. We compared EIA and Oil and Gas Journal of production data and they were not significantly different (Figure 6).
The greater direct energy consumption in the alternative analysis (caused by inferring values where CMI data is missing) partially offsets the reduced indirect energy consumption (caused by removing the natural gas feedstock from the materials purchased by the NGL sector). The resulting EROI is similar to, but slightly higher than, the EROI found in our original analysis.
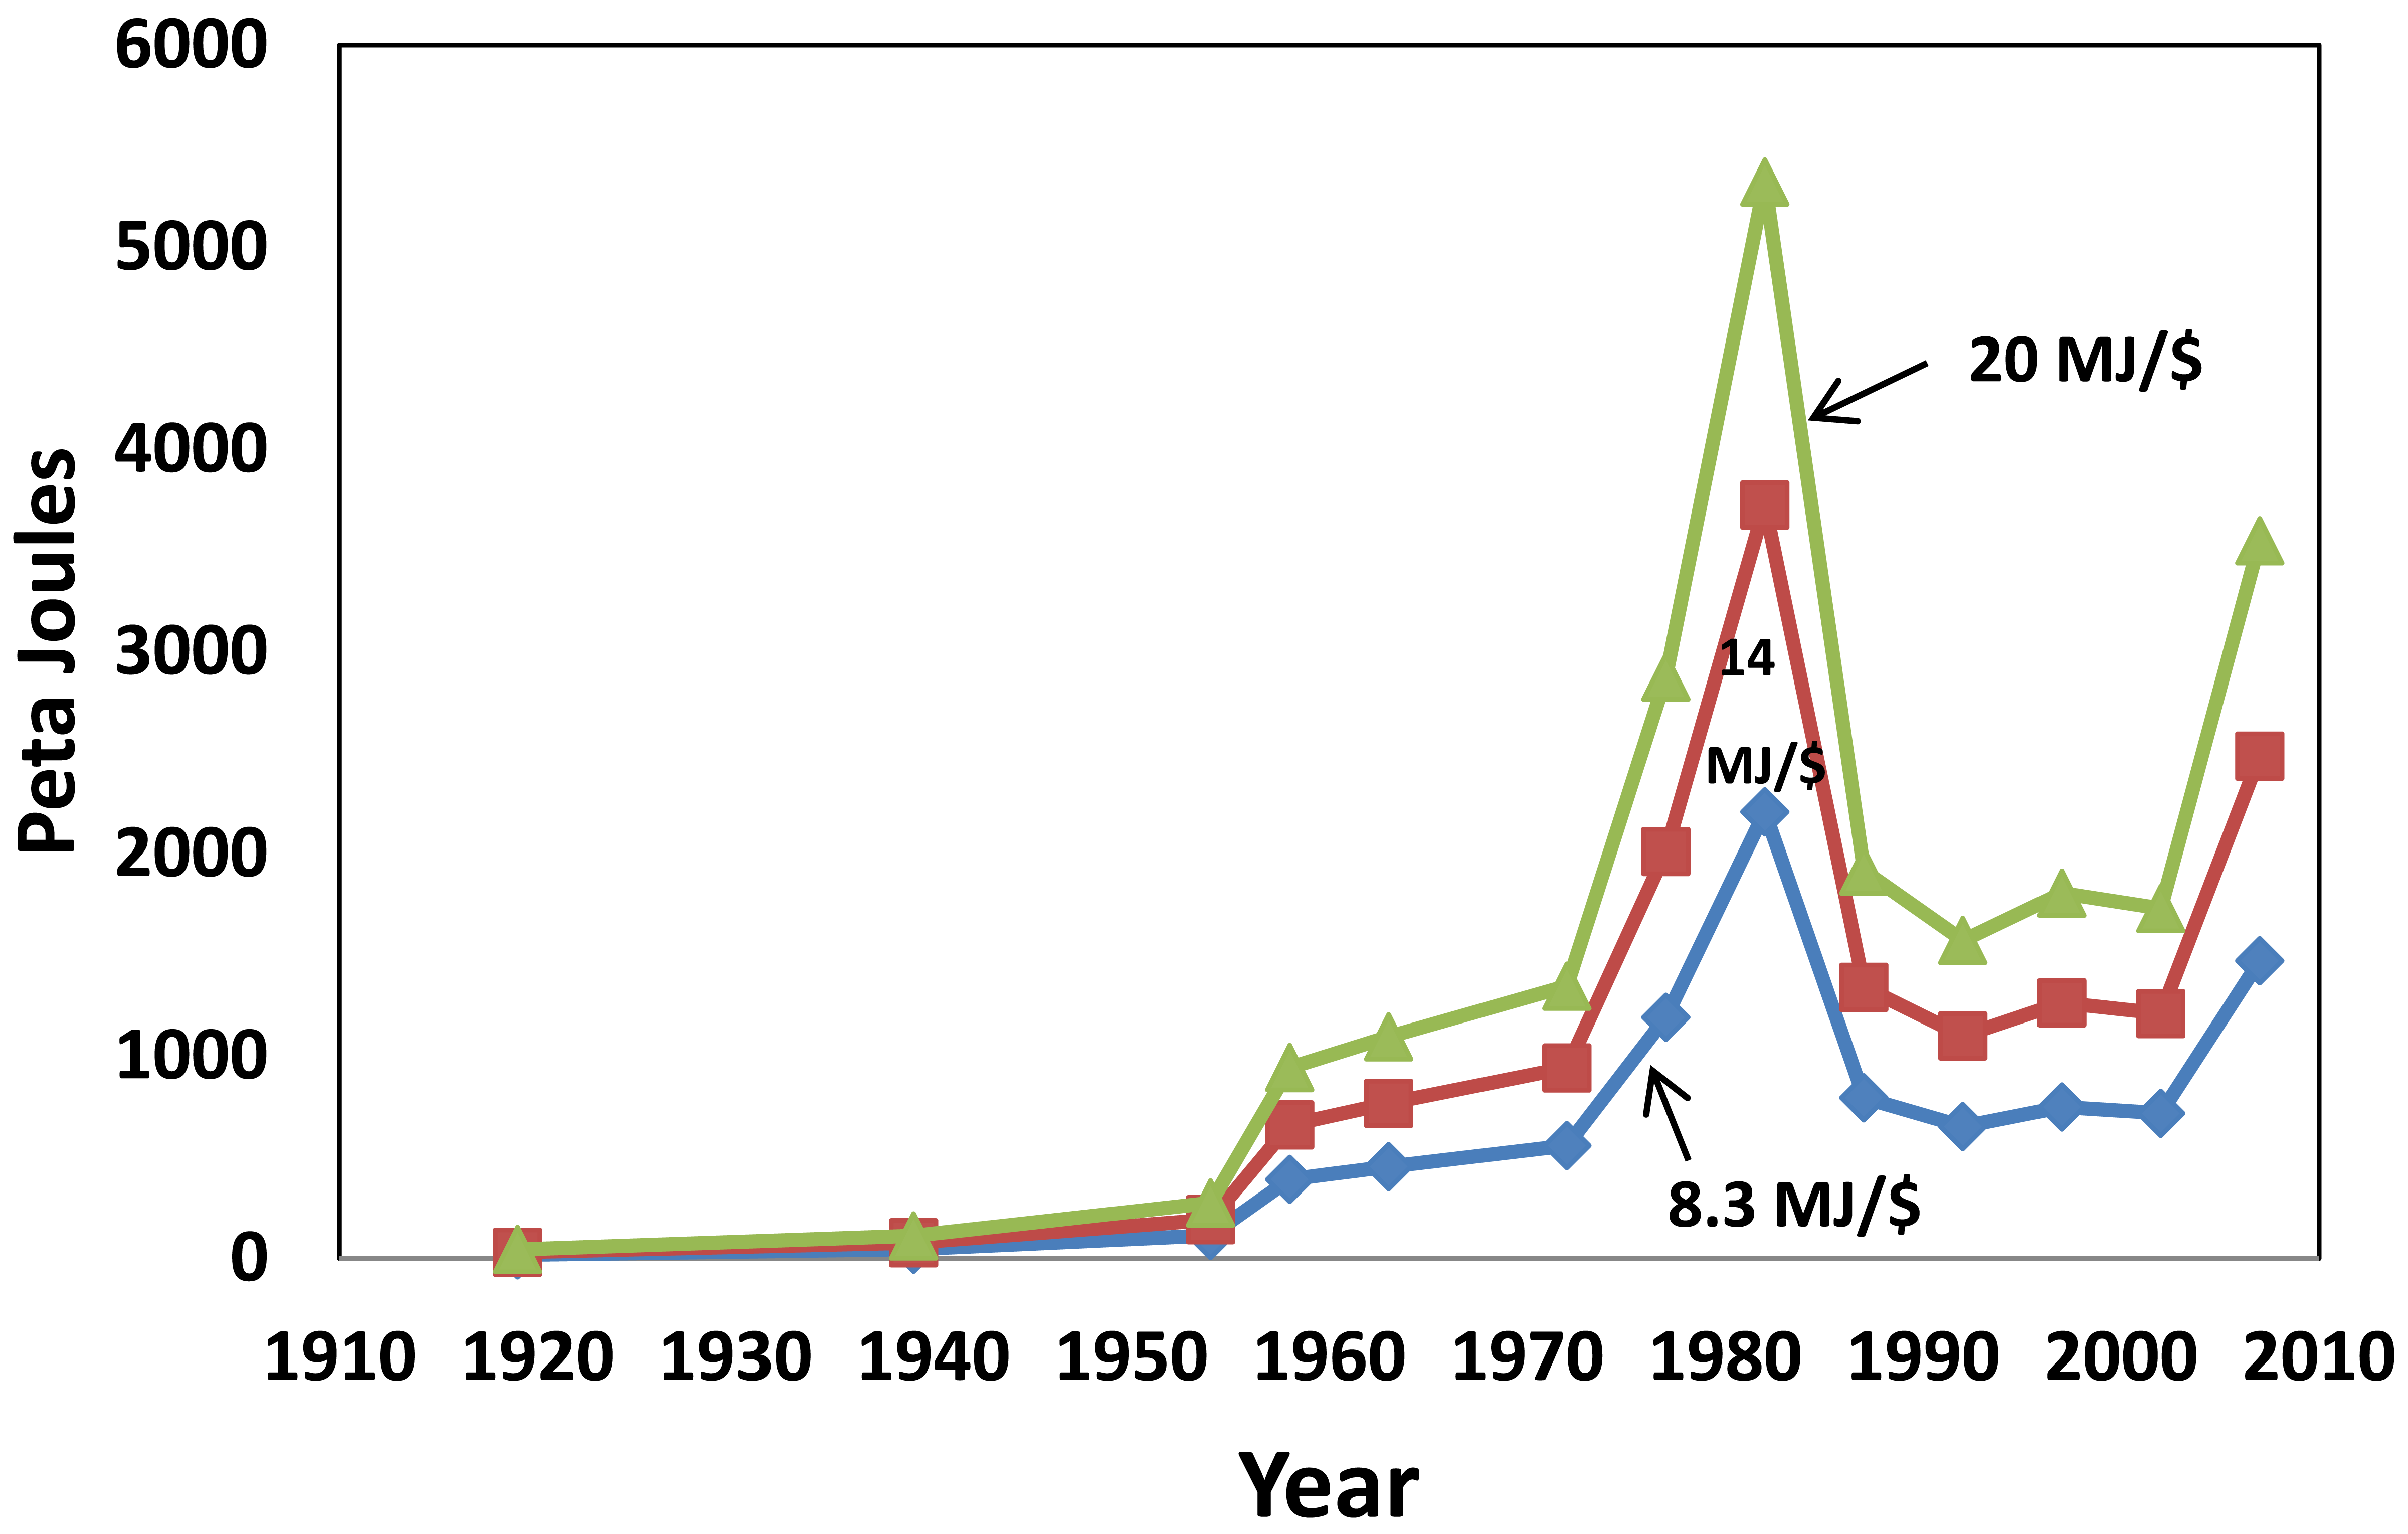
The energy intensity (i.e., the energy associated with each dollar spent for indirect expenditures is not known with certainty. One can derive a value of 14.5 MJ used per 2005 dollar spent from the Carnegie-Mellon Green energy web site for oil and gas exploration and discovery. We used a value of 8.3 MJ/$ (average for the entire society for a minimum estimate, and a value of 20 MJ/$ (average for direct and indirect for the U.S. and UK oil and gas industry for 2005 [6] for an upper limit (Figure 7). This sensitivity analysis indicates a maximum difference of a little more than a factor of two. Since the indirect costs are about half of total costs these uncertainties would add no more than a little more than 25% uncertainty to the final EROI values. Since the middle value seems much the most likely the actual uncertainty is less than this.
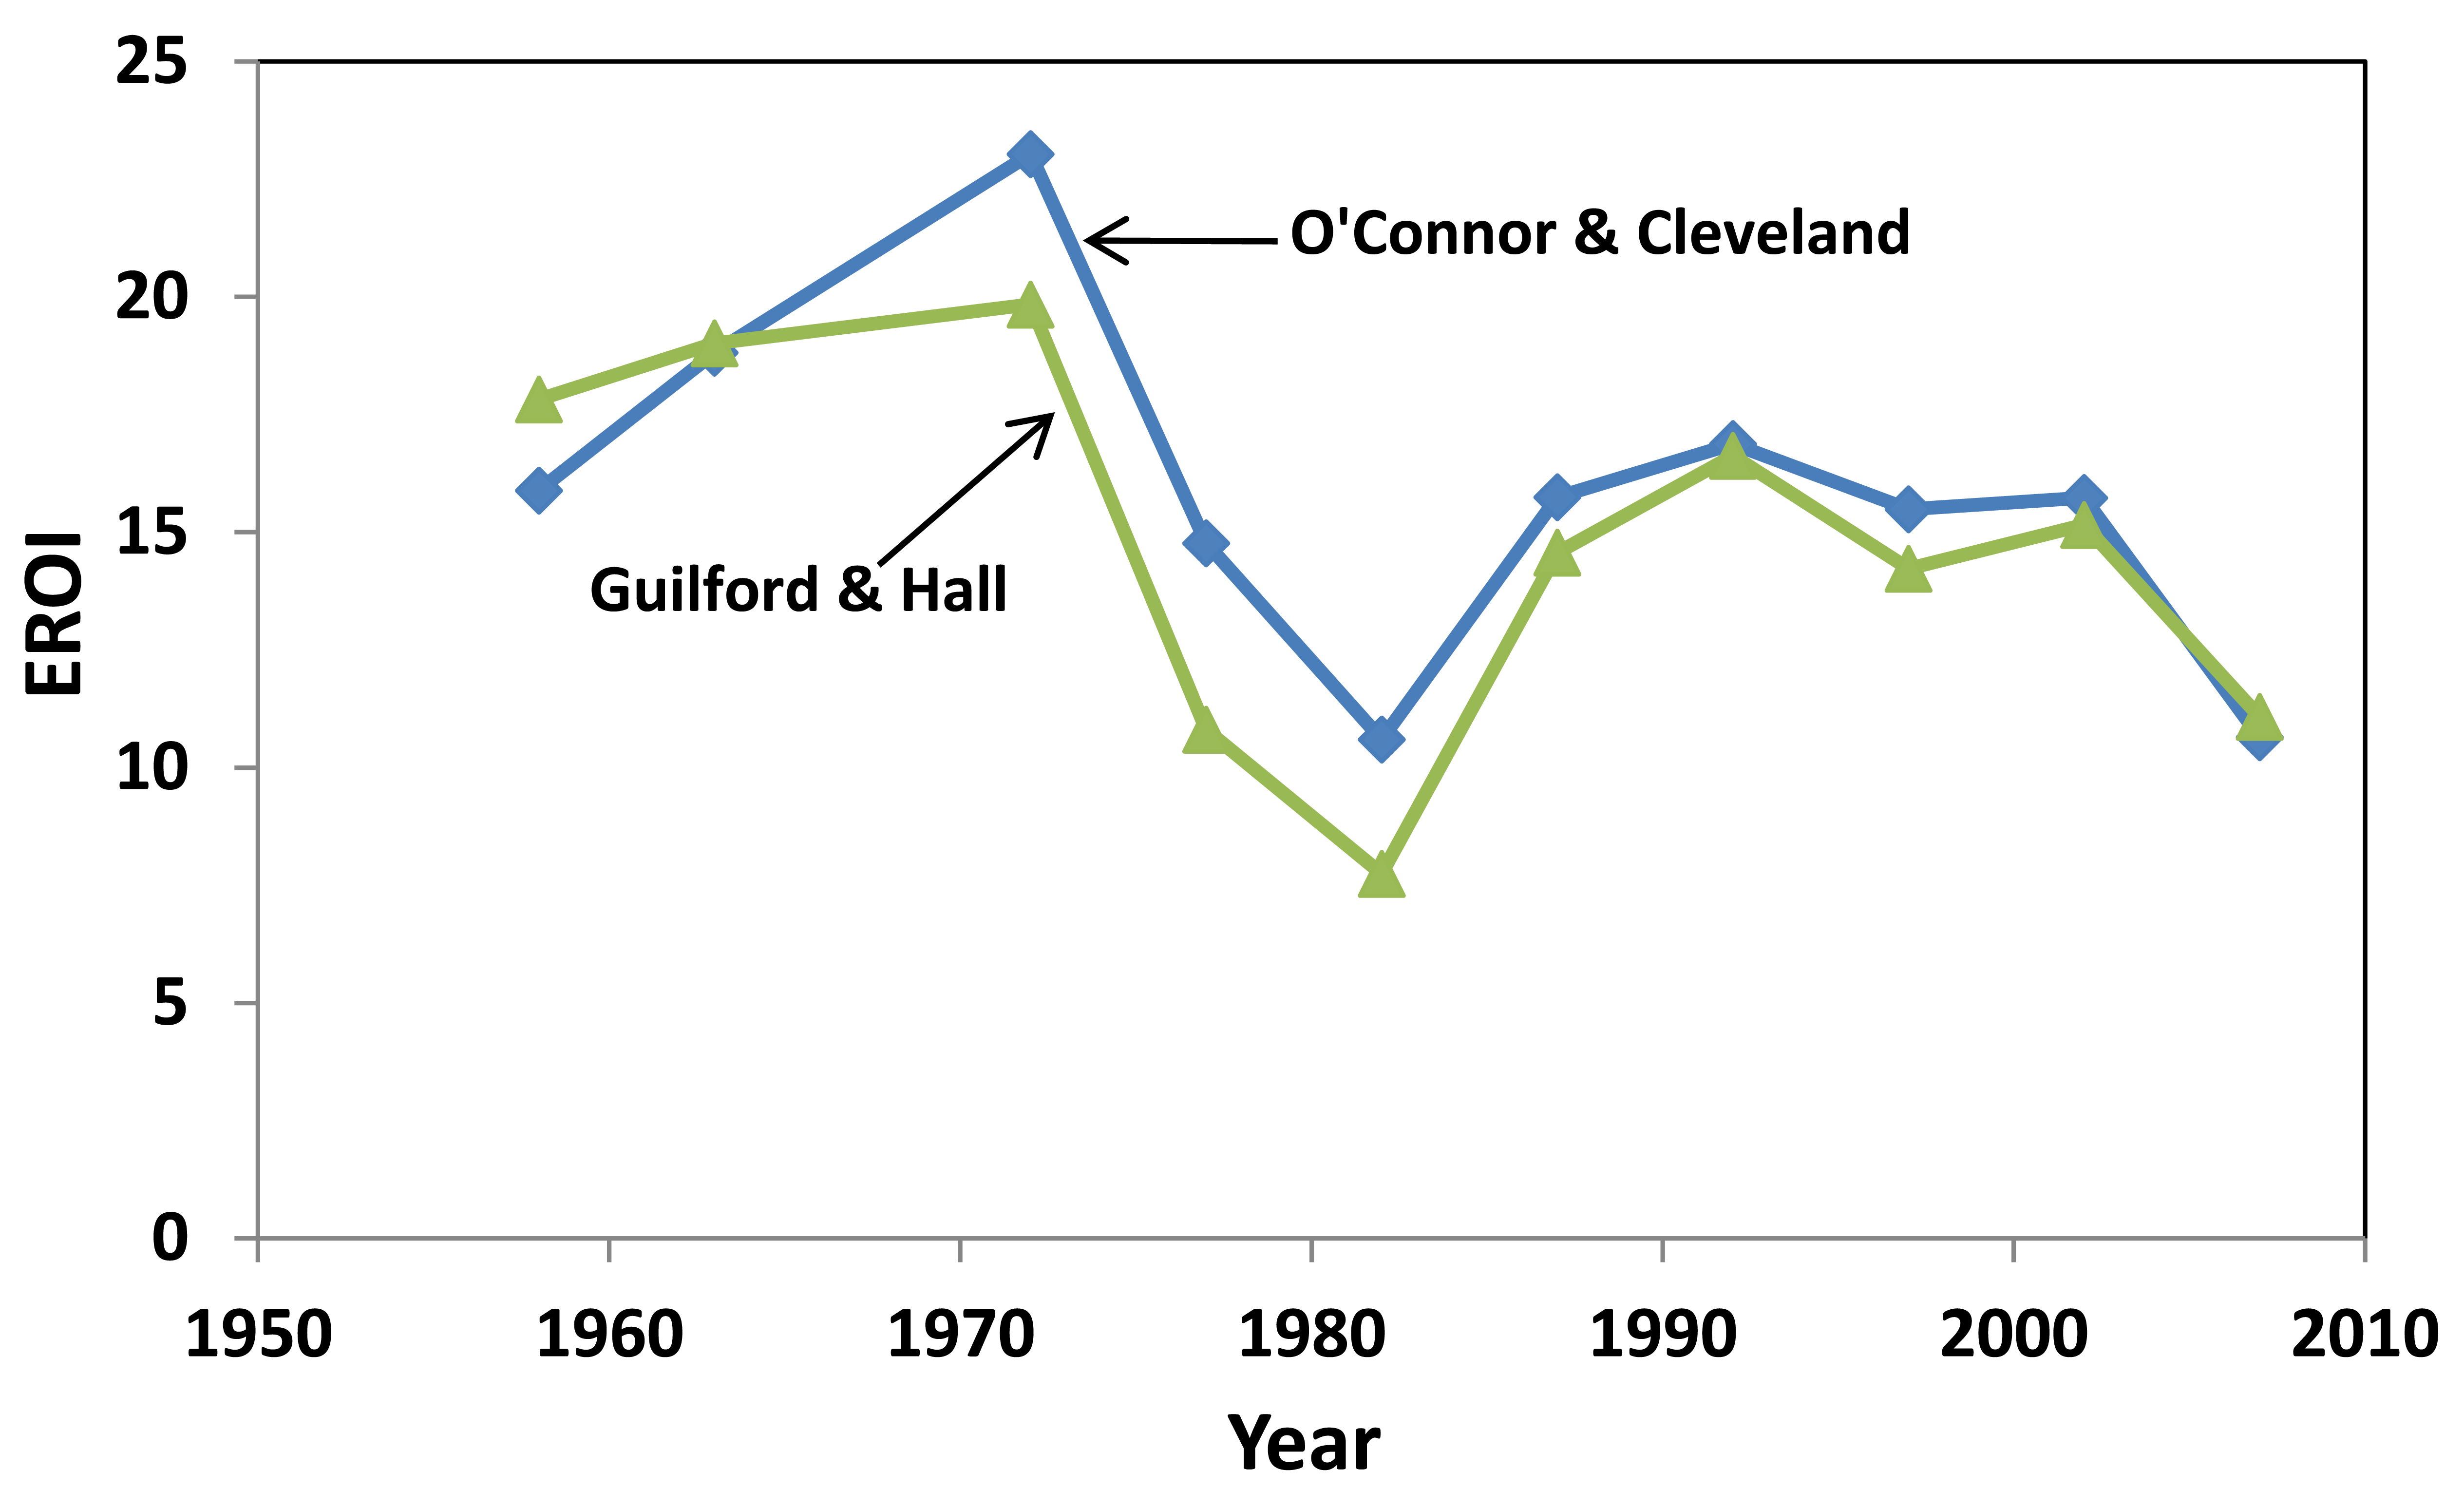
We also undertook an “extreme” sensitivity analysis by comparing our results with a completely independent assessment undertaken (without our knowledge) by O'Connor and Cleveland (Figure 8) The results suggest very similar patterns and, generally values, except that O'Connor and Cleveland's values are about 15–25% higher for the 1970s and early 1980s. Much of this difference appears due to their use of depreciation vs. Guilford and Hall's use of capital expenditures for indirect cost estimates (Table 3).
One of our reviewers was especially interested in the possible time lag effect—that drilling at one point in time might produce oil at a later time. We investigated this by slipping the production relative to the investment. The results showed no particular change in the basic patterns of EROI over time although it decreased somewhat the inverse relation between effort and EROI (Figure 9).
4. Discussion
Oil and gas production has been decreasing steadily since its peak in 1970 and a second, smaller peak in 1985 when Alaska came on line (Fig.4). The maximum production in 1970 was about 9 million barrels equivalent per day. Data from the EIA and the Oil and Gas Journal show that the most recent production is roughly 5 million barrels equivalent per day, with an increasing proportion being gas. The U.S EROI has fluctuated over time but there is an overall negative trend over time, especially since 1950 (Figure 1). The reason that EROI is dropping is because the finding and production of oil is steadily decreasing and our energy investment is increasing. Gas production has remained approximately flat, mostly due to unconventional resources replacing faltering conventional resources. The remarkably high EROI for finding oil and gas in early years contributed to significant increases in GDP and probably had a great deal to do with a tremendous increase in wealth in the first part of the 20th century, as well as to the development of systems based on inexpensive and abundant petroleum. Its steep decline is equally remarkable.
A higher demand for oil, sometimes driven by falling supplies, increases prices, which encourages more drilling, but ironically more drilling does not mean that more oil and gas will be found. There is a clear inverse correlation between EROI and drilling rates (Figure 3a). It appears likely that petroleum supplies will continue to diminish no matter how much money is invested into drilling. It is possible for production to increase even as EROI decreases, as happened, for example, over the period 1950–1970. However, the U.S. has been in a long period of decreasing EROI and decreasing production, suggesting that depletion has more importance than technology. The EROI has a shape similar to the Hubbert curve (although tilting to right) and confirms that we are most definitely in the second half of the age of oil for U.S domestic oil supply (Figure 2). Most direct energy used is natural gas in oil and gas production, and since oil but not gas needs considerable energy to pump or pressurize the formation, it is likely that natural gas is subsidizing oil production and that the EROI for oil alone would be much lower.
We checked the sources of the data for the numerator (energy gains) and the denominator (energy inputs) of the EROI equation throughout our study. We found that most of the data was not too difficult to find until 1992. Post 1992 there have been many different formats and tables for the fuel consumed within the oil and gas industry, which made our assessment more difficult. A more disturbing trend is that over time the data sets are less complete. Given the critical trends we see and the need to continue these analyses this is a very disturbing finding. Recent funding cutbacks for the U.S. Energy Information agency are likely to contribute to a further decline in data quality and quality as that information becomes far more critical.
We conducted numerous sensitivity analyses which took into consideration different indirect energy costs, an independent preliminary EROI study from O'Connor and Cleveland and a time lag in response to drilling intensity and EROI. Indirect energy costs are not known with certainty since the excellent earlier work at the University of Illinois was disbanded decades ago. We took into consideration different quality energy corrections and used 14 MJ/$ for our analysis, a value defensible from the Carnegie-Mellon site (2002 data corrected for inflation to 2005) and also by correcting for inflation earlier values from the University of Illinois studies (Figure 7). We used 14 MJ/$ for comparison purposes with previous studies. None of the uncertainty assessment patterns or even values for EROI over time changed in any significant way (i.e., usually much less than about 25%) our basic results.
There are sources of energy that may delay the beginning of the end of cheap oil. Unconventional sources of oil such as tar sands, natural gas extraction through hydraulic fracturing and off shore drilling may add to our supply of energy but will probably be expensive once the “cream” is skimmed from the sweet spots. Technology has not alleviated the problem of decreasing EROI and may not be able to do that in the future as depletion of highest quality resources continues. Thus society probably faces a continuing decline in the EROI of both conventional oil and gas. The EROI of most alternatives to conventional hydrocarbons is also low, so that the EROI of the future seems unlikely to be high enough to support society as a whole in the format we are familiar with [7].
5. Conclusion
As time goes on, domestic oil production continues to decline while energy exploitation efforts increase as the easy oil and gas is depleted. The age of cheap oil is coming to an end. The decreasing EROI of the oil industry is a factor contributing to the end of cheap oil. The EROI for production for the United States' oil industry dropped from roughly 24:1 in 1954 to 11:1 in 2007. Over time more energy is used to find and produce the same or less petroleum. Depletion tends to lead to lower petroleum production, but it also gives incentives for increased exploration, both of which contribute to a diminishing EROI. Demand for oil and gas has tended to increase steadily over time, which in turn accelerates both drilling and further depletion. The EROI is a reflection of the efficiency within a given system. As the EROI of domestic oil and gas, the nation's most important fuel supplies, continues to drop off it makes a sustainable society increasingly difficult. We must adjust to this new reality by using less, rather than expanding drilling efforts.


| Units | Conversion |
|---|---|
| 1 barrel of Oil Equivalent | 5.8 × 10E6 BTU = 6.118 GJ |
| 1 kilowatt-hour (kWh) | 3.6 MJ |
| 1 BTU | 1.055 kJ = 1,055 J |
| 1 barrel of oil (bbl) | 42 gallons= 5.615 cubic feet = 159.0 liters |
| Gasoline | 121.3 MJ/gal (32.1 MJ/L or 43.1 MJ/kg or 115 mBTU/gal) |
| Crude Oil | 6.119 GJ/bbl = 5.8 mmBTU/bbl or 39.7 mmBTU/ton or 145.7 MJ/gal or 38.5 MJ/L or 43.8 MJ/kg (=GJ/ton) |
| 1 cubic foot of natural gas | 1,008 to 1,034 BTU |
| 1 therm of natural gas | 100,000 BTU = 98 cubic feet |
| 1 gallon of crude oil | 138,095 BTU = 145.7 MJ |
| 1 barrel of crude oil | 5.8 Mega BTU = 6.1 MJ |
| 1 gallon of residual fuel oil | 149,690 BTU = 158 GJ |
| 1 gallon of gasoline | 125,000 BTU = 132 GJ |
| Year | Fuel type | Original Value | Alternative Value | Calculation |
|---|---|---|---|---|
| 1992 | Natural gas | 878 Bcf | 1,042 Bcf | Included “other” and “undistributed” fuels as natural gas |
| 1997 | Natural gas | 1,072 Bcf | 1,207 Bcf | Included “other” and “undistributed” fuels as natural gas |
| 2002 | Natural gas | 876 Bcf | 1,018Bcf | Inferred missing values for support and drilling natural gas consumption from expenditures; |
| Included “other” and “undistributed” fuels as natural gas | ||||
| 2002 | Fuel oil | 30 Mbbl | 9.0 Mbbl | Inferred from known total energy expenditures and known price of fuel oil |
| 2002 | Gasoline | 100 M gal | 71.8 M gal | Inferred from known gasoline expenses and average cost for that year |
| 2007 | Natural gas | 633.2Bcf | 1183Bcf | Added estimate of339 Bcf of self-use in the NGL |
| Extraction sub-sector; | ||||
| Calculated 160.3 purchased (all sectors) on known price; | ||||
| Included “other” and “undistributed” fuels as natural gas | ||||
| 2007 | Fuel oil | 9.03 Mbbl | 14.05 Mbbl | Inferred from known total energy expenditures and known price of fuel oil |
| 2007 | Gasoline | 100 M gal | 211 M gal | Inferred from known gasoline expenses and average cost for that year |
| Year | Capital expenditures ($M, nominal) | Depreciation ($M, nominal) |
|---|---|---|
| 1972 | 3,456 | 3,433 |
| 1977 | 12,944 | 8,969 |
| 1982 | 42,216 | 27,141 |
| 1987 | 11,717 | 20,868 |
| 1992 | 12,520 | 22,506 |
| 1997 | 25,152 | 25,051 |
| 2002 | 28,781 | 38,110 |
| 2007 | 125,460 | 84,010 |
| Year | Materials ($M, nominal) | Without Feedstock ($M, nominal) |
|---|---|---|
| 1972 | 9,471 | 5,555 |
| 1977 | 31,694 | 18,004 |
| 1982 | 89,370 | 57,934 |
| 1987 | 44,032 | 24,087 |
| 1992 | 44,092 | 21,788 |
| 1997 | 49,157 | 29,981 |
| 2002 | 48,032 | 25,683 |
| Year | Direct + Indirect Total | Exploration/total cost average % | Direct + Indirect Total Exploration | Discovery (GJ) | EROI |
|---|---|---|---|---|---|
| 1919 | 171 | 0.16 | 26.87 | 33.04 | 1229.48 |
| 1939 | 567 | 0.16 | 89.10 | 26.31 | 295.26 |
| 1954 | 1096 | 0.16 | 172.23 | 10.52 | 61.10 |
| 1958 | 1652 | 0.16 | 259.60 | 8.14 | 31.34 |
| 1963 | 1859 | 0.16 | 292.12 | 3.98 | 13.61 |
| 1972 | 2378 | 0.16 | 373.68 | 4.34 | 11.62 |
| 1977 | 3826 | 0.16 | 601.22 | 3.30 | 5.50 |
| 1982 | 5345 | 0.16 | 839.91 | 2.88 | 3.42 |
| 1987 | 2779 | 0.16 | 436.69 | 4.22 | 9.67 |
| 1992 | 2463 | 0.16 | 387.04 | 1.84 | 4.74 |
| 1997 | 2860 | 0.16 | 449.42 | 3.18 | 7.08 |
| 2002 | 2548 | 0.16 | 400.39 | 3.55 | 8.86 |
| 2007 | 3569 | 0.16 | 560.83 | 2.81 | 5.02 |
| Year | Energy Gains (Production) Total (EJ) | Direct Energy Total (PJ) | Indirect Energy Total (PJ) | Direct + Indirect Total | Production EROI |
|---|---|---|---|---|---|
| 1919 | 2.70 | 139.2 | 32.0 | 171 | 15.79 |
| 1939 | 11.31 | 488.0 | 79.0 | 567 | 19.93 |
| 1954 | 25.98 | 53.9 | 193.0 | 1096 | 23.72 |
| 1958 | 29.19 | 991.0 | 661.0 | 1652 | 17.68 |
| 1963 | 35.28 | 1091.2 | 768.0 | 1859 | 18.99 |
| 1972 | 47.17 | 1435.3 | 943.0 | 2378 | 19.85 |
| 1977 | 41.29 | 1812.4 | 2013.0 | 3826 | 10.79 |
| 1982 | 41.33 | 1618.6 | 3727.0 | 5345 | 7.73 |
| 1987 | 40.44 | 1437.6 | 1342.0 | 2779 | 14.54 |
| 1992 | 40.03 | 1361.5 | 1101.0 | 2463 | 16.24 |
| 1997 | 40.66 | 1595.0 | 1265.0 | 2860 | 14.23 |
| 2002 | 38.75 | 1336.2 | 1212.0 | 2548 | 15.23 |
| 2007 | 37.99 | 1084.6 | 2485.0 | 3569 | 10.65 |
| Year | Output (EJ) | Original | Alternative | ||||||
|---|---|---|---|---|---|---|---|---|---|
| Direct (PJ) | Indirect (PJ) | EROI | % Indirect | Direct (PJ) | Indirect (PJ) | EROI | % Indirect | ||
| 1972 | 47.17 | 1435.3 | 943 | 19.8 | 39.7% | 1435.3 | 654 | 22.6 | 31.3% |
| 1977 | 41.29 | 1812.4 | 2013 | 10.8 | 52.6% | 1812.4 | 1208 | 13.7 | 40.0% |
| 1982 | 41.33 | 1618.6 | 3727 | 7.7 | 69.7% | 1618.6 | 2382 | 10.3 | 59.5% |
| 1987 | 40.44 | 1437.6 | 1342 | 14.5 | 48.3% | 1437.6 | 1070 | 16.1 | 42.7% |
| 1992 | 40.03 | 1361.5 | 1101 | 16.2 | 44.7% | 1426.6 | 868 | 17.4 | 37.8% |
| 1997 | 40.66 | 1595.0 | 1265 | 14.2 | 44.2% | 1630.1 | 925 | 15.9 | 36.2% |
| 2002 | 38.75 | 1336.2 | 1212 | 15.2 | 47.6% | 1380.5 | 982 | 16.4 | 41.6% |
| 2007 | 37.99 | 1084.6 | 2485 | 10.6 | 69.6% | 1554.9 | 1546 | 12.3 | 49.9% |
Acknowledgments
We thank Susan Bucci of the Bureau of Census for helping us through the maze of the Census' data, Doug Hansen for helping to improve the wording, and two anonymous reviewers. We thank Mason McMahon for early help with obtaining and graphing data. We would like to thank Jean Laherrere for the data he supplied us to derive EROI for both finding and producing oil and gas. Special note from the first author: I would like to thank my parents for their support and always encouraging me to strive to do my best.
Appendix
| Year | Type | Raw value(#) | Original Units (M=10^6) | Conversion | To Metric (or other) | Units | Energy Density | Total Energy | Units |
|---|---|---|---|---|---|---|---|---|---|
| 1919 | N. Gas | 100 | Bcf | 0.028 | 2.8 | E9m^3 | 36 | 101 | PJ |
| 1919 | Fuel oil | 5.9 | Mbbls | 6.118 (GJ/bbl) | 36 | PJ | |||
| 1919 | Gasoline | 1.9 | Mgal | 42 | 0.045 | Mbbls | 6.118 (GJ/bbl) | 0.277 | PJ |
| 1919 | Electric | 285 | M(kWh) (=GWh) | kWh | 3.6 TJ/kWh | 1 | PJ | ||
| 1919 | Electric (QC) | 285 | M(kWh) (=GWh) | 2.6 | Fossil Fuel Equiv. | kWh | 3.6 TJ/kWh | 2 | PJ |
| 1919 | Capital | 200 | Mdollars | 11.3 | 2259 | 2005 | 8.3 MJ/$ | 19 | PJ |
| 1919 | Capital * | 200 | Mdollars | 11.3 | 2259 | 2005 | 14 MJ/$ | 32 | PJ |
| 1919 | Capital | 200 | Mdollars | 11.3 | 2259 | 2005 | 20 MJ/$ | 45 | PJ |
| 1919 | TOTLO | - | - | - | - | - | - | 157 | PJ |
| 1919 | TOTAL * | - | - | - | - | - | - | 170 | PJ |
| 1919 | TOTQC * | - | - | - | - | - | - | 171 | PJ |
| 1919 | TOTHIQC | - | - | - | - | - | - | 184 | PJ |
| 1939 | N. Gas | 462.1 | Bcf | 0.028 | 12.9388 | E9m^3 | 36 | 466 | PJ |
| 1939 | Fuel oil | 2.2 | Mbbls | 6.118 (GJ/bbl) | 14 | PJ | |||
| 1939 | Gasoline | 17.7 | Mgal | 42 | 0.42 | Mbbls | 6.118 (GJ/bbl) | 3 | PJ |
| 1939 | Electric | 651.0 | M(kWh) (=GWh) | kWh | 3.6 TJ/kWh | 2 | PJ | ||
| 1939 | Electric (QC) | 651.0 | M(kWh) (=GWh) | 2.6 | Fossil Fuel Equiv. | kWh | 3.6 TJ/kWh | 6 | PJ |
| 1939 | Capital | 399.8 | Mdollars | 14.1 | 5619.2 | 2005 | 8.3 MJ/$ | 47 | PJ |
| 1939 | Capital * | 399.8 | Mdollars | 14.1 | 5619.2 | 2005 | 14 MJ/$ | 79 | PJ |
| 1939 | Capital | 399.8 | Mdollars | 14.1 | 5619.2 | 2005 | 20 MJ/$ | 112 | PJ |
| 1939 | TOTLO | - | - | - | - | - | - | 531 | PJ |
| 1939 | TOTAL * | - | - | - | - | - | - | 563 | PJ |
| 1939 | TOTQC * | - | - | - | - | - | - | 567 | PJ |
| 1939 | TOTHIQC | - | - | - | - | - | - | 600 | PJ |
| 1954 | N. Gas | 842.4 | Bcf | 0.028 | 23.5872 | E9m^3 | 36 | 849.1 | PJ |
| 1954 | Fuel oil | 4603 | Mbbls | 6.118 (GJ/bbl) | 28.2 | PJ | |||
| 1954 | Gasoline | - | Mgal | 42 | - | Mbbls | 6.118 (GJ/bbl) | - | PJ |
| 1954 | Electric | 2748 | M(kWh) (=GWh) | kWh | 3.6 TJ/kWh | 9.9 | PJ | ||
| 1954 | Electric (QC) | 1314 | M(kWh) (=GWh) | 2.6 | Fossil Fuel Equiv. | kWh | 3.6 TJ/kWh | 25.7 | PJ |
| 1954 | Capital | 1896.4 | Mdollars | 7.3 | 13767.9 | 2005 | 8.3 MJ/$ | 114 | PJ |
| 1954 | Capital * | 1896.4 | Mdollars | 7.3 | 13767.9 | 2005 | 14 MJ/$ | 193 | PJ |
| 1954 | Capital | 1896.4 | Mdollars | 7.3 | 13767.9 | 2005 | 20 MJ/$ | 275 | PJ |
| 1954 | TOTLO | - | - | - | - | - | - | 1001 | PJ |
| 1954 | TOTAL * | - | - | - | - | - | - | 1080 | PJ |
| 1954 | TOTQC * | - | - | - | - | - | - | 1096 | PJ |
| 1954 | TOTHIQC | - | - | - | - | - | - | 1178 | PJ |
| 1958 | N. Gas | 894.3 | Bcf | 0.028 | 25.0404 | E9m^3 | 36 | 901 | PJ |
| 1958 | Fuel oil | 5.7 | Mbbls | 6.118 (GJ/bbl) | 35 | PJ | |||
| 1958 | Gasoline | 100.0 | Mgal | 42 | 2.38 | Mbbls | 6.118 (GJ/bbl) | 15 | PJ |
| 1958 | Electric | 4275.0 | M(kWh) (=GWh) | kWh | 3.6 TJ/kWh | 15 | PJ | ||
| 1958 | Electric (QC) | 4275.0 | M(kWh) (=GWh) | 2.6 | Fossil Fuel Equiv. | kWh | 3.6 TJ/kWh | 40 | PJ |
| 1958 | Capital | 6993.5 | Mdollars | 6.8 | 47237.9 | 2005 | 8.3 MJ/$ | 392 | PJ |
| 1958 | Capital * | 6993.5 | Mdollars | 6.8 | 47237.9 | 2005 | 14 MJ/$ | 661 | PJ |
| 1958 | Capital | 6993.5 | Mdollars | 6.8 | 47237.9 | 2005 | 20 MJ/$ | 945 | PJ |
| 1958 | TOTLO | - | - | - | - | - | - | 1358 | PJ |
| 1958 | TOTAL * | - | - | - | - | - | - | 1628 | PJ |
| 1958 | TOTQC * | - | - | - | - | - | - | 1652 | PJ |
| 1958 | TOTHIQC | - | - | - | - | - | - | 1936 | PJ |
| 1963 | N. Gas | 964.2 | Bcf | 0.028 | 26.9976 | E9m^3 | 36 | 972 | PJ |
| 1963 | Fuel oil | 5.5 | Mbbls | 6.118 (GJ/bbl) | 34 | PJ | |||
| 1963 | Gasoline | 157.6 | Mgal | 42 | 3.75 | Mbbls | 6.118 (GJ/bbl) | 23 | PJ |
| 1963 | Electric | 6696.0 | M(kWh) (=GWh) | kWh | 3.6 TJ/kWh | 24 | PJ | ||
| 1963 | Electric (QC) | 6696.0 | M(kWh) (=GWh) | 2.6 | Fossil Fuel Equiv. | kWh | 3.6 TJ/kWh | 63 | PJ |
| 1963 | Capital | 8596.1 | Mdollars | 6.4 | 55015.0 | 2005 | 8.3 MJ/$ | 455 | PJ |
| 1963 | Capital * | 8596.1 | Mdollars | 6.4 | 55015.0 | 2005 | 14 MJ/$ | 768 | PJ |
| 1963 | Capital | 8596.1 | Mdollars | 6.4 | 55015.0 | 2005 | 20 MJ/$ | 1097 | PJ |
| 1963 | TOTLO | - | - | - | - | - | - | 1508 | PJ |
| 1963 | TOTAL * | - | - | - | - | - | - | 1820 | PJ |
| 1963 | TOTQC * | - | - | - | - | - | - | 1859 | PJ |
| 1963 | TOTHIQC | - | - | - | - | - | - | 2188 | PJ |
| 1972 | N. Gas | 1164.0 | Bcf | 0.028 | 32.592 | E9m^3 | 36 | 1173 | PJ |
| 1972 | Fuel oil | 18.9 | Mbbls | 6.118 (GJ/bbl) | 115 | PJ | |||
| 1972 | Gasoline | 122.9 | Mgal | 42 | 2.93 | Mbbls | 6.118 (GJ/bbl) | 15 | PJ |
| 1972 | Electric | 14060.0 | M(kWh) (=GWh) | kWh | 3.6 TJ/kWh | 51 | PJ | ||
| 1972 | Electric (QC) | 14060.0 | M(kWh) (=GWh) | 2.6 | Fossil Fuel Equiv. | kWh | 3.6 TJ/kWh | 132 | PJ |
| 1972 | Capital | 12927.2 | Mdollars | 5.2 | 67221.4 | 2005 | 8.3 MJ/$ | 559 | PJ |
| 1972 | Capital* | 12927.2 | Mdollars | 5.2 | 67221.4 | 2005 | 14 MJ/$ | 943 | PJ |
| 1972 | Capital | 12927.2 | Mdollars | 5.2 | 67221.4 | 2005 | 20 MJ/$ | 1347 | PJ |
| 1972 | TOTLO | - | - | - | - | - | - | 1913 | PJ |
| 1972 | TOTAL * | - | - | - | - | - | - | 2297 | PJ |
| 1972 | TOTQC * | - | - | - | - | - | - | 2378 | PJ |
| 1972 | TOTHIQC | - | - | - | - | - | - | 2782 | PJ |
| 1977 | N. Gas | 1382.0 | Bcf | 0.028 | 38.696 | E9m^3 | 36 | 1393 | PJ |
| 1977 | Fuel oil | 33.1 | Mbbls | 6.118 (GJ/bbl) | 203 | PJ | |||
| 1977 | Gasoline | 223.4 | Mgal | 42 | 5.32 | Mbbls | 6.118 (GJ/bbl) | 33 | PJ |
| 1977 | Electric | 19679.0 | M(kWh) (=GWh) | kWh | 3.6 TJ/kWh | 71 | PJ | ||
| 1977 | Electric (QC) | 19679.0 | M(kWh) (=GWh) | 2.6 | Fossil Fuel Equiv. | kWh | 3.6 TJ/kWh | 184 | PJ |
| 1977 | Capital | 44638.3 | Mdollars | 3.2 | 142842.6 | 2005 | 8.3 MJ/$ | 1194 | PJ |
| 1977 | Capital * | 44638.3 | Mdollars | 3.2 | 142842.6 | 2005 | 14 MJ/$ | 2013 | PJ |
| 1977 | Capital | 44638.3 | Mdollars | 3.2 | 142842.6 | 2005 | 20 MJ/$ | 2876 | PJ |
| 1977 | TOTLO | - | - | - | - | - | - | 2893 | PJ |
| 1977 | TOTAL * | - | - | - | - | - | - | 3712 | PJ |
| 1977 | TOTQC * | - | - | - | - | - | - | 3826 | PJ |
| 1977 | TOTHIQC | - | - | - | - | - | - | 4688 | PJ |
| 1982 | N. Gas | 913.0 | Bcf | 0.028 | 25.564 | E9m^3 | 36 | 920 | PJ |
| 1982 | Fuel oil | 52.6 | Mbbls | 6.118 (GJ/bbl) | 322 | PJ | |||
| 1982 | Gasoline | 343.5 | Mgal | 42 | 8.18 | Mbbls | 6.118 (GJ/bbl) | 50 | PJ |
| 1982 | Electric | 34857.0 | M(kWh) (=GWh) | kWh | 3.6 TJ/kWh | 125 | PJ | ||
| 1982 | Electric (QC) | 34857.0 | M(kWh) (=GWh) | 2.6 | Fossil Fuel Equiv. | kWh | 3.6 TJ/kWh | 326 | PJ |
| 1982 | Capital | 131585.1 | Mdollars | 2 | 263170.2 | 2005 | 8.3 MJ/$ | 2209 | PJ |
| 1982 | Capital* | 131585.1 | Mdollars | 2 | 263170.2 | 2005 | 14 MJ/$ | 3727 | PJ |
| 1982 | Capital | 131585.1 | Mdollars | 2 | 263170.2 | 2005 | 20 MJ/$ | 5324 | PJ |
| 1982 | TOTLO | - | - | - | - | - | - | 3627 | PJ |
| 1982 | TOTAL* | - | - | - | - | - | - | 5144 | PJ |
| 1982 | TOTQC* | - | - | - | - | - | - | 5345 | PJ |
| 1982 | TOTHIQC | - | - | - | - | - | - | 6942 | PJ |
| 1987 | N. Gas | 1011.4 | Bcf | 0.028 | 28.31 | E9m^3 | 36 | 1019 | PJ |
| 1987 | Fuel oil | 20.8 | Mbbls | 6.118 (GJ/bbl) | 127 | PJ | |||
| 1987 | Gasoline | 174.8 | Mgal | 42 | 4.16 | Mbbls | 6.118 (GJ/bbl) | 25 | PJ |
| 1987 | Electric | 28418.0 | M(kWh) (=GWh) | kWh | 3.6 TJ/kWh | 102 | PJ | ||
| 1987 | Electric (QC) | 28418.0 | M(kWh) (=GWh) | 2.6 | Fossil Fuel Equiv. | kWh | 3.6 TJ/kWh | 266 | PJ |
| 1987 | Capital | 55749.0 | Mdollars | 1.7 | 94773 | 2005 | 8.3 MJ/$ | 795 | PJ |
| 1987 | Capital* | 55749.0 | Mdollars | 1.7 | 94773 | 2005 | 14 MJ/$ | 1342 | PJ |
| 1987 | Capital | 55749.0 | Mdollars | 1.7 | 94773 | 2005 | 20 MJ/$ | 1917 | PJ |
| 1987 | TOTLO | - | - | - | - | - | - | 2069 | PJ |
| 1987 | TOTAL* | - | - | - | - | - | - | 2616 | PJ |
| 1987 | TOTQC* | - | - | - | - | - | - | 2779 | PJ |
| 1987 | TOTHIQC | - | - | - | - | - | - | 3354 | PJ |
| 1992 | N. Gas | 878.0 | Bcf | 0.028 | 24.584 | E9m^3 | 36 | 885 | PJ |
| 1992 | Fuel oil | 9.6 | Mbbls | 6.118 (GJ/bbl) | 59 | PJ | |||
| 1992 | Gasoline | 82.7 | Mgal | 42 | 1.97 | Mbbls | 6.118 (GJ/bbl) | 12 | PJ |
| 1992 | Electric | 33036.0 | M(kWh) (=GWh) | kWh | 3.6 TJ/kWh | 119 | PJ | ||
| 1992 | Electric (QC) | 33036.0 | M(kWh) (=GWh) | 2.6 | Fossil Fuel Equiv. | kWh | 3.6 TJ/kWh | 309 | PJ |
| 1992 | Capital | 56544.1 | Mdollars | 1.4 | 79161.7 | 2005 | 8.3 MJ/$ | 653 | PJ |
| 1992 | Capital * | 56544.1 | Mdollars | 1.4 | 79161.7 | 2005 | 14 MJ/$ | 1101 | PJ |
| 1992 | Capital | 56544.1 | Mdollars | 1.4 | 79161.7 | 2005 | 20 MJ/$ | 1574 | PJ |
| 1992 | TOTLO | - | - | - | - | - | - | 1728 | PJ |
| 1992 | TOTAL * | - | - | - | - | - | - | 2176 | PJ |
| 1992 | TOTQC * | - | - | - | - | - | - | 2366 | PJ |
| 1992 | TOTHIQC | - | - | - | - | - | - | 2839 | PJ |
| 1997 | N. Gas | 1072.0 | Bcf | 0.028 | 30.016 | E9m^3 | 36 | 1081 | PJ |
| 1997 | Fuel oil | 11.2 | Mbbls | 6.118 (GJ/bbl) | 69 | PJ | |||
| 1997 | Gasoline | 164.0 | Mgal | 42 | 3.90 | Mbbls | 6.118 (GJ/bbl) | 24 | PJ |
| 1997 | Electric | 34,339.8 | M(kWh) (=GWh) | kWh | 3.6 TJ/kWh | 124 | PJ | ||
| 1997 | Electric (QC) | 34,339.8 | M(kWh) (=GWh) | 2.6 | Fossil Fuel Equiv. | kWh | 3.6 TJ/kWh | 321 | PJ |
| 1997 | Capital | 74309.0 | Mdollars | 1.2 | 89170.8 | 2005 | 8.3 MJ/$ | 750 | PJ |
| 1997 | Capital * | 74309.0 | Mdollars | 1.2 | 89170.8 | 2005 | 14 MJ/$ | 1265 | PJ |
| 1997 | Capital | 74309.0 | Mdollars | 1.2 | 89170.8 | 2005 | 20 MJ/$ | 1807 | PJ |
| 1997 | TOTLO | - | - | - | - | - | - | 2047 | PJ |
| 1997 | TOTAL * | - | - | - | - | - | - | 2562 | PJ |
| 1997 | TOTQC* | - | - | - | - | - | - | 2759 | PJ |
| 1997 | TOTHIQC | - | - | - | - | - | - | 3302 | PJ |
| 2002 | N. Gas | 876.0 | Bcf | 0.028 | 24.528 | E9m^3 | 36 | 883 | PJ |
| 2002 | Fuel oil | 30.0 | Mbbls | 6.118 (GJ/bbl) | 184 | PJ | |||
| 2002 | Gasoline | 100.0 | Mgal | 42 | 2.38 | Mbbls | 6.118 (GJ/bbl) | 15 | PJ |
| 2002 | Electric | 27255.0 | M(kWh) (=GWh) | kWh | 3.6 TJ/kWh | 98 | PJ | ||
| 2002 | Electric (QC) | 27255.0 | M(kWh) (=GWh) | 2.6 | Fossil Fuel Equiv. | kWh | 3.6 TJ/kWh | 255 | PJ |
| 2002 | Capital | 78518.0 | Mdollars | 1.1 | 86369.8 | 2005 | 8.3 MJ/$ | 718 | PJ |
| 2002 | Capital* | 78518.0 | Mdollars | 1.1 | 86369.8 | 2005 | 14 MJ/$ | 1212 | PJ |
| 2002 | Capital | 78518.0 | Mdollars | 1.1 | 86369.8 | 2005 | 20 MJ/$ | 1731 | PJ |
| 2002 | TOTLO | - | - | - | - | - | - | 1898 | PJ |
| 2002 | TOTAL* | - | - | - | - | - | - | 2391 | PJ |
| 2002 | TOTQC* | - | - | - | - | - | - | 2548 | PJ |
| 2002 | TOTHIQC | - | - | - | - | - | - | 3067 | PJ |
| 2007 | N. Gas | 770.0 | Bcf | 0.028 | 21.56 | E9m^3 | 36 | 776 | PJ |
| 2007 | Fuel oil | 9036.0 | Mbbls | 6.118 (GJ/bbl) | 55 | PJ | |||
| 2007 | Gasoline | 100.0 | Mgal | 42 | 2.38 | Mbbls | 6.118 (GJ/bbl) | 15 | PJ |
| 2007 | Electric | 25496.0 | M(kWh) (=GWh) | kWh | 3.6 TJ/kWh | 92 | PJ | ||
| 2007 | Electric (QC) | 25496.0 | M(kWh) (=GWh) | 2.6 | Fossil Fuel Equiv. | kWh | 3.6 TJ/kWh | 239 | PJ |
| 2007 | Capital | 188518.0 | Mdollars | 0.94 | 177207 | 2005 | 8.3 MJ/$ | 1473 | PJ |
| 2007 | Capital * | 188518.0 | Mdollars | 0.94 | 177207 | 2005 | 14 MJ/$ | 2485 | PJ |
| 2007 | Capital | 188518.0 | Mdollars | 0.94 | 177207 | 2005 | 20 MJ/$ | 3550 | PJ |
| 2007 | TOTLO | - | - | - | - | - | - | 2411 | PJ |
| 2007 | TOTAL * | - | - | - | - | - | - | 3423 | PJ |
| 2007 | TOTQC * | - | - | - | - | - | - | 3569 | PJ |
| 2007 | TOTHIQC | - | - | - | - | - | - | 4634 | PJ |
TOTLO = the total sum of the direct energy plus the lower calculated indirect energy estimate (8.3 MJ) and not electric quality corrected.Total* = the total sum of direct energy plus the middle value of indirect energy (14 MJ) and not the quality corrected energy value.TOTQC* = the total sun of direct energy values plus the middle value of indirect energy (14 MJ) and includes quality corrected electric values.TOTHIQC = the total sum of direct energy values plus the highest calculated indirect energy cost (20 MJ) and includes quality corrected electric values.
References and Notes
- Energy Information Administration (EIA). Official Energy Statistics from the U.S. Government. Publisher: Available online: http://www.eia.doe.gov (accessed on 4 May 2010).
- Murphy, D.; Hall, C.A.S.; Dale, M.; Cleveland, C. Order from chaos: A preliminary protocol for determining the EROI of fuels. Sustainability. in press.
- Hall, C.A.S.; Cleveland, C.J. Petroleum drilling and production in the United States: Yield per effort and net energy analysis. Science 1981, 211, 576–579. [Google Scholar]
- Davis, W. A study of the future productive capacity and probable reserves of the U.S. Oil Gas J. 1958, 56, 105–119. [Google Scholar]
- Cleveland, C.J. Net energy from the extraction of oil and gas in the United States. Energy 2005, 30, 769–782. [Google Scholar]
- Gagnon, N.; Hall, C.A.S.; Brinker, L. A preliminary investigation of energy return on energy investment for global oil and gas production. Energies 2009, 2, 490–503. [Google Scholar]
- Hall, C.A.S.; Balogh, S.; Murphy, D.J. What is the minimum EROI that a sustainable society must have? Energies 2009, 2, 25–47. [Google Scholar]
© 2011 by the authors; licensee MDPI, Basel, Switzerland. This article is an open access article distributed under the terms and conditions of the Creative Commons Attribution license (http://creativecommons.org/licenses/by/3.0/).
Share and Cite
Guilford, M.C.; Hall, C.A.S.; O’Connor, P.; Cleveland, C.J. A New Long Term Assessment of Energy Return on Investment (EROI) for U.S. Oil and Gas Discovery and Production. Sustainability 2011, 3, 1866-1887. https://0-doi-org.brum.beds.ac.uk/10.3390/su3101866
Guilford MC, Hall CAS, O’Connor P, Cleveland CJ. A New Long Term Assessment of Energy Return on Investment (EROI) for U.S. Oil and Gas Discovery and Production. Sustainability. 2011; 3(10):1866-1887. https://0-doi-org.brum.beds.ac.uk/10.3390/su3101866
Chicago/Turabian StyleGuilford, Megan C., Charles A.S. Hall, Peter O’Connor, and Cutler J. Cleveland. 2011. "A New Long Term Assessment of Energy Return on Investment (EROI) for U.S. Oil and Gas Discovery and Production" Sustainability 3, no. 10: 1866-1887. https://0-doi-org.brum.beds.ac.uk/10.3390/su3101866