A Climate Change Adaptation Planning Process for Low-Lying, Communities Vulnerable to Sea Level Rise

Abstract
:
1. Introduction
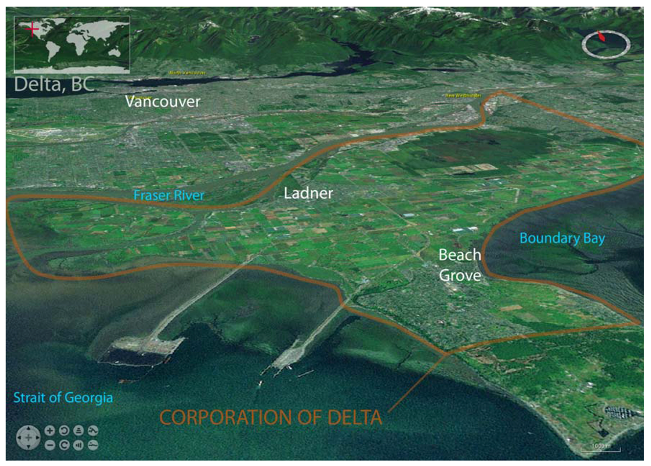
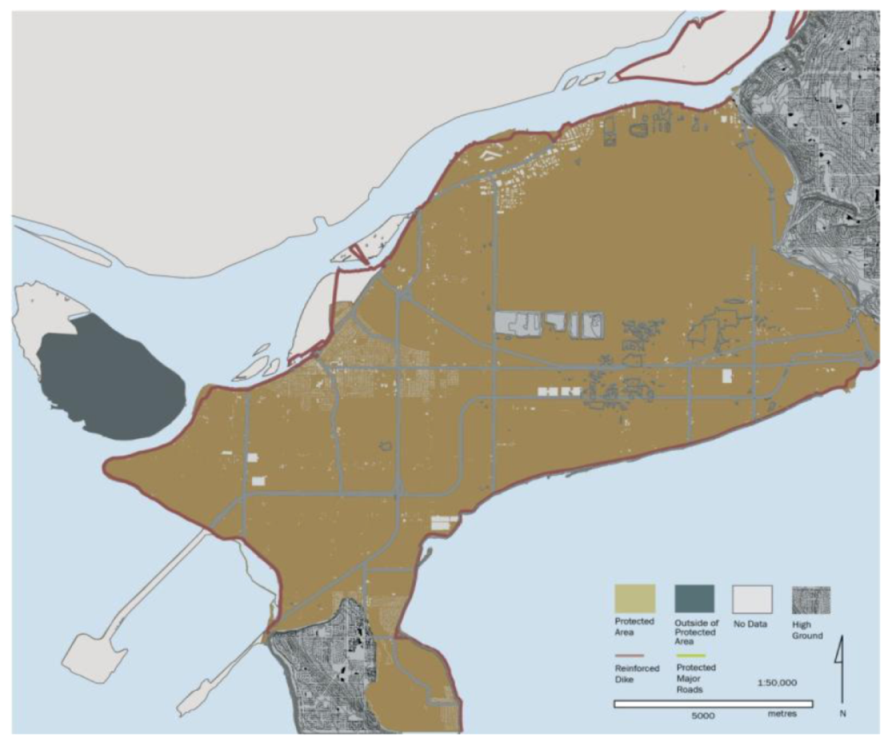
1.1. The Context of Delta: A Low-Lying Vulnerable Community

1.2. Factors Affecting Adaptation Planning in Delta
- • Delta has experience significant flooding from both the adjacent Fraser River (most recently in 1948), as well as smaller isolating marine flooding in some communities (most recently in 2006), which has brought the subject of flooding into the public dialogue, e.g., an existing desire for exploring alternative adaptation responses to raising seawalls. This was the aim of the scenarios developed in this study.
- • Access to critical scientific, engineering and costing data on the feasibility of possible adaptation measures and scenarios: Delta has commissioned various flood modeling studies to support technical analysis of risks and options, and these studies were integrated into the scenario-building and evaluation framework described in Section 2.
- • Ownership of coastal properties: key lengths of shoreline in Delta are owned by private homeowners with their own seawalls, as opposed to extensive public dikes in other areas. These private seawalls are outside of the public jurisdiction, making it difficult to generate solutions applicable across the entire community. In part to address this disparity, this study chose two different case study areas, one with a private seawall, the other with a public seawall.
- • Key adaptation planning horizons (long-term) and local election cycles (short-term): difficult to align suitable windows, timelines, and strategic incentives for key efforts and decisions to be taken. Although challenging to overcome, this study involved local community, government and staff stakeholders in order to enhance the inertia of the project beyond these cycles.
1.3. Existing Adaptation Planning Approaches
1.3.1. United Nations Development Program
1.3.2. Local Governments for Sustainability (ICLEI Canada)
1.3.3. Local Adaptation Planning Examples
• Community-based workshop in Prince George, British Columbia, Canada
• Adaptation integrated into overarching policies in King County, WA, USA
• Community-based adaptation framework The Columbia Basin Trust, BC, Canada
• Sea level rise adaptation planning in Halifax, NS, Canada
1.4. An Adaptation Process for Delta
- • Keeping stakeholders engaged via a bottom-up planning process by conducting workshops with all community stakeholders; providing education and awareness-building; priority-setting; a vulnerability assessment; ensuring that the community’s adaptive capacity is increased and continually reviewed; considering social acceptability of proposed adaptation strategies by, for example, using 3D visualization tools (from United Nations Development Program; Prince George, BC; Columbia Basin Trust)
- • Designing a set of deliverables to inform the milestones of the ICLEI Canada Guide for Municipal Adaptation. In the case of Delta, the first three milestones of Initiate, Research and Plan were focused on (from ICLEI Canada)
- • Integrating adaptation into local policy, particular policies for highly vulnerable areas (from King County, WA)
- • Integrating the IPCC’s conceptual definition of vulnerability as a function of “sensitivity” and “exposure”; packaging adaptation strategies into coherent scenarios for communicating to stakeholders and regional authorities (from Halifax, NS)
- i) a social learning and capacity-building program, sustained over a period of several years, for the Delta community and municipal staff to become familiar with the realities of sea level rise and key concepts of climate change adaptation. This would embrace existing and new public engagement/educational opportunities, including methods such as those employed in this study and a media strategy to take advantage of media interest and responsible information dissemination. The goal is for an inclusive, structured, and informed public dialogue with shared learning on all sides, conducted well before major decisions are taken. Building public support for policy change and implementation of adaptation measures will be important in attracting funding and reducing uncertainties and costs.
- ii) a planning process to develop required information to frame community discussions and for decision-making, including input from stakeholders and partners, and commissioning or sharing in new scientific and technical studies. The goals of this process would be to:
- • Provide a strong basis for lobbying higher government and other potential funding sources;
- • Identify and exploit win/win opportunities in meeting multiple objectives such as adopted carbon emission reduction targets and reducing dependency on fossil fuels, providing more jobs in Delta and developing the local tax base, safeguarding community assets such as wildlife and agricultural production, improved transit, etc.;
- • Form strategic alliances with other communities and agencies on issues such as local food security, funding technical studies, continuity in infrastructure approach across municipal boundaries, etc.
2. Methods
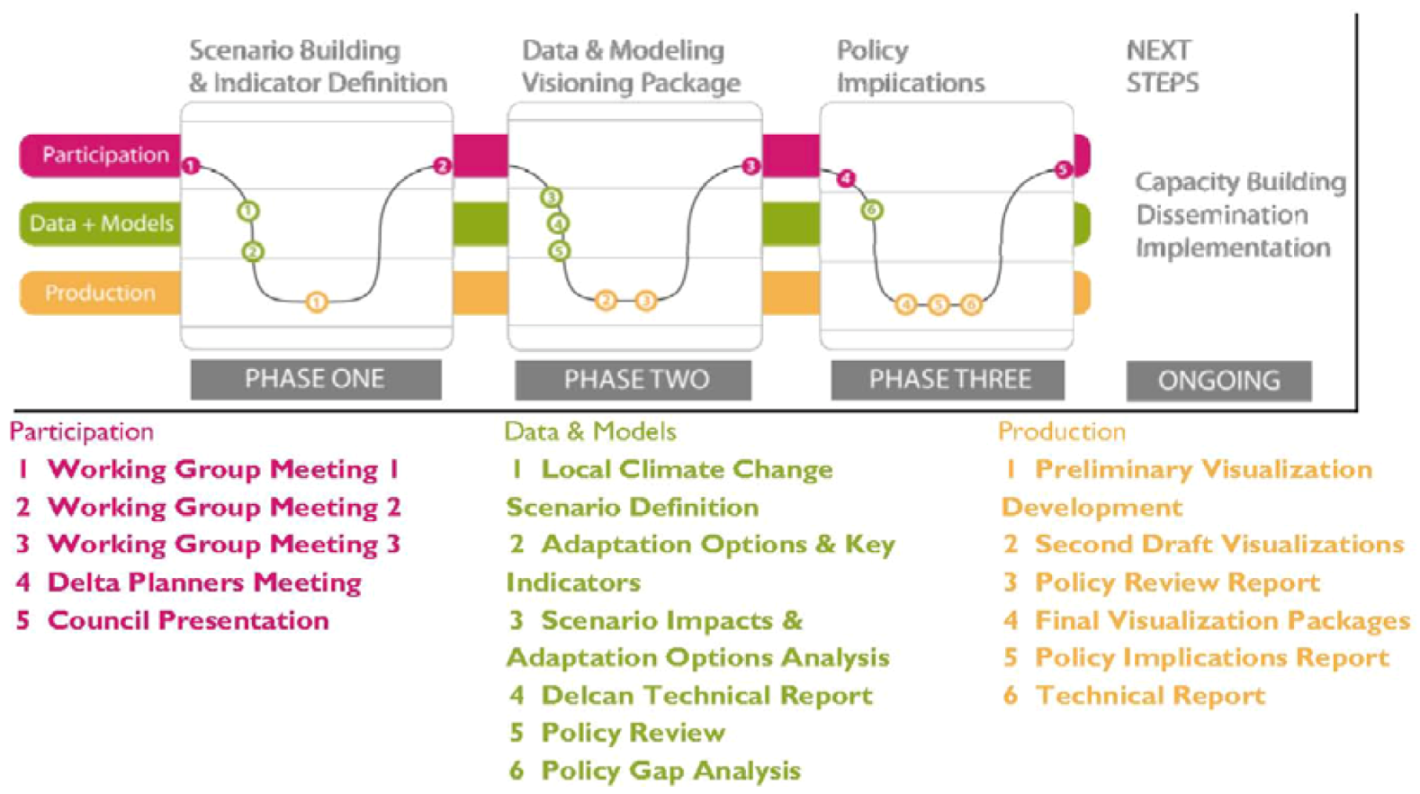
2.1. Overall Process
- 1: Participatory Scenario Building and Indicator Definition
- 2: Data Integration, Modeling, and Visioning Package Development
- 3: Policy Implications, Capacity Building and Dissemination

2.2. Evaluation Framework
1) Model climate scenario impacts (focused on sea level rise)

| 2010 Guideline | 2100 Guideline | |
|---|---|---|
| Summary of Coastal Impacts on Sea Level for Fraser River Area | (CGD, m above mean sea level) | (CGD, m above mean sea level) |
| Reference Tide Level (Higher high water large tide) | 1.8 m | 1.8 m |
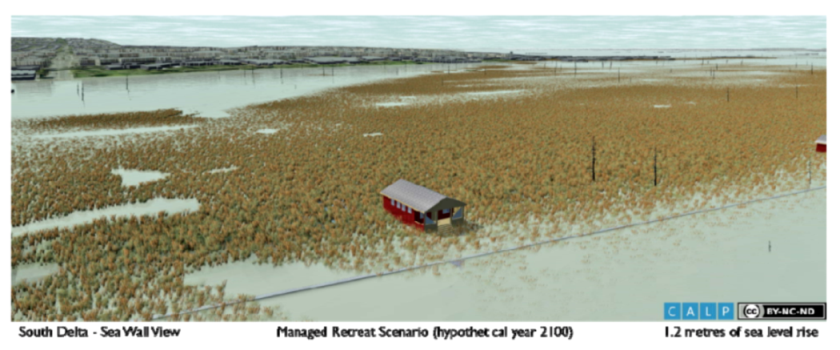
| Sea Level Rise | 0 m | 1.2 m |
| Storm Surge (Change in water level from wind and air pressure) | 1.25 m (1/200 yr storm) | 1.3 m (1/500 yr storm) |
| Waves | 0.65 m | 0.65 m |
| Wind Set Up (Rise of water surface due to wind stress on water surface) and Wave Runup (Vertical distance that waves run up the slope of a shoreline or shore structure) | 1.8 m | 3.1 m |
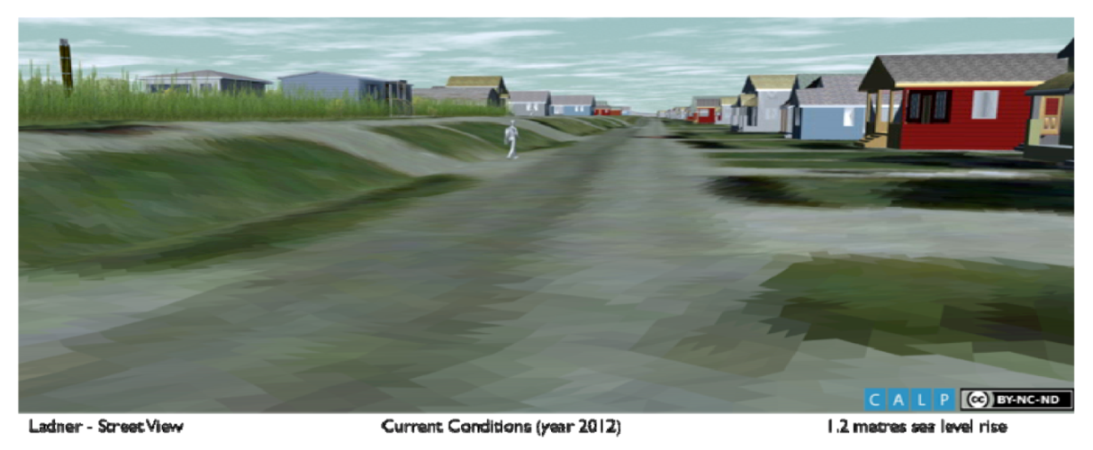
2) Creating and visualizing scenarios
- • explore a range of options
- • understand trade-off choices
- • understand long-term consequences
- • make decisions at a smaller case-study scale, as well as understand the larger framing political issues
3) Evaluating scenarios against key indicators and implications

3. Results
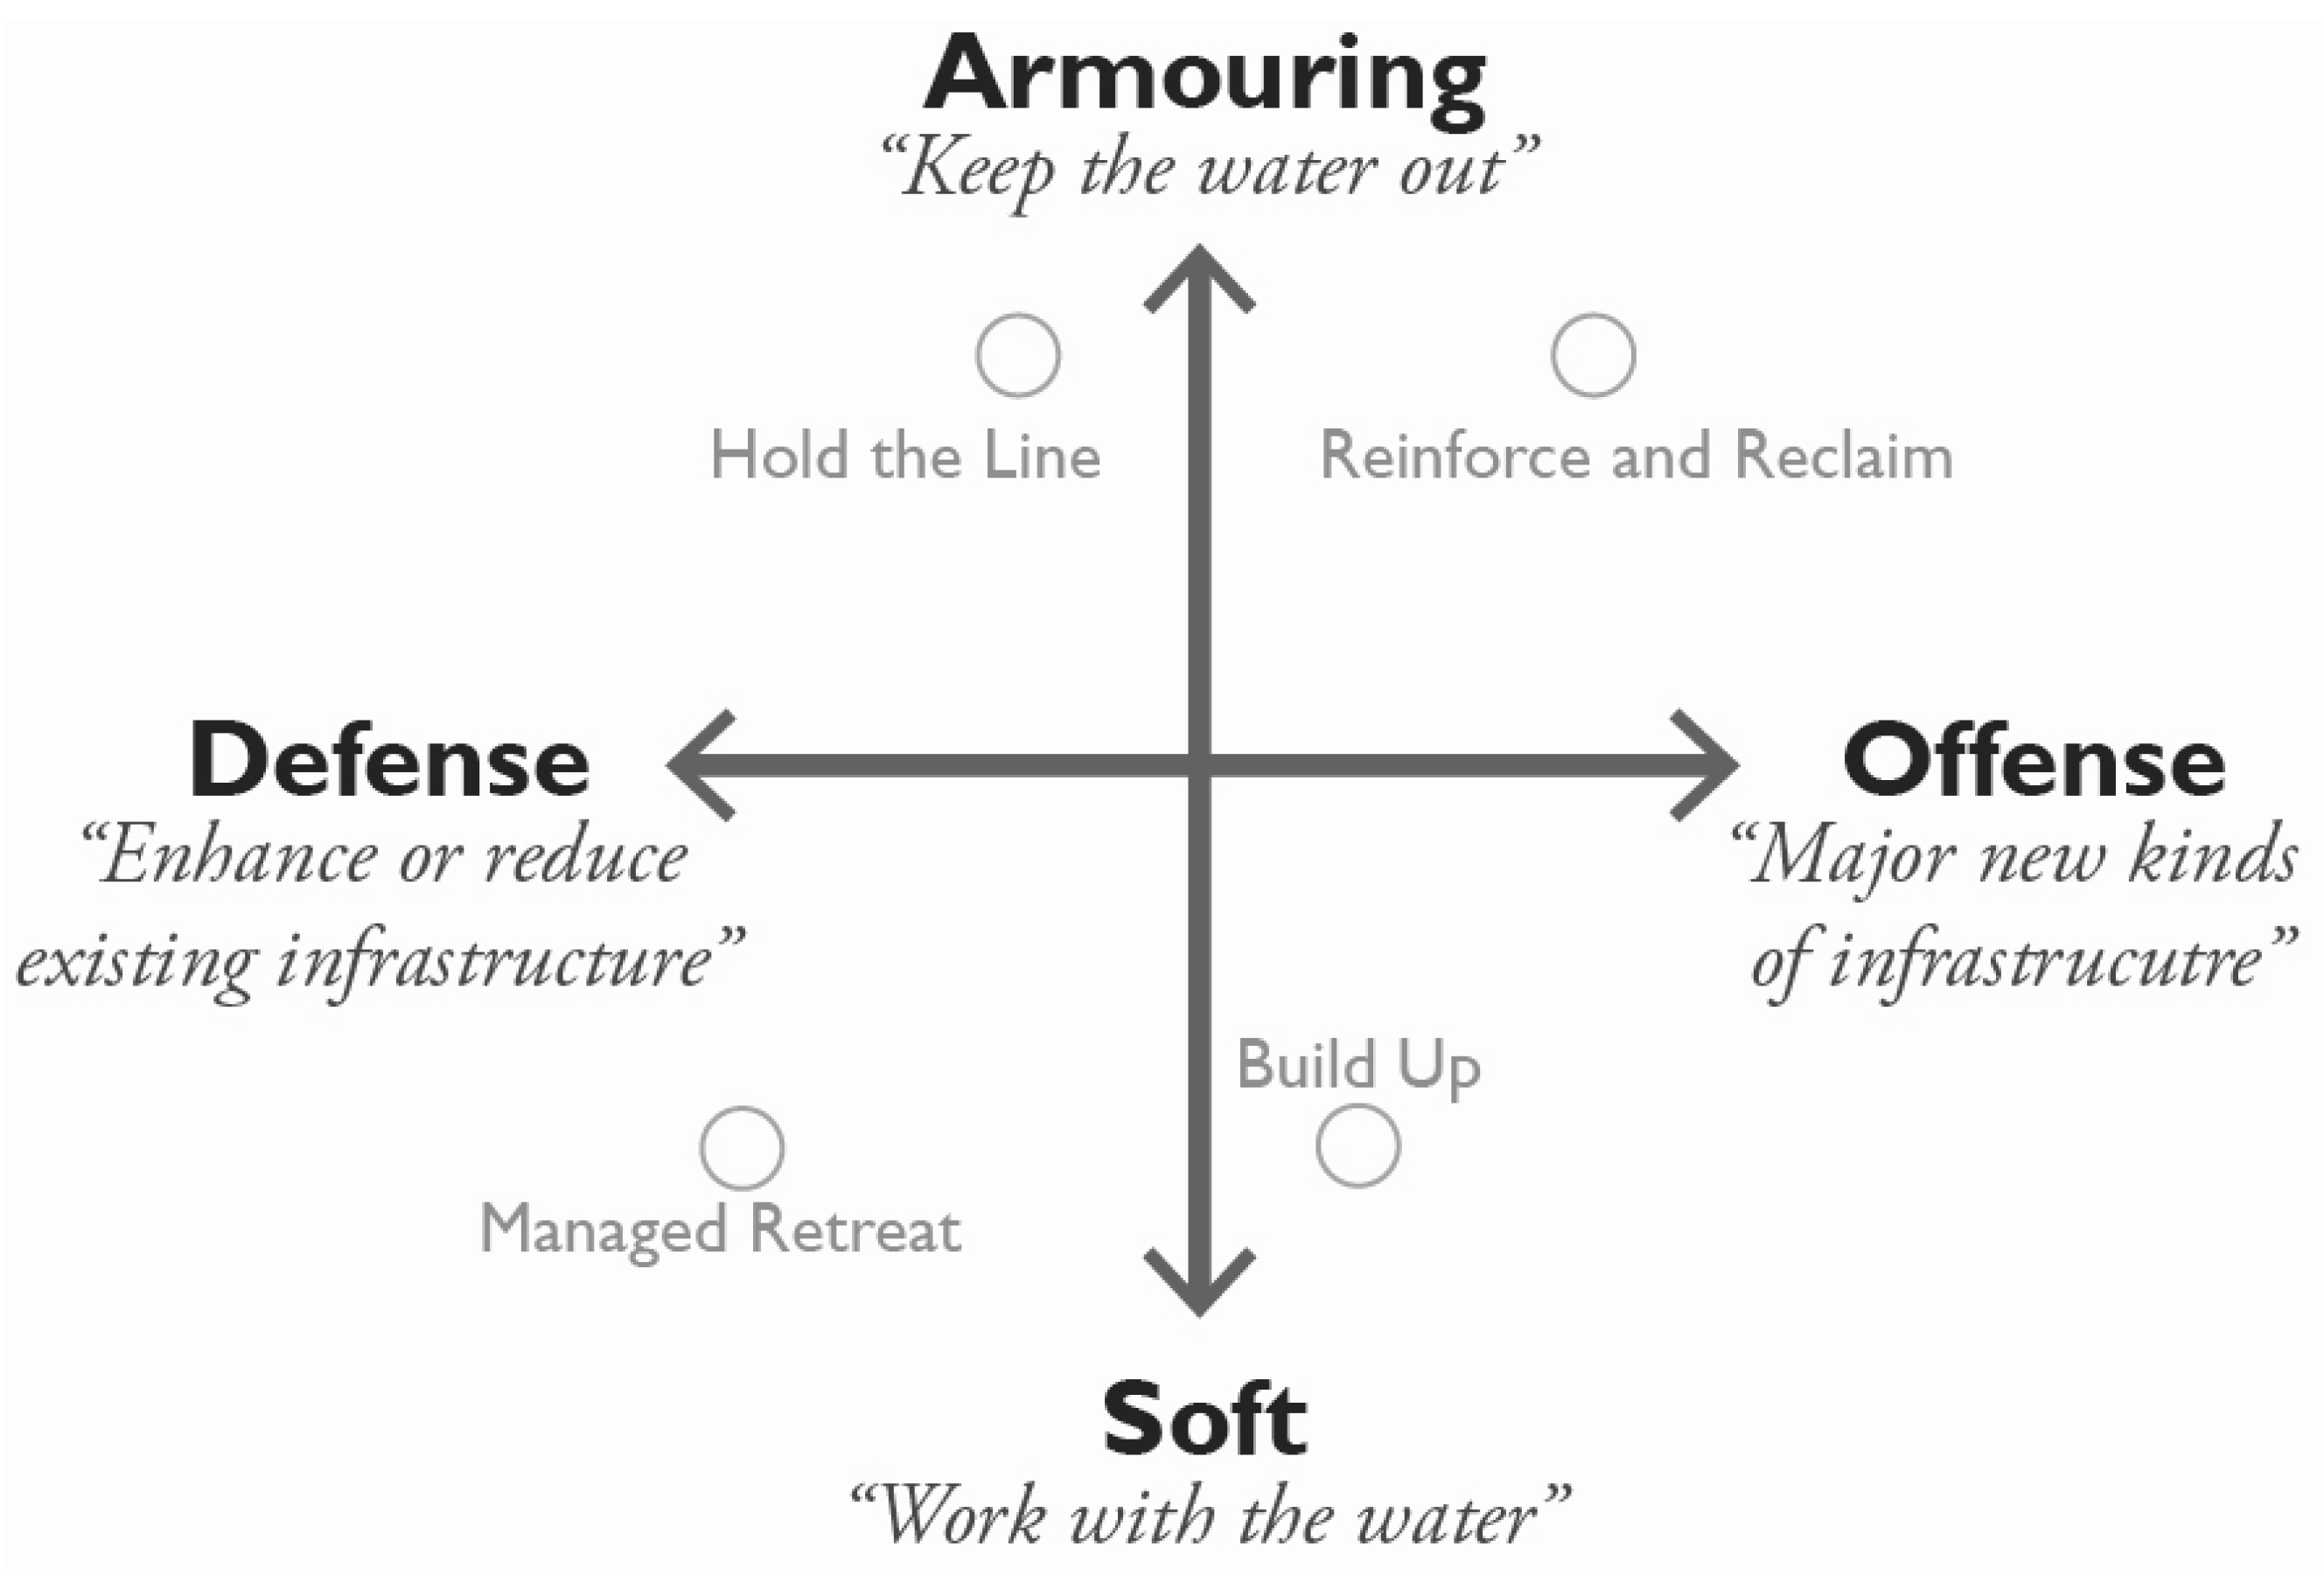
3.1. The Four Adaptation Scenarios
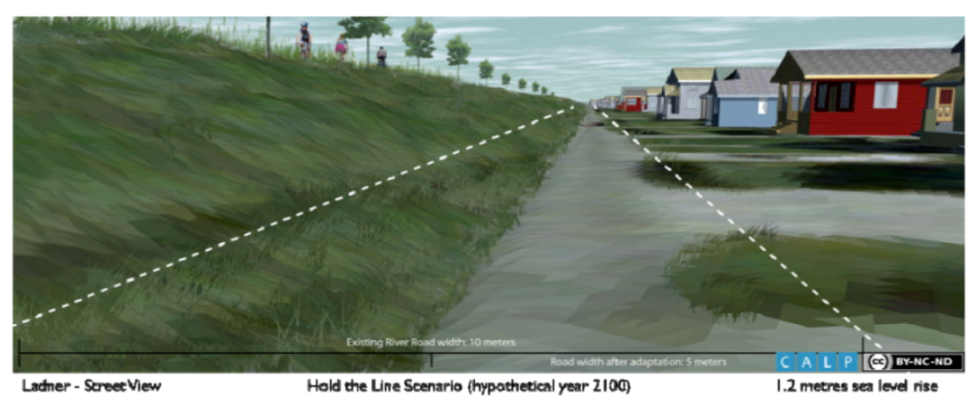
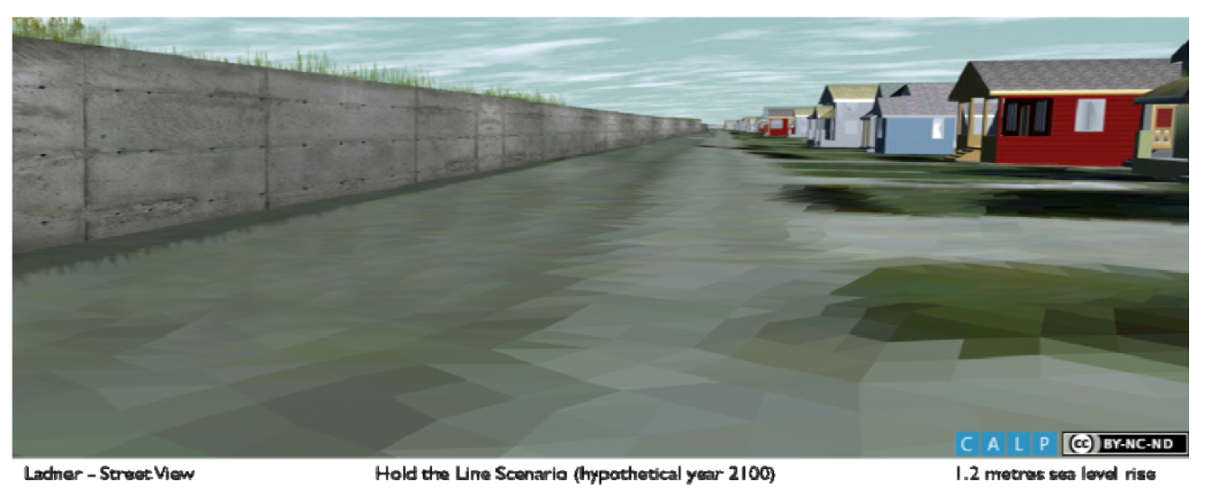
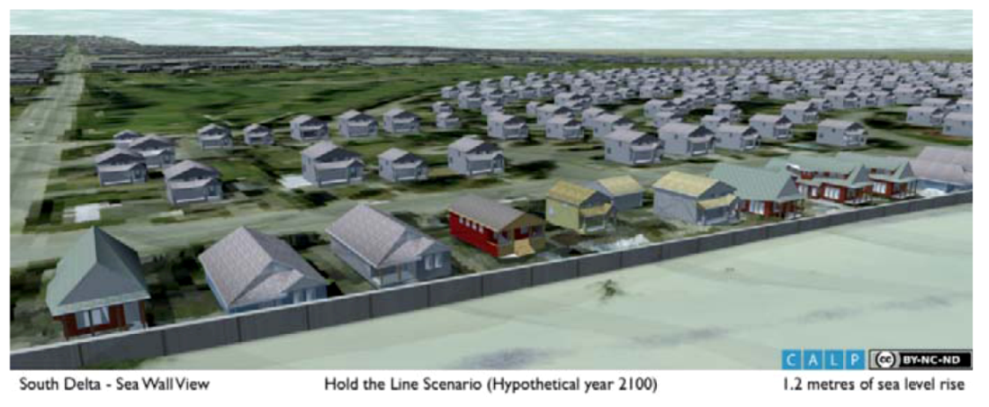
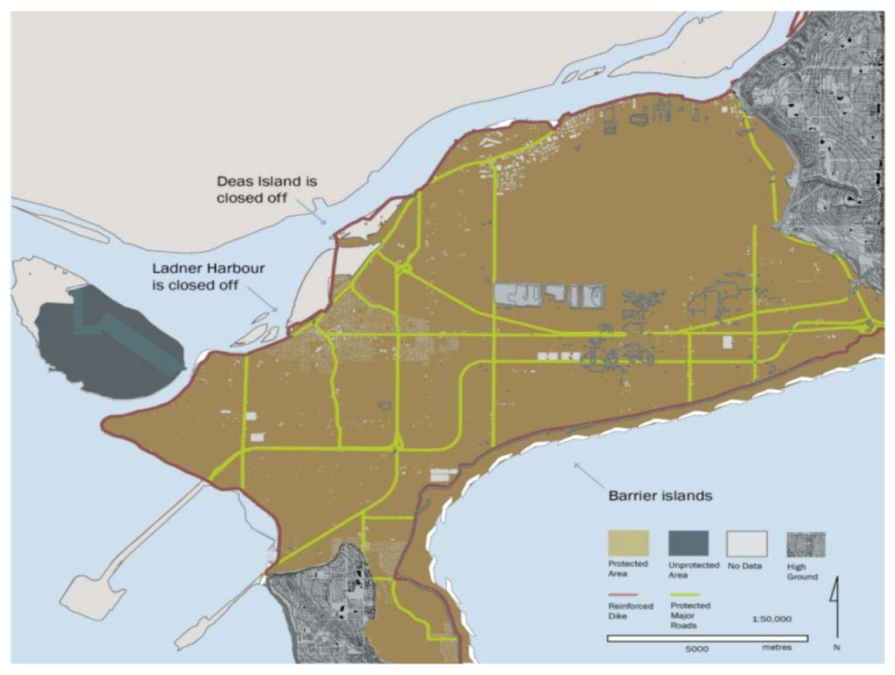
3.1.1. Hold the Line

| 2010 Guideline | 2100 Guideline | |
|---|---|---|
| Sea Dike Guidelines | (CGD, m above mean sea level) | CGD, m above mean sea level) |
| Designated Flood Level (Includes maximum high tide, sea level rise, storm surge and wind) | 3.45 m | 4.8 m |
| Dike Crest Elevation (Accounts for wave run-up, overtopping, wind and wave setup) | 4.4 m | 6.9 m |


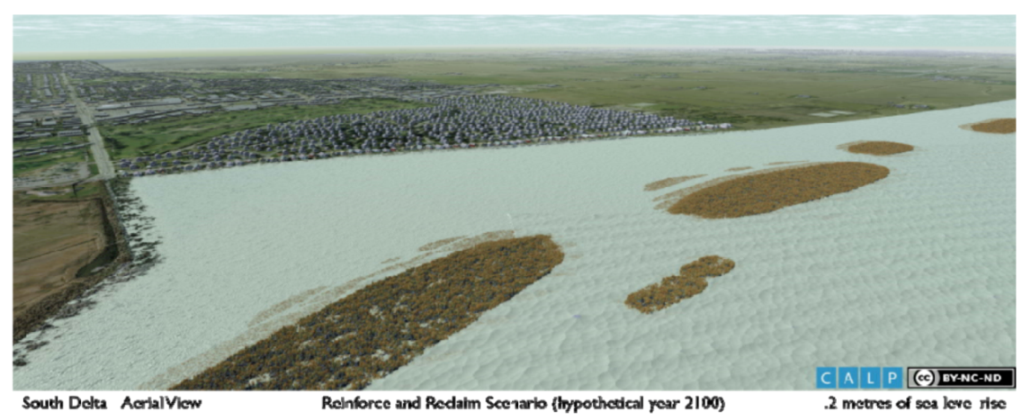
3.1.2. Reinforce and Reclaim


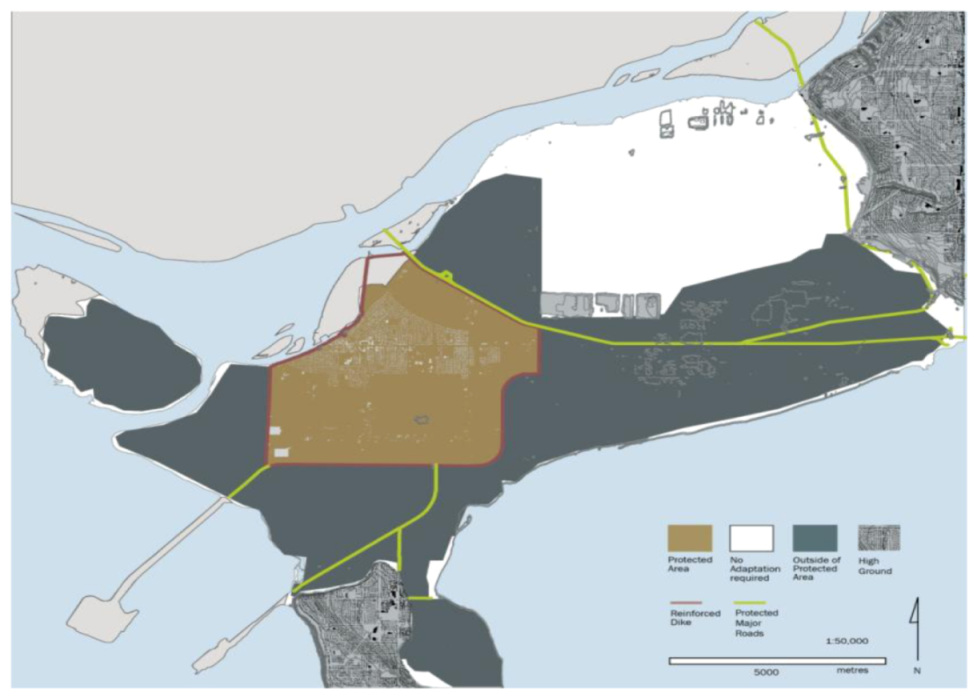
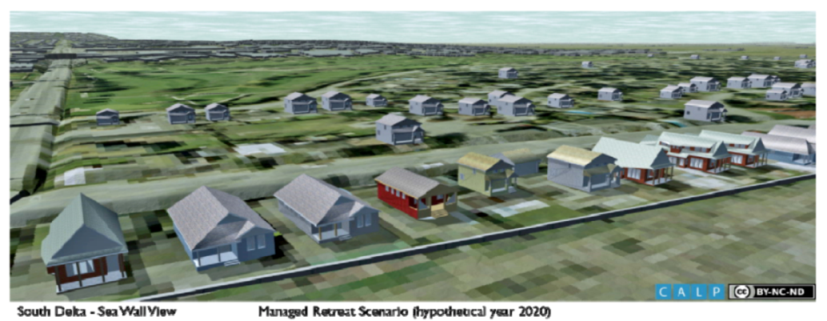
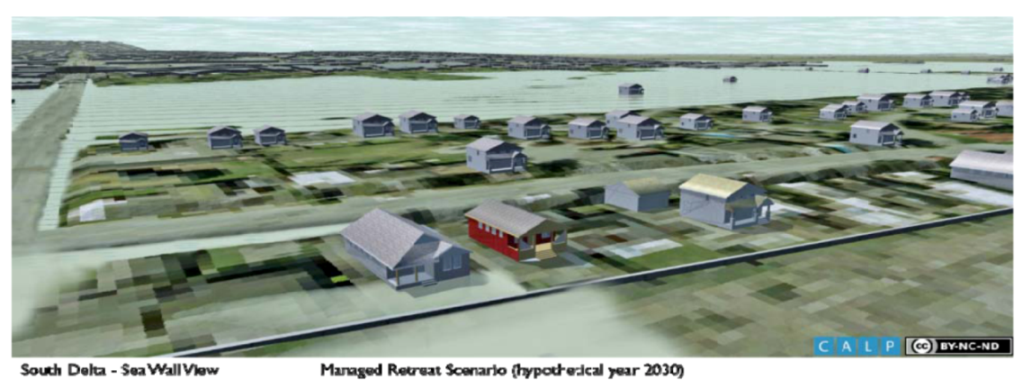
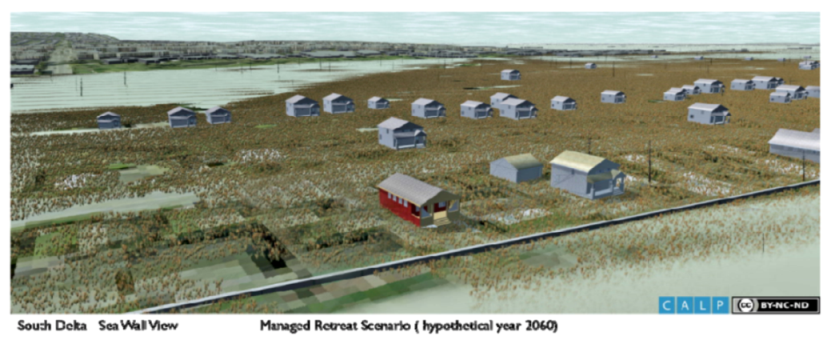
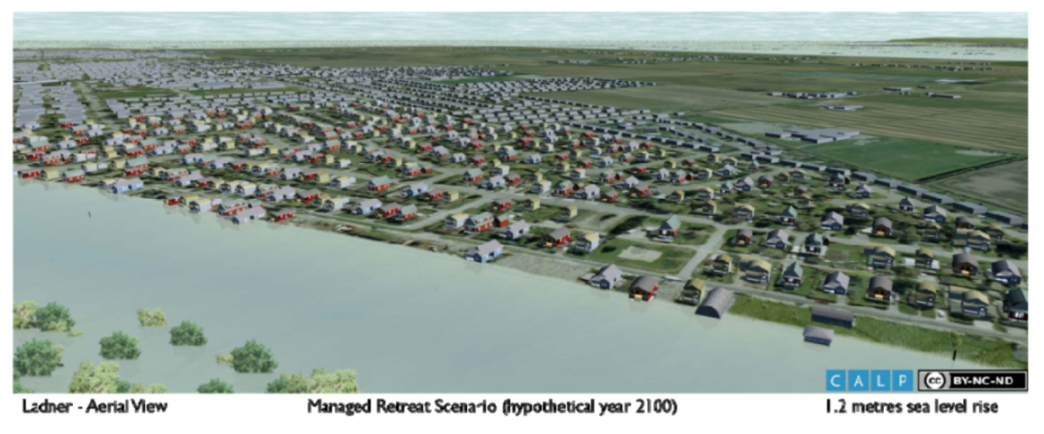
3.1.3. Managed Retreat


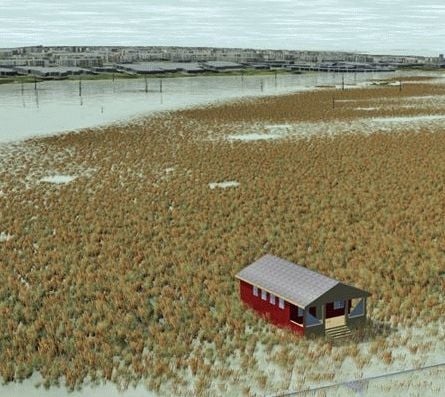
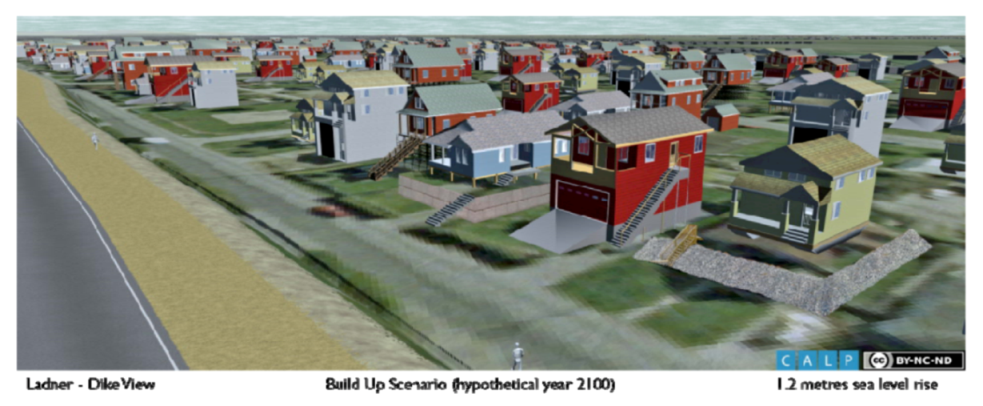
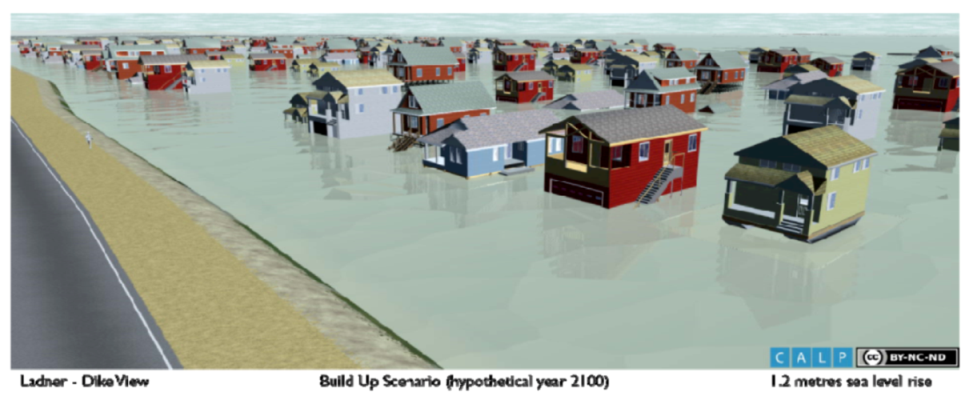
3.1.4. Build Up

| 2010 Guideline | 2100 Guideline | |
|---|---|---|
| Guidelines for Management of Coastal Flood Hazards Land Use | (CGD, m above mean sea level) | (CGD, m above mean sea level) |
| Flood Construction Reference Plane (FCRP) (Designated Flood Level + estimated wave effect) | 3.45 m | 5.6 m |
| Flood Construction Level (Flood Construction Reference Plane + freeboard) | 4.05 m | 6.2 m |


3.2. Indicator Measurements of the Four Adaptation Scenarios
| Description | Calculation Method | Baseline (current condition) | Hold The Line (future scenario) | Reinforce and Reclaim (future scenario) | Managed Retreat (future scenario) | Build Up (future scenario) | |
|---|---|---|---|---|---|---|---|
| Agricultural land | Total Agricultural land protected and unprotected | Land within the sea level rise planning area zoned Agricultural Land Reserve or with Agriculture as its primary use | 8600 Ha | Protected: 7800 Ha Unprotected: 800 Ha | Protected: 7,800 Ha Unprotected: 800 Ha | Protected: 1700 Ha Unprotected: 6900 Ha | Protected: 0 Ha Unprotected: 8600 Ha |
| Impacts to wildlife habitat | Qualitative effect on habitat | Assessment of relative gain or loss of habitat based on magnitude of potentially displaced high quality habitat [38] | 115 km of highly productive intertidal foreshore habitat2200 Ha of riparian hábitat 9500 Ha of intertidal habitat | Riparian habitat would not change significantly, intertidal habitat would decrease in extent due to “coastal squeeze” outside dikes | Riparian habitat would not change significantly, intertidal habitat would decrease less overall than in Hold The Line due to generation around barrier islands | Riparian and intertidal habitat would increase in extent | Riparian and intertidal habitat would increase in extent |
| Land base | Total protected (by dike) and unprotected land | Total protected and unprotected land in the sea level rise planning area | Sea level rise planning area: 10,200 Ha, most protected by current guidelines | Protected: 9300 Ha Unprotected: 900 Ha | Protected: 9,300 Ha Unprotected: 900 Ha + lands added in barrier islands | Protected: 2200 Ha Unprotected: 8000 Ha | Protected: 0 Ha Unprotected: 10,200 Ha |
| Transportation impacts (roads) | Total length of roads protected (raised) and unprotected (decommissioned) | Total length of roads raised and not raised in the sea level rise planning area (km) | Roads in sea level rise planning area: 380 km | Protected (inside dike): 340 km Raised/reinforced: 0 km Decommissioned: 40 km | Protected (inside dike): 340 km Raised/reinforced: 0 km Decommissioned: 40 km | Protected (inside dike): 110 km Raised/reinforced: 30 km Decommissioned: 240 km | Raised/reinforced: 140 km Decommissioned: 240 km |
| Infrastructure impacts (dikes/seawalls) | Total length of dikes protected (raised/reinforced) and unprotected (decommissioned) | Total length of dikes raised (reinforced and maintained) and decommissioned (not raised or maintained) in the sea level rise planning area (km) | Total dike length: 55 km (approximate) | Raised: 50 km Decommissioned: 5 km | Raised: 45 km 1 Decommissioned: 10 km | Raised: 22 km Decommissioned: 33 km | Raised: 0 km Decommissioned: 55 km |
| Infrastructure impacts (facilities) | Total number of critical facilities affected (hospitals, fire, police, schools) | Total number of hospitals, fire and police stations, and schools in the sea level rise planning area | Protected: 20 Unprotected: 0 | Protected: 20 Unprotected: 0 | Protected: 20 Unprotected: 0 | Protected: 13 Unprotected: 7 | Protected: 20 (if built up) Unprotected: 0 |
| Impact to buildings | Number of buildings protected and unprotected | Total number of buildings protected and unprotected by dike raising and/or building modification in the sea level rise planning area | Protected: 8663 Unprotected: 0 | Protected: 8511 Unprotected: 152 | Protected: 8511 Unprotected: 152 | Protected: 5688 Unprotected: 2975 (but not lost is all relocated to managed retreat area or higher ground) | Protected: 0 Unprotected: 8663 (but not lost if all built-up) |
| Public acceptability | Visual impacts | Assessed by considering the 3D visualizations of each scenario for Ladner and/or Beach Grove | Not tested | Extensive view blockage, significant landscape change along dikes and seawalls. Little change across interior of sea level rise planning area. | Considerable view blockage, significant landscape change along seawalls, though less than in Hold The Line. Little change across interior of sea level rise planning area. | Major land use and landscape change over time; some new dikes and view blockage around Ladner. | Widespread landscape character and land use changes. |
| Public acceptability | Acceptability to concerns identified by stakeholder working group | Identified by considering the maps, 3D visualizations and full visioning package for each scenario for Ladner and/or Boundary Bay | Not Tested | Less suited for Boundary Bay due to challenges of blocking views, more suited for Ladner due to return-on-investment. | Best suited for Boundary Bay due to reduced view blockage, suitability for habitat restoration, appropriate for storms across Boundary Bay; less suited for Ladner due to spatial/Fraser River constraints and Westham Island may serve as a kind of barrier already. Generally this was a more acceptable alternative to Hold The Line. | May be suitable to protect most valuable lands/areas of concentrated infrastructure and people due to logistics and return-on-investment. Larger role of government than in Build Up. | May be suitable for certain areas where there aren’t resources available for dike raising, sparse population and infrastructure that wouldn’t warrant widespread diking. Changes to property access within built-up areas though building function could be maintained. Larger role for private land owner than in Managed Retreat. |
| Policy change required | Degree to which current policies would need to be changed | Based on outcomes of policy workshop with Delta planning staff | N/A | Most in accordance with current policy | In accordance with current policy, though extensive barrier islands new for Delta | Retreat is least in accordance with current policy | Use of Flood Construction Levels in accordance with current policy |
| Culture/heritage impacts | Number of cultural/heritage sites protected by adaptive action | Total number of culturally and historically important features in sea level rise planning area that would be protected from inundation after adaptation strategies implemented 2 | 12 | 11 | 11 | 5 | 12 (if all built up) |
| Costs | Capital/implementation costs 3 | Total length of roads and/or dikes raised/reinforced multiplied by a cost of $1.13 million/km [39] 4 | 380 km of roads 55 km of dikes | $0 for raised roads $51 million for raised dikes | $0 for raised roads $51 million for raised dikes + cost of barrier islands | $34 million for raised roads $25 million for raised dikes | $159 million for raised roads $0 for raised dikes |
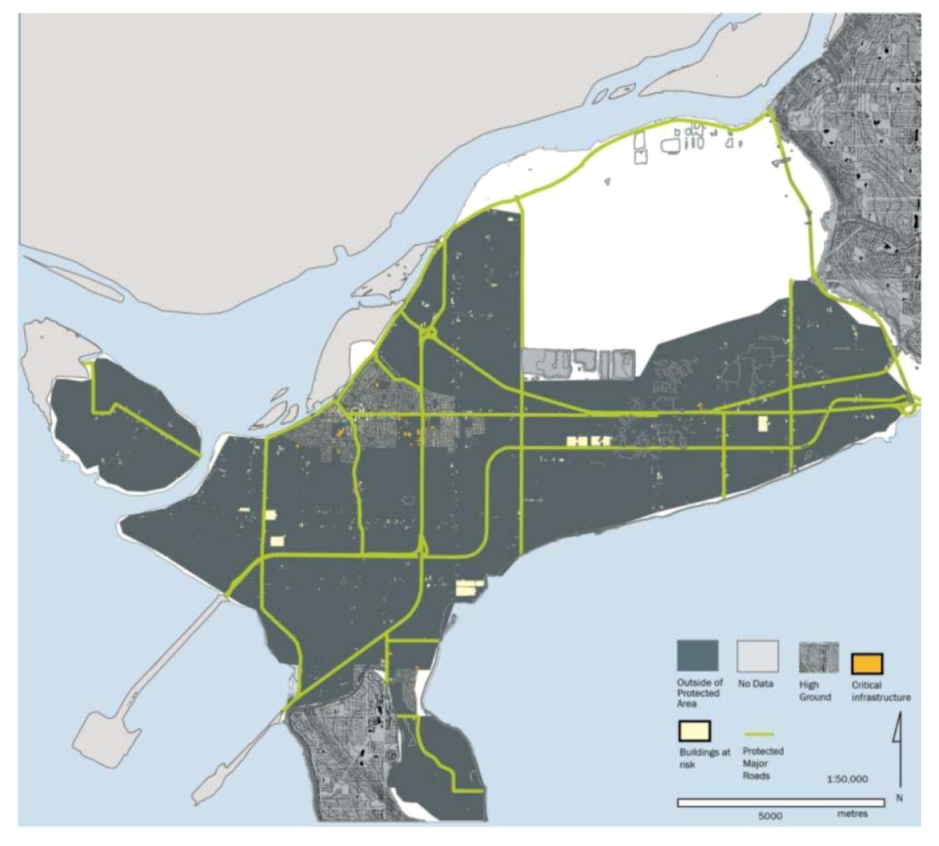
| Damages | Damage to private/public property from inundation event | Protected/Unprotected area (Figure 8-Figure 11) × Property value [40] for land within the sea level rise planning area | $5.85 billion | $5.8 billion protected $49 million converted | $5.8 billion protected $49 million converted | $4.0 billion protected $1.9 billion converted | $3.8 billion in land sometimes inundated $1.6 billion in buildings “protected” if raised $408.5 million in buildings converted |
4. Discussion and Conclusions
4.1. Overarching Recommendations for Advancing Adaptation
- • Provide a strong basis for lobbying higher government and other potential funding sources;
- • Identify and exploit win/win opportunities in meeting multiple objectives such as safeguarding community assets such as wildlife and agricultural production, meeting adopted carbon emission reduction targets and reducing dependency on fossil fuels, providing more jobs in the community and developing the local tax base, improved transit, etc.;
- • Form strategic alliances with other communities and agencies on issues such as local food security and funding technical studies, to provide continuity and mutual support in infrastructure approaches across municipal boundaries, for example.
4.2. Specific Recommendations for Communities Like Delta
4.2.1. Plan for Amending the OCP to Systematically Incorporate Sea Level Rise and Related Climate Change Issues
4.2.2. Incorporate Sea Level Rise Planning into the Ongoing Activities and Operations of the Corporation
4.2.3. Adopt Amended Sea Level Rise Planning Area Terminology
4.2.4. Link this Project to Delta’s ICLEI Adaptation Process
4.2.5. Develop Collaborations and Alliances
4.2.6. Develop and Initiate a Comprehensive Community Engagement Plan
4.2.7. Begin Detailed Analysis
- i. A “No Action” Scenario developed in detail, taking into account a full range of impacts such as frequency of flooding projections, storm surge events, Fraser River flooding and increased rainfall intensity. This will also give a better understanding of damage costs and implications potentially avoided by the scenarios.
- ii. Costing Studies: comprehensive assessments of the land, property, and ecological stock at risk and its value for the Delta community. Furthermore a costing study of the various adaptation options would be influential on decision-making. The absence of these kinds of analysis as part of this study is a limitation.
- iii. Insurance and Disaster Relief Study, consulting with private insurance companies and all levels of government to get a better understanding of private and public flood insurance issues.
- iv. Soil and Saltwater Intrusion Study, addressing agricultural soil quality and elevations in the Sea Level Rise planning area to get a better understanding of which agricultural parcels are most valuable in terms of soil quality, and which are less vulnerable to salinization of the water table. A study should be conducted to model and project potential saltwater intrusion of the groundwater table as sea levels rise.
- v. Habitat Study: a detailed study of habitat within the Sea Level Rise Planning Area and areas outside the dikes, to assess which parcels are most valuable, which are at risk to coastal squeeze, which could support habitat restoration, etc.
- vi. Feasibility Study for Key Adaptation Measures, considering costs, phasing, etc., in the context of future cost increases in energy and other key variables
- vii. Unfunded liabilities study of existing municipal infrastructure to determine how many years existing systems will last, how much is anticipated in on-going maintenance costs, and how much tax base is necessary to support these expenditures.
4.2.8. Conduct an Area by Area Vulnerability Analysis and Aggregate for Overall Planning
Acknowledgments
Conflict of Interest
References
- Smit, B.; Burton, I.; Klein, R.; Wandel, J. An anatomy of adaptation to climate change and variability. Climatic Change 2000, 45, 223–251. [Google Scholar] [CrossRef]
- Birkmann, J.; Garschagen, M.; Kraas, F.; Quang, N. Adaptive urban governance: New challenges for the second generation of urban adaptation strategies to climate change. Sustain. Sci. 2010, 5, 185–206. [Google Scholar] [CrossRef]
- Hunt, A.; Watkiss, P. Climate change impacts and adaptation in cities: A review of the literature. Climatic Change 2010, 104, 13–49. [Google Scholar] [CrossRef] [Green Version]
- Shaw, A.; Sheppard, S.R.J.; Burch, S.; Flanders, D.; Weik, A.; Carmichael, J.; Robinson, J.; Cohen, S. How futures matter-Synthesizing, downscaling, and visualizing climate change scenarios for participatory capacity building. Global Environ. Change 2009, 19, 447–463. [Google Scholar] [CrossRef]
- Tatebe, K.; Shaw, A.; Sheppard, S.R.J. Technical Report on Local Climate Change Visioning for Delta: Findings and Recommendations; Version 1.0, 22 February 2010; Collaborative for Advanced Landscape Planning, University of British Columbia: Vancouver, BC, USA, 2010; p. 42. [Google Scholar]
- Sheppard, S.R.J.; Shaw, A.; Flanders, D.; Burch, S.; Weik, A.; Carmichael, J.; Robinson, J.; Cohen, S.J. Future visioning of local climate change: A framework for community engagement and planning with scenarios and visualization. Futures 2011, 43, 400–412. [Google Scholar] [CrossRef]
- Burch, S.; Sheppard, S.R.J.; Shaw, A.; Flanders, D. Planning for climate change in a flood-prone community: Municipal barriers to policy action and the use of visualizations as decision-support tools. J.Flood Risk Manag. 2010, 3, 126–139. [Google Scholar] [CrossRef]
- Flanders, D. NASA World Wind. Available online: http://worldwind.arc.nasa.gov (accessed on 31 August,2012).
- Picketts, I.M.; Werner, A.T.; Murdock, T.Q.; Curry, J.; Dery, S.J.; Dyer, D. Planning for climate change adaptation: Lessons learned from a community-based workshop. Environ. Sci. Policy 2012, 17, 82–93. [Google Scholar] [CrossRef]
- Cohen, S.J.; Waddell, M.W. Climate Change in the 21st Century; McGill-Queen’s University Press: Montreal, QC, Canada, 2009. [Google Scholar]
- Liepa, I. Adapting to Climate Change in Kimberley; BC Report and Recommendations; Columbia Basin Trust: Castlegar, BC, Canada, 2009. [Google Scholar]
- Schneider, S.H.; Semenov, S.; Patwardhan, A.; Burton, I.; Magadza, C.H.D.; Oppenheimer, M.; Pittock, A.B.; Rahman, A.; Smith, J.B.; Suarez, A.; et al. Assessing Key Vulnerabilities and the Risk from Climate Change. In Climate Change 2007: Impacts, Adaptation and Vulnerability. Contribution of Working Group II to the Fourth Assessment Report of the Intergovernmental Panel on Climate Change; Parry, M.L., Canziani, O.F., Palutikof, J.P., van der Linden, P.J., Hanson, C.E., Eds.; Cambridge University Press: Cambridge, UK, 2007; pp. 779–810. [Google Scholar]
- Adger, W.N.; Dessai, S.; Goulden, M.; Hulme, M.; Lorenzoni, I.; Nelson, D.R.; Naess, L.O.; Wolf, J.; Wreford, A. Are there social limits to adaptation to climate change? Climatic Change 2009, 93, 335–354. [Google Scholar] [CrossRef]
- Adger, W.N.; Arnell, N.W.; Tompkins, E.L. Successful adaptation to climate change across scales. Global Environ. Change 2005, 15, 77–86. [Google Scholar] [CrossRef]
- Burton, I.; Malone, E.; Huq, S. United Nations Development Programme 2005 Adaptation Policy Frameworks for Climate Change: Developing Strategies Policies and Measures; Technical Papers 1–8; United Nation Development Programme; Lim, B., Spanger-Siegfried, E., Eds.; Cambridge University Press: Cambridge, UK, 2004. [Google Scholar]
- Dessai, S.; Lu, X.; Risbey, J.S. On the role of climate scenarios for adaptation planning. Global Environ. Change 2005, 15, 87–97. [Google Scholar] [CrossRef]
- International Council for Local Environmental Initiatives (ICLEI) Canada, Changing Climate, Changing Communities. In Guide and Workbook for Canadian Municipalities; ICLEI Canada: Toronto, ON, Canada, 2010.
- King County. In King County Climate Action Plan; King County: Seattle, WA, USA, 2009 February.
- Ligeti, E.; Penney, J.; Wieditz, I. Cities preparing for climate change. A study of six urban regions. Clean Air Partnership: Toronto, May 2007. Available online: http://www.cleanairpartnership.org (accessed on 12 January 2012).
- King County. In King County Strategic Climate Action Plan; King County: Seattle, WA, USA, 2012 June.
- Columbia Basin Trust. Adaptation Resource Kit-Six-Step Planning Process. 2010. Available online: http://adaptationresourcekit.squarespace.com/six-step-planningprocess/ (accessed on 9 December 2011).
- Pond, E.; Schroth, O.; Sheppard, S.R.J.; Muir-Owen, S.; Liepa, I.; Campbell, C.; Flanders, D.; Tatebe, K. Local Climate Change Visioning and Landscape Visualizations: Guidance Manual. Collaborative for Advanced Landscape Planning; University of British Columbia: Vancouver, BC, Canada, 2010. [Google Scholar]
- Rapaport, E. Musquodoboit Harbour: Assessing Rural Vulnerability. Environmental Planning Studio Prepared for the School of Planning; Dalhousie University: Halifax, NS, Canada, 2011. [Google Scholar]
- NRCan Sea Level Rise Adaptation Planning Study for Halifax Harbour. Committee of the Whole, Halifax Regional Council, 9 February 2010. Available online: http://halifax.ca/regionalplanning/documents/SLRCowFeb92010revisedforwebsite.pdf (accessed on 31 May 2012).
- Cohen, S.J.; Sheppard, S.R.J.; Shaw, A.; Flanders, D.; Burch, S.; Taylor, B.; Hutchinson, D.; Cannon, A.; Hamilton, S.; Burton, B.; et al. Remembering the snows of yesteryear—Public responses to local climate change visioning of mountain snow packs and future community development in the District of North Vancouver, British Columbia, Canada. Mitig. Adapt. Strateg. Glob. Chang. 2012, 17, 25–49. [Google Scholar] [CrossRef]
- Schroth, O.; Pond, E.; Muir-Owen, S.; Campbell, C.; Sheppard, S.R.J. Tools for the Understanding of Spatio-Temporal Climate Scenarios in Local Planning: Kimberley, BC, Case Study; Swiss National Science Foudation SNSF: Bern, Switzerland, 2009. Available online: http://www.lviz.org/?p=231 (accessed on 31 May 2012).
- Sheppard, S.R.J. Visualizing Climate Change: A Guide to Visual Communication of Climate Change and Developing Local Solutions; Earthscan/Routledge: Abingdon, UK, 2012. [Google Scholar]
- Pond, E. UBC-CALP. Available online: http://www.calp.forestry.ubc.ca/wp-content/uploads/2010/02/CALP-Visioning-Guidance-Manual-Version-1.1.pdf (accessed on 31 August 2012).
- Barron, S.; Flanders, D.; Pond, E.; Tatebe, K.; Canete, G.; Sheppard, S.R.J.; Carmichael, J.; Muir-Owen, S. Delta-RAC Sea Level Rise Adaptation Visioning Study Policy Report; University of British Columbia: Vancouver, Canada, 2012. [Google Scholar]
- Flanders, D.; Barron, S.; Pond, E.; Canete, G.; Tatebe, K.; Carmichael, J.; Cohen, S.J.; Muir-Owen, S.; Sheppard, S.R.J. Delta-RAC Sea Level Rise Adaptation Visioning Study Technical Report; University of British Columbia: Vancouver, Canada, 2012. [Google Scholar]
- Delta RAC Sea Level Rise Adaptation. Available online: http://www.delta-adaptation-bc.ca (accessed on 31 August 2012).
- Delcan-DHV. 2011. In Sea Level Rise Breach Analysis—Technical Memorandum; Corporation of Delta: Delta, BC, Canada, 2011.
- BC Ministry of Environment, Climate Change Adaption Guidelines for Sea Dikes and Coastal Flood Hazard Land Use—Sea Dike Guidelines; Ausenco Sandwell: Brisbane, Australia, 2011.
- BC Ministry of Environment, Climate Change Adaption Guidelines for Sea Dikes and Coastal Flood Hazard Land Use—Guidelines for Management of Coastal Flood Hazard Land Use; Ausenco Sandwell: Brisbane, Australia, 2011.
- UBC-CALP. Personal communication.
- Canete, G. UBC-CALP. Personal communication.
- Flanders, D. UBC-CALP. Personal communication.
- Fraser Estuary Management Program (FREMP). Available online: http://www.bieapfremp.org/main_fremp.html (accessed on 31 May 2012).
- Kerr Wood Leidel. 2007. In Flood Management Study—Draft Final Report; Corporation of Delta: Delta, BC, Canada.
- BC Assessment. Available online: http://www.bcassessment.ca (accessed on 31 August 2012).
- Linham, M.M.; Nicholls, R.J. Technologies for Climate Change Adaptation. Coastal Erosion and Flooding; TNA Guidebook Series, UNEP: Nairobi, Kenya, 2010. [Google Scholar]
- Associated Programme on Flood Management (APFM, Adviescommissie Primaire Waterkeringen). 2006. Tussensprint naar 2015–advies over de financiering van primaire waterkeringen voor de bescherming van Nederland tegen overstromingen (in Dutch). Available online: http://climatetechwiki.org/content/sea-dikes (accessed on 31 May 2012).
- Lake Okeechobee and the Herbert Hoover Dike, U.S. Army Core of Engineers. Available online: http://www.saj.usace.army.mil/Divisions/ProgramProjectMgt/Branches/EcoSys/Okeechobee/LakeO/DOCS/LakeOandHHDike.pdf (accessed on 31 August 2012).
- Communication with speaker from the Consulate General of The Netherlands at Flood Management and Mitigation Seminar, hosted by Delcan Engineers and Emergency Management BC, May 2012. Available online: http://www.youtube.com/watch?v=qIqlvpwlPLk&feature=player_embedded (accessed on 31 May 2012).
© 2012 by the authors; licensee MDPI, Basel, Switzerland. This article is an open-access article distributed under the terms and conditions of the Creative Commons Attribution license (http://creativecommons.org/licenses/by/3.0/).
Share and Cite
Barron, S.; Canete, G.; Carmichael, J.; Flanders, D.; Pond, E.; Sheppard, S.; Tatebe, K. A Climate Change Adaptation Planning Process for Low-Lying, Communities Vulnerable to Sea Level Rise. Sustainability 2012, 4, 2176-2208. https://0-doi-org.brum.beds.ac.uk/10.3390/su4092176
Barron S, Canete G, Carmichael J, Flanders D, Pond E, Sheppard S, Tatebe K. A Climate Change Adaptation Planning Process for Low-Lying, Communities Vulnerable to Sea Level Rise. Sustainability. 2012; 4(9):2176-2208. https://0-doi-org.brum.beds.ac.uk/10.3390/su4092176
Chicago/Turabian StyleBarron, Sara, Glenis Canete, Jeff Carmichael, David Flanders, Ellen Pond, Stephen Sheppard, and Kristi Tatebe. 2012. "A Climate Change Adaptation Planning Process for Low-Lying, Communities Vulnerable to Sea Level Rise" Sustainability 4, no. 9: 2176-2208. https://0-doi-org.brum.beds.ac.uk/10.3390/su4092176