Article

Carbon Footprint of Beef Cattle

1
Science and Technology Branch, Agriculture and Agri-Food Canada, 960 Carling Avenue, Ottawa, ON, K1A 0C6, Canada
2
Private Consultant, Ottawa, ON, K2A 1G6, Canada
3
Centre Interuniversitaire de Recherche sur le Cycle de Vie des Produits, Procédés et Services (CIRAIG), 2500, Chemin Polytechnique, Montréal, QC, H3T 1J4, Canada
4
Private Consultant, Cambridge, ON, N3H 3Z9, Canada
5
Science and Technology Branch, Agriculture and Agri-Food Canada, 51 Campus Drive, 5C74 Agriculture Building, Saskatoon, Saskatchewan, S7N 5A8, Canada
*
Author to whom correspondence should be addressed.
Sustainability 2012, 4(12), 3279-3301; https://0-doi-org.brum.beds.ac.uk/10.3390/su4123279
Submission received: 1 November 2012 / Revised: 23 November 2012 / Accepted: 26 November 2012 / Published: 3 December 2012

Abstract

:
The carbon footprint of beef cattle is presented for Canada, The United States, The European Union, Australia and Brazil. The values ranged between 8 and 22 kg CO2e per kg of live weight (LW) depending on the type of farming system, the location, the year, the type of management practices, the allocation, as well as the boundaries of the study. Substantial reductions have been observed for most of these countries in the last thirty years. For instance, in Canada the mean carbon footprint of beef cattle at the exit gate of the farm decreased from 18.2 kg CO2e per kg LW in 1981 to 9.5 kg CO2e per kg LW in 2006 mainly because of improved genetics, better diets, and more sustainable land management practices. Cattle production results in products other than meat, such as hides, offal and products for rendering plants; hence the environmental burden must be distributed between these useful products. In order to do this, the cattle carbon footprint needs to be reported in kg of CO2e per kg of product. For example, in Canada in 2006, on a mass basis, the carbon footprint of cattle by-products at the exit gate of the slaughterhouse was 12.9 kg CO2e per kg of product. Based on an economic allocation, the carbon footprints of meat (primal cuts), hide, offal and fat, bones and other products for rendering were 19.6, 12.3, 7 and 2 kg CO2e per kg of product, respectively.

1. Introduction

Beef production, which is one of the largest industries in the agriculture sector, is a significant source of greenhouse gas (GHG) emissions. The main source is from a process known as enteric fermentation, whereby the microbial decomposition of feed in the forestomach, or the rumen, of the animal results in the production and release of a substantial quantity of methane (CH4). Other sources of GHGs associated with beef production include manure storage and land application, which result in CH4 and nitrous oxide (N2O) emissions and the production of feed crops, which results in N2O and carbon dioxide (CO2) emissions. Carbon dioxide emissions are primarily due to the manufacturing and operation of farm machinery and vehicles, the manufacturing of fertilizers and agrochemicals, as well as the manufacturing of farm buildings and electrical power generation. Additional emissions are associated with a change in land management practices, which can influence carbon stored in the soil, resulting in either CO2 emissions or CO2 sequestration, as soil organic carbon. Land use change can also be a significant source of CO2 as a result of the loss of soil carbon, as well as above-ground biomass associated with land degradation and/or deforestation. To consider the overall impact of CH4, N2O and CO2, it is essential to take into account the respective global warming potential of these gases. The magnitude of the emissions of these gases can then be reported in terms of carbon dioxide equivalents (CO2e), which is typically expressed over a 100 year time horizon [1] as
Sustainability 04 03279 i001
Greenhouse gas emissions, expressed in terms of a mass of CO2e, are accepted as the reporting unit for the carbon footprint.
Carbon footprint estimates should include all direct and indirect sources and sinks of GHGs associated with a product or service. If the carbon footprint of a product or service contributes significantly to the overall environmental impact and no pollution swapping occurs, then reducing the carbon footprint is one way to minimize the environmental impact. Improved farming practices usually lead to an increase in production efficiency, resulting in less GHG emissions per unit product [2]. The methodology for estimating the carbon footprint, which is still evolving [3], is based on Life Cycle Assessment (LCA) guidelines such as ISO 14044 [4] and PAS2050 [5], typically combined with GHG emission algorithms recommended by the IPCC [6]. In the case of the carbon footprint of beef cattle, a common functional unit is a kg of live weight (LW), which is the weight of the animal at the farm gate. Shrunk live weight (SLW), which is the weight of cattle at the entrance of the slaughterhouse, is also useful if the carbon footprints of other co-products are of interest. Alternatively, some studies report the GHG emissions per kg of carcass weight (CW), which does not include the hide, head, feet and guts. The CW:LW ratio varies substantially (0.68–0.45) depending on a range of factors including breed, sex, time of last feeding, and cold versus warm carcass weight. Cows tend to have a ratio near 0.50 with steers near 0.60. The objective of this review was to present and discuss the carbon footprint of beef cattle for some of the major beef exporting countries in order to compare the carbon footprint of cattle at an international scale. Because of the interest in deriving the carbon footprint of beef cattle hides, we also present the carbon footprint of beef cattle co-products at the exit gate of a slaughterhouse in Canada based on an economic allocation.

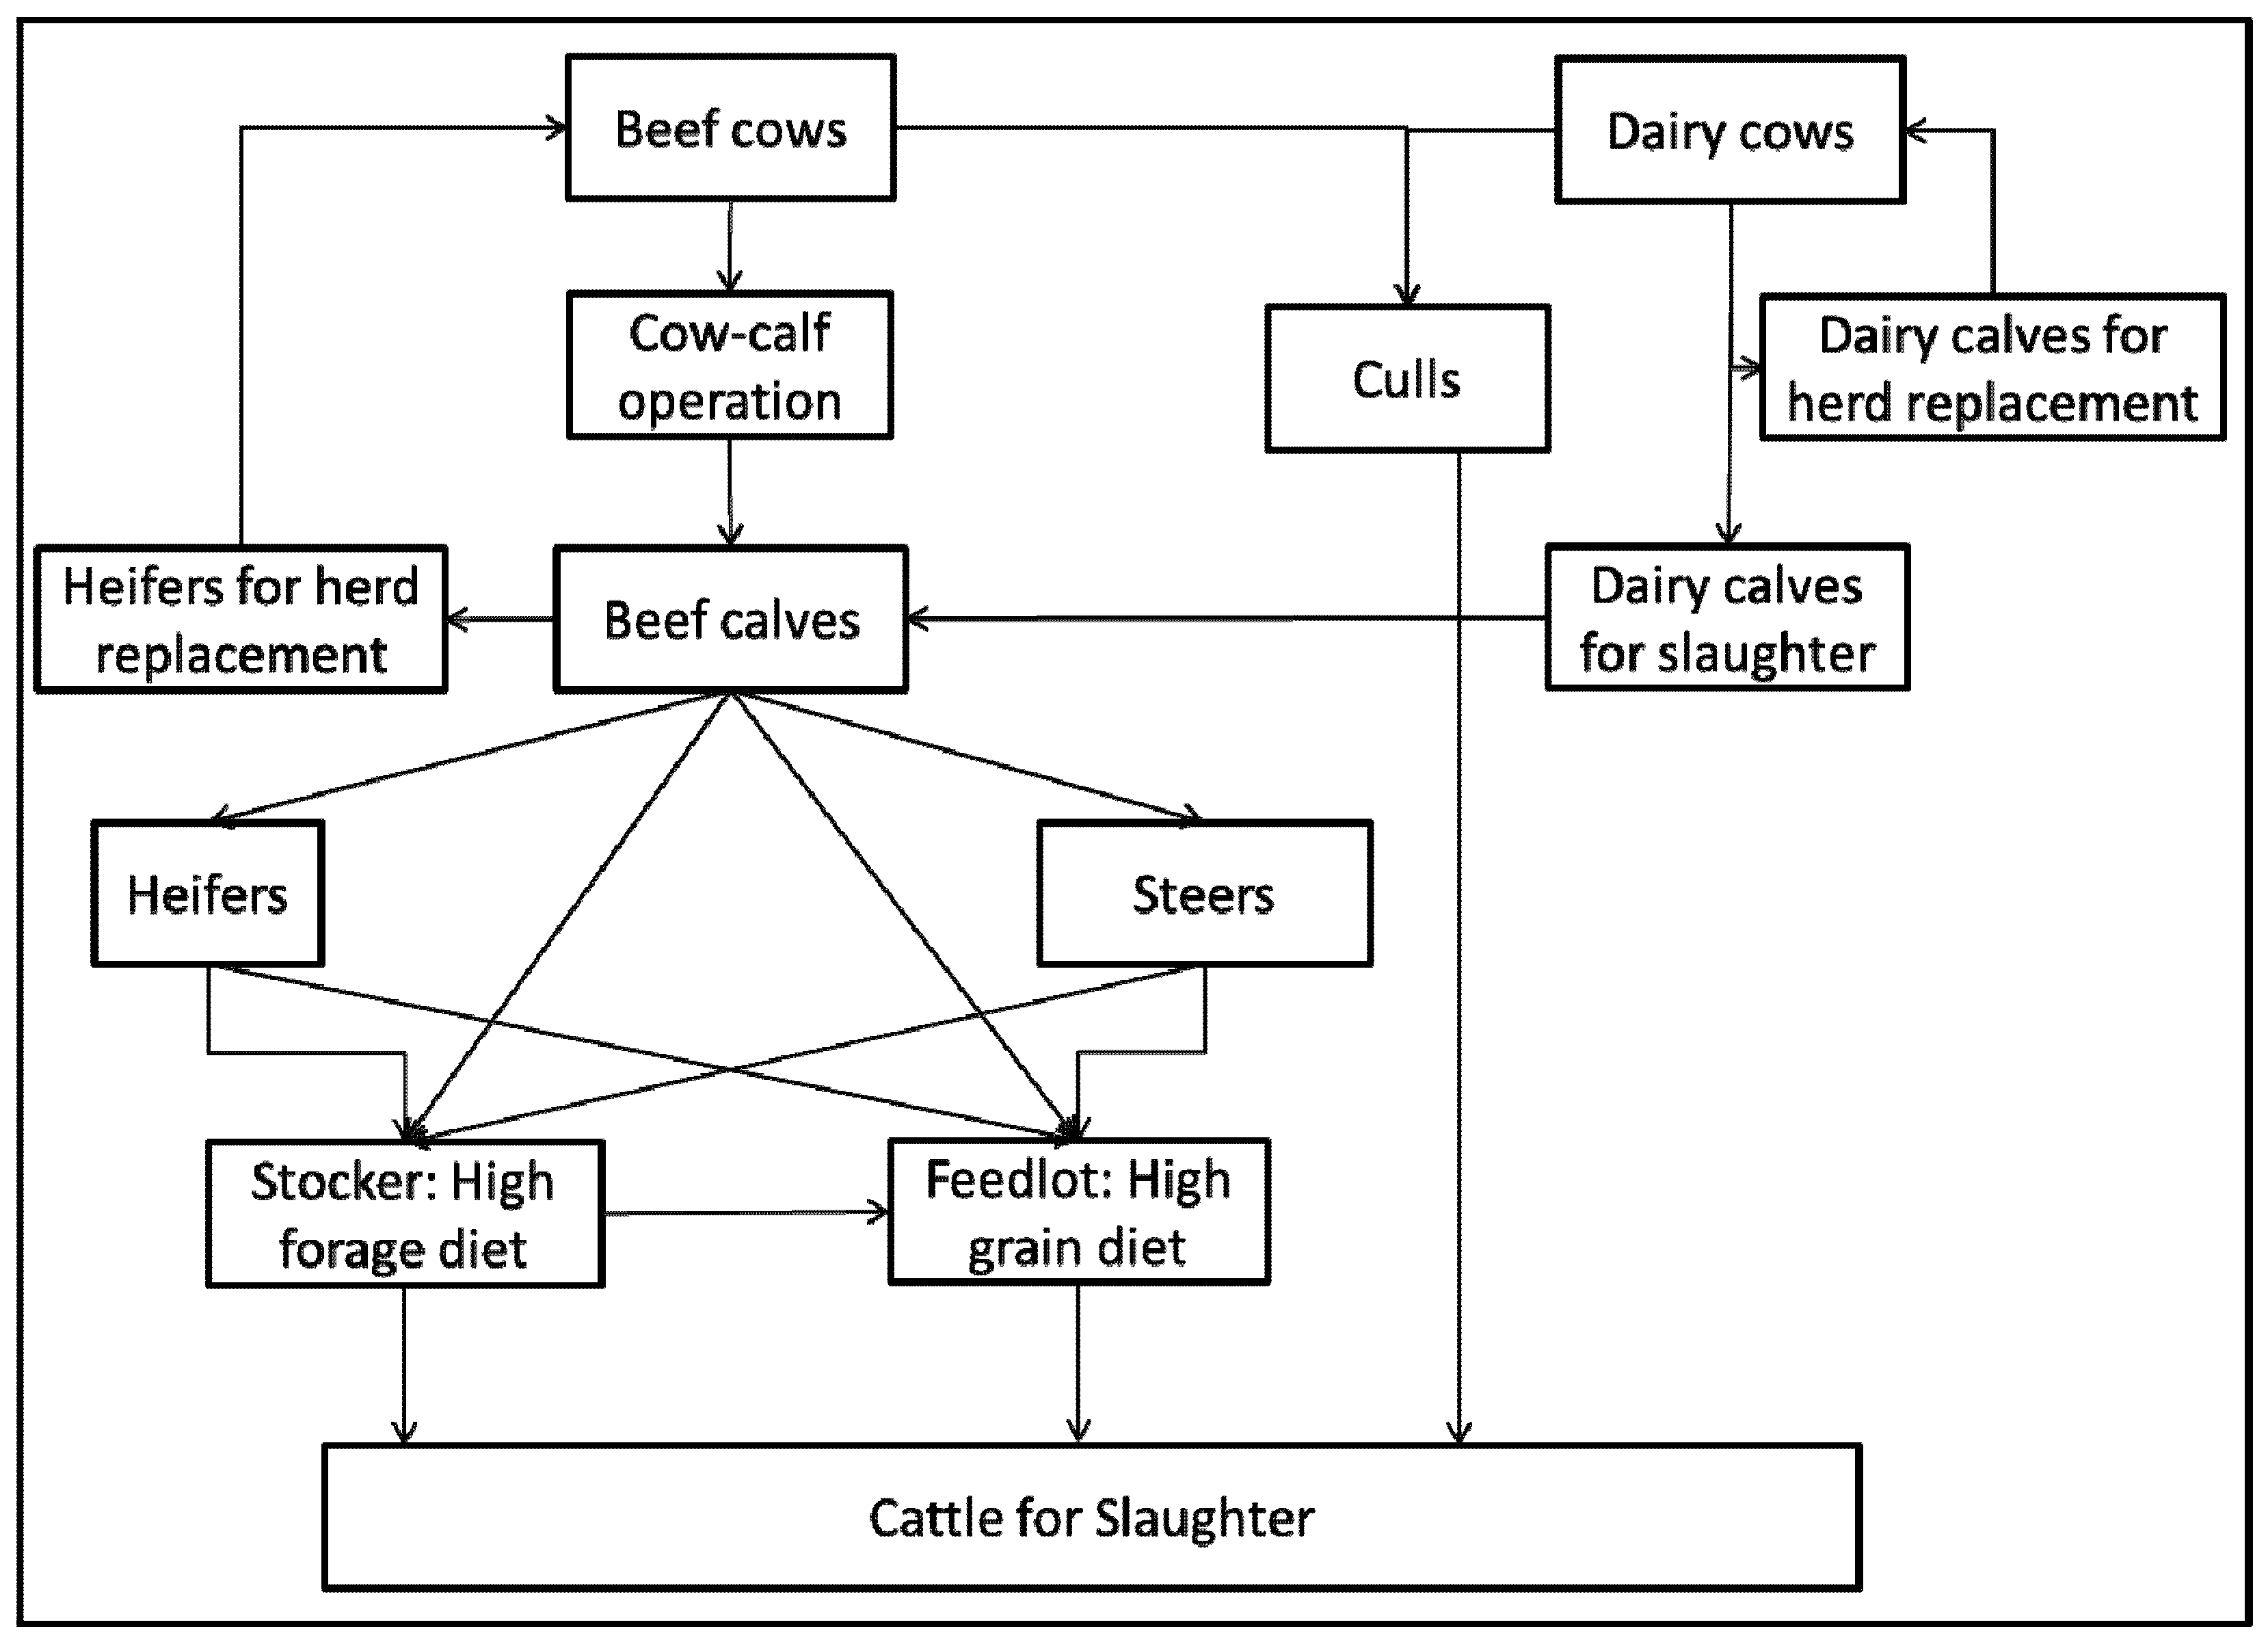
2. Beef Cattle Population and Productivity

The global beef cattle population was about 1.4 billion animals in 2010. About 25% was in Latin America, 28% in Asia, 20% in Africa, 10% in North America, 6% in the EU, 3% in Oceania and 6% in the Middle East. India and Brazil accounted for about 30% of the global beef population [7]. The ratio of beef production to the cattle population is a good indicator of the beef production efficiency. In 2010, North America (Canada, the United States and Mexico) with about 10% of the global cattle population produced nearly 25% of global beef supply. The United States was the largest beef producer in the world, with about 12 million tonnes produced on a stock of 94 million head. The high production efficiency has been attributed to the low-cost corn from the Midwest of the United States which is used for finishing cattle in feedlots [8]. The situation in western Canada is similar to the United States except that barley is used as a finishing ration. In Mexico, beef production is more extensive and feedlots are not as common. In 2010, the EU-27 produced 13% of the beef with 6% of the cattle population [7]. Other world leaders in beef export, such as South America and Oceania grow and finish beef cattle mainly on grass [8]. In 2010, Brazil was the second largest beef producer after the United States, while Argentina and Uruguay were also major players on the global beef market, particularly Argentina which was the world’s fourth largest beef exporting nation. Brazil, despite its low beef productivity [9], was the largest beef exporter, followed by Australia, the United States and Argentina [7].
Cattle producers are continuously improving production efficiency through breeding and improved management strategies. The degree of their success depends on many factors such as whether the cattle are raised intensively or extensively, whether the cattle are grass or grain finished, the quality and type of pasture, the management of feed crops and their location, the amount and type of chemical inputs, and the amount and type of energy used for farm operations. Animal productivity or the rate of weight gain is an important determinant of the carbon footprint of beef production. Grass-finished cattle tend to reduce their carbon footprint by consuming grasses grown requiring less fertilizer and chemical inputs. This effect is however, usually nullified from a carbon footprint perspective because their rate of weight gain is less than a grain-fed, feedlot finished animal, and they must spend more time on pasture, consuming feed and producing CH4 in order to reach market weight [10]. The fact that the CH4 emission factor per unit of feed consumed is substantially smaller for grain-finished cattle compounds this effect [11].
In the following section, we will present the carbon footprint of beef cattle for some of the major beef producing nations of the world. The carbon footprints of major cattle rearing (India) and beef producing (China and the Russian Federation) nations are not included in this review because of a lack of data. However, based on management strategies that predominate in these countries and the rate of beef production per head [7] leads us to believe that the carbon footprint of beef cattle in these countries is likely to be greater than the carbon footprint of most of the nations discussed in this study.

3. Carbon Footprint of Beef Cattle

The magnitude of the carbon footprint associated with the production of any product varies depending on the extent, or boundary, of the system selected, which defines the up and downstream processes that are included in the assessment. In this study, we define the boundary conditions as the ‘cradle to farm gate’, meaning that all GHG emissions occurring prior to cattle leaving the farm gate will be included. The IPCC [6] methodology is the basis for the carbon footprint estimates; it relies on a tiered system which is based on the availability of emission factors associated with activity data. Tier I relies on default empirical emission factors published by the IPCC [6], and is the simplest approach available. Tier II is still empirical in nature, as the emission factors are usually derived from experimental data specific to a country [12]. Tier III is the most complex method and relies on process-based models [13]. Moving to a higher Tier of estimation is considered a good practice.
Methane emissions are the primary factor influencing the carbon footprint of cattle. They have been reported to account for 55% [14] to 92% [15] of the carbon footprint, with the majority of the CH4 emissions arising from enteric fermentation. Depending on a suite of factors including feed quality, management practices, animal activity, and animal genetics, 3% [11] to 9.5% [16] of the energy consumed by cattle is lost as CH4. Adopting feeding practices that minimize the loss of CH4 improves animal productivity and reduces the carbon footprint of cattle.
Greenhouse gas emissions have been estimated on a national basis for many animal-based agricultural products, such as milk [17,18], beef [14,19], pork [20,21] and poultry [22,23] but many estimates are at a much smaller scale. For example, Beauchemin et al. [24] used Holos, a whole-farm GHG emissions model, developed by Agriculture and Agri-Food Canada to estimate the GHG emissions associated with a small operation typical of western Canadian beef production. Other tools such as DairyGHG [25] and the Cool Farm Tool [26] have been used to calculate the GHG emissions of animal-based agricultural products at the farm scale.
Cattle herd structure and management can have a substantial impact on the carbon footprint. In most developed, beef producing countries, the beef industry usually consists of cow-calf, stocker, feedlot and dairy systems, with an exchange of stock occurring between each of these systems (Figure 1). Although this structure is common in most nations, the management and proportion of cattle in the various categories varies considerably from country to country. For example, there is a greater proportion of dairy cows to beef cows in the EU as compared to the U.S. Feeding strategies can also have a substantial impact on the carbon footprint. For example, grain-fed feedlot cattle versus grass-fed cattle generally have a significantly different carbon footprint because of the time required to reach a certain weight. In grass-fed cattle, the quality of pasture can also affect productivity and the carbon footprint.
Figure 1. Flow diagram of the cattle destined for slaughter, typical in the North American production system.
Sustainability 04 03279 g001
Although many carbon footprint estimates are available in the literature, it is often difficult to compare results between studies (Table 1). There are many reasons for this, including a lack of consistency in terms of the boundaries chosen for the studies. For instance, in most regions, the beef and dairy sectors are linked, as surplus dairy calves are fattened for beef production and culled dairy cows also provide beef. However, the allocation of the environmental burdens between the beef and dairy sector for many of these cases is inconsistently performed. Casey and Holden [19] have shown that the allocation of emissions from dairy cows and dairy calves that enter in the beef production system greatly reduced GHG emissions from beef production in Ireland from 13.0 to 9.8 kg CO2e per kg LW. The degree of reduction is a function of the number of calves sourced from the dairy sector and the number of culled cows to the total number of slaughtered animals. Comparison of the carbon footprint between studies is difficult for other reasons, including an inconsistent inclusion of sources of emissions. For instance, calculations rarely include GHG emissions associated with capital goods such as the manufacturing of farm machinery [14]. Further, the impact of land use change and land management change on soil carbon is frequently not considered in the carbon footprint, but if it is, there are significant challenges to determine the appropriate amortization period and spatial extent associated with the emissions from land use change [9]. As a result, most of the carbon footprint estimates associated with beef production reported in the literature are limited in some way, making comparison between studies challenging.
Table 1. Summary of global carbon footprint studies associated with beef production. Carbon footprint values given in italics have been converted to kg CO2e per kg LW.
Study RegionMethod/Boundaries/AllocationManagement/spatial scale ΔSOC from LMC †,ǂΔSOC from LUC Footprint kg CO2e per kg LWRefNotes
Mid-West USAIPCC Tier 1 and 2/cradle to farm gate/chemical energy of co-productsFeedlot finished/studyeq14.8[27]Inclusion of carbon sequestration associated with LMC reduces carbon footprint to 13.6 and 11 kg CO2e per kg LW for feedlot and pasture finished beef.
Pasture finished/study19.2
Mid-West USAIPCC Tier 1 + literature survey/cradle to farm gate/ noneConventional cow-calf to feedlot/study13.0[28]Also provided are emissions estimates associated with 5 alternative production scenarios.
Western CanadaIPCC Tier 1 + 2/cradle to farm gate/noneConventional cow-calf to feedlot/studyeq13.0[24]
Eastern CanadaIPCC Tier 1 + 2/cradle to farm gate/ noneConventional/ regional + national15.3[14]Updated values from Vergé et al. [14], including emissions associated with LMC and allocated emissions from culled dairy cows and calves.
Western Canada8.4
EU-27IPCC Tier 1 + 2/cradle to farm gate + imported feed/nitrogen content of products + energetic requirements of cattleConventional production system specific to each EU-27 member state/national10.4[29]Estimate including emissions from LMC and LUC represents a mid-range scenario. Values converted from kg CO2e per kg beef (carcass weight).
13.3
IrelandIPCC Tier 2/cradle to farm gate/mass basedConventional suckler beef/study13.0[19]Several scenarios where emissions from dairy bred animals are estimated. Knowing the ratio of animals reared using each management scenario, it would be possible to estimate a regional average.
SwedenNot given/cradle to farm gate /noneOrganic/study11.6[30]Various approaches to allocating emissions are discussed, and system expansion is recommended. Value has been converted from kg CO2e per kg bone free meat.
Charolais, FranceIPCC Tier 2/cradle to farm gate/not specifiedConventional/study14.3–18.3[31]Range in emissions for 5 beef production systems. May be suitable as a regional average, however allocation of dairy emissions is not specified.
United KingdomLiterature based emission factors/cradle to farm gate/primarily economicConventional/study8.7[32]Values have been converted from kg CO2e per tonne beef.
Organic and alternative/study10.4
European UnionIPCC Tier 1/cradle to farm gate + imported feed/ feed energy basedConventional suckler beef/study15.6[33]Approaches to allocating emissions from LUC are presented and assuming a 20 year depreciation period this would increase the carbon footprint by a factor of 3.1 to 3.9. Values have been converted from kg CO2e per kg meat.
Conventional dairy bred beef/study8.6 to 10.1
NSW, AustraliaIPCC Tier 2/cradle to farm gate/none6 different systems/ studyn/o10.1 to 12.7[15]
NSW + Victoria, AustraliaAustralian National Inventory report/cradle to exit gate of the meat processing plant/mass basedOrganic/ study7.9[34]Nitrous oxide emissions from leguminous pastures are excluded, which may underestimate emissions by less than 10%. Values have been converted from kg CO2e per kg hot standard carcass weight.
Conventional/ study8.0
BrazilIPCC Tier 1 + literature survey/ cradle to farm gate / primary product basedConventional/ national14.3[9]Spatial attribution of emissions from LUC have a significant impact on emissions, and range from 22 to 370 kg CO2e per kg LW. Value given is at the national scale, amortized over 20 years. Values have been converted from kg CO2e per kg carcass weight.
22.4
† LUC: Land use change; LMC: Land management change. ǂ eq: agricultural soils assumed to be at equilibrium in terms of SOC; ✓: included; ✗: not included; n/o: not occurring.

3.1. Canada

Canada’s cattle population in 2010 was about 13.4 million head of which about 4.3 million were beef cows. Vergé et al. [14] calculated the carbon footprint for cattle for eastern and western Canada for each census year from 1981 to 2006. The carbon footprint of beef production for each census year was calculated by dividing the GHG emissions associated with beef production that census year by the live weight of animal slaughtered that year. The decrease in the carbon footprint [14] between 1981 and 2006 reflects the increase in production efficiency which is the result of improved genetic selection, better feed formulation as well as improvements in management practices. Unlike many of the carbon footprint values in the literature, these values present the mean values for either a large region, or the whole country (Table 2a).
Table 2a. Cradle to farm gate carbon footprint associated with beef production in Canada, excluding the impact of soil carbon change associated with land management change, and allocation of dairy emissions to the beef sector, 1981–2006.
Eastern CanadaWestern CanadaCanada
kg CO2e per kg LW
198116.516.616.6
198615.115.415.3
199114.014.113.7
199613.712.112.4
200111.810.010.3
200611.59.710.0
The original calculation by Vergé et al. [14] in Table 2a did not take into account the potential depletion or sequestration of soil carbon in agricultural soils due to change in management practices such as a reduction in summer fallowing, reduction in tillage intensity and more forage crops in rotations [35]. On a national basis, agricultural soils which were a source of carbon in the early 1990’s became a sink of carbon in the early 2000’s [36]. To account for soil carbon change, due to changes in management practices, the Vergé et al. [14] estimates were revised and the new carbon footprints are presented in Table 2b, which was obtained by prorating the estimated annual change in soil carbon (11 Tg CO2 sequestered nationally in 2006) by the ratio of the area in the beef crop complex (the land area dedicated to producing feed and fodder crops for beef cattle) to the total agricultural land area during the year of interest. The change in soil carbon was taken from Canada’s National Inventory of Greenhouse Gas Emissions [37] for cropland remaining cropland. Beginning in 1991, the carbon footprint for cattle in western Canada decreased at a more rapid rate than in eastern Canada due to the adoption of certain soil conservation practices such as reduced tillage and reduced summerfallowing. Over the 25 year period, the soil carbon change impact resulted in a 12% increase in the beef carbon footprint in eastern Canada and a 14% reduction in western Canada. The impact of land use change (e.g., deforestation for conversion to agriculture) on the carbon footprint of cattle has not been included at this time because it is very difficult to relate the deforestation for agriculture to beef production. However, preliminary estimates indicate that inclusion of CO2 emissions from land use change would increase the carbon footprint slightly. The impact of grazing on soil carbon sequestration has also not been included. The net effect is expected to reduce the carbon footprint in Canada, but by a relatively small amount.
Table 2b. Cradle to farm gate carbon footprint associated with beef production in Canada, including the impact of soil carbon change associated with land management change, 1981–2006.
Eastern CanadaWestern CanadaCanada
kg CO2e per kg LW
198118.316.416.9
198616.715.015.4
199115.213.513.9
199615.011.412.1
200113.39.19.7
200612.98.39.0
Table 2c. Cradle to farm gate carbon footprint associated with beef production in Canada, including the impact of soil carbon change associated with land management change and the emissions associated with allocating 15% of dairy emissions to the beef sector, 1981–2006.
Eastern CanadaWestern CanadaCanada
kg CO2e per kg LW
198122.016.818.2
198620.315.316.6
199118.613.814.9
199618.011.612.8
200116.09.210.2
200615.38.49.5
Vergé et al. [14] did not include the GHG emissions from the dairy sector associated with culled cows and transferred dairy calves in the beef carbon footprint. Subsequently however, the International Dairy Federation [38] suggests that about 15% of these emissions are attributable to the beef sector. Assuming this allocation of emissions from the dairy sector [18,39] increased the mean beef carbon footprint for Canada by about 5% (Table 2c). On a regional basis, inclusion of emissions allocated from the dairy sector can have a very different impact on the carbon footprint. In eastern Canada, where the dairy cow to beef cow ratio is high, the carbon footprint is increased by about 20%, whereas in western Canada, where the dairy cow to beef cow ratio is low, the carbon footprint is only increased by 1–2%. After having accounted for emissions from land management change and from allocated emissions from the dairy sector, the average national carbon footprint of beef cattle in Canada has declined by nearly 50% between 1981 and 2006. The carbon footprint of cattle will most likely continue to decrease in Canada thanks to improved productivity and practices such as swath grazing and bale grazing which are likely to reduce GHG emissions associated with manure storage and handling.

3.2. The United States

In 2010, the U.S. was the largest beef producer in the world with a cattle herd of about 94 million and about 37 million beef cows. Even though the cattle population has decreased slightly in recent years, heavier carcass weights have enabled beef production to remain relatively constant, producing about 20% of the world’s beef with only 7% of the cattle. Capper [10] reported that between 1977 and 2007, the slaughter weight of beef cattle increased from 274 to 351 kg, while the time required to reach slaughter weight decreased from 602 to 482 days. Combined with other improvements in management, this has resulted in a 16% decrease in the carbon footprint per unit of beef. Much of the reduction of the carbon footprint was attributed to raising cattle on pasture then finishing them the last 120–180 days on a diet of grains and forages in a feedlot. Grass-finished cattle take about 226 more days than grain-finished cattle to reach market weight [10]. Johnson et al. [28] reported a value of 13.2 kg CO2e per kg of LW for a cow-calf, stocker and feedlot beef production system in the U.S. (Table 1). Considering that these estimates do not include beef produced from culled dairy cows and calves, and that cropland and rangeland were assumed to be at equilibrium in terms of soil carbon, it is very likely that these values are larger than the actual carbon footprint of beef cattle production in the U.S., and that the carbon footprint will continue to decrease over time, as Sperow et al. [40] predicted that U.S. cropland soils have the potential to increase carbon sequestration by an additional 60–70 Tg C yr−1 above the 17 Tg C yr−1 that they estimated.

3.3. The European Union

The predominant European farming system of beef production is very different from the North American system, as it relies on substantial transfer of stock from the dairy sector to the beef sector. In 2010, the European Union (EU-27) had a cattle population of about 89 million head, of which there were 24 million dairy cows and about 12 million beef cows. Like Canada and the United States, the EU-27 has seen a rise in the productivity of the beef industry because of an increase in the average carcass weight. A wide range of values (Table 1) for the carbon footprint of beef production has been published for the states of the EU-27 using the Common Agricultural Policy Regionalised Impact (CAPRI) model which incorporates the most recent GHG emissions methodology [6]. In these cases, the allocation to meat and milk was made on the basis of the energy requirement for lactation and pregnancy [29]. This resulted in a mean carbon footprint for beef production in the EU-27 in 2004 of 10.4 kg CO2e per kg LW, not including emissions from land use change, and a range in mean carbon footprint from 12.6 to 16.6 kg CO2e per kg LW for three land use change scenarios.
The land use change scenarios included emissions associated with the conversion of grasslands and forest to agriculture, which was then used in the production of feed or fodder for beef production. Excluding emissions from land use change, 48% of the GHG emissions were in the form of CH4, 32% in the form of N2O, and 20% as CO2 from the use of energy [29]. If emissions associated with land use change are included, the breakdown by gas becomes 32 to 42% CH4, 21 to 27% N2O, 13 to 17% CO2 from fossil fuels and 14 to 34% CO2 from land use change. Excluding emissions from land use change, these results agree reasonably well with other European studies that have estimated the carbon footprint of beef production as 11.6 kg CO2e per kg LW for organic production in Sweden [30], 11.3 kg CO2e per kg LW for a typical suckler-beef system in Ireland, [19], and 8.6 to 15.6 kg CO2e per kg LW for dairy and suckler-beef systems of the EU [33].

3.4. Australia

The Australian beef industry is diverse and relies on a mixture of irrigation and dryland farming. Australia is one of the largest beef exporters in the world and had a stock of 27 million cattle in 2010 [7]. Most cattle from Australia are finished on grass, whereas about 1.2 million cattle are finished in feedlots found in the south and in the north. The increasing proportion of feedlot-fed beef in Australia is very likely to lower the carbon footprint, since this production system tends to result in lower total GHG emissions than grass-fed production. However, in the feedlot feeding strategy, there are additional GHG emissions associated with the production and transportation of feeds, but these emissions are generally small compared to the increased efficiency of meat production in feedlots. In a study focusing on the Australian state of New South Wales, which is the largest region of beef cattle production in the south (5.9 million head), the carbon footprint of six beef cattle production systems, which were grazed on improved pastures and feedlot finished, were estimated to range from 10.1 to 12.7 kg CO2e per kg LW [15]. In these cases the footprint was overwhelmingly influenced by CH4 emissions (87 to 92%). These estimates are based on a country specific IPCC Tier 2 approach used in the Australian national inventory. Land use change (deforestation) and possible soil carbon change were ignored because of lack of data.
In the north and the interior of Australia, they have very different breeds of cattle; pastures vary widely in qualities because of the monsoon weather in the summer and the dry and erratic winter climate. There, individual farming enterprises typically exceed 100,000 hectares, requiring trucking over long distances to bring them to the place of slaughter. Further, the methane emission rates for Australian Brahman cattle fed tropical grasses has been found to range from 5.0 to 7.2% of gross energy intake [41], which is greater than the 3% ± 1% recommended for feedlot fed cattle [6]. As a result of these factors, the cattle carbon footprints should be substantially larger than in southern Australia. Considering that more than half [42] of the cattle production is from the north, we conclude that the overall footprint of cattle produced in Australia is likely more than those in Canada, the U.S. and the EU-27.

3.5. Brazil

The rapidly expanding cattle population in Brazil was estimated at 210 million head in 2010 [7]. About 52 million of these animals were beef cows and 10% were dairy cows of which about 5% were slaughtered annually. In 2009, Brazil had about 2 million cattle in feedlots which were fed mainly silage. About 70% of Brazilian cattle are raised in the hot and humid regions of the sub-Amazon cerrado [8]. Cattle are grown almost entirely on 100 million ha of cultivated pasture and 70 million ha of native rangeland. For cattle fed on native rangeland, GHG emissions from animal housing, feed production and manure management are negligible, but CH4 emissions associated with enteric fermentation are likely high, and will depend on the quality of pasture. Beef producers have recently worked to improve pastures but their cattle productivity is still low.
Without considering land use change, which is a big issue for about 6% of beef production in Brazil, a value of 22 kg CO2e per kg of LW has been reported [9]. This relatively high value is mainly because of their lower rate of weight gain, requiring a longer time (3 to 4 years) until slaughter [9]. When emissions from land use change from newly deforested lands in Brazil are included, the carbon footprint can change dramatically, and is highly sensitive to the allocation of emissions associated with land use change. For instance, if emissions from land use change are amortized over a period of 20 years and are allocated to beef production throughout Brazil, the average carbon footprint is 44 kg CO2e per kg LW. However, if these emissions are only attributed to beef production on newly deforested lands, the carbon footprint is more than 16 times greater, 726 kg CO2e per kg LW [9].

4. Emissions Associated with Cattle Transportation and Slaughterhouse Operations

The live weight carbon footprint is only one aspect of the carbon footprint of cattle. From the farm gate, cattle must be transported to the slaughterhouse and be slaughtered; two activities which result in additional GHG emissions. The emissions of these gases were estimated in Canada using the (Cafoo)2 calculator which was initially developed for estimating the carbon footprint of Canadian dairy products [43] but which has now been adapted to calculate the carbon footprint of Canadian meat products. The transportation emissions were estimated assuming that the cattle are transported from the farm or feedlot to the slaughterhouse in a standard four-axle cattle transportation trailer. A vehicle of this size can accommodate approximately 43 heifers or steers [44] for an average payload of 26.5 tonnes. GHG emissions for a vehicle of this type were estimated using the SimaPro life LCA software as 0.123 kg CO2e per tonne km assuming an empty return trip. An average one-way trip from farm to slaughterhouse of 311 km was assumed for short haul [45] and 1081 km for long haul [46]. We assumed that 15% of the cattle are hauled over a long distance (representing Canadian interprovincial exchange of stock) and that on average, weight loss of 4% and 8% occurred during short and long haul, respectively [44]. We then estimated the GHG emissions to bring the cattle to the slaughterhouse to be 53.5 g CO2e per kg shrunk LW (SLW), or 51 g CO2e per kg farm LW.
In addition to meat, the slaughtering process provides valuable co-products and non-marketable residues managed with slaughterhouse wastes and wastewater [47]. Table 3 presents the average mass balance within the Canadian beef industry context in 2006, considering a dressing percentage (CW/SLW) of 60% and a cutting yield of 63 kg primal cuts meat per 100 kg Carcass Weight (CW). Bones and fat from cutting, and some dressing residues are intended for rendering, while hide and offal are marketed. Wastes are the non-recovered blood, paunch content, gut, feet, and account for around 21% of the shrunk live weight. The energy required to slaughter cattle has been estimated from the disaggregation of national energy use breakdown for the whole Canadian meat manufacturing sector [48]. Available U.S. statistics [49] permitted the estimation of the national share of the red meat slaughtering sector for electricity and fossil fuels use. The data were further allocated to meat types (cattle, calves, pork, and sheep and lamb) and then to Canadian Provinces according to Canadian slaughter and weight statistics. The following national average energy use was derived for the slaughtering of 3549 thousand cattle in 2006: 152,279.1 MWh electricity, 1,443.1 TJ natural gas, 5.5 TJ heavy fuel oil, 27.8 TJ middle distillates, and 6.7 TJ propane. The GHG emissions from energy use were found to be 69 g CO2e per kg SLW using the LCA software. Additionally, GHG emissions have also been calculated for water use, assuming an average rate of 2.7 L per kg SLW, i.e., 1.6 m3 per head [50,51] and from wastewater treatment, assuming an average 20% volume loss from water input, and Canadian beef slaughterhouse wastewater characteristics [52]. Wastewater GHG emissions were estimated at 54 g CO2e per kg SLW. Other GHG emissions related to refrigerant use and fugitive losses and due to chemical cleaners input have not been included due to lack of available data. As well, no impact or credit from the use or the sale of biogas recovered from anaerobic wastewater treatment, nor from sludge valorization has been accounted for. Therefore, the GHG emissions associated with transportation to the slaughterhouse and slaughtering operations were 0.18 kg CO2e per kg SLW (0.17 kg CO2e per kg LW at farm), or about 2% of on-farm GHG emissions. Although we have excluded any other emissions associated with transportation (e.g., from cow-calf ranch to feedlot), this would only have a minor impact on the emissions intensity.
Table 3. Slaughtering mass balance and co-product allocation factors for the United States and Canada.
Mass balanceCo-products allocation factors
% SLWMassEconomic
Wastes21.3%--
Meat, primal cuts37.8%48.0%83.6%
Rendering product32.8%41.7%6.8%
Hide, raw4.9%6.2%6.8%
Offal3.2%4.1%2.7%
100%100%100%

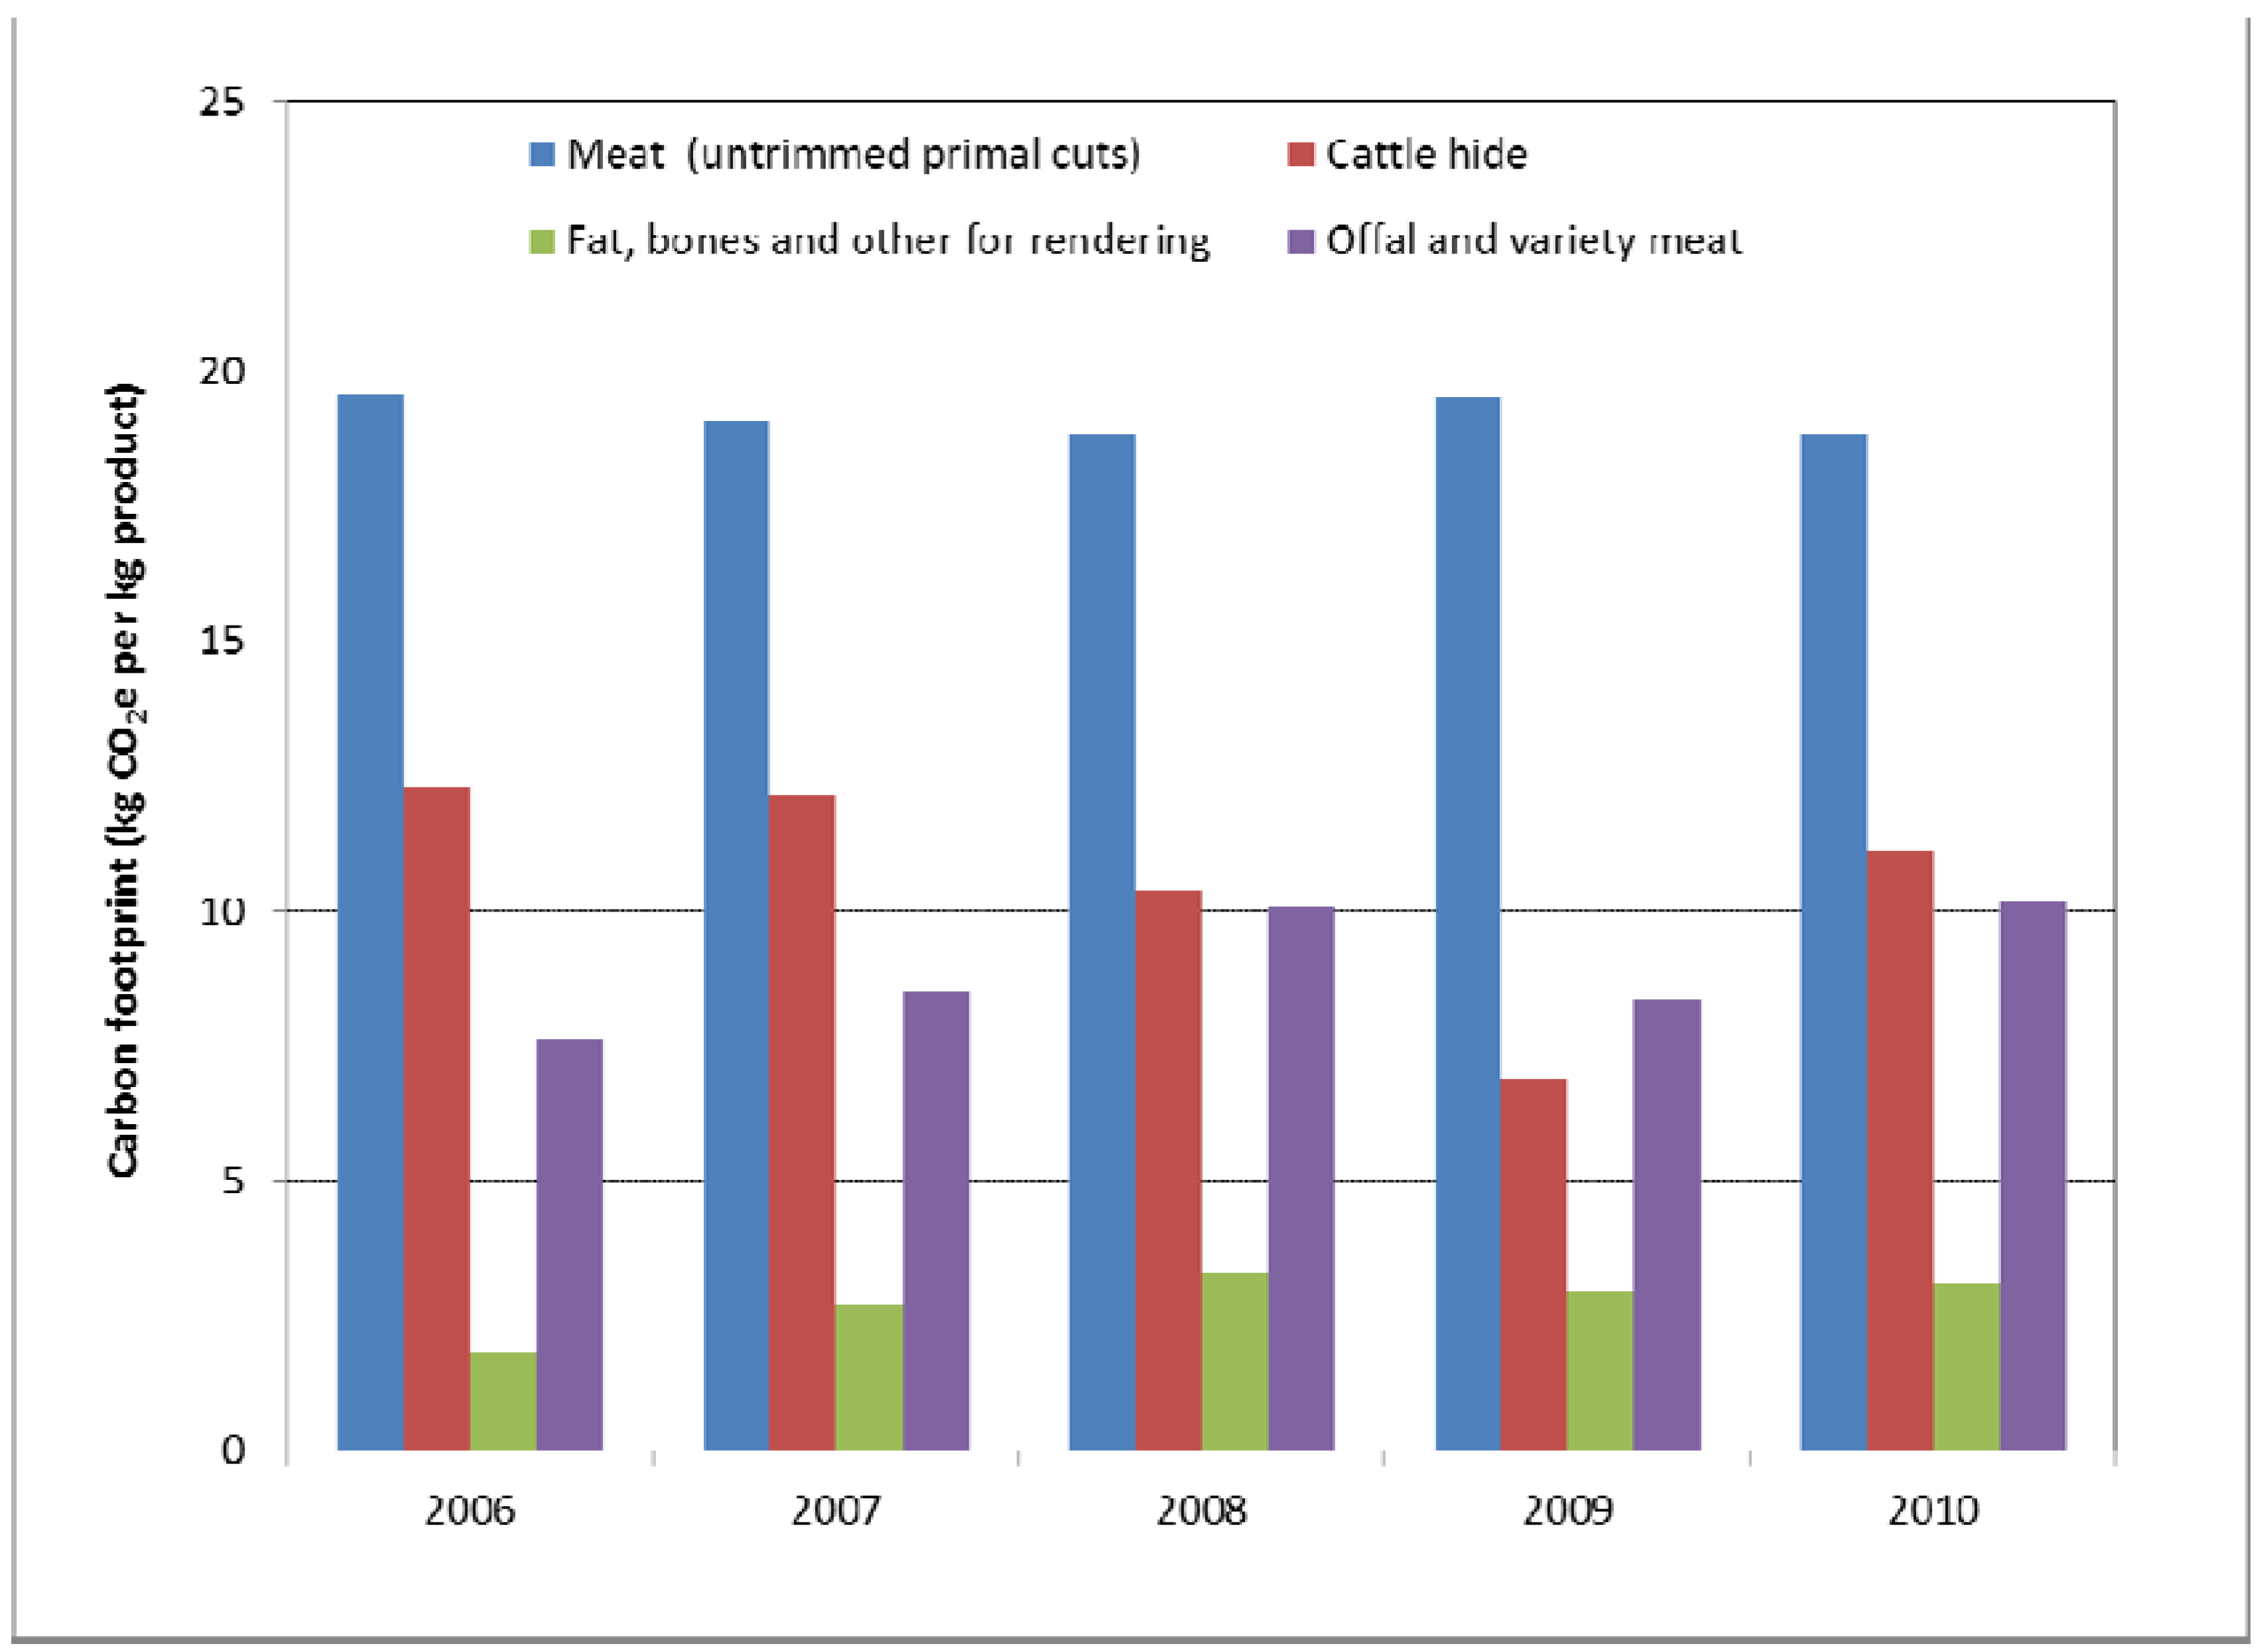
4.1. Carbon Footprint of Cattle By-Products

Many agricultural systems produce more than one product. In some cases, the carbon footprint of beef production receives the whole environmental burden and there is no allocation of the GHG emissions between co-products. This causes an overestimation of the carbon footprint associated with beef production. Hides are a co-product from cattle slaughtering, in addition to meat which is the primary product. Other by-products are edible offal, and inedible materials further processed at the rendering plants, mainly tallow, meat bone meal, and blood meal [47]. Hides account for 30–75% of the by-product value from cattle [53]. Estimating the carbon footprint of each co-product involves solving the multifunctionality of the system. Process subdivision and system expansion, which are the preferred approaches recommended by most standards, such as ISO [4] and PAS2050 [5] are rarely performed because of missing data and the burden of data collection. Applying system expansion to the diversity of co-products from beef production (hides, offal and rendering products) necessitates the development of multiple alternative product streams, with issues regarding missing or very uncertain market data to identify displaced production. Further, functional equivalence is rarely achieved (e.g., hides compared with petrochemical- or fiber-based products), making it difficult to determine the relevant relationships of equivalence. As a third choice for solving multifunctionality, the upstream impacts up to (and including) the slaughterhouse need to be allocated between co-products. Allocation rules can be based on different criteria, such as mass, economic value, energy content, or even more elaborate physico-chemical relationships (e.g., [54]). Based on economic criteria, Mila-i-Canals et al. [55] recommended allocating 7.7% of the environmental burden to hides. On a mass basis, the ratio of the hide weight to live weight presents systematic differences between cattle breed and sex [56]. Currently, a typical steer or heifer (average weight of 580 kg) slaughtered in a U.S. Meat Packers plant has a 29 kg hide, i.e., 4.9% of the shrunk live weight at the slaughterhouse; a typical slaughtered cow (500 kg) has a 22 kg hide, i.e., 4.5% of its shrunk live weight [57]. The weight of the hides of beef bred animals as compared to their live weight tends to be more than for dairy cows, and tropical breeds tend to have a greater hide percentage than European breeds. For this case study, GHG emissions have been allocated to meat and hide using both mass and economic approaches. Unit prices for meat, products for rendering, raw hide (uncured, unsalted) and offal have been gathered, for the year 2006, from USDA market statistics [58] and are respectively 3.07, 0.29, 1.93, and 1.19 US$ per kg product. Canadian statistics were not available, and therefore we assume that the prices of cattle by-products from the U.S. are applicable in Canada due to the close economic relationship, and the integrated nature of the beef sector between these two nations.
The mass-based and economic allocation factors associated with beef production in Canada are presented in Table 3. From a GHG perspective, if a mass allocation approach is used, it is not possible to differentiate between 1 kg of hide and 1 kg of LW, and as a result the carbon footprint of hide and LW is equivalent and was equal to 12.9 kg CO2e per kg product in 2006. Conversely, the economic approach better reflects the market driver of the whole beef industry, whose main function is to provide food. The estimated economic allocation factor of 6.8% associated with hide is comparable to that calculated by Mila-i-Canals et al. [55] for Spanish cattle. Using emissions calculated for the year 2006, Figure 2 presents the calculated cradle to the exit gate of the slaughterhouse carbon footprint for the period 2006 to 2010 per kg meat, and several other by-products using an economic allocation. As a result, the carbon footprint of the meat following allocation is substantially more than the egalitarian perspective of the mass allocation approach (19.6 as compared to 12.9 kg CO2e per kg meat) whereas that of hide decreases slightly from 12.9 to 12.3 kg CO2e per kg of hide. The mass based estimate of 12.9 kg CO2e per kg of product is substantially more than the 9.5 kg CO2e per kg LW because the 21.3% waste is not included in the weight of the product (Table 3). The carbon footprints of offal and products for rendering are also given in Figure 2. The wide range of numbers confirms the need to consider the amount and value of the product in calculating the carbon footprint. Although economic allocation allows the carbon footprint to better reflect the market driver of beef production, this does add complications in terms of comparing carbon footprints over time. For instance, in 2006, the carbon footprint of hides was estimated at 12.3 kg CO2e per kg. However, between 2006 and 2009, the value of hides almost decreased by half whereas the price of meat remained relatively constant. We believe that the economic approach better represents the environmental consequences of supply-demand; however, this makes comparison over time more difficult.
Figure 2. Estimated carbon footprint of beef products in Canada using an economic allocation, 2006–2010.
Sustainability 04 03279 g002
Even though a major effort has been made to calculate the carbon footprint of cattle, it is important to remember that the carbon footprint is only one of the factors affecting the environmental sustainability of beef production [59]. This is particularly true when dealing with rangelands which give rise to a variety of ecological goods and services such as wildlife habitat, erosion control, water regulation, as well as cultural and aesthetic benefits which have not been fully assessed. It is also true when dealing with feedlots, which have the potential to give rise to problems with water and air quality. Clearly, tools that can be used to examine the agricultural sector as a whole, evaluate trade-offs between the production of agricultural commodities such as meat, milk and land use are needed in order to evaluate policies and practices designed to reduce the environmental impact of agriculture. One such tool, developed for Canada, is ULICEES (Unified Livestock Industry and Crop Emissions Estimation System). It can be used to determine and compare the carbon footprint for a range of agricultural products and to evaluate the impact of various policy or farming system scenarios on GHG emissions from beef, pork and/or poultry [60].

5. Discussion and Conclusions

The livestock industries in many countries have managed to reduce their beef cattle carbon footprints substantially during the last 30 years through the adoption of improved management practices and by so doing they have reduced the carbon footprint of beef, and cattle by-products proportionally. Whereas some of the reductions in the carbon footprints have resulted from low roughage diets, grain-finished feedlot cattle rely partly on land that is capable of growing feed grains. Conversely, grass-finished cattle typically exploit areas with little or no suitability for annual crops. Beef production, therefore, competes with other possible uses for higher quality land when it is grain-finished. For example, the diversion of grains intended for feedlot cattle to non-ruminants (hogs or poultry) would result in a lower GHG emission intensity on a unit of protein basis [61]. Both the grassland and grain producing land could be used for a combined system of grass-finished beef and non-ruminants. Furthermore, this system could produce animal protein (and cow hides) with a lower carbon footprint than using all of that land for grain-finished beef. Including this type of livestock interaction in the carbon footprint assessment would give this assessment a better land use perspective.
In recent years, the changes in soil carbon due to land management have begun to be considered in carbon footprint analysis, but there are still many countries for which this information is unavailable or too uncertain to be used. Long-term measurement and modeling has enabled Canada to include soil carbon change as a function of management practices in its national inventory of greenhouse gas emissions and gives us confidence to include these estimates in the carbon footprint of beef cattle. However, uncertainty in soil carbon change remains, and has been estimated at ±20% at the national scale [37], likely with greater uncertainty at smaller spatial scales. Soil carbon sequestration cannot continue indefinitely, and as agricultural soils in Canada begin to approach equilibrium with respect to soil carbon, the changing rate of carbon storage should be reflected in the carbon footprint of beef cattle. Further, sequestered carbon is not necessarily permanent, and ongoing monitoring of management practices and carbon stocks is necessary to determine if reversal of stored carbon has occurred, which should also be reflected in any carbon footprint estimate of beef cattle. In other countries, changes in soil carbon stocks could provide opportunities to keep reducing the GHG emissions associated with cattle production but in some regions it could result in a larger carbon footprint because of deforestation and land degradation.
Most of the carbon footprint estimates in the literature are dominated by European, North American, South American and Australian estimates. No estimates are available for countries such as India, China and Africa that have large stocks of cattle. The cattle from these countries are likely to have larger carbon footprints because of their relatively low productivity. The objective of this review was to provide an estimate of the carbon footprint of beef cattle for some of the main beef exporting nations as well as to investigate the allocation of GHGs to other cattle by-products. Towards this objective, estimates of the carbon footprint of beef cattle for some of the main beef exporting countries were examined. It has been difficult to compare results from the literature due to the different assumptions used in the calculations. We have observed a wide range of carbon footprint values (8 to 22 kg CO2e per kg of LW at the farm gate with a few larger values) depending on the type of farming system, the location, the type of management practices, the boundaries of the studies, as well as the resource use considered. It appears that on average, the carbon footprint of beef cattle from Canada, the U.S., the EU-27 and Southern Australia have similar carbon footprints with large regional differences in most of these countries. The carbon footprint of cattle grazing under extensive conditions, such as in Northern Australia and Brazil, are likely to be considerably larger.
We have shown that the type of allocation influence the results. For conditions in Canada, using mass allocation we estimated that at the exit gate of the slaughterhouse, the carbon footprint of Canadian cattle was 12.9 kg CO2e per kg of product in 2006. However, based on an economic allocation very different intensity values were obtained for the various by-products and these carbon footprint values vary substantially from year to year. Finally, it is important to remember that the carbon footprint of cattle is only one aspect associated with beef production. The impact on ecological goods and services and biodiversity are also very important to the environmental sustainability of this product.

Acknowledgements

We thank two anonymous reviewers for their comments and input, which helped to improve the manuscript.

Conflict of Interest

The authors declare no conflict of interest.

References

  1. IPCC, Climate Change 2007: The Physical Science Basis. Contribution of Working Group I to the Fourth Assessment Report of the Intergovernmental Panel on Climate Change; Cambridge University Press: Cambridge, UK, 2007; p. 996.
  2. Janzen, H.H.; Desjardins, R.L.; Rochette, P.; Boehm, M.M.; Worth, D. Better Farming Better Air: A Scientific Analysis of Farming Practice and Greenhouse Gases in Canada; Agriculture and Agri-Food Canada: Ottawa, ON, Canada, 2008; p. 146. [Google Scholar]
  3. Pandey, D.; Agrawal, M.; Pandey, J.S. Carbon footprint: Current methods of estimation. Environ. Monit. Assess. 2011, 178, 135–160. [Google Scholar] [CrossRef]
  4. International Organization for Standardization, Environmental Management-Life Cycle Assessment-Requirements and Guidelines; International Organization for Standardization: Geneva, Switzerland, 2006.
  5. British Standards Institution, Specification for the Assessment of the Life Cycle Greenhouse Gas Emissions of Goods and Services; British Standards Institution: London, UK, 2008.
  6. IPCC, Agriculture, Forestry and Other Land Use. In IPCC Guidelines for National Greenhouse Gas Inventories; Eggleston, S.; Buendia, L.; Miwa, K.; Ngara, T.; Tanabe, K. (Eds.) IGES: Hayama, Kanagawa, Japan, 2006; 4.
  7. FAO. FAOSTAT. Available online: http://www.faostat.fao.org/ (accessed on 30 May 2012).
  8. Peck, C. Feeding the World, Challenges and Opportunities for the U.S. Beef Industry. In Proceeding of the, Range Beef Cow Symposium XXI; Casper, Wyoming, WY, USA: 1-3 December 2009.
  9. Cederberg, C.; Persson, U.M.; Neovius, K.; Molander, S.; Clift, R. Including carbon emissions from deforestation in the carbon footprint of Brazilian beef. Environ. Sci. Tech. 2011, 45, 1773–1779. [Google Scholar]
  10. Capper, J.L. Replacing rose-tinted spectacles with a high-powered microscope: The historical versus modern carbon footprint of animal agriculture. Animal Frontiers 2011, 1, 26–32. [Google Scholar] [CrossRef]
  11. Van Haarlem, R.; Desjardins, R.L.; Gao, Z.; Flesch, T.K.; Li, X. Methane and ammonia emissions from a beef feedlot in western Canada for a twelve-day period in the fall. Can. J. Anim. Sci. 2008, 88, 641–649. [Google Scholar] [CrossRef]
  12. Rochette, P.; Worth, D.; Lemke, R.L.; McConkey, B.G.; Pennock, D.J.; Wagner-Riddle, C.; Desjardins, R.L. Estimation of N2O emissions from agricultural soils in Canada. I-Development of a country specific methodology. Can. J. Soil Sci. 2008, 88, 641–654. [Google Scholar]
  13. Smith, W.N.; Grant, B.B.; Desjardins, R.L.; Lemke, R.L.; Li, C. Estimates of the interannual variations of N2O emissions from agricultural soils in Canada. Nutr. Cycl. Agroecosys. 2004, 68, 37–45. [Google Scholar] [CrossRef]
  14. Vergé, X.P.C.; Dyer, J.A.; Desjardins, R.L.; Worth, D. Greenhouse gas emissions from the Canadian beef industry. Agr. Syst. 2008, 98, 126–134. [Google Scholar] [CrossRef]
  15. Ridoutt, B.G.; Sanguansri, P.; Harper, G.S. Comparing carbon and water footprints for beef cattle production in southern Australia. Sustainability 2011, 3, 2443–2455. [Google Scholar]
  16. McCaughey, W.P.; Wittenberg, K.; Corrigan, D. Impact of pasture type on methane production by lactating beef cows. Can. J. Anim. Sci. 1999, 79, 221–226. [Google Scholar]
  17. Casey, J.W.; Holden, N.M. Analysis of greenhouse gas emissions from the average Irish milk production system. Agr. Syst. 2005, 86, 97–114. [Google Scholar] [CrossRef]
  18. Vergé, X.P.C.; Dyer, J.A.; Desjardins, R.L.; Worth, D. Greenhouse gas emissions from the Canadian dairy industry in 2001. Agr. Syst. 2007, 94, 683–693. [Google Scholar] [CrossRef]
  19. Casey, J.W.; Holden, N.M. Quantification of GHG emissions from sucker-beef production in Ireland. Agr. Syst. 2006, 90, 79–98. [Google Scholar] [CrossRef]
  20. Vergé, X.P.C.; Dyer, J.A.; Desjardins, R.L.; Worth, D. Greenhouse gas emissions from the Canadian pork industry. Livest. Sci. 2009, 121, 92–101. [Google Scholar]
  21. Basset-Mens, C.; van der Werf, H.M.G. Scenario-based environmental assessment of farming systems: The case of pig production in France. Agr. Ecosyst. Environ. 2005, 105, 127–144. [Google Scholar] [CrossRef]
  22. Vergé, X.P.C.; Dyer, J.A.; Desjardins, R.L.; Worth, D. Long-term trends in the greenhouse gas emissions from the Canadian poultry industry. J. Appl. Poultry Res. 2009, 18, 210–222. [Google Scholar] [CrossRef]
  23. Pelletier, N. Environmental performance in the U.S. broiler poultry sector: Life cycle energy use and greenhouse gas, ozone depleting, acidifying and eutrophying emissions. Agri. Syst. 2008, 98, 67–73. [Google Scholar] [CrossRef]
  24. Beauchemin, K.A.; Janzen, H.H.; Little, S.M.; McAllister, T.A.; McGinn, S.M. Life cycle assessment of greenhouse gas emissions from beef production in western Canada: A case study. Agri. Syst. 2010, 103, 371–379. [Google Scholar] [CrossRef]
  25. Rotz, C.A.; Montes, F.; Chianese, D.S. The carbon footprint of dairy production systems through partial life cycle assessment. J. Dairy Sci. 2010, 93, 1266–1282. [Google Scholar] [CrossRef]
  26. Hillier, J.; Walter, C.; Malin, D.; Garcia-Suarez, T.; Mila-i-Canals, L.; Smith, P. A farm-focused calculator for emissions from crop and livestock production. Environ. Model. Software 2011, 26, 1070–1078. [Google Scholar] [CrossRef]
  27. Pelletier, N.; Pirog, R.; Rasmussen, R. Comparative life cycle environmental impacts of three beef production strategies in the Upper Midwestern United States. Agri. Syst. 2010, 103, 380–389. [Google Scholar] [CrossRef]
  28. Johnson, D.E.; Phetteplace, H.W.; Seidl, A.F.; Schneider, U.A.; McCarl, B.A. Management Variations for U.S. Beef Production Systems: Effects on Greenhouse Gas Emissions and Profitability. In Proceedings of the 3rd International Methane and Nitrous Oxide Mitigation Conference, Beijing, China, 17-21 November 2003; China Coal Information Institute: Beijing, China, 2003; pp. 953–961. [Google Scholar]
  29. Leip, A.; Weiss, F.; Wassenaar, T.; Perez, I.; Fellmann, T.; Loudjani, P.; Tubiello, F.; Grandgirard, D.; Monni, S.; Biala, K. Evaluation of the Livestock Sector's Contribution to the EU Greenhouse Gas Emissions (GGELS), Final Report; Joint Research Centre, Institute for Environment and Sustainability: Ispra, Italy, 2010; p. 323. [Google Scholar]
  30. Cederberg, C.; Stadig, M. System expansion and allocation in Life Cycle Assessment of milk and beef production. Int. J. Life Cycle Assess. 2003, 8, 350–356. [Google Scholar] [CrossRef]
  31. Veysset, P.; Lherm, M.; Bébin, D. Energy consumption, greenhouse gas emissions and economic performance assessments in French Charolais suckler cattle farms: Model-based analysis and forecasts. Agri. Syst. 2010, 103, 41–50. [Google Scholar] [CrossRef]
  32. Williams, A.G.; Audsley, E.; Sandars, D.L. Determining the Environmental Burdens and Resource Use in the Production of Agricultural and Horticultural Commodities; Cranfield University and Defra: Bedford, UK, 2006. [Google Scholar]
  33. Nguyen, T.L.T.; Hermansen, J.E.; Mogensen, L. Environmental consequences of different beef production systems in the EU. J. Clean. Prod. 2010, 18, 756–766. [Google Scholar] [CrossRef]
  34. Peters, G.M.; Rowley, H.V.; Wiedemann, S.; Tucker, R.; Short, M.D.; Schulz, M. Red meat production in Australia: Life cycle assessment and comparison with overseas studies. Environ. Sci. Tech. 2010, 44, 1327–1332. [Google Scholar] [CrossRef]
  35. VandenBygaart, A.J.; McConkey, B.G.; Angers, D.A.; Smith, W.N.; de Gooijer, H.; Bentham, M.; Martin, T. Soil carbon change factors for the Canadian agriculture national greenhouse gas inventory. Can. J. Soil Sci. 2008, 88, 671–680. [Google Scholar]
  36. Boehm, M.M.; Junkins, B.; Desjardins, R.L.; Kulshreshtha, S.; Lindwall, W. Sink potential of Canadian agricultural soils. Climatic Change 2004, 65, 297–314. [Google Scholar] [CrossRef]
  37. Environment Canada, National Inventory Report 1990-2009: Greenhouse Gas Sources and Sinks in Canada. Part 1; Environment Canada: Gatineau, QC, Canada, 2011; p. 224.
  38. International Dairy Federation, Environmental/Ecological Impact of the Dairy Sector: Literature Review on Dairy Products for an Inventory of Key Issues. List of Environmental Initiatives and Influences on the Dairy Sector; International Dairy Federation: Brussels, Belgium, 2009.
  39. Dyer, J.A.; Vergé, X.P.C.; Desjardins, R.L.; Worth, D. Long-term trends in the greenhouse gas emissions from the Canadian dairy industry. Can. J. Soil Sci. 2008, 88, 629–639. [Google Scholar]
  40. Sperow, M.; Eve, M.; Paustian, K. Potential soil C sequestration on U.S. agricultural soils. Climatic Change 2003, 57, 319–339. [Google Scholar] [CrossRef]
  41. Kennedy, P.M.; Charmley, E. Methane yields from Brahman cattle fed tropical grasses and legumes. Anim. Prod. Sci. 2012, 52, 225–239. [Google Scholar] [CrossRef]
  42. Australian Bureau of Statistics. Livestock, Meat Cattle. Available online: http://www.abs.gov.au/ausstats/[email protected]/Products/7121.0~2010-11~Main+Features~Livestock?OpenDocument (accessed on 16 November 2012).
  43. Maxime, D.; Vergé, X.P.C.; Arcand, Y.; Desjardins, R.L. A Cradle-to-Gate Assessment of the Carbon Footprint of Canadian Dairy Products. LCA XI Conference, Chicago, IL, USA, Chicago, IL, USA; 2012. Available online: http://lcacenter.org/lcaxi/abstracts/426.htm/ (accessed on 12 September 2012).
  44. Gonzalez, L.A.; Shchwartzkopf-Genswein, K.S.; Bryan, M.; Silasi, R.; Brown, F. Space allowance during commercial long distance transport of cattle in North America. J. Anim. Sci. 2012, 90, 3618–3629. [Google Scholar] [CrossRef]
  45. ARD. Evaluating Environmental and Economic Impact for Beef Production in Alberta Using Life Cycle Analysis. Alberta Agriculture and Rural Development; Final report prepared by Conestoga-Rovers and Associates; Conestoga-Rovers & Associates: Waterloo, Canada, 2010; p. 354. Available online: http://www1.agric.gov.ab.ca/$department/deptdocs.nsf/all/econ13691/ (accessed on 9 February 2011).
  46. Schwartzkopf-Genswein, K.S.; Faucitano, L.; Dadgar, S.; Shand, P.; Gonzalez, L.A.; Crowe, T.G. Road transport of cattle, swine and poultry in North America and its impact on animal welfare, carcass and meat quality: A review. Meat Sci. 2012, 92, 227. [Google Scholar]
  47. Raggi, A.; Petti, L.; de Camillis, C.; Mercuri, L.; Pagliuca, G. Cattle Slaughtering Residues: Current Scenario and Potential Options for Slaughterhouses in Abruzzo. In Industrial Ecology in the Cattle-to-Leather Supply Chain; Puig, R., Notarnicola, B., Raggi, A., Eds.; Franco Angeli: Milan, Italy, 2008; pp. 99–158. [Google Scholar]
  48. CIEEDAC. Energy Consumption and Energy Intensity Indicators Database, NAICS Industry 311600 Meat Product Manufacturing; School of Resource and Environmental Management, Simon Fraser University: Burnaby, BC, Canada, 2012. Available online: http://www2.cieedac.sfu.ca/index.html/ (accessed on 19 September 2012).
  49. U.S. Census Bureau. Annual Survey of Manufacturers, 2005, 2006, 2008, 2009, 2010. Data gathered from American FactFinder. Available online: http://factfinder2.census.gov/faces/nav/jsf/pages/index.xhtml/ (accessed on 19 September 2012).
  50. Ontario MOE, Resource Conservation and Cost Savings Opportunities in the Meat and Poultry Sector. Prepared by Wardrop Engineering Inc. for the Ontario Ministry of the Environment; Ontario Ministry of the Environment: Toronto, Canada, 1998; p. 116.
  51. U.S. EPA. Technical Development Document for the Final Effluent Limitations Guidelines and Standards for the Meat and Poultry Products Point Source Category (40 CFR 432); EPA-821-R-04-011; United States Environmental Protection Agency: Washington, DC, USA, 2002.
  52. Wu, P.F.; Mittal, P.F. Characterication of provincially inspected slaughterhouse wastewater in Ontario. Can. Biosyst. Eng. 2011, 53, 6.9–6.18. [Google Scholar]
  53. USDA. Where's the (Not) Meat? Byproducts from Beef and Pork Production; LDP-M-209-01; Economic Research Service United States Department of Agriculture: Washington, DC, USA, 2011; p. 30. Available online: http://www.ers.usda.gov/publications/ldpm-livestock,-dairy,-and-poultry-outlook/ldpm209-01.aspx/ (accessed on 19 September 2012).
  54. Feitz, A.J.; Lundie, S.; Dennien, G.; Morain, M.; Jones, M. Generation of an industry-specific physico-chemical allocation matrix. Int. J. Life Cycle Assess. 2007, 12, 109–117. [Google Scholar] [CrossRef]
  55. Mila-i-Canals, L.; Domènech, X.; Rieradevall, J.; Puig, R.; Fullana, P. Use of life cycle assessment in the procedure for the establishment of environmental criteria in the Catalan eco-label of leather. Int. J. Life Cycle Assess. 2002, 7, 39–46. [Google Scholar] [CrossRef]
  56. Terry, C.A.; Knapp, R.H.; Edwards, J.W.; Mies, W.L.; Savell, J.W.; Cross, H.R. Yields of by-products from different cattle types. J. Anim. Sci. 1990, 68, 4200–4205. [Google Scholar]
  57. USDA. Daily National Carlot Meat Report; Agricultural Marketing Service Livestock and Seed Program: Des Moines, Iowa, USA, 2012. Available online: http://ams.usda.gov/mnreports/lsddb.pdf (accessed on 19 September 2012).
  58. USDA. 2006 Annual Meat Trade Review. Meat, Livestock and Slaughter Data; Agricultural Marketing Service Livestock and Seed Program: Des Moines, ID, USA, 2006; p. 132. Available online: www.ams.usda.gov/marketnews.htm/ (accessed on 19 September 2012).
  59. Vergé, X.P.C.; Worth, D.E.; Dyer, J.A.; Desjardins, R.L.; McConkey, B.G. LCA of Animal Production. In Green Technologies in Food Production and Processing; Arcand, Y., Boye, J., Eds.; Springer Science and Business Media: New York, NY, USA, 2012; pp. 83–113. [Google Scholar]
  60. Vergé, X.P.C.; Dyer, J.A.; Worth, D.E.; Smith, W.N.; Desjardins, R.L.; McConkey, B.G. A greenhouse gas and soil carbon model for estimating the carbon footprint of livestock production in Canada. Animals 2012, 2, 437–454. [Google Scholar] [CrossRef]
  61. Dyer, J.A.; Vergé, X.P.C.; Desjardins, R.L.; Worth, D. The protein-based GHG emission intensity for livestock products in Canada. Environ. Sci. Pol. 2010, 34, 618–629. [Google Scholar]

