Impact of Climate and Land Use Changes on Water and Food Security in Jordan: Implications for Transcending “The Tragedy of the Commons”

 ,
, 
Abstract
:1. Introduction
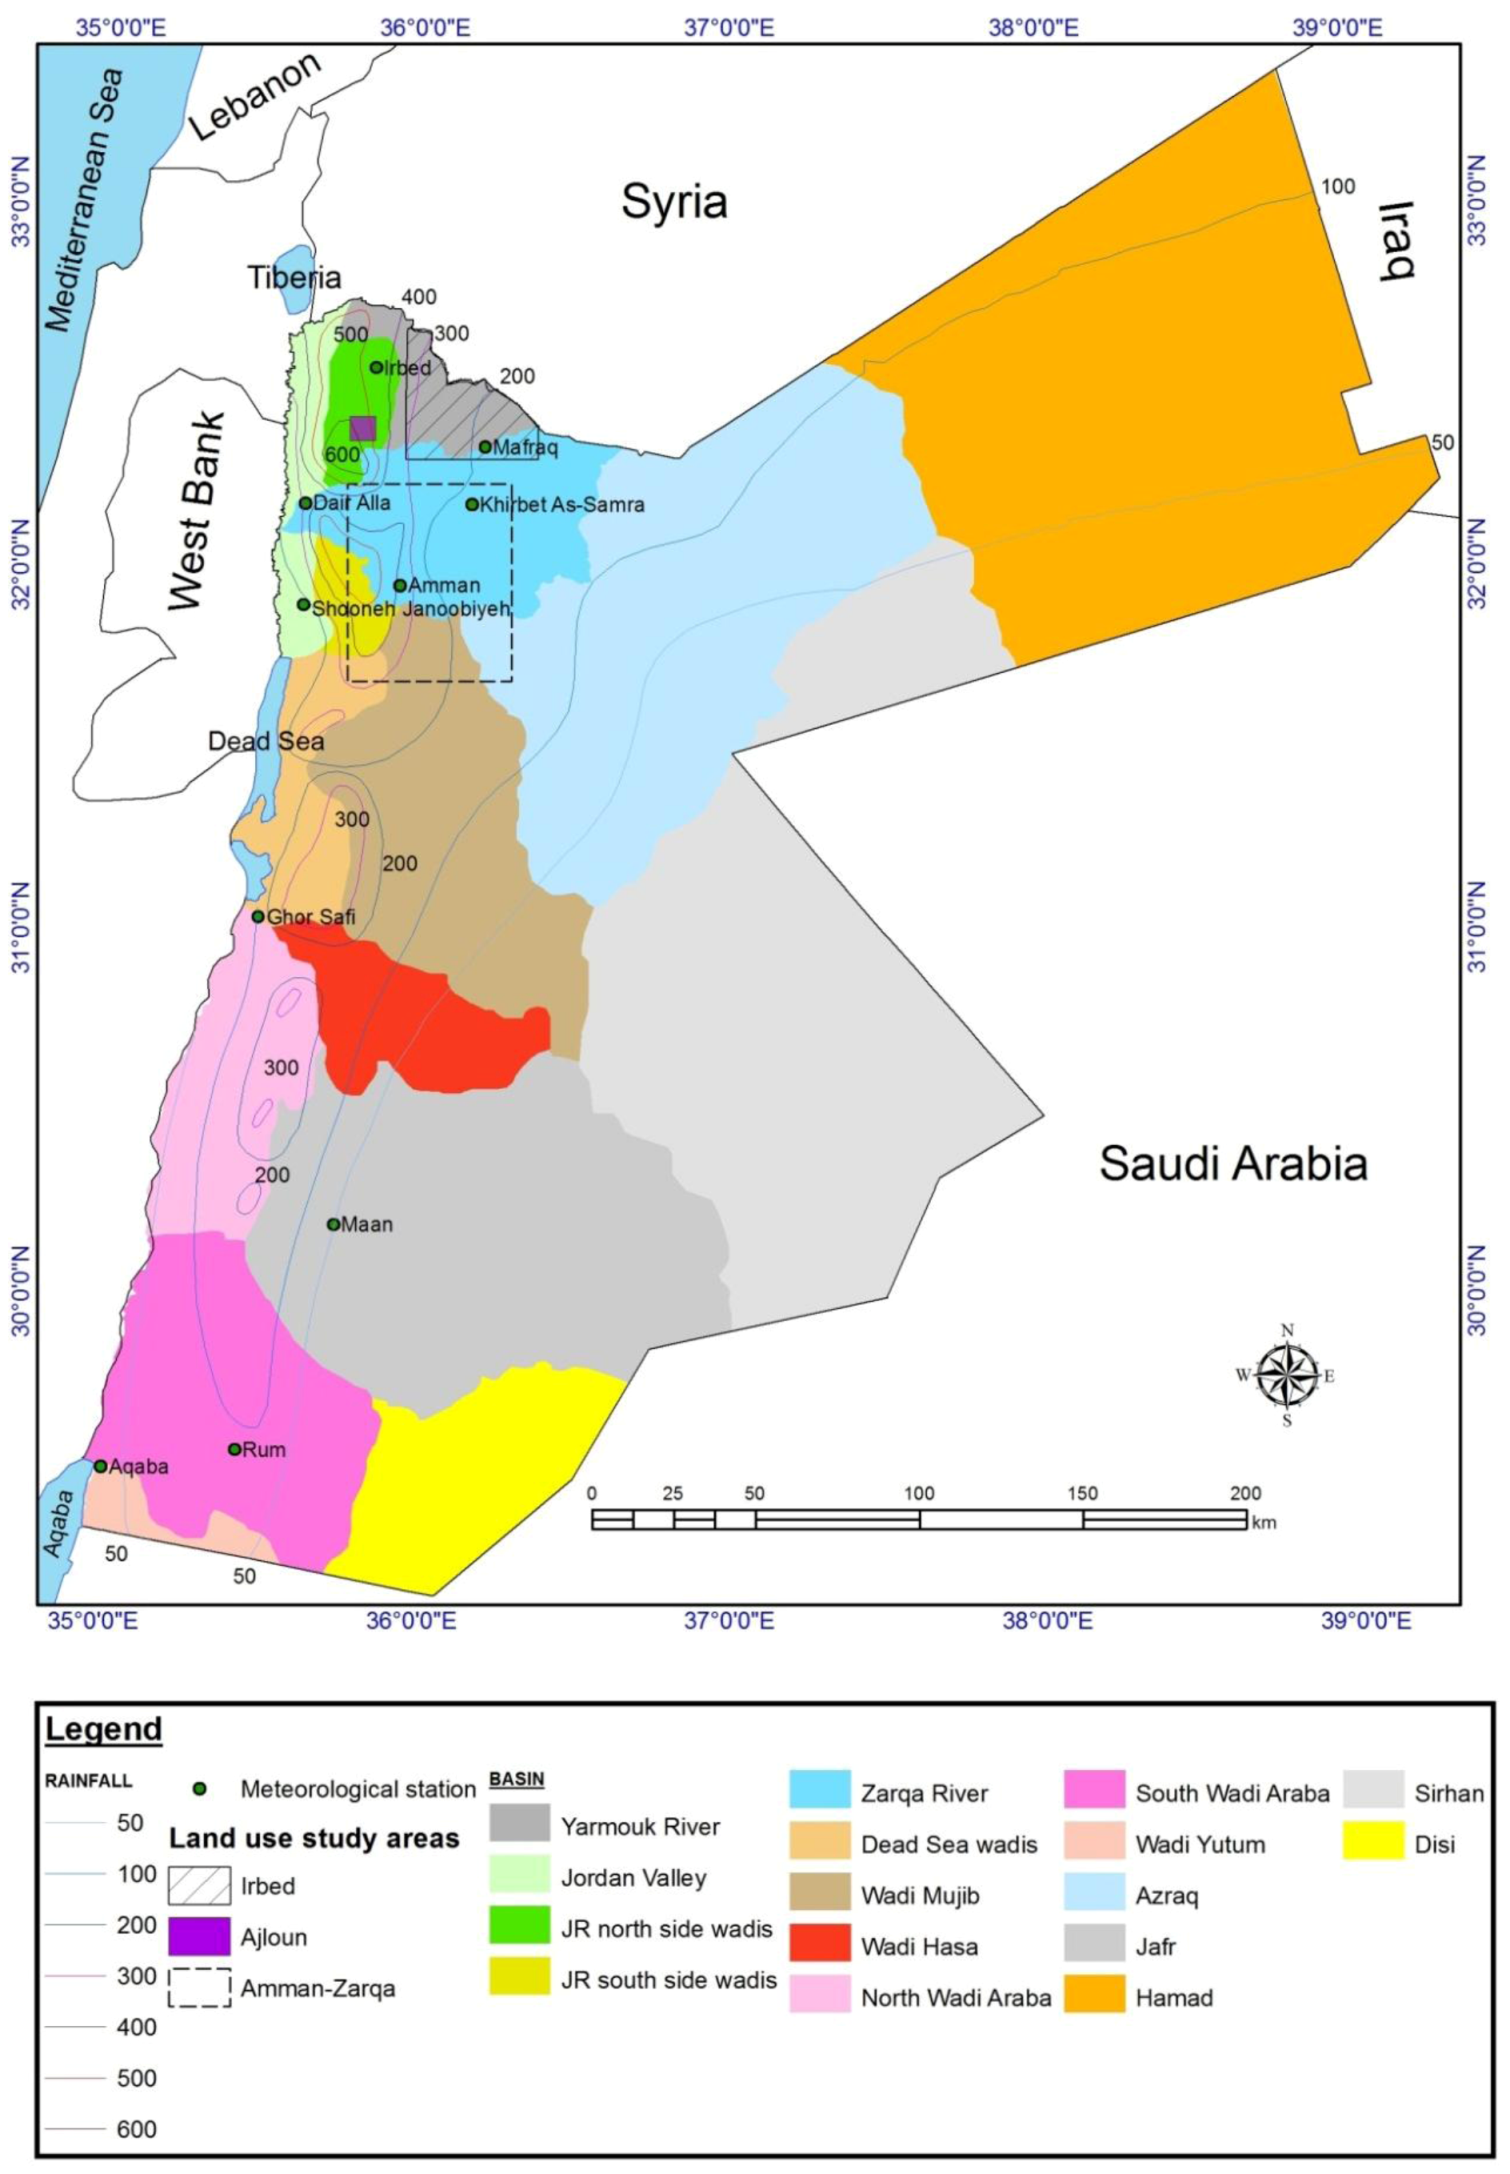
2. Study Area

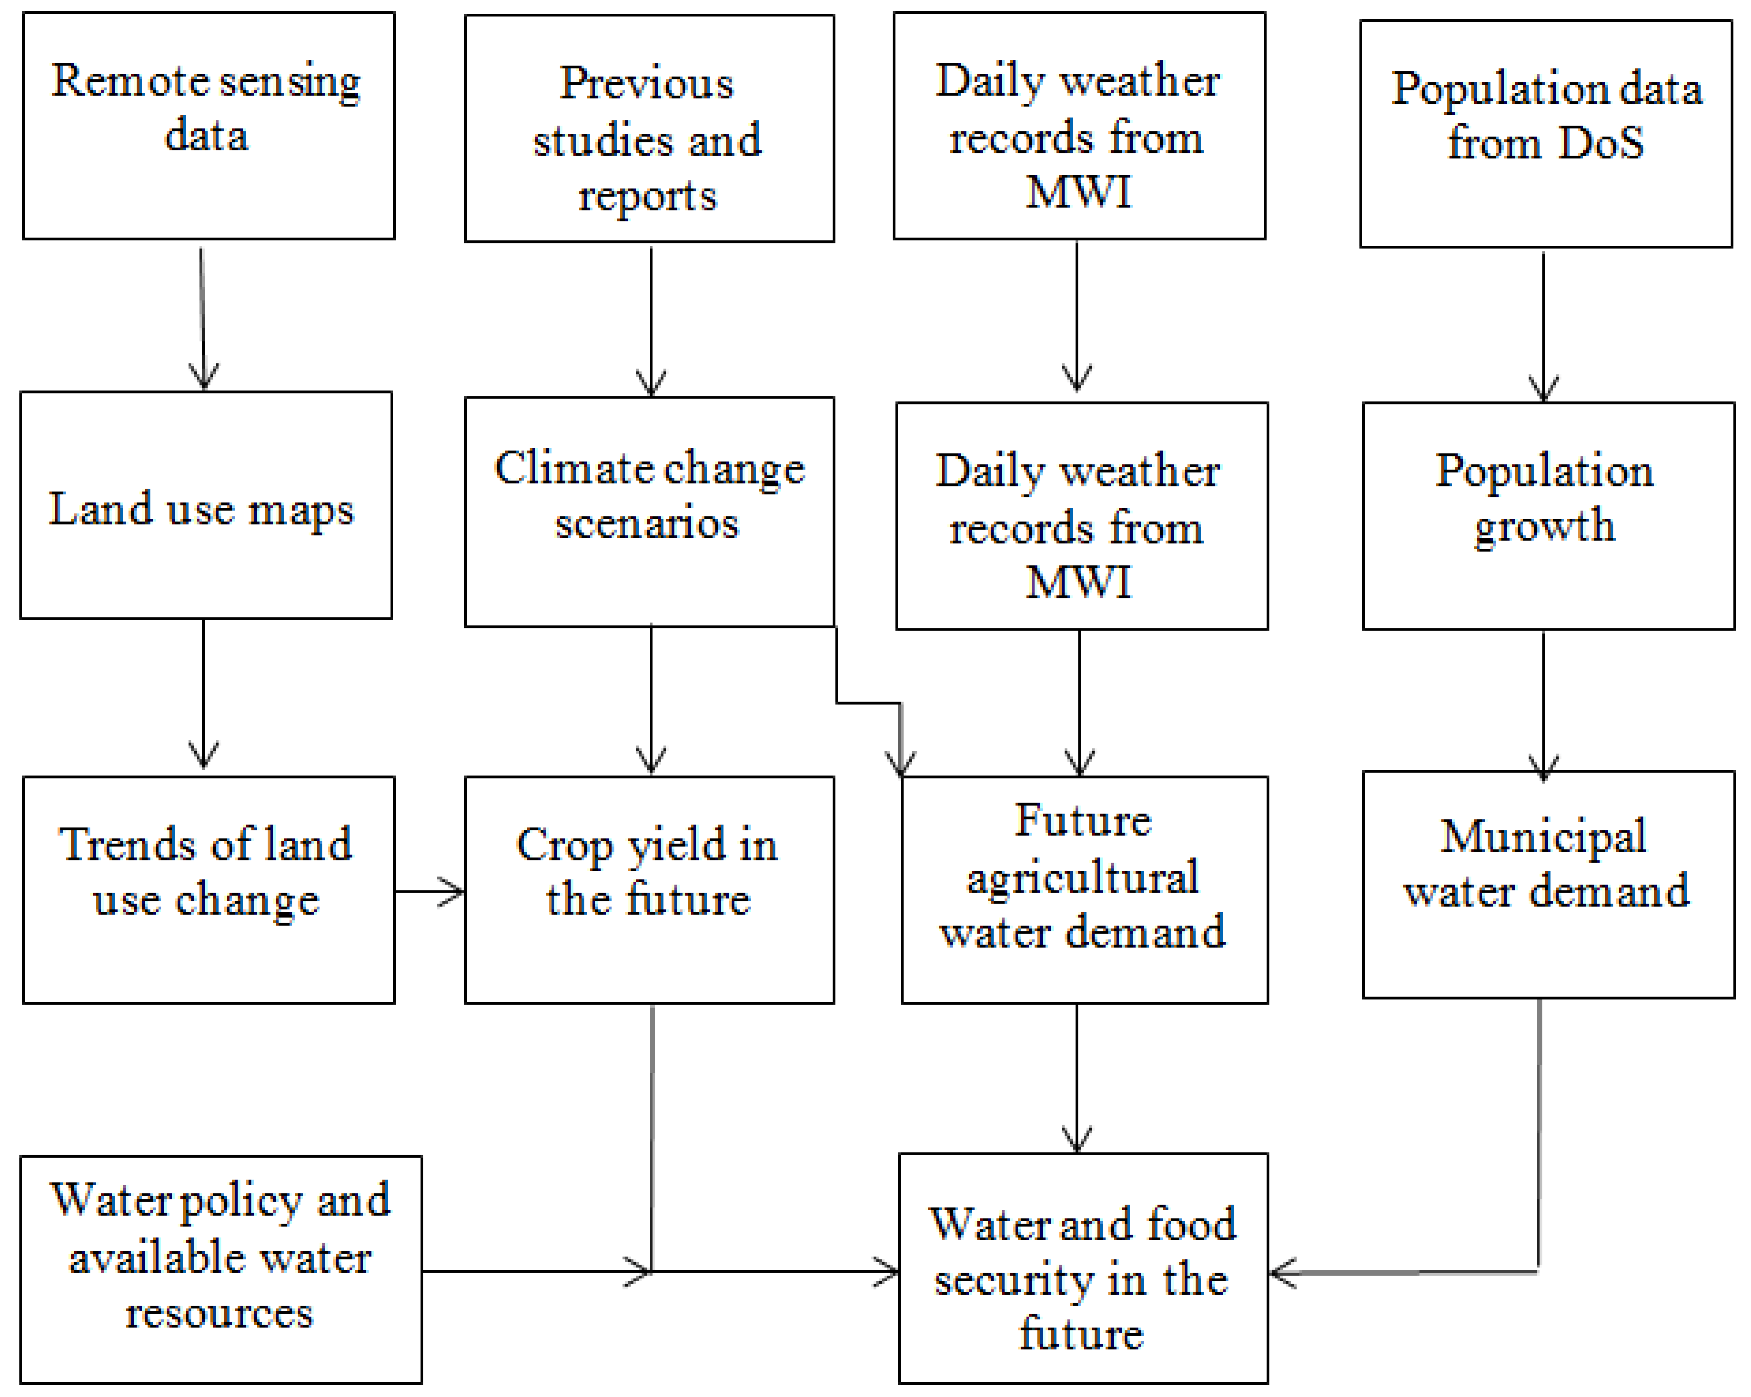
3. Methodology

3.1. Trends and Scenarios of Climate Change

| Basin | Temperature change (oC) | Precipitation change (%) | ||||
|---|---|---|---|---|---|---|
| 2030 | 2050 | 2030 | 2050 | |||
| Yarmouk River | +1 | +2 | –10 | –20 | ||
| Jordan River north side wadis | +1 | +2 | +5 | +10 | ||
| Jordan River south side wadis | +1 | +2 | –10 | –20 | ||
| Zarqa River | +1 | +2 | –10 | –20 | ||
| Dead Sea wadis | +1 | +2 | –5 | –10 | ||
| Wadi Mujib | +1 | +2 | –10 | –20 | ||
| Wadi Hasa | +1 | +2 | –10 | –20 | ||
| North Wadi Araba area | +1 | +2 | –10 | –20 | ||
| South Wadi Araba area | +1 | +2 | –10 | –20 | ||
| Wadi Yutum | +1 | +2 | –10 | –20 | ||
| Azraq | +1 | +2 | +5 | +10 | ||
| Jafir | +1 | +2 | +5 | +10 | ||
| Hammad | +1 | +2 | +10 | +20 | ||
| Sirhan | +1 | +2 | +5 | +10 | ||
| Southern Desert (Disi) | +1 | +2 | –10 | –20 | ||
3.2. Climate Change and Crop Production in Jordan

- Y = Olive production (ton),
- X1 = Average temperature in the considered months,
- X2 = Rainfall in November,
- X3 = Rainfall in December,
- X4 = Rainfall in January,
- X5 = Accumulated rainfall in March and
- X6 = Cultivated area (10–1 ha).
| Crop | Climate Change Scenario | Change in Yield | Reference | |
|---|---|---|---|---|
| Temperature | Rainfall | |||
| Rainfed barley | +1°C | –10% | –18% | [4,11,18,19] |
| +2°C | –20% | –35% | ||
| Rainfed wheat | +1°C | –10% | –7% | [4,11,18,19] |
| +2°C | –20% | –21% | ||
| Rainfed olives | +1°C | –10% | –5% | [11,18,19] |
| +2°C | –20% | –10% | ||
| Irrigated vegetables | +1°C | – | –5% | [11,18,19,20,21,22,23,24] |
| +2°C | – | –10% | ||
| Rangelands | +1°C | +5% | +10% | [15,18] |
| +2°C | +10% | +10% | ||
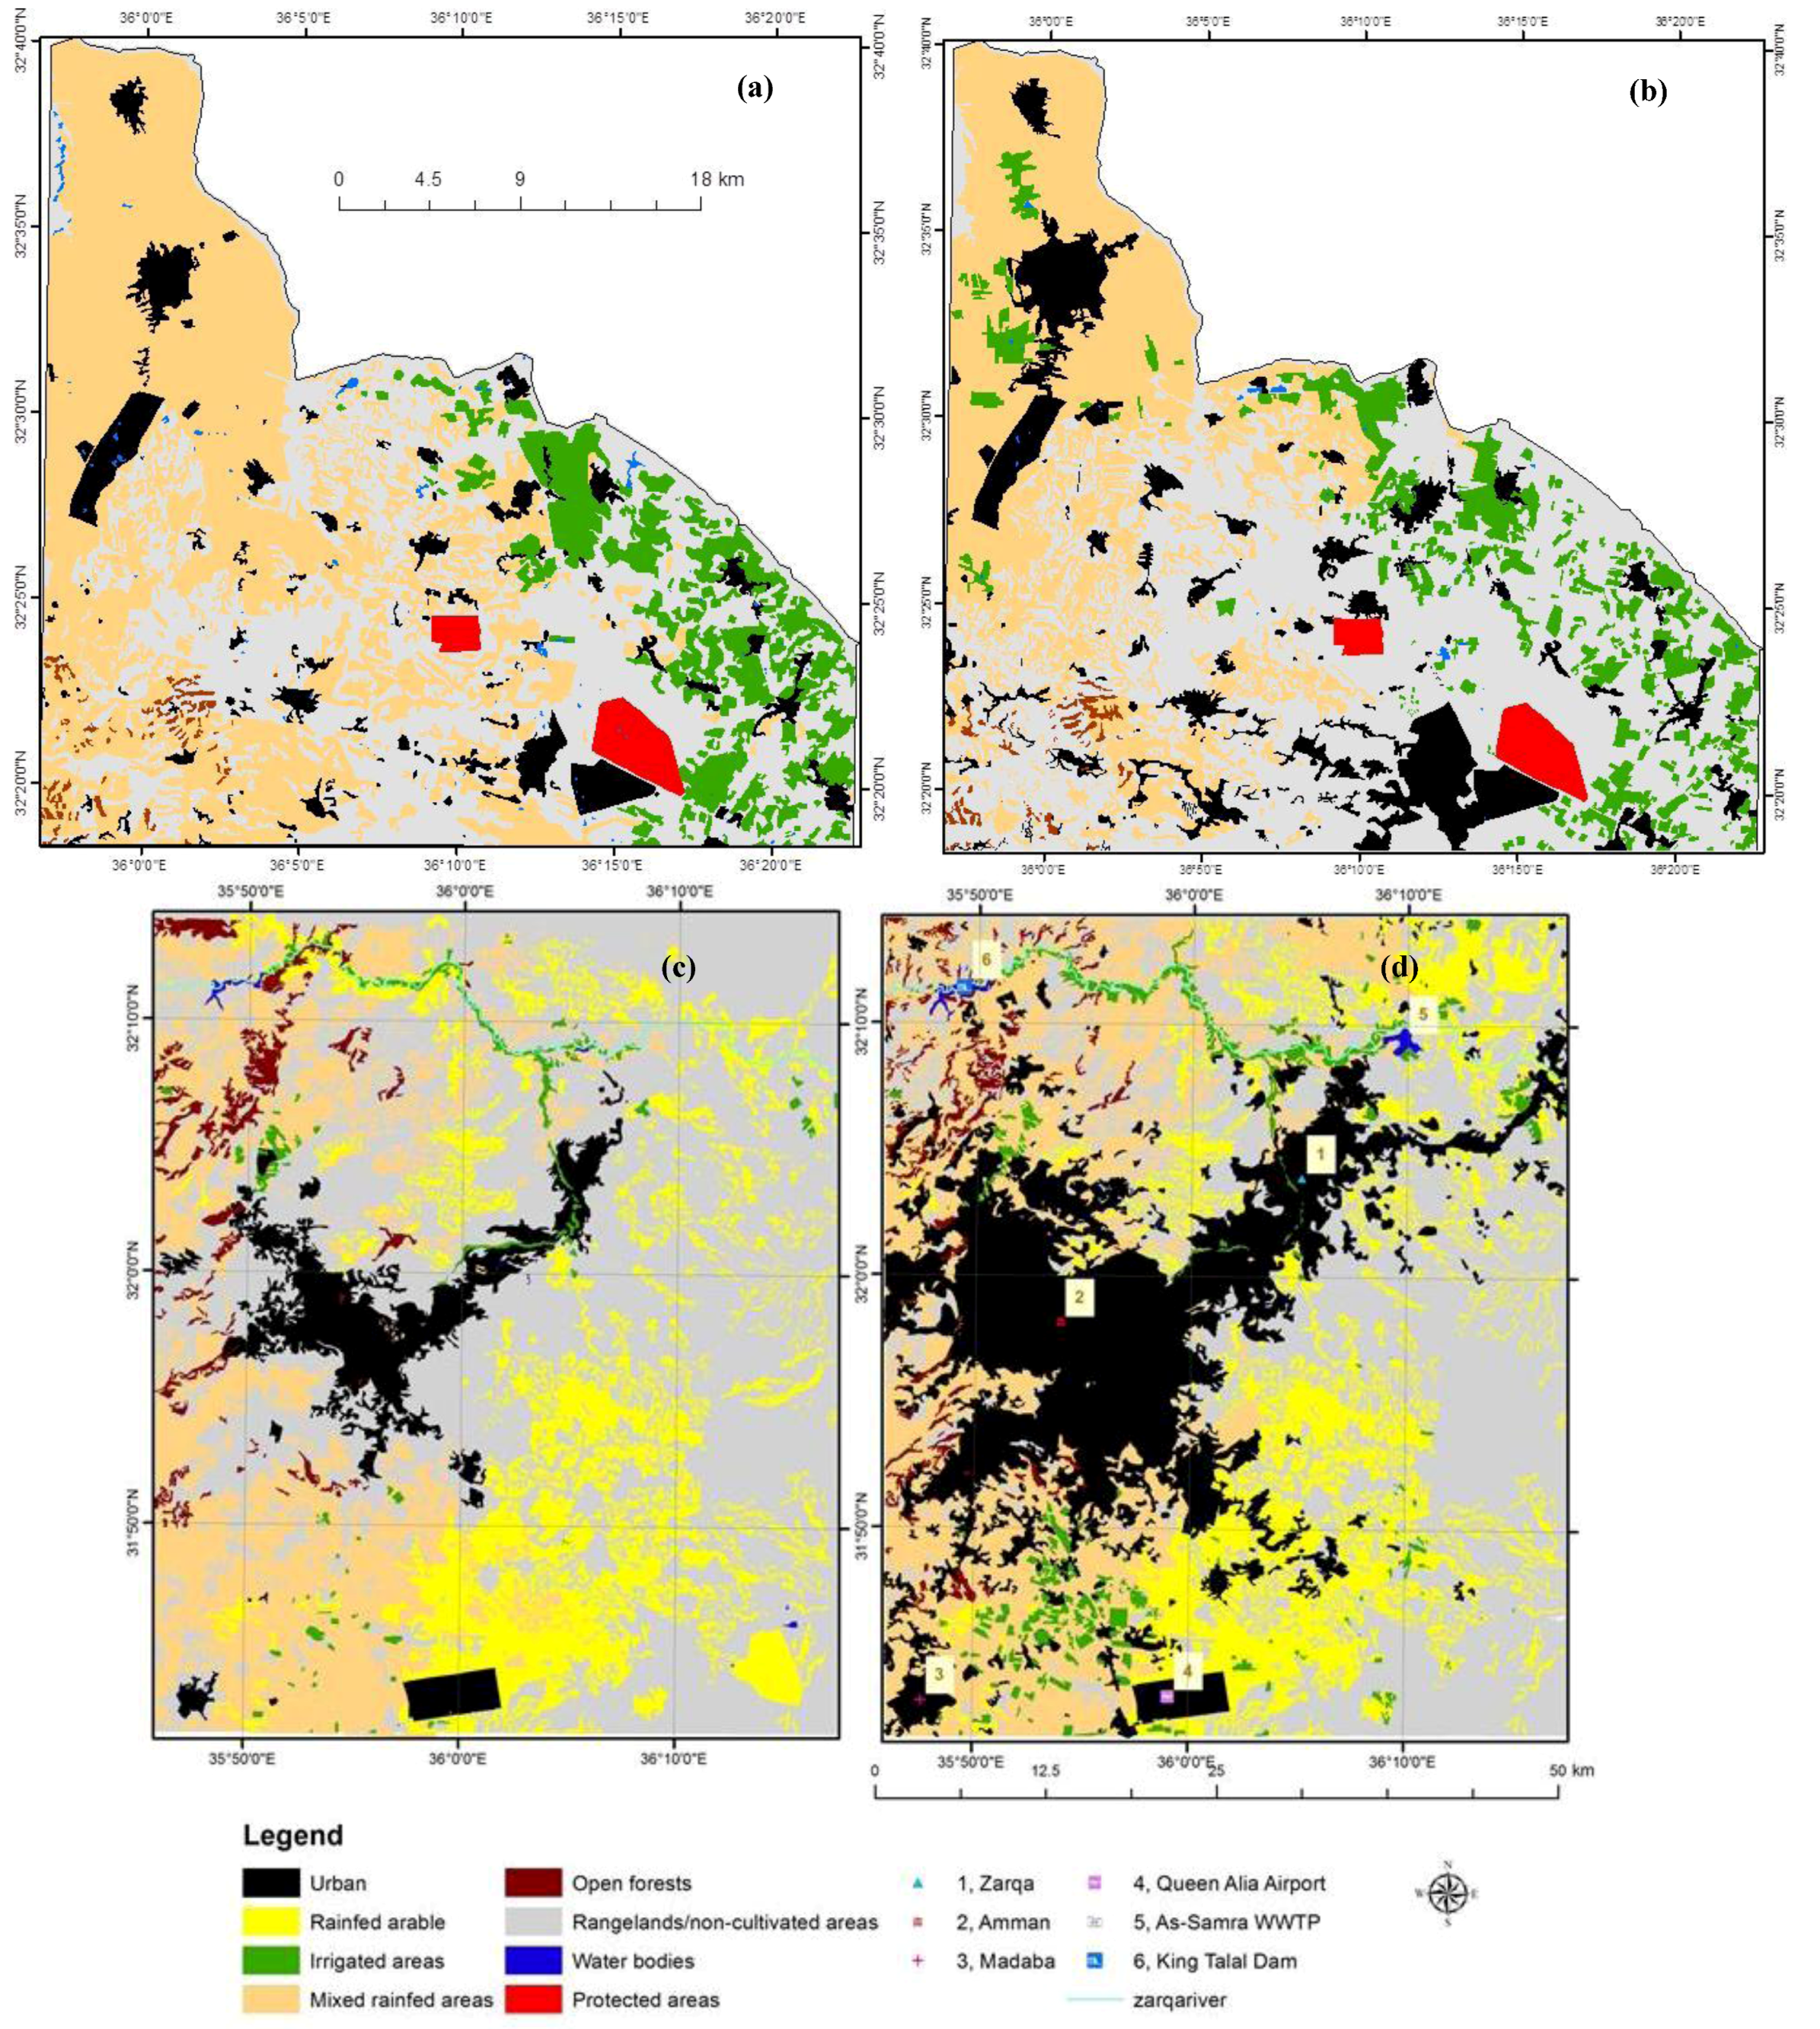
3.3. Mapping of Land Use and Its Change
3.4. Climate Change and Water Deficit
3.5. Climate Change and Food Security
4. Results and Discussion
4.1. Population Growth and Land Use Change

| Land use/cover | Irbed | Amman-Zarqa | Ajloun * | |||||
|---|---|---|---|---|---|---|---|---|
| 1992 | 2002 | 2010 | 1983 | 1994 | 2010 | 1978 | 2002 | |
| Urban | 7.2 | 9.8 | 12.4 | 6.1 | 12.3 | 22.0 | 1.6 | 5.5 |
| Mixed rainfed areas | 42.4 | 39.8 | 29.4 | 35.4 | 39.4 | 36.9 | 29.7 | 50.0 |
| Irrigated areas | 9.4 | 8.4 | 7.6 | 1.1 | 3.3 | 2.4 | –– | –– |
| Forests | 0.6 | 0.6 | 0.6 | 2.0 | 1.8 | 1.8 | 37.6 | 34.6 |
| Rangelands/non-cultivated | 40.0 | 41.2 | 49.9 | 55.3 | 43.0 | 36.7 | 31.1 | 9.9 |
| Water bodies | 0.4 | 0.2 | 0.1 | 0.1 | 0.2 | 0.2 | –– | –– |


| Class | Year 2010 | Year 2030 | Year 2050 |
|---|---|---|---|
| Urban | 1.7 | 3.4 | 6.1 |
| Mixed rainfed areas | 3.8 | 3.3 | 2.7 |
| Irrigated area | 1.1 | 0.9 | 0.8 |
| Forests | 0.3 | 0.2 | 0.1 |
| Rangelands and non-cultivated areas | 93.0 | 92.1 | 90.2 |
| Water bodies (dams and TWW plants) | <0.1 | 0.1 | 0.1 |
4.2. Climate Change Impact on Crop Production and Food Security
| Crop | Location | Present | Year 2050 | ||||||
|---|---|---|---|---|---|---|---|---|---|
| ETc (mm) | Area (ha) | Production (×103 ton) | WUE (kg/ha/mm) | ETc (mm) | Area (ha) | Production (×103 ton) | WUE (kg/ha/mm) | ||
| Alfalfa | Khirbet As-Samra | 1673 | 609 | 34.2 | 33.6 | 1754 | 444 | 24.9 | 32.0 |
| Alfalfa | Aqaba | 1935 | 479 | 25.5 | 27.5 | 2092 | 349 | 18.6 | 25.5 |
| Apple | Maan | 505 | 1,293 | 18.3 | 28.0 | 561 | 944 | 12.1 | 22.8 |
| Banana | Shooneh Janoobiyeh | 1536 | 826 | 13.7 | 10.8 | 1640 | 603 | 10.0 | 10.1 |
| Citrus | Shooneh Janoobiyeh | 731 | 388 | 5.3 | 18.7 | 781 | 283 | 3.8 | 17.2 |
| Citrus | Deir Alla | 834 | 661 | 6.7 | 12.2 | 929 | 483 | 4.9 | 10.9 |
| Egg Plant | Deir Alla | 267 | 532 | 17.2 | 121.1 | 305 | 389 | 11.3 | 95.2 |
| Olive | Mafraq | 562 | 7,039 | 11.2 | 2.8 | 607 | 5,138 | 7.3 | 2.3 |
| Potato | Deir Alla | 205 | 888 | 21.4 | 117.6 | 253 | 648 | 14.1 | 86.0 |
| Potato | Rum | 512 | 282 | 8.8 | 60.9 | 547 | 206 | 5.8 | 51.5 |
| Squash | Deir Alla | 185 | 580 | 10.6 | 98.8 | 228 | 424 | 7.0 | 72.4 |
| Tomato | Ghour Safi | 218 | 2,441 | 101.5 | 190.7 | 253 | 1,782 | 66.7 | 147.9 |
| Tomato | Deir Alla | 254 | 870 | 46.9 | 212.2 | 299 | 635 | 30.8 | 162.2 |
| Tomato | Mafraq | 499 | 1,850 | 96.2 | 104.2 | 533 | 1,350 | 63.2 | 87.8 |
| Wheat | Irbed | 736 | 5,027 | 6.2 | 1.7 | 832 | 3,519 | 3.5 | 1.2 |
| Food items | Year | ||||||
|---|---|---|---|---|---|---|---|
| 1994 * | 2002 | 2007 | 2008 | 2009 | 2030 | 2050 | |
| Cereals | 6.1 | 5.0 | 1.6 | 1.3 | 2.9 | 2.8 | 1.7 |
| Wheat | 10.2 | 6.6 | 2.7 | 0.7 | 2.0 | 1.7 | 1.1 |
| Potatoes | 95.4 | 90.7 | 85.8 | 79.7 | 80.9 | 63.0 | 53.0 |
| Pulses | 15.0 | 12.2 | 3.5 | 2.5 | 2.8 | 1.7 | 1.6 |
| Vegetables | 121.4 | 139.0 | 161.0 | 153.0 | 162.0 | 127.0 | 106.0 |
| Fruits | 115.2 | 82.2 | 65.5 | 82.6 | 86.2 | 70.0 | 61.0 |
| Olive oil | 107.0 | 102.0 | 113.6 | 99.6 | 82.2 | 56.0 | 54.0 |
| Meat (Mutton) | 48.2 | 41.8 | 46.0 | 45.0 | 45.4 | 27.5 | 18.0 |
| Meat (Beef) | 9.6 | 11.9 | 16.8 | 22.6 | 15.9 | ** | ** |
| Meat (Chicken) | 85.3 | 85.5 | 85.8 | 90.0 | 90.0 | ** | ** |
| Fish | 4.3 | 6.9 | 4.8 | 3.6 | 4.0 | 4.0 | 4.0 |
| Eggs | 101.0 | 102.6 | 110.0 | 105.0 | 108.4 | ** | ** |
| Fresh milk | 49.2 | 100.0 | 100.0 | 100.0 | 100.0 | ** | ** |
4.3. Climate Change Impact on Water Security
| Year | Irrigation | Industry | Tourism | Municipal | Total |
|---|---|---|---|---|---|
| 2010 | 1,072 | 77 | 10 | 405 | 1,564 |
| 2022 | 983 (1,000) * | 120 | 20 | 494 | 1,617 |
| 2030 | 910 (1,037) * | 150 | 35 | 580 | 1,675 |
| 2050 | 760 (937) * | 220 | 48 | 760 | 1,788 |
| Without climate change | With climate change | ||||||
|---|---|---|---|---|---|---|---|
| 2010 | 2022 | 2030 | 2050 | 2020 | 2030 | 2050 | |
| Supply without Red-Dead conveyor | 1,144 | 1,360 | 1,460 | 1,540 | 1,292 | 1,314 | 1,232 |
| Supply with Red-Dead conveyor | 1,144 | 1,940 | 2,040 | 2,120 | 1,872 | 1,894 | 1,812 |
| Water Demand | 1,564 | 1,617 | 1,675 | 1,788 | 1,666 | 1,802 | 2,001 |
| Water balance without Red-Dead conveyor | –420 | –257 | –215 | –248 | –374 | –488 | –769 |
| Water balance with Red-Dead conveyor | –– | 323 | 365 | 332 | 206 | 92 | –189 |
4.4. Implications for Building Adaptive Capacity
- (a)
- Modification of cropping patternThis adaptation measure was supported by findings from this study, which showed that some crops had lower WUE than other crops, i.e., they consumed more water and produced less food. Among these irrigated crops are banana and olives. Also, WUE would differ from one geographical location to another. For example, WUE for potato in Deir Alla (in Jordan Valley) would reach 86 kg/ha/mm compared to 52 kg/ha/mm for the same crop in Rum (desert area). These figures would favor the cultivation of potato in the Jordan Valley rather than in the highlands. This adaptation measure would also include the intrusion of new crop varieties with high WUE.
- (b)
- Improvement of irrigation efficiencySince climate change scenarios would reduce WUE and since the current irrigation efficiency was relatively low (65%), adaptation measures should include the improvement of irrigation systems efficiency. This adaptation measure “more crop per drop” would increase production and WUE without developing new water resources.
- (c)
- Reuse of treated wastewaterDue to population growth, more wastewater would be generated from urban and rural areas. Therefore, this source of water should be developed and utilized in a sustainable manner. One option would be the reuse of treated wastewater for irrigating fodder crops, provided that water would meet the standards for its reuse. Also, soil suitability for this option should be investigated [54].
- (a)
- Water demand management optionsThis measure should include the control and/or reallocation of water consumption among sectors of utilization. Demand management would also encompass the institutional arrangements supervising the water sector and the allocation patterns to avoid conflicts among sectors.
- (b)
- Water supply management optionsFindings from this study showed that the Red-Dead conveyor would be the main water supply to narrow the gap between supply and demand. The other options might include the improvement of efficiency of water use at the system level and the development of marginal water resources of brackish and treated wastewater.
- (c)
- Capacity building and public awareness campaignsAdaptation measures would not be achieved without creating public awareness as means to knowledge transfer and to helping people develop attitudes necessary to adopt practices and formulate new positive behavior patterns towards water conservation. Although the problem of water scarcity had been recognized at the community level, however, transfer of knowledge and technology would be needed to implement adaptation measures.
5. Conclusions
Acknowledgments
Conflict of Interest
References
- Hardin, G. The tragedy of the commons. Science 1968, 162, 1243–1248. [Google Scholar] [CrossRef]
- Agoumi, A. Vulnerability Studies on Three North Africa Countries (Algeria, Morocco and Tunisia) With Respect to Climatic Changes, 2001; final report of UNEP-GEF project RAB94G31; The International Institute for Sustainable Development: Manitoba, Canada, 2003. [Google Scholar]
- Chiras, D. D. Environmental Science, 9th ed; Jones and Bartlett Publishers: Sudbury, MA, USA, 2012; pp. 154–196. [Google Scholar]
- Al-Bakri, J.T.; Suleiman, A.; Abdulla, F.; Ayad, J. Potential impacts of climate change on the rainfed agriculture of a semi-arid basin in Jordan. Phys. Chem. Earth 2011, 35, 125–134. [Google Scholar]
- Molden, D.; De Fraiture, C.; Rijsberman, F. Water Scarcity: The Food Factor, Issues in Science and Technology, 2007. Available online: http://www.issues.org/23.4/molden.html (accessed on 12 February 2013).
- MWI (Ministry of Water and Irrigation), Water for Life: Jordan's Water Strategy, 2008-2022; MWI: Amman, Jordan, 2009.
- Al-Bakri, J.T.; Ajlouni, M.; Abu-Zanat, M. Incorporating land use mapping and participation in Jordan: An approach to sustainable management of two mountainous areas. Mt. Res. Dev. 2008, 28, 49–57. [Google Scholar] [CrossRef]
- Al-Hadidi, L. Evaluation of Desertification Risk in Jordan Using Some Climatic Factors. Unpublished MSc Thesis, University of Jordan, Amman, Jordan, 1996. [Google Scholar]
- Tarawneh, Q.; Kadıoğlu, M. An analysis of precipitation climatology in Jordan. Theor. Appl. Climatol. 2003, 74, 123–136. [Google Scholar] [CrossRef]
- Freiwan, M.; Kadioglu, M. Spatial and temporal analysis of climatological data in Jordan. Int. J. Climatol. 2007, 28, 521–535. [Google Scholar] [CrossRef]
- GCEP (General Corporation for Environment Protection, Jordan). Jordan's First National Communication to the UNFCCC; GCEP: Amman, Jordan, 1999.
- MoEnv (Ministry of Environment, Jordan). Jordan's Second National Communication to the UNFCCC; Deposit No. 2009/11/4731; Ministry of Environment: Amman, Jordan, 2009.
- Shakhatreh, Y. Trend Analysis for Rainfall and Temperatures in Three Locations in Jordan. In Proceedings of the International Conference on Food Security and Climate Change in Dry Areas, Amman, Jordan, 1–4 February, 2010; Solh, M., Saxena, M.C., Eds.; ICARDA: Aleppo, Syria, 2010. [Google Scholar]
- Helsel, D.R.; Hirsch, R.M. Statistical Methods in Water Resources, U.S. Geological Survey, Techniques of Water-Resources Investigations Book 4, Chapter A3; USGS: Virginia, USA, 2002; pp. 326–342. Available online: http://pubs.usgs.gov/twri/twri4a3/ (accessed on 12 February 2013).
- CCSP (Climate Change and Science Program), The Effects of Climate Change on Agriculture, Land Resources, Water Resources, and Biodiversity; A Report by the U.S. Climate Change Science Program and the Sub-committee on Global Change Research; U.S. Environmental Protection Agency: Washington, DC, USA, 2008.
- Ortiz, R. Crop Genetic Engineering under Global Climate Change. Ann. Arid Zone 2008, 47, 1–12. [Google Scholar]
- Anwar, M.R.; O’Leary, G.; McNeil, D.; Hossain, H.; Nelson, R. Climate change impact on rainfed wheat in south-eastern Australia. Field Crop Res. 2007, 104, 139–147. [Google Scholar] [CrossRef]
- Cruz, R.V.; Harasawa, H.; Lal, M.; Wu, S.; Anokhin, Y.; Punsalmaa, B.; Honda, Y.; Jafari, M.; Li, C.; Huu Ninh, N. Impacts, Adaptation and Vulnerability. Contribution of Working Group II to the Fourth Assessment Report of the Intergovernmental Panel on Climate Change; Parry, M.L., Canziani, O.F., Palutikof, J.P., van der Linden, P.J., Hanson, C.E., Eds.; Cambridge University Press: Cambridge, UK, 2007; pp. 469–506. [Google Scholar]
- FAO (Food and Agriculture Organization), Assessment of the Risks From Climate Change and Water Scarcity on Food Productivity; Final Report of deliverable FAO/ RFP/ 2010/01; FAO and STRTM: Amman, Jordan, 2010.
- Reynolds, M.P.; Ewing, E.E.; Owens, T.G. Photosynthesis at high temperature in tuber-bearing solanum species. Plant Physiol. 1990, 93, 791–797. [Google Scholar] [CrossRef]
- Reynolds, M.P.; Ewing, E.E. Effects of high air and soil temperature stress on growth and tuberization in Solanum tuberosum. Ann. Bot.-London 1989, 64, 241–247. [Google Scholar]
- Lafta, A.M.; Lorenzen, J.H. Effect of high temperature on plant growth and metabolism in potato. Plant Physiol. 1995, 109, 637–643. [Google Scholar]
- Hazra, P.; Samsul, H.A.; Sikder, D.; Peter, K.V. Breeding tomato (Lycopersicon Esculentum Mill) resistant to high temperature stress. Int. J. Plant Breeding 2007, 1, 31–40. [Google Scholar]
- Adams, S.R.; Cockshull, K.E.; Cave, C.R.J. Effect of Temperature on the Growth and Development of Tomato Fruits. Ann. Bot.-London 2001, 88, 869–877. [Google Scholar]
- Jensen, J. R. Introductory Digital Image Processing: A Remote Sensing Perspective, 3rd ed; Prentice Hall: Upper Saddle River, NJ, USA, 2005; p. 526. [Google Scholar]
- MoA (Ministry of Agriculture, Jordan). The Soils of Jordan: Semi-detailed Level (1:50,000), The National Soil Map and Land Use Project, NSMLUP; MoA: Amman, Jordan, 1995.
- Rababa’a, M.M.; Al-Bakri, J.T. Mapping land cover in the Dead Sea basin from Landsat TM satellite imagery. Dirasat 2006, 33, 103–113. [Google Scholar]
- Al-Bakri, J.T. Remote Sensing Techniques for Environmental Monitoring of the Semiarid Zone of Jordan. Unpublished PhD Thesis, Cranfield University, Bedfordshire, UK, 2000. [Google Scholar]
- Al-Bakri, J. Assessment and Monitoring of Desertification in Jordan Using Remote Sensing and Bioindicators; Report to NATO-SfP983368; NATO-SfP: Brussels, Belgium, 2011. [Google Scholar]
- Al-Bakri, J.T.; Taylor, J.C.; Brewer, T.R. Monitoring land use change in the Badia transition zone in Jordan using aerial photography and satellite imagery. Geogr. J. 2001, 167, 248–262. [Google Scholar]
- Khresat, S.; Al-Bakri, J.; Tahhan, R. Impacts of land use change on soil properties in the Mediterranean region of northwestern Jordan. Land Degrad. Dev. 2008, 19, 397–407. [Google Scholar] [CrossRef]
- Khresat, S.A.; Rawajfih, Z.; Mohammad, M. Land degradation in north-western Jordan, causes and processes. J. Arid Environ. 1998, 39, 623–629. [Google Scholar] [CrossRef]
- MWI (Ministry of Water and Irrigation), Wastewater Management Policy, Paper No. 4: Management of Wastewater; MWI: Amman, Jordan, 1998.
- MWI (Ministry of Water and Irrigation, Jordan). Annual Report; MWI: Amman, Jordan, 2007.
- MWI (Ministry of Water and Irrigation, Jordan). Annual Report; MWI: Amman, Jordan, 2009.
- MWI (Ministry of Water and Irrigation, Jordan). Special Report on Water Resources in Jordan; MWI: Amman, Jordan, 2009.
- MWI (Ministry of Water and Irrigation, Jordan). Annual Report; MWI: Amman, Jordan, 2010.
- Allen, R.G.; Pereira, L.A.; Raes, D.; Smith, M. Crop Evapotranspiration; FAO Irrigation and Drainage Paper 56; FAO: Rome, Italy, 1998. [Google Scholar]
- Fardous, A.A.; Jitan, M.A. Water Use Efficiency in Agriculture: Jordan Experience; National Center for Agricultural Research and Extension (NCARE): Baqa’a, Jordan, 2004. [Google Scholar]
- Shatanawi, M.; Fardous, M.; Mazahrih, N.; Duqqah, M. Irrigation Systems Performance in Jordan. In Irrigation Systems Performance, Proceedings of the 2nd WASAMED Workshop, Hammamet, Tunisia, 24-28 June 2004; Lamaddalena, N., Lebdi, F., Todorovic, M., Bogliotti, C., Eds.; CIHEAM: Bari, Italy, 2004; pp. 126–137. [Google Scholar]
- FAO (Food and Agriculture Organization), Trade Reforms and Food Security: Conceptualizing the Linkages; FAO: Rome, Italy, 2003.
- FAO (Food and Agriculture Organization), The State of Food Insecurity in the World; report no. 4; FAO: Rome, Italy, 2002.
- DoS (Department of Statistics), Food Balance Sheet of 2008; DoS: Amman, Jordan, 2008.
- DoS (Department of Statistics, Jordan). Study of Households Income and Expenditures 1987-2010; DoS: Amman, Jordan, 2010.
- DoS (Department of Statistics), Jordan in Figures: 2011, report no.14; DoS: Amman, Jordan, 2012.
- DoS (Department of Statistics), Iraqis in Jordan: Their Number and Characteristics; DoS, Fafo and UNFPA: Amman, Jordan, 2007.
- Mimi, Z.A.; Abu Jamous, S. Climate change and agricultural water demand: Impacts and adaptations. AJEST 2010, 4, 183–191. [Google Scholar]
- MoEnv (Ministry of Environment, Jordan). National Action Plan and Strategy to Combat Desertification; Deposit no. 2004/1/70; Ministry of Environment: Amman, Jordan, 2006.
- Abu-Zanat, M.; Ruyle, G.B.; Abdel-Hamid, N.F. Increasing range production from fodder shrubs in low rainfall areas. J. Arid Environ. 2004, 59, 205–216. [Google Scholar] [CrossRef]
- AOAD (Arab Organization for Agricultural Development), Arab Agricultural Statistics Yearbook; AOAD: Khartoum, Sudan, 1995; 15.
- Abu Taleb, M.F. Impacts of global climate change scenarios on water supply and demand in Jordan. Water Int. 2000, 25, 457–463. [Google Scholar] [CrossRef]
- Abdulla, F.; Al-Omari, A. Impact of climate change on the monthly runoff of a semi-arid catchment: Case study Zarqa River Basin (Jordan). JABS 2008, 2, 43–50. [Google Scholar]
- Abdulla, F.; Eshtawi, T.; Assaf, H. Assessment of the impact of potential climate change on the water balance of a semi-arid watershed. Water Res. Manag. 2009, 23, 2051–2068. [Google Scholar] [CrossRef]
- Schacht, K.; Gönster, S.; Jüschke, E.; Chen, Y.; Tarchitzky, J.; Al-Bakri, J.; Al-Karablieh, E.; Marschner, B. Evaluation of soil sensitivity towards the irrigation with treated wastewater in the Jordan River region. Water 2011, 3, 1092–1111. [Google Scholar] [CrossRef]
© 2013 by the authors; licensee MDPI, Basel, Switzerland. This article is an open access article distributed under the terms and conditions of the Creative Commons Attribution license (http://creativecommons.org/licenses/by/3.0/).
Share and Cite
Al-Bakri, J.T.; Salahat, M.; Suleiman, A.; Suifan, M.; Hamdan, M.R.; Khresat, S.; Kandakji, T. Impact of Climate and Land Use Changes on Water and Food Security in Jordan: Implications for Transcending “The Tragedy of the Commons”. Sustainability 2013, 5, 724-748. https://0-doi-org.brum.beds.ac.uk/10.3390/su5020724
Al-Bakri JT, Salahat M, Suleiman A, Suifan M, Hamdan MR, Khresat S, Kandakji T. Impact of Climate and Land Use Changes on Water and Food Security in Jordan: Implications for Transcending “The Tragedy of the Commons”. Sustainability. 2013; 5(2):724-748. https://0-doi-org.brum.beds.ac.uk/10.3390/su5020724
Chicago/Turabian StyleAl-Bakri, Jawad Taleb, Mohammad Salahat, Ayman Suleiman, Marwan Suifan, Mohammad R. Hamdan, Saeb Khresat, and Tarek Kandakji. 2013. "Impact of Climate and Land Use Changes on Water and Food Security in Jordan: Implications for Transcending “The Tragedy of the Commons”" Sustainability 5, no. 2: 724-748. https://0-doi-org.brum.beds.ac.uk/10.3390/su5020724