Article

Remotely Accessible Instrumented Monitoring of Global Development Programs: Technology Development and Validation

1
Portland State University, Mechanical and Materials Engineering Department, 1930 SW 4th Ave, Suite 400, Portland, OR 97201, USA
2
Georgia Institute of Technology, School of Electrical and Computer Engineering, 777 Atlantic Drive Northwest, Atlanta, GA 30332, USA
3
University of Colorado at Boulder, Civil and Environmental Engineering Department, UCB 401, Boulder, CO 80301, USA
4
Stevens Water Monitoring Inc., 12067 NE Glenn Widing Dr. #106, Portland, OR 97220, USA
*
Author to whom correspondence should be addressed.
Sustainability 2013, 5(8), 3288-3301; https://0-doi-org.brum.beds.ac.uk/10.3390/su5083288
Submission received: 17 February 2013 / Revised: 3 July 2013 / Accepted: 23 July 2013 / Published: 2 August 2013

Abstract

:
Many global development agencies self-report their project outcomes, often relying on subjective data that is collected sporadically and communicated months later. These reports often highlight successes and downplay challenges. Instrumented monitoring via distributed data collection platforms may provide crucial evidence to help inform the sector and public on the effectiveness of aid, and the on-going challenges. This paper presents the process of designing and validating an integrated sensor platform with cellular-to-internet reporting purposely targeted at global development programs. The integrated hardware platform has been applied to water, sanitation, energy and infrastructure interventions and validated through laboratory calibration and field observations. Presented here are two examples: a water pump and a household water filter, wherein field observations agreed with the data algorithm with a linear fit slope of between 0.91 and 1, and an r-squared of between 0.36 and 0.39, indicating a wide confidence interval but with low overall error (i.e., less than 0.5% in the case of structured field observations of water volume added to a household water filter) and few false negatives or false positives.

1. Introduction

Access to improved drinking water, sanitation systems and clean burning stoves could benefit the billions who suffer from diarrheal disease and pneumonia, two of the leading causes of death around the world for children under five [1]. While there have been many efforts, large and small, designed to address these challenges, the majority of international development programs self-report project outcomes through person-to-person surveys that assess adoption of a particular program or technology. However, these surveys often overestimate adoption rates due to reporting bias where the participant is trying to please the surveyor or recall problems where the participant does not remember the information correctly. This bias has been recorded in a number of settings, including determinations of poor correlation between observations and self-reported recall of water storage, handwashing and defecation practices [2,3]. More recently, a study conducted by the London School of Hygiene and Tropical Medicine used structured observations to validate data. By using a motion detector to track latrine use, they determined that structured observations highly influenced user behavior [4]. Additionally, it is known that the act of surveying can itself impact later behavior [5]. Finally, the subjectivity of the outcome studied can highly influence reporting bias [6] with some researchers concluding that, “There is a clear possibility that the large effect sizes seen in unblinded trials are largely or even entirely due to responder and observer bias, selective reporting and publication bias,” [7].
Efforts are being made to more accurately demonstrate success of these programs through more rigorous field monitoring or lab testing. For example, programs that implement chlorine interventions assess use through chlorine residual using a free chlorine sensor at the same time as surveys instead of only relying on self-reporting. While this is a more objective measure it yields only infrequent data points and reporting bias often still exists with users chlorinating when they find out a surveyor is visiting. Additionally many energy programs use exhaustive lab testing methods to assess specific improved cooking stoves but with little correlation to typical cooking conditions [8]. An objective, timely and continuous monitoring system has yet to be realized within the development sector that can meet all of these challenges.
Instrumentation with remote reporting may help address this objectivity weakness through interventions instrumented with sensor based monitors, which can provide real-time data in an objective manner. Data from remote monitoring can offer insight in the short to medium terms by providing a real time report of use that the larger international development community can review and apply to their programs as well as an automatic report to funders. Additionally social, economic and environmental components of a program can be integrated into long-term implementation strategies [9].
While the concept of using instrumentation to provide feedback on water, sanitation, energy and infrastructure programs is not novel, the application of instrumentation in the international development sector is only now emerging as a reliable way to improve on current methods and potentially reduce program costs. Several other organizations are contributing to this initiative, including work conducted at the University of California at Berkeley and the associated Berkeley Air Monitoring Group on indoor air pollution instrumentation including a particle monitor [10], a stove temperature sensor [11], a hand-pump motion monitor with remote reporting developed at the University of Oxford [12], and a passive latrine use monitor for sanitation studies developed by the University of California at Berkeley and the London School of Hygiene and Tropical Medicine [4].
There are organizations that are currently using cell-phone based surveys and internet based visualization for data collection and communication from the field (Akvo/Water for People FLOW, World Bank WSP, mWater, mWash). However, these platforms largely rely on person-based surveys. There are also other organizations implementing instrumentation in development projects (e.g., Berkeley Air Monitoring Group, MIT D-Lab, Aprovecho). This strategy is often modifying off-the-shelf equipment or combining sensors with smartphones. This can result in a higher cost and lower battery lifetime simply because of a lack of purpose-built integration, plus a requirement for end-user interaction, for which the conceptualized architecture presented in this paper does not.
This paper discusses the development and validation of a fully integrated data acquisition system with cellular based remote reporting and online analysis. Two applications are discussed, a household water filter and a community water pump. This technology has been able to provide important information on household and community use of these kinds of environmental health technologies in a manner that may be more accurate than surveys and observations.

2. Methods

The technology development presented here includes both the hardware and validation of the data analysis algorithm. Both are discussed in the following sections.

2.1. Technical Description

Design criteria for the sensor development included a low-power, low-cost, user friendly hardware instrument to measure the performance and use of various development projects and relay this data directly to the internet for international dissemination. To meet the design criteria, key features were realized including distributed processing between hardware and the internet cloud, and remote automated recalibration and reconfiguration.
The hardware platform developed is powered with five AA batteries to provide a 6–18 month lifetime while still achieving a high sampling rate of up to 8 Hz. Battery life is saved through triggered event logging and infrequent reporting. Reports are transmitted through wifi or the cellular network but sensors can also include a secure digital (SD) card backup. In addition to the collected data the sensor also reports battery level and cellular signal strength to track system health and performance. Processing occurs through the Internet “cloud” which also enables remote auto calibration. Sensors can be tuned for different applications with 15 different standard voltage or current reference signal input. Data reported by the sensor can then be downloaded from any browser with a protected login. Software includes automatic and manual updating of sensor calibration, reporting and alarm parameters with the ability to be integrated with other web-based platforms through a provide API that is in development.
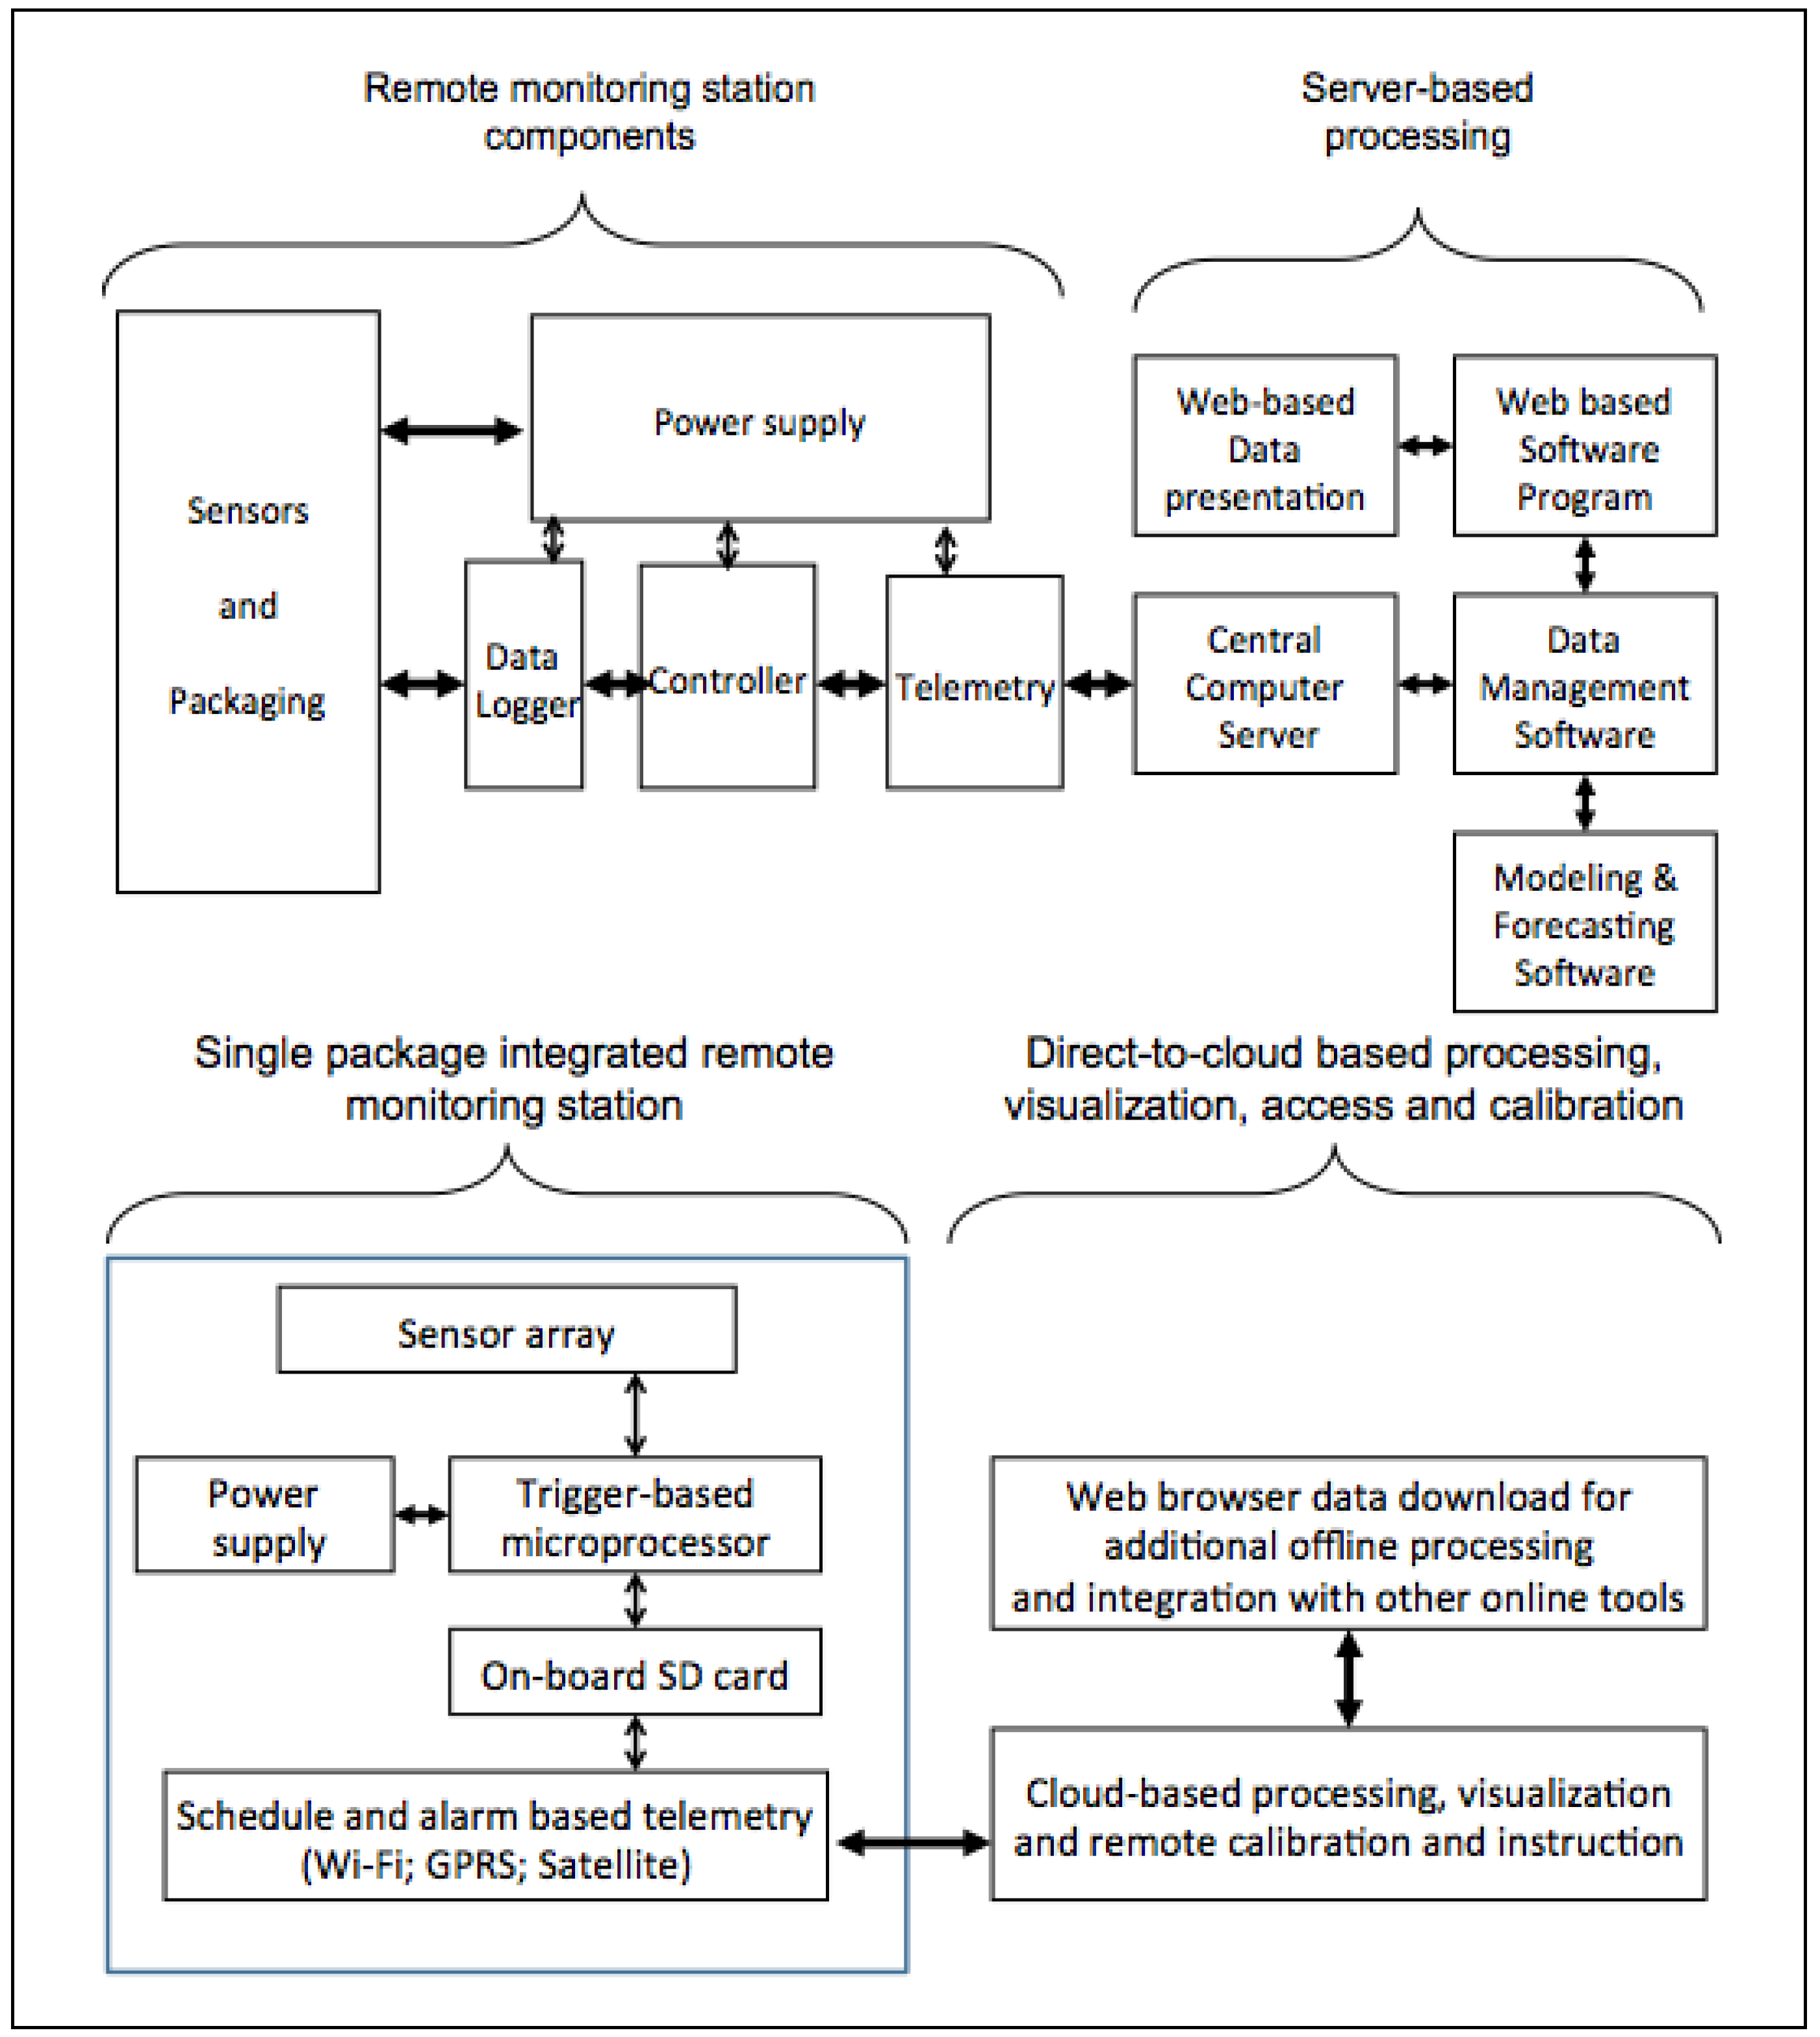
A commonly used data acquisition system design requires multiple different components (sensor, microprocessor, logger, radio, antenna, power supply) that are packaged and sold separately thereby increasing cost, complexity and power consumption. Additionally, many existing systems require specialized software to collect and analyze the data. Instead, the system presented here is a fully integrated hardware solution that includes the front-end sensor directly integrated, the processing hardware, the radio and the power supply. It is designed to maximize the value of the data and minimize power consumption. The data is transmitted to an internet-cloud platform that is accessible through any standard internet browser. This architecture has enabled the system to be significantly lower in cost and more accessible to the end-user than a similarly functional collection of off-the-shelf components. Figure 1 shows the current industry standard approach, compared against the design presented in this paper.
Figure 1. Example historical integrated data communication system, where each function is provided by a separate hardware component, and data is analyzed with proprietary software on dedicated services (top) and Architecture described herein, where the hardware platform is a fully integrated electronics board, and all processing is conducted on-line (bottom).
Sustainability 05 03288 g001
Data loggers often have a tradeoff between frequency of sampling and energy consumption, including recent sensor platforms deployed for environmental monitoring [13,14]. The design presented here addresses this issue by sampling at a comparatively high rate, between several times a minute and many times a second, while only logging and relaying the data when a reconfigurable, experimentally determined, threshold value is reached. This thereby minimizes power consumption and allows high resolution logging of usage events while running off of compact batteries for a targeted minimum of six months. The sensors relay all collected data, and rely on the internet processing to aggregate and reduce, thereby providing a more complete data set allowing more flexible analysis, unlike other recent power management strategies that reduce data on-board [15].
This platform combines commercially available front-end sensors, selected for specific applications including water treatment, cookstove, sanitation, infrastructure or other applications, with a comparator circuit board that samples these sensors at a reasonably high rate (up to 8 Hz, although nominally deployed at 1 Hz). The comparator boards monitor the sensors for trigger threshold events that start and end periodic local data logging. The comparators sample the sensors frequently (up to 8 Hz, although nominally deployed with 10 second samples), and the output is fed into a low power microcomputer chip where the relative time that the parameter change occurs is logged. Logging continues until the parameter returns to a reconfigurable threshold. For example, when applied to water flow measurements, a transducer comparator examines the reported water pressure data and waits for a change indicating, perhaps, that a tap has been opened. When the sudden drop in water pressure is observed, the system starts logging the actual pressure readings until the user closes the tap. The stored events are coded to reduce the amount of data, and thereby the amount of energy required for transmission. An optional on-board SD card allows for local backup logging, as well as logging when cell phone towers are disabled or out of range. The reconfigurable threshold is in analog-to-digital units and is determined experimentally for each application.
A key feature of this sensor data acquisition platform is the nominal low-power consumption of approximately 300 microamps. This is achieved through the use of Semiconductor Industries lowest power microcomputers manufactured by Microchip.com. During nominal operation, the sensor platform is in sleep mode, and all on-chip and off-chip peripherals are in a low-power mode until activated by a change in the sensored parameter. The most significant power usage occurs when each unit reports data and receives configuration parameters from the internet cloud database. Power usage is minimized by logging data locally and reporting on a user-configured scheduled, between approximately every 5 min to once every 24 h. These report intervals can also be dynamically autonomously optimized using cloud-based processing. For example, the sensor boards can be configured to only report when a certain threshold of data is recorded, rather than on a programmed schedule.
Additionally, several sensor inputs from different applications can be integrated into the same sensor board. For example, a single board of integrated power supply, logger and radio can take inputs from air quality and water quality sensors separately. Up to seven analog or digital inputs can be accommodated on a single board, and eight additional binary (on/off) inputs. The boards report directly to the internet over the HTTP protocol, and receive instructions and current time/date information from the cloud server. This significantly reduces the duration of the reporting. Should the communications protocol be disrupted by connectivity issues, such as maintenance on a cellular network tower, the sensor board will return to sleep mode after several connection attempts.
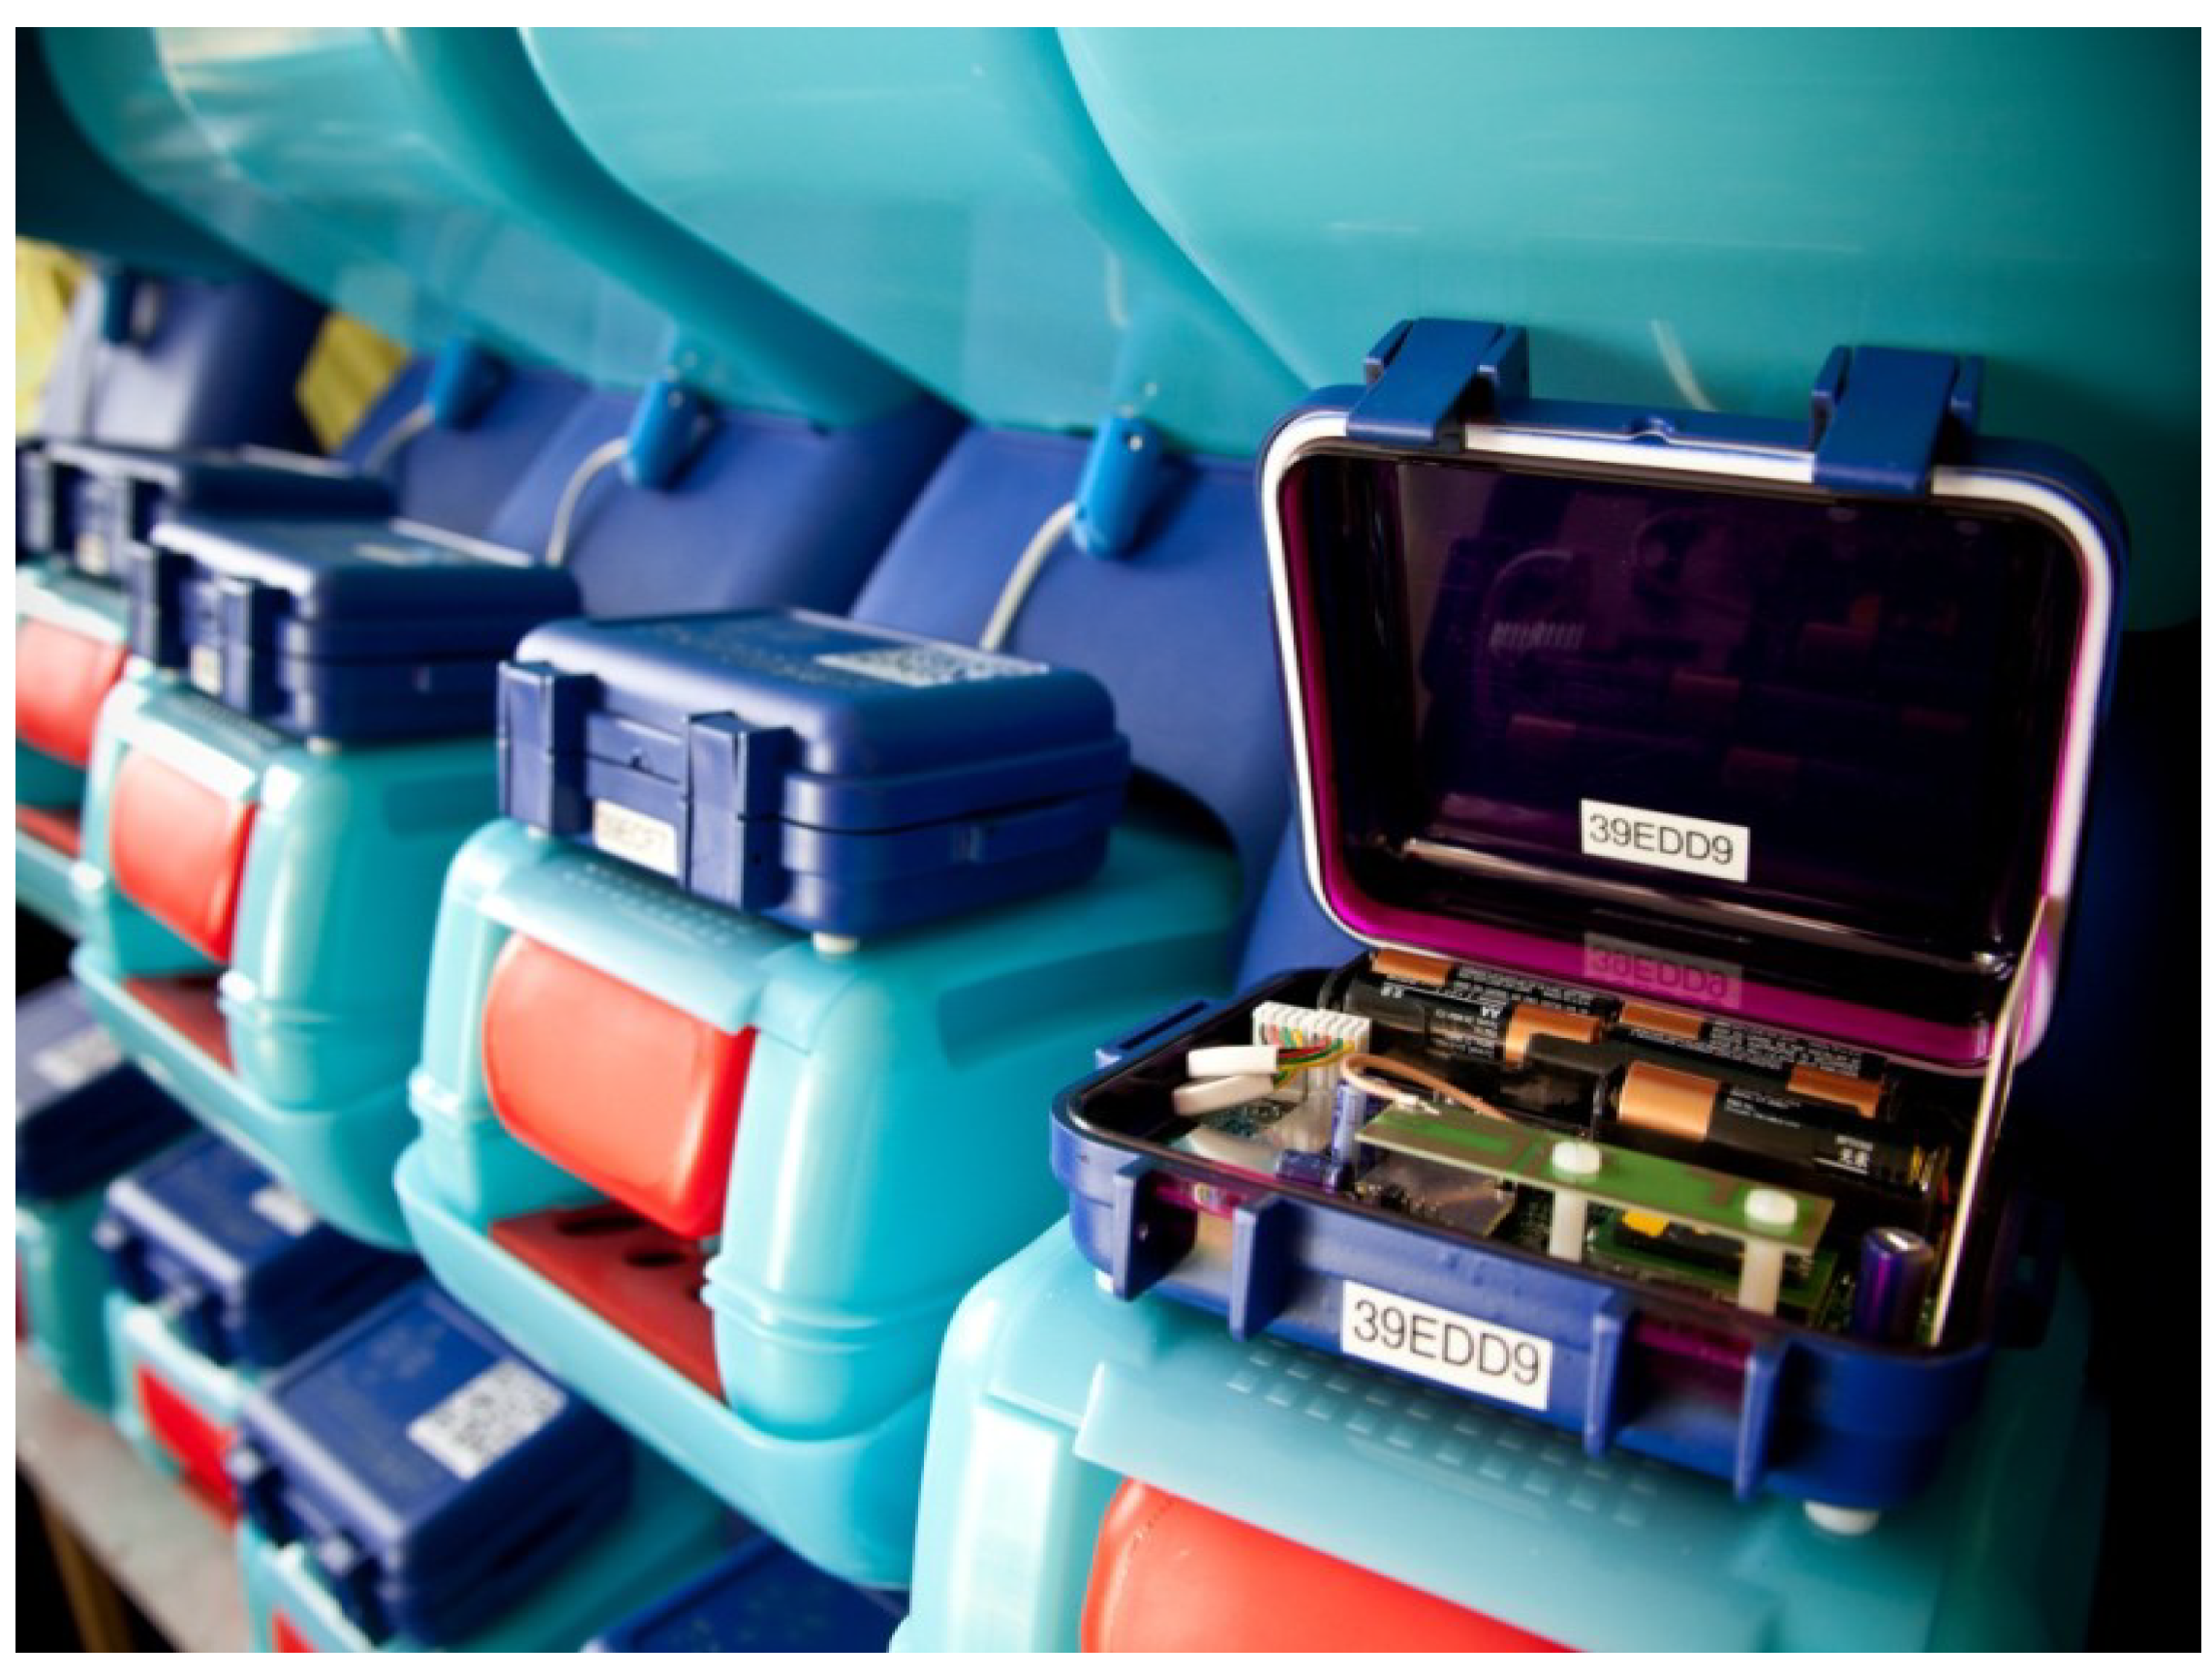
Each sensor board uses adaptive data compression coding algorithms to reduce the amount of data transmitted to the cloud server, less data transmitted equates to a shorter time the cell module needs to be on which improves battery life. In some versions, the sensor board could be deployed with a battery charging solar panel, heat harvesting Peltier junction, or other energy harvesting technologies, and its battery voltage can be monitored more often to decide which power saving mode to operate in. This will allow the system to be more adaptable to the local environment and subject application. Each board can autonomously effect an emergency alarm such as low battery capacity and contact the internet cloud server independent of any local event triggers. An example application on a household water filter is shown in Figure 2.
Figure 2. Sensors on household water filter. The dark blue waterproof box contains the electronics board. Pressure transducers are routed from the box (white cable) to the input bucket of the water filter.
Sustainability 05 03288 g002
Through the internet cloud (hosted on Amazon EC2), the data is then integrated with an online analysis and database system [16]. First, the sensor boards deliver raw data on a reconfigurable period over HTTP. Then C++ protocols process the raw data into a MySQL database, scaling readings when appropriate using sensor specific calibration values, discarding corrupted data, and compiling reporting periods, cellular signal strength and battery strength. Then, R scripts [17] process the MySQL data tables with signal processing, statistical analysis and aggregate routines, generate MySQL event tables, charts, and downloadable CSV files.
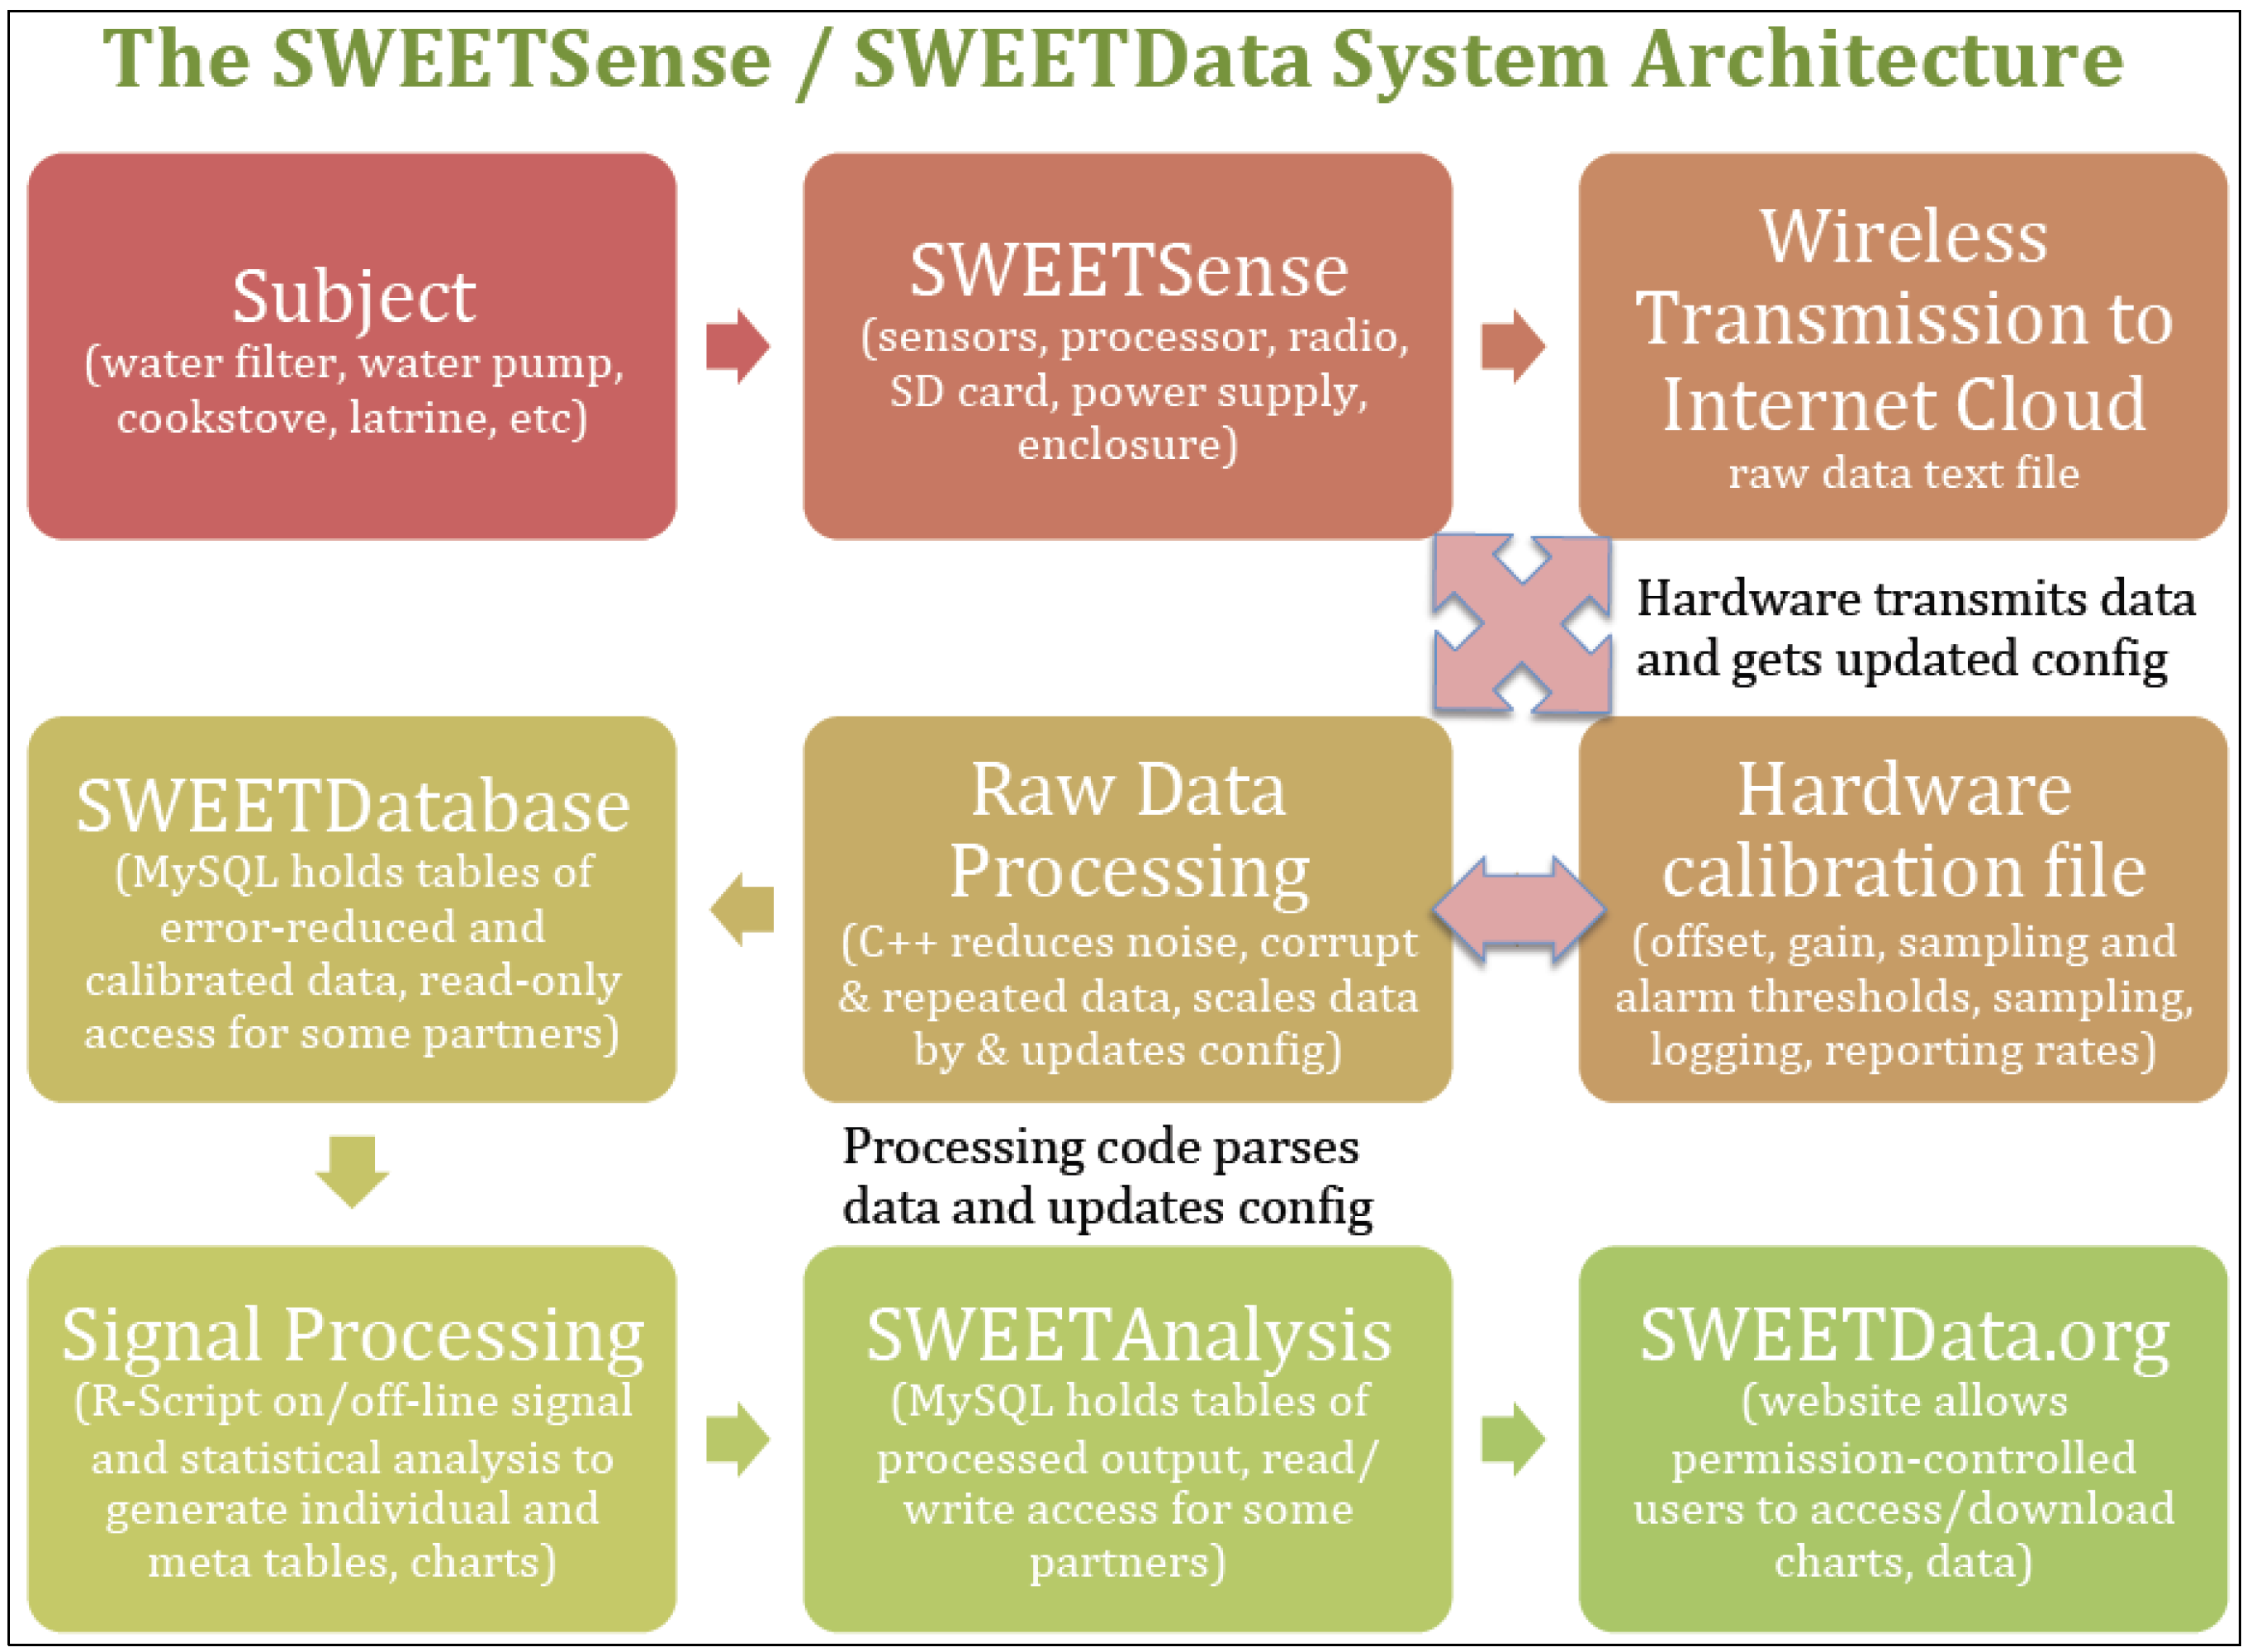
The distributed methods of data analysis allow some processing to be performed locally on the board, such as some averaging, trigger events, logging, offsets, and gains. Separately, processing algorithms for summary statistics and alarm events may be done on the internet cloud (distributed between the C++ and R routines), allowing high performance with low power consumption. The internet cloud based program can remotely re-configure the hardware platforms, and can cross check individual reports against reports from similarly deployed sensors. The overall data management architecture is pictorially described in Figure 3.
Figure 3. Data management architecture. The sensor technology is attached to the subject application, such as a water filter, water pump, or cookstove. The data is logged locally, and periodically transmitted over the cellular networks to the internet. Updated calibration and configuration parameters are downloaded to the hardware. Initial analysis is conducted by a C++ code that puts raw data into a MySQL database. R code is then applied to produce analytics and charts for display online.
Sustainability 05 03288 g003

2.2. Validation

Each sensor application is validated in at least two ways – laboratory and field trials. In laboratory testing, measured or known values of the target parameter (water volume, rate, gas concentration, etc.) are introduced to the sensor platform. The software signal processing algorithm is tuned to these known quantities through utilization of laboratory calibration values, signal processing and trial and error, and then this algorithm is processed identically for the field validation and field deployments.
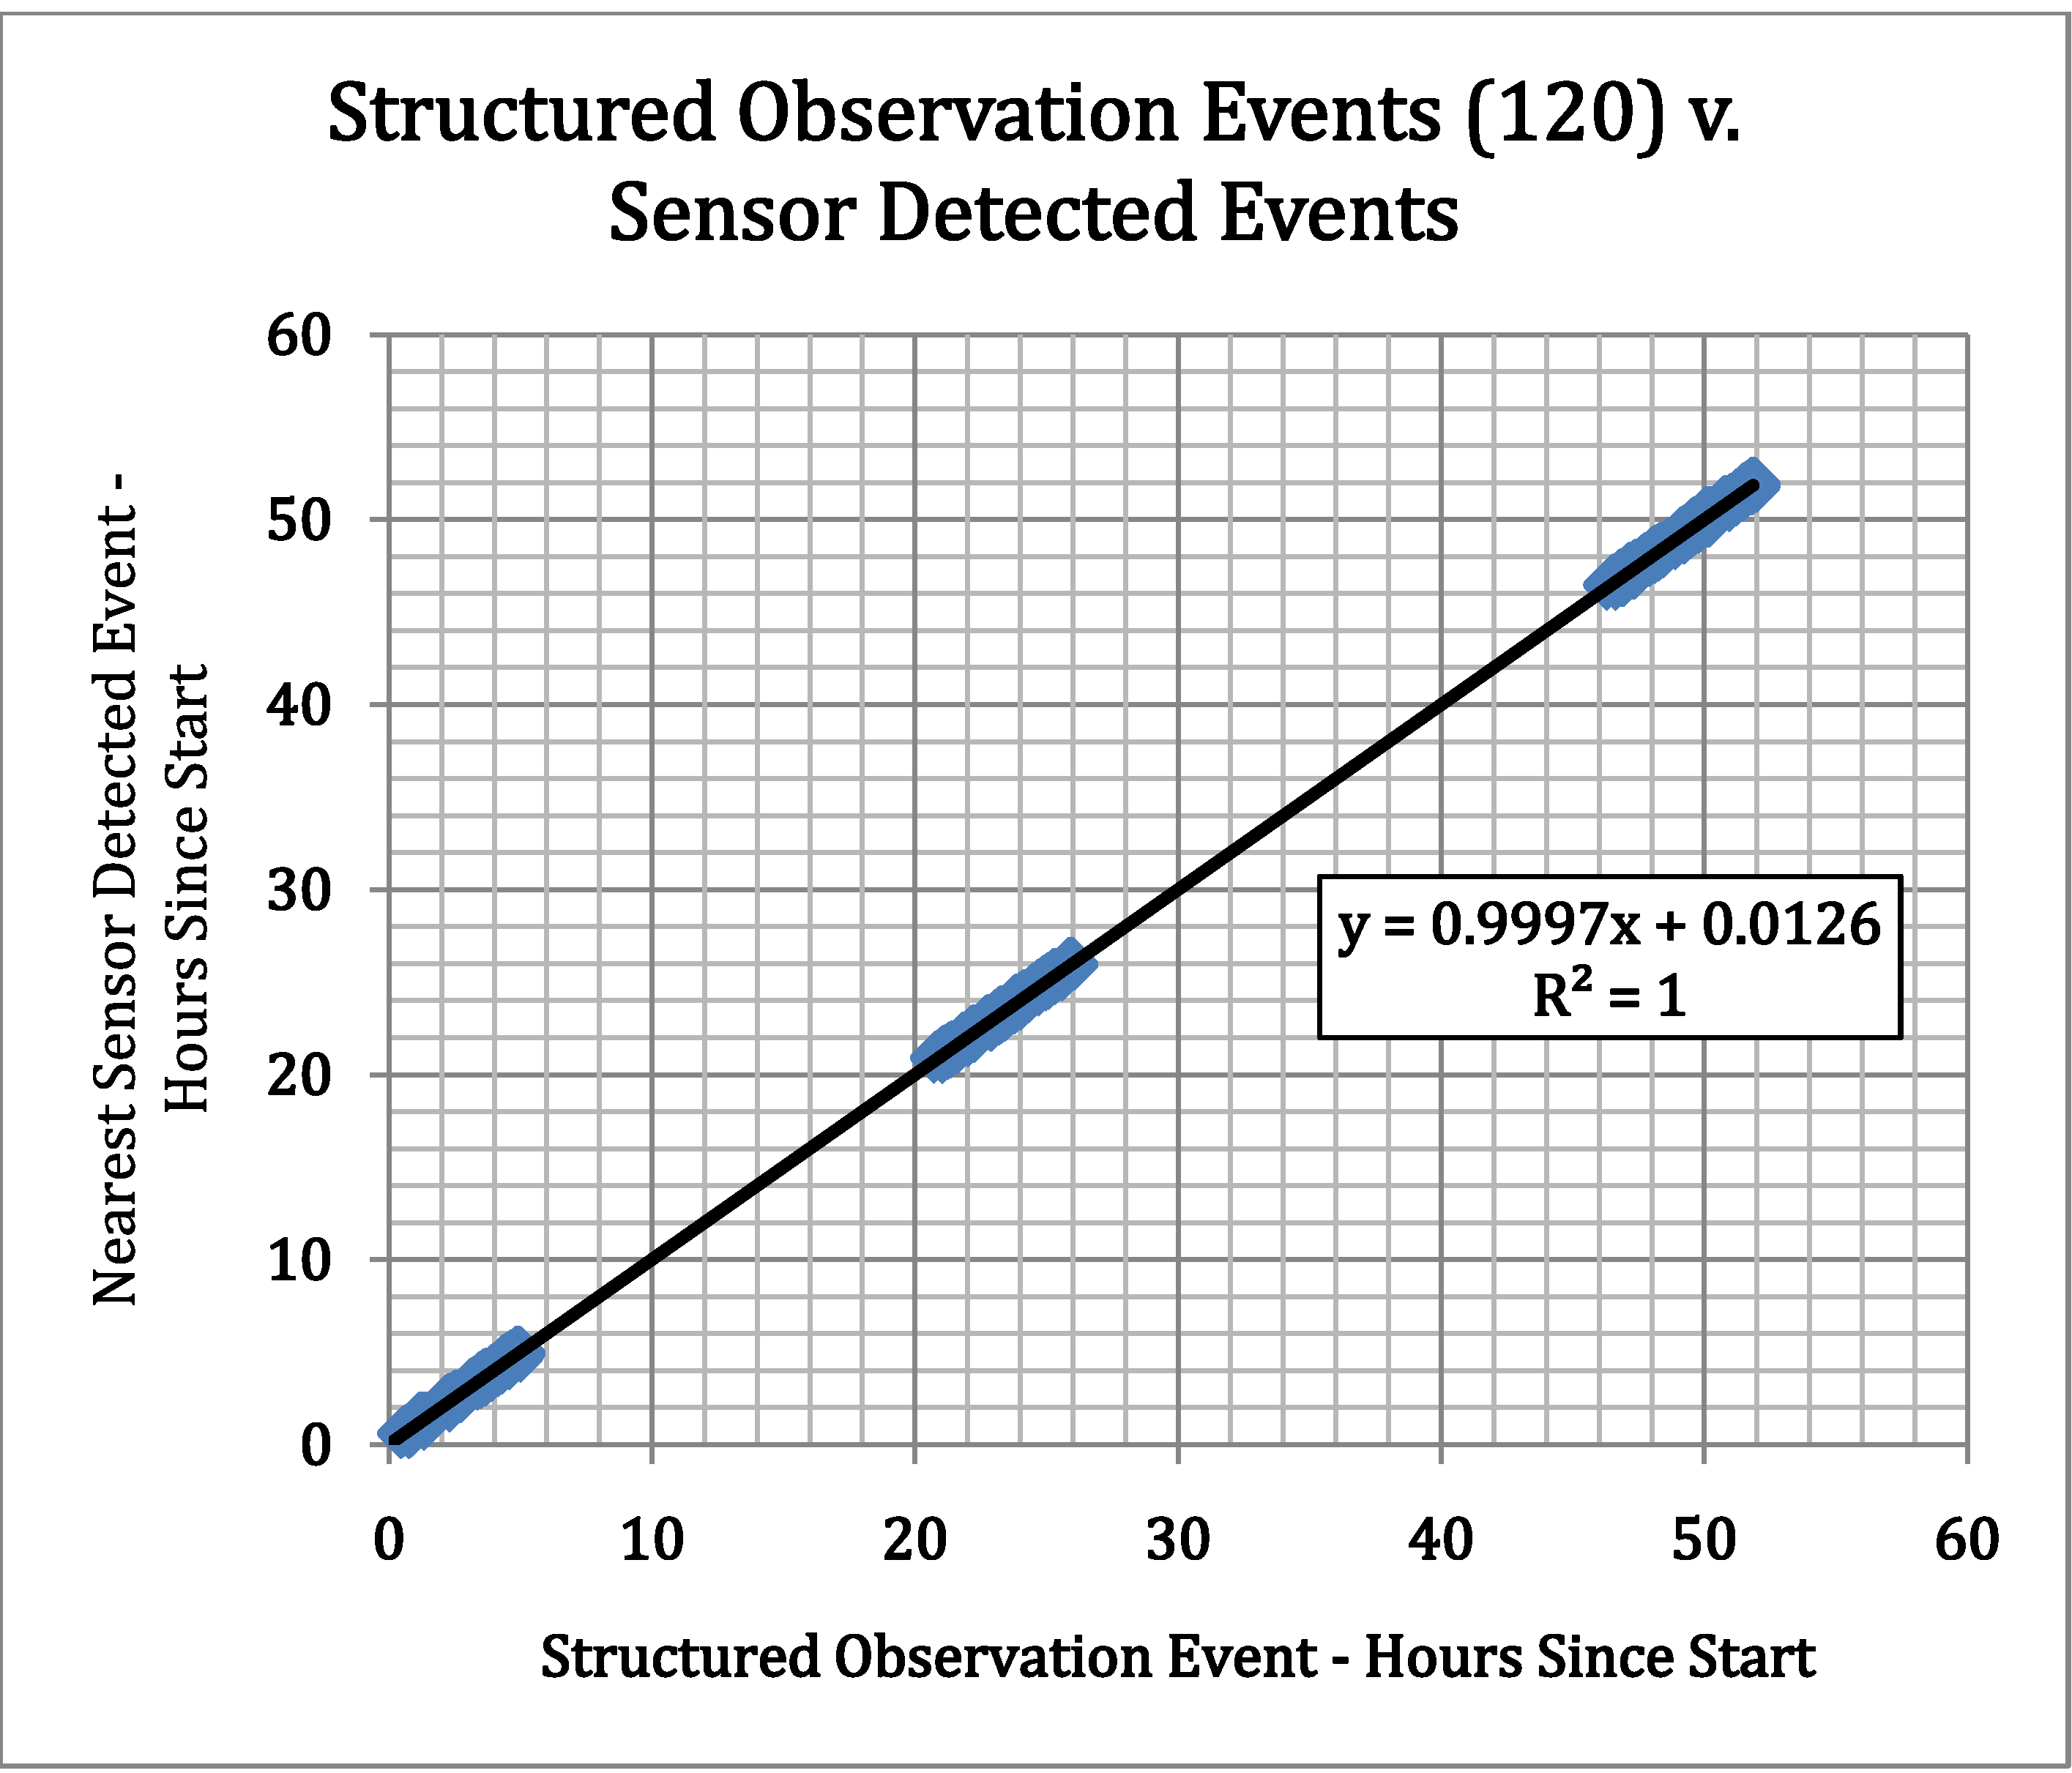
Field validation is performed using structured observations where a household that verbally consents to having a monitoring device and observers in their home is studied for one day. The duration of the observation (hours) depends on the application to acquire enough data to compare structured observations to sensor data. The signal algorithm may be adjusted towards greater correlation to field data in some cases, for example when field data more closely approximates typical use of interest. It is presumed that structured observations need only be conducted each time usage behavior is presumed to be significantly different than previously validated environments. Structured observations are governed by ethic committee approved procedures (Portland State University in most cases thus far, Human Subjects Research Review Committee Proposal #11853).
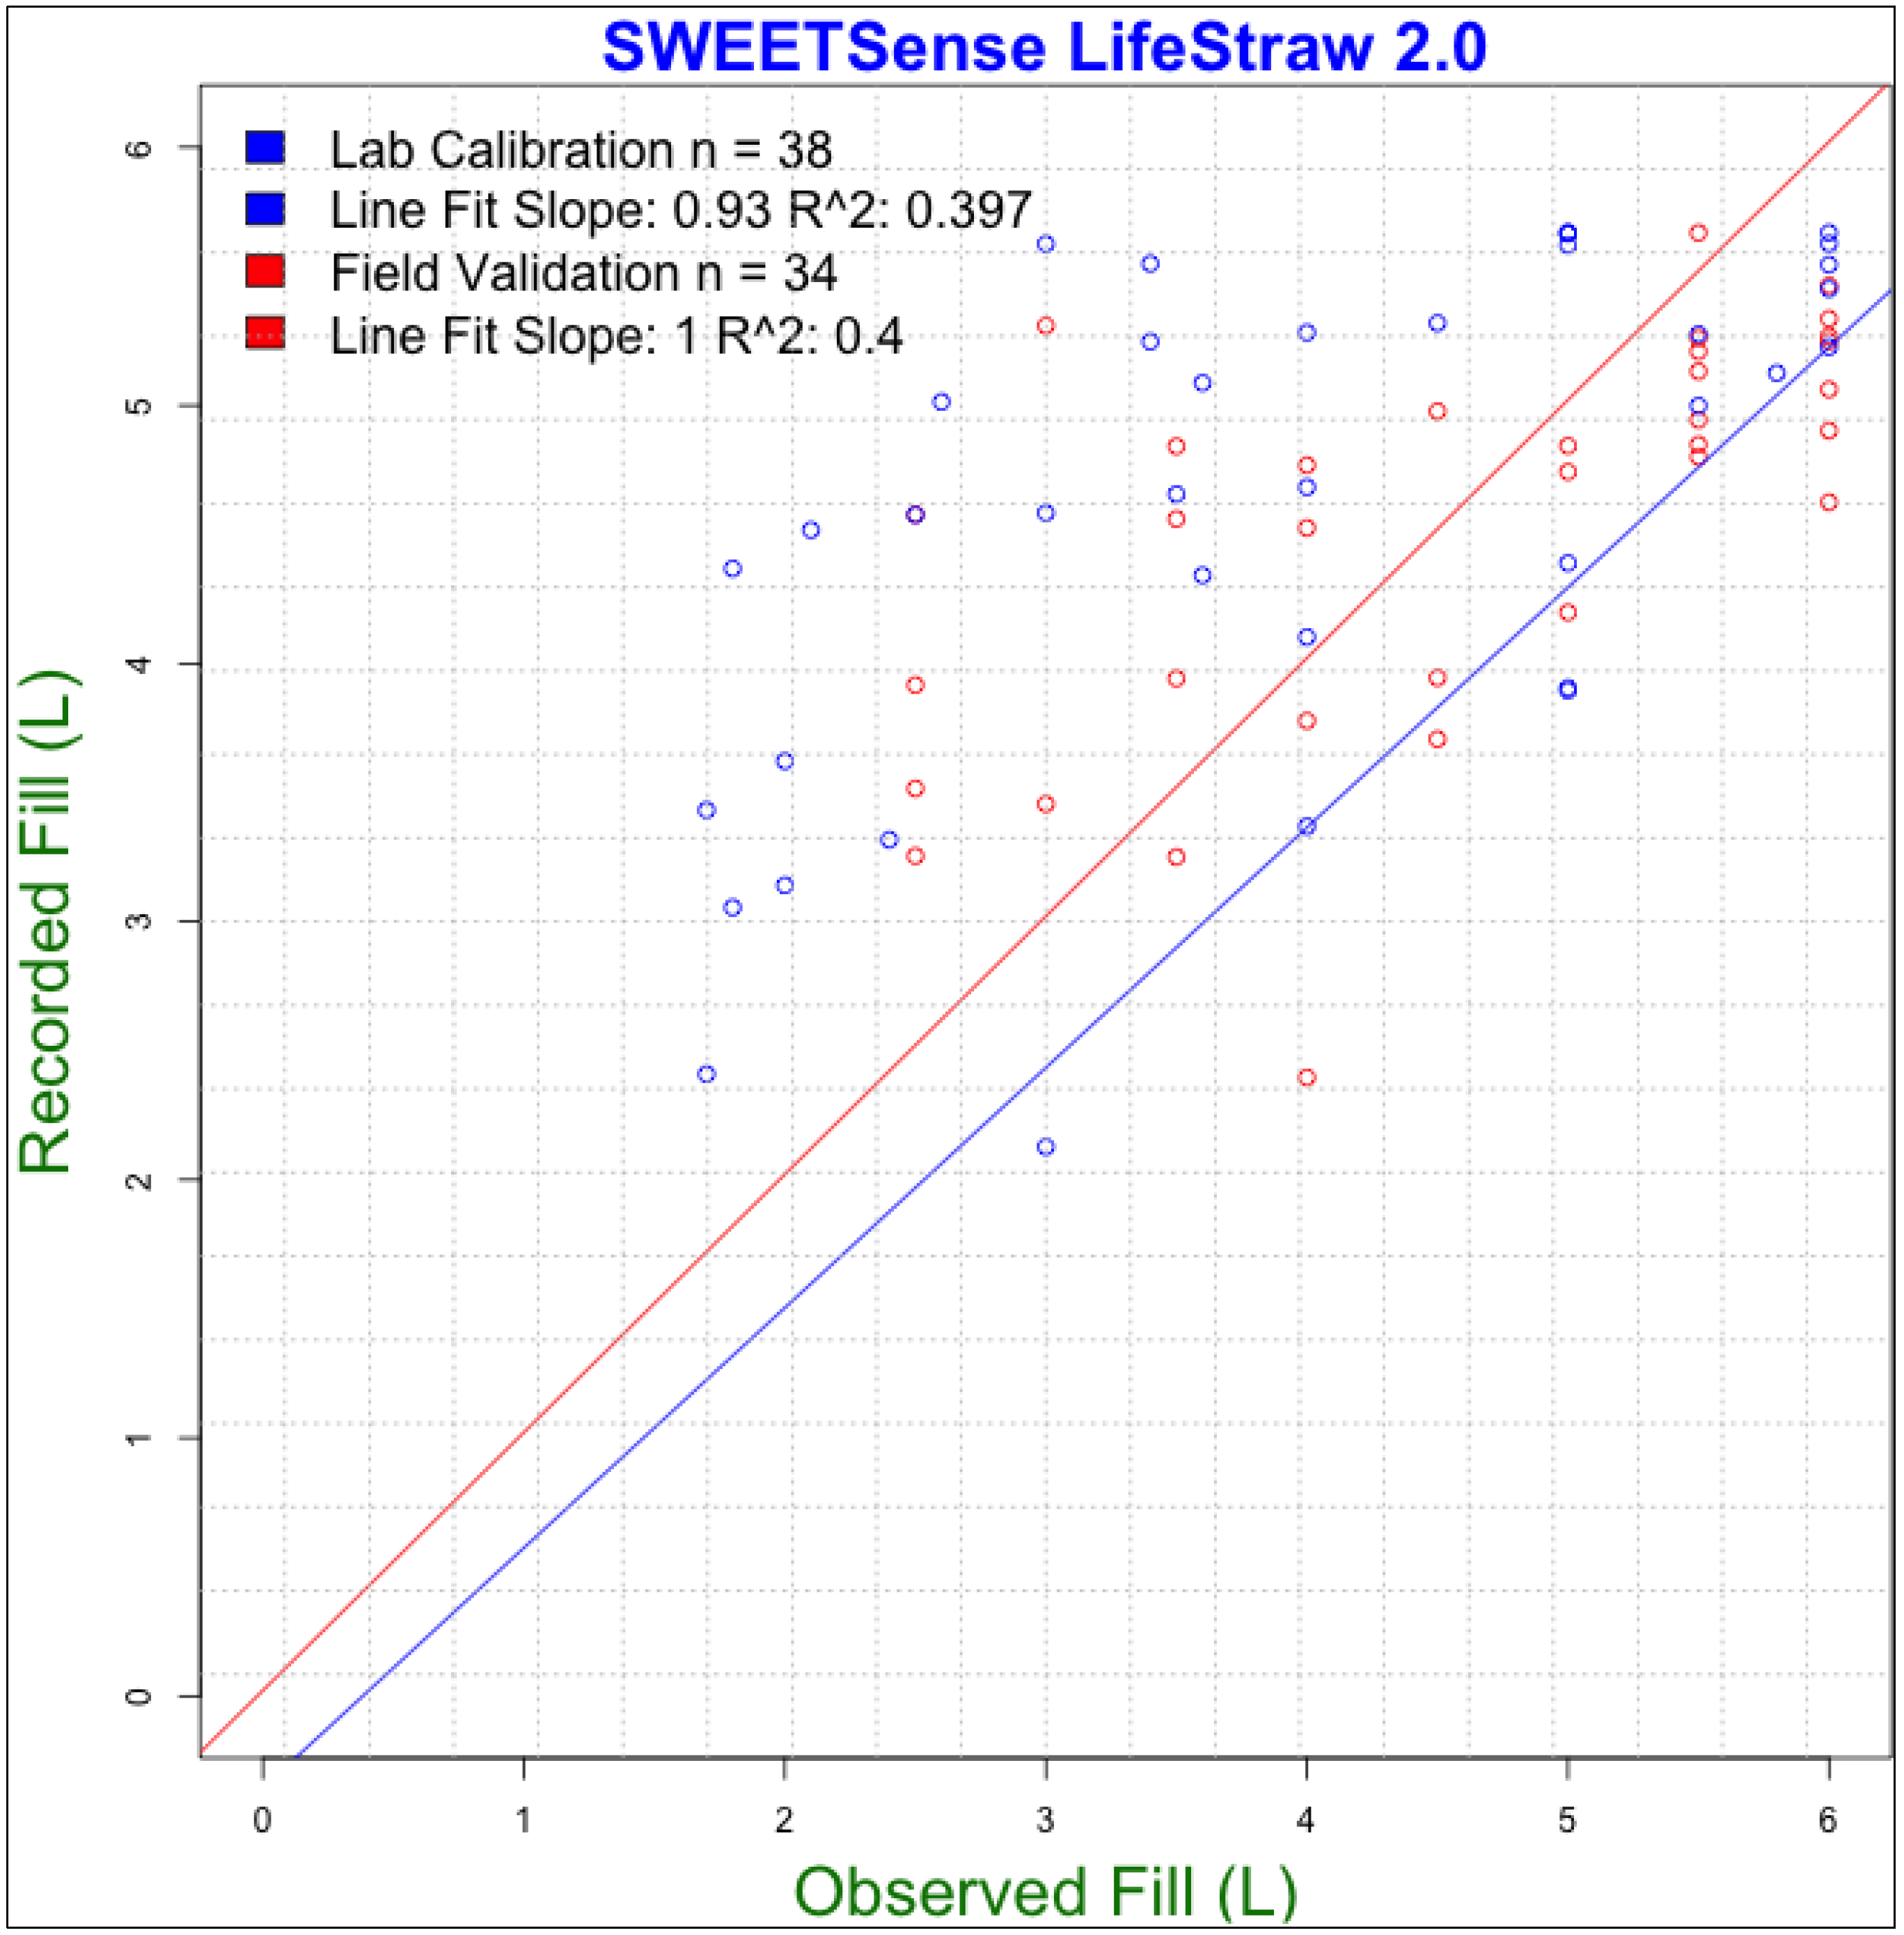
Two examples of this analysis technique are presented here for illustration, the handpump and the household water filter. The household water filter sensor, on the Vestergaard Frandsen LifeStraw Family 2.0, includes two 1-psi pressure transducers, as shown in Figure 2. One mounted at the base of the six-liter input bucket, and one in the base of the six-liter storage bucket. Sensor logging is started when a change in water level is detected, as well as during the gravity driven treatment process. On the handpump, deployed on both the India Mark 2 pump and the AfriDev models, a 1-psi pressure transducer is mounted in the base of the pump head, detecting water that is lifted through the pipe and flows into the outlet tap.
To validate the water filter sensors, five sensor equipped Vestergaard Frandsen LifeStraw Family 2.0 water filters were deployed in a rural village in Western Province, Rwanda. The instrumented filters were in each household for one day with same-day structured observations by a community health worker. Each observation was approximately ten hours in duration, five hours in the morning and five hours in the evening. The observer recorded which instrumented filter was being observed, when water was added or taken out of the filter, the volume of water added/removed, and each time the filter was backwashed. To validate the community hand pump sensors, an AfriDev hand pump was sensor equipped to a pump in urban Rwanda. An observer then recorded when the pump was used over a period of a few hours. Structured observations were conducted using the smartphone application doForms [18] where the observer was prompted to select the type of observation and any other supporting information (i.e., in the case of the water filter—automatically scanned barcodes of the sensor and how much water was filtered). Additionally the use of the smartphone application for the structured observation allowed for automatic logging of the date and time. This is important as manually recording time can lead to discrete data [4] that will not perfectly correlate to sensor data. Structured observation and sensor data were aggregated by R polling the DoForms and MySQL databases, and correlated based on the barcode of the sensor observed and the timestamps of each observed event and each sensor-detected event.
In analysis, an online based R script is applied to the raw data. The web-based raw data is polled based on the sensor ID selected. Timestamps and data type are then identified and parsed. Events and usage are then identified from the parsed data.
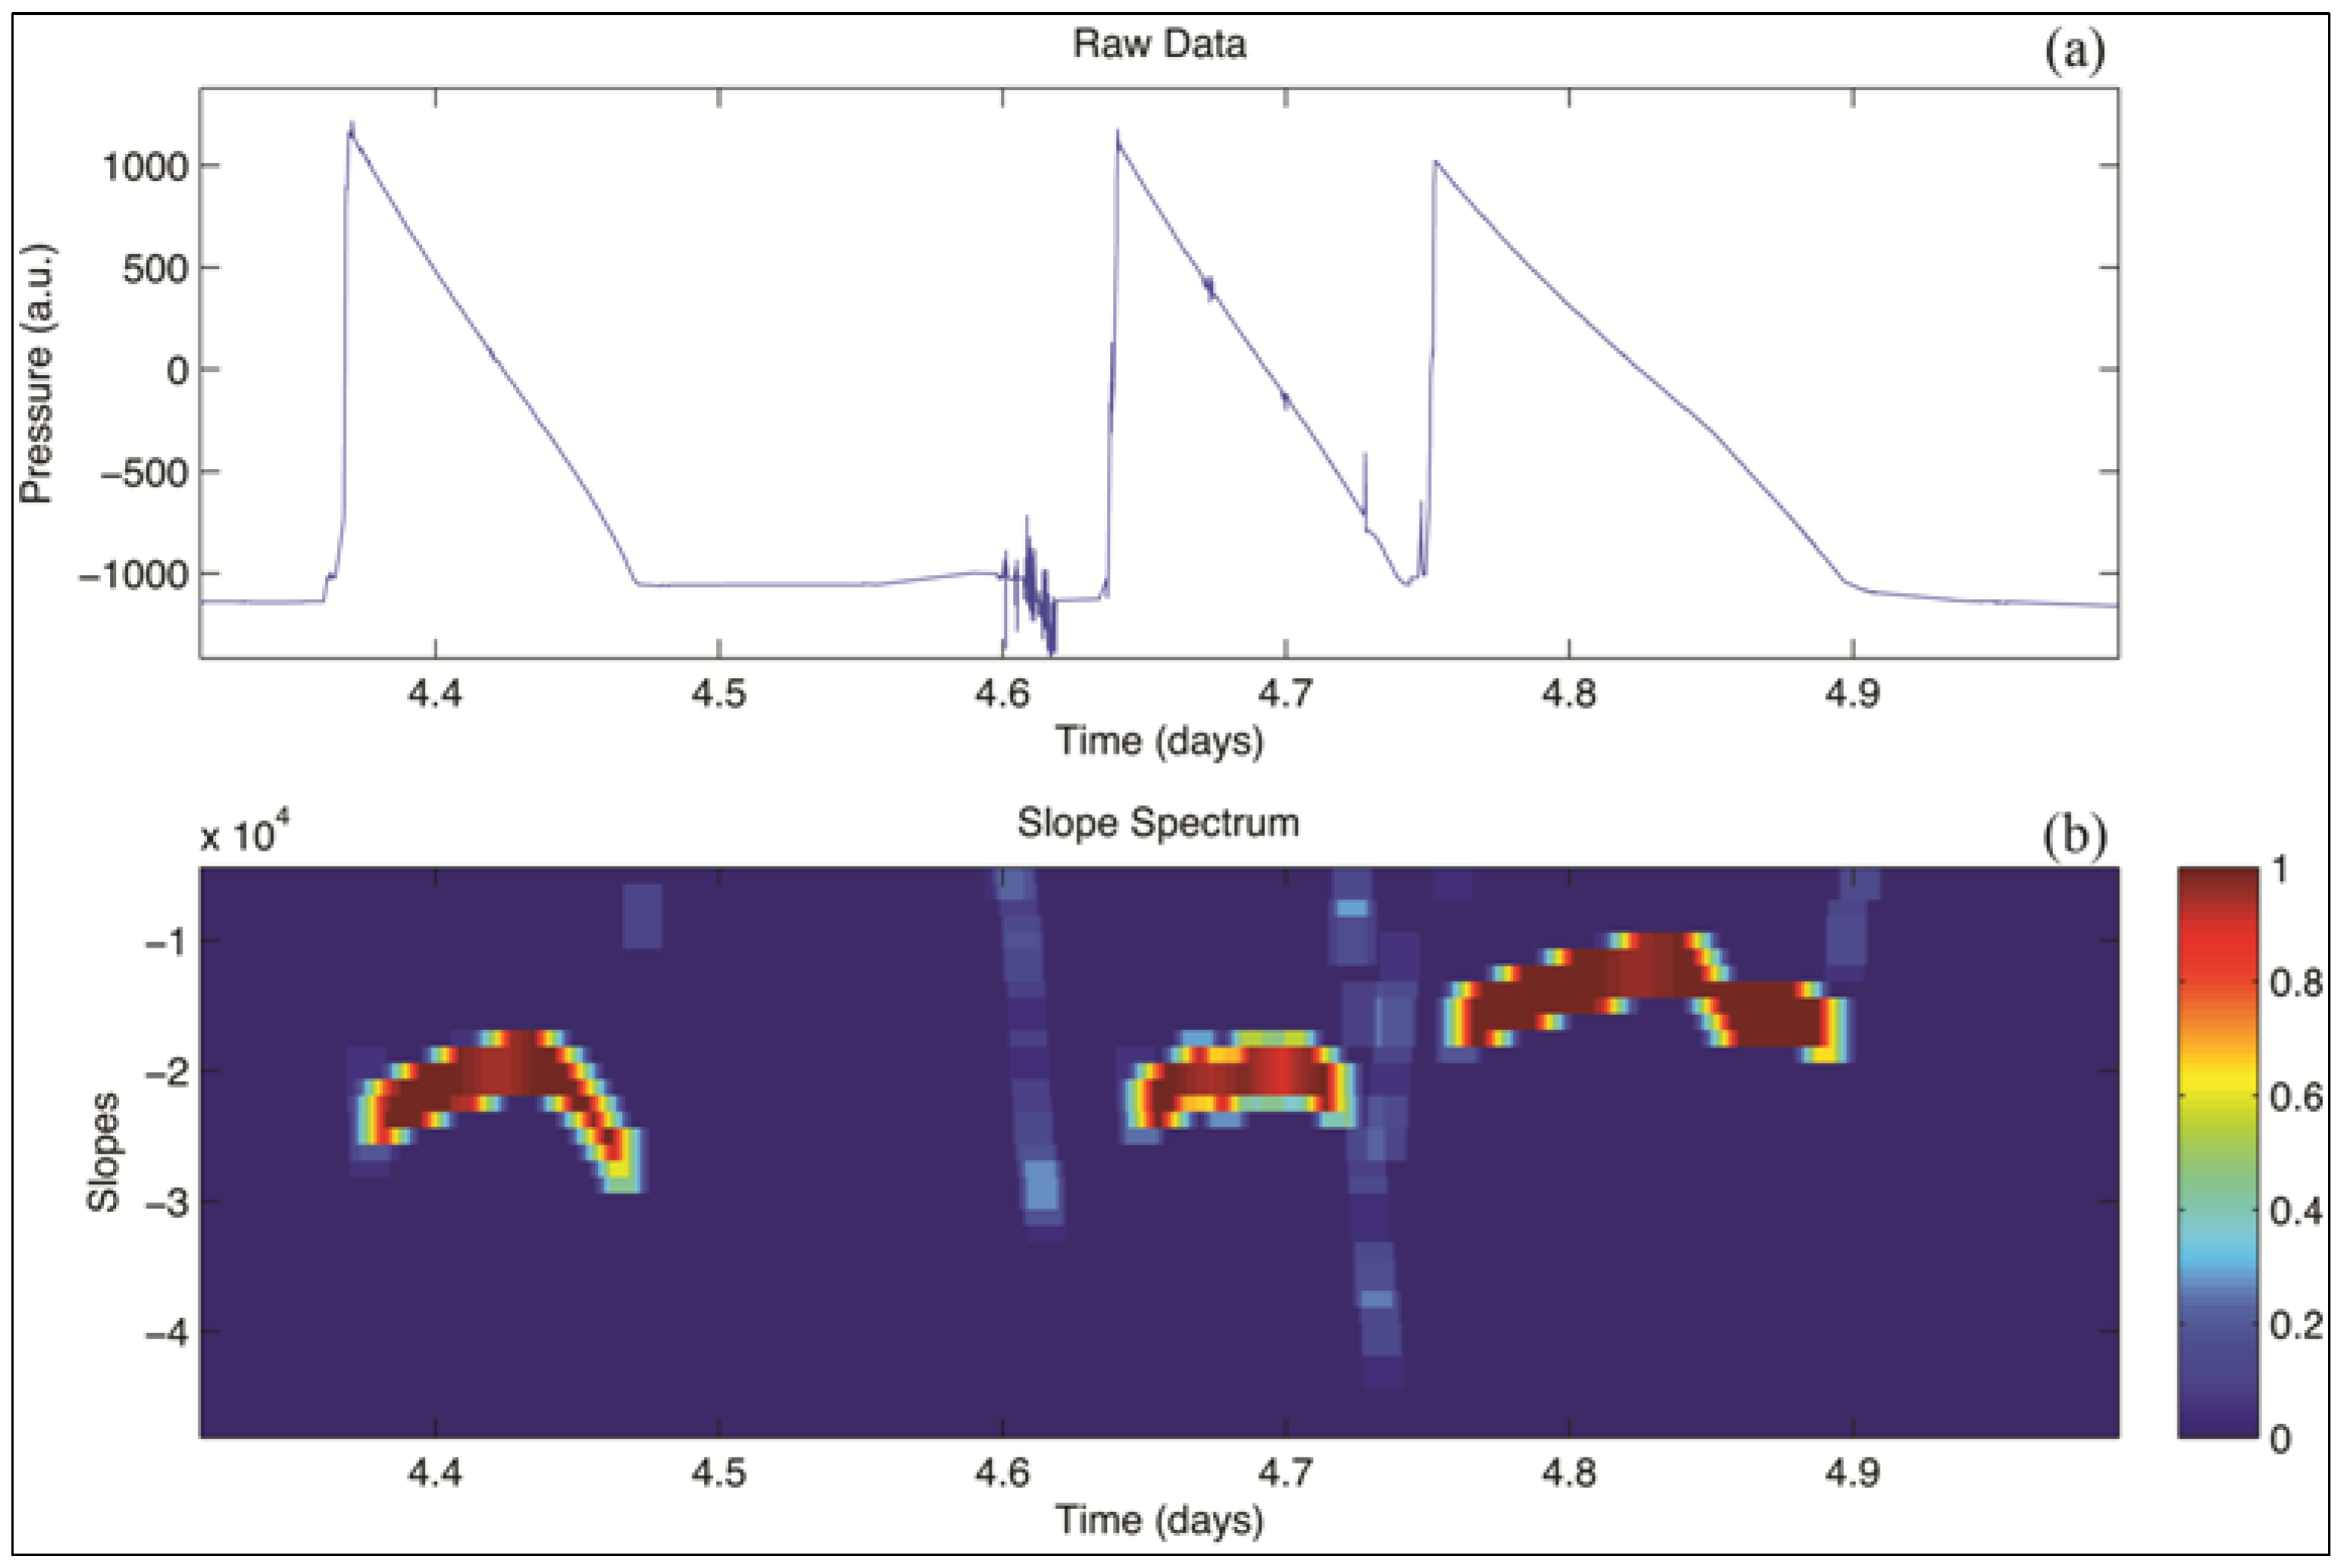
In the case of the LifeStraw, the events are indicated by regions of near-constant slope in the raw data as shown in Figure 4a. These regions correspond to the linear decrease in pressure associated with the draining top reservoir of the LifeStraw as water is filtered. To accurately detect these events it is necessary to robustly estimate the slope of the non-uniformly sampled raw data. This is accomplished using a sliding window linear fit technique. The slope and residual error are calculated for a sliding window of length 20 min at one-minute intervals. In this manner a slope signal, s[n], and an error signal, e[n], are calculated on a uniform time grid n to facilitate standard signal processing methods. The error for each linear fit is normalized by the Euclidean norm of the raw data used for that fit. This normalization ensures that the maximum error is one and that zero error indicates perfectly collinear data. For a linear fit to be used, two requirements are placed on each window to ensure quality of fit; a minimum of 1/3 samples per minute are required (corresponding to seven samples per 20 min window) and at least one raw data point is required in each third of the window to verify the raw data is spread evenly across the window. After calculating the uniformly sampled slope and error from the raw data, LifeStraw uses are determined by identifying regions with low error and near-constant slope within a specified slope range. This is accomplished by calculating a slope spectrum for each raw dataset.
The slope spectrum is a novel tool developed to visualize the slope as a function of time, analogous to the spectrogram for frequency data. The first step in constructing the slope spectrum for this type of noisy raw data is to create binary masks for each slope bin, or range, indicating the time indices when the slope signal is within that bin. These signals are defined for each bin as
Sustainability 05 03288 i001
where Sustainability 05 03288 i004 is the binary mask of the slope signal, s[n], for bin m. These masks are then weighted by the error, e[n], and convolved with a moving averager, h[n]. The length of the averager is chosen to be equal to that of the time window used for slope estimation. The slope spectrum is then defined as
Sustainability 05 03288 i002
and will contain values between zero and one. An example of a slope spectrum and the corresponding raw data are shown in Figure 4.
Figure 4. Example data set from household water filter sensor. Example of a section of raw data (a) and the corresponding slope spectrum (b). The raw pressure data shows three typical usage “events” wherein water is added to the input bucket (vertical line) and then is slowly filtered out (sloped line). The units are in raw analog-to-digital, later converted to liters of water volume.
Sustainability 05 03288 g004
The individual uses of the LifeStraw are detected from the slope spectrum by taking the maximum of each column of S[m,n] and identifying when the resulting signal is above a specified threshold, 0.5 in this case. The resulting binary signal is defined as
Sustainability 05 03288 i003
The rises and falls of x[n] correspond to the start and stop times of each use of the LifeStraw. These are identified using a first difference filter and need to be padded by a time equal to the threshold multiplied by the window length, 10 min in this work.
The identified start and stop times of each use of the LifeStraw are then cross referenced against the data normalized from 0 to 6 liters. The value at stop time is subtracted from the value at start time to produce an estimate of the amount of water filtered during this event. These values are calibrated against both lab validation and field verification observations and then applied to all sensors of the same type—while the capability exists to tune each sensor individually, the data presented here is a design-level calibration then applied to all unique deployments.

3. Results and Discussion

Overall, the sensor algorithm agreed with the laboratory and field trials and was internally consistent between sensors. For the water filter, the total average error was approximately 17.24% over-reporting of water volume in the laboratory calibration, and under-reporting by 0.47% in the observations. The results of the laboratory and structured observation verification are presented in Table 1 and Figure 5. In both the laboratory and field verification, operational judgment was used to eliminate some samples that appeared to have obvious enumerator/tester errors or when sensors did not report data on the periodic schedule, indicating missing data sets. These adjustments are discussed later.
Figure 5. Field and lab verification of household water filter sensor. The lab validation algorithm results in a linear slope r-squared value of 0.93. The same algorithm is applied to the structured observation which are aggregated for three sensors across 5 days of observations in 25 homes.
Sustainability 05 03288 g005
Table 1. Household water filter sensor Lab verification and field validation results. Shown are the number of observations considered in the algorithm for each environment (lab versus field); the slope of a linear fit; the R-squared value of the linear fit; the mean absolute error per event, i.e., both over and under reporting; the mean biased error, i.e., the mean error either over or under; and the total error across all observations.
Lab VerificationField Validation
n 3834
Slope0.931.00
R-squared0.3970.4
Mean Absolute Error 38.57%20.28%
Mean Biased Error 29.76%5.00%
Total Error 17.24%-0.47%
A similar analysis was conducted with the hand-pump application. In the case of the laboratory verification for the handpump, two complementary comparisons were made. First, each sensor-detected event is compared against the temporally nearest experimentally-logged event, allowing for an evaluation of error associated with over-reporting events, or false positives. The converse is then applied, comparing each experimentally recorded event against a sensor-event, indicating error associated with under-reporting, or false negatives. An analysis shows near perfect agreement between the experimental and sensor-detected events, with one exception of an over-report that was likely associated with out-of-test use of the pump. The complementary analysis of sensor-events against nearest experimental event, indicating prevalence of over-reports or false positives, shows a r-squared value of 1, indicating agreement.
This same analysis, using the identical signal-processing algorithm, was then applied to a sensor deployed in Rwanda. One hundred and twenty observations were made over three days, and in this case no observations were discounted. The results are shown in Figure 6, that again indicates near agreement between observed events and detected events.
Each sensor design is separately validated in laboratory and field-testing, and the resultant signal processing algorithm applied across all deployments of the same sensor type. Through this method, the handpump and household water filter designs have close agreement to laboratory and field observations, while additional accuracy, if desired, can be gained through individual sensor calibration. A significant challenge inherent in the sensor validation is associated with operator and observer error. Estimating water volume added/removed in a filter or what precisely constitutes a use of a handpump is challenging, even when data entry is accurate.
In the case of the water filter analysis, errors included laboratory events where water was splashed out of the bucket, or a valve was not properly closed. Because the laboratory validation is used as the calibration data set, these adjustments do not propagate any favorable impact on the field analysis. In the field observations, samples that were taken during periods when the sensor did not report data on the schedule period, indicating a cellular connectivity issue, the observed samples were discounted. The sensors used for this validation were of a slightly older build, which did not include the SD card on-board backup feature currently on all subsequent boards that accounts for cellular conductivity risk.
Figure 6. Pump structured observation events versus sensor-detected events over 3 days. X-axis shows the time, in hours, since observations were started, and on the Y-axis the time of the nearest detected event by the sensor. Results indicate that for 120 observations, there is near perfect agreement between the observed event and the sensor detected event.
Sustainability 05 03288 g006
There were a total of 34 observations of LifeStraw Family water adding behavior that occurred during the structured observation period and for which sensor data was reported, across 5 sensors for 5 days in a total of 25 households. These observations excluded a number of observations that correlated to periods of missing or corrupted sensor data, and two associated with non representative use (0.5 and 1.5 liters added). In the case of the laboratory trials, a number of observations were combined, as the operator input smaller volumes in close temporal proximity to one another, in a manner inconsistent with observations and training in the field. The algorithm was biased towards the field observations and reported a higher error for the lab validation, likely due to the smaller test volumes used that are not representative of typical field behavior.
There are also several sources of improvement required in subsequent designs. The most important is the periodic loss of data associated with poor cellular network coverage, or corrupted data associated with a damaged sensor board, often associated with a floating A/D chip. In these and other cases, the signal processing algorithm is designed to identify lost (by timestamp) or corrupted data (by algorithm) and to not consider it in the analysis.

4. Conclusions

This paper discusses the development and validation of fully integrated data acquisition system designed for application in international development programs, including household water filters and community water pumps. The technology has been demonstrated to provide high quality data remotely, and to closely track behavior that is otherwise difficult to evaluate through surveys and observations.
Remote monitoring systems are an innovative method to ensure the success of poverty reduction interventions, like water filters, water pumps, cookstoves, latrines and similar. Rather than infrequent data collection, remote monitoring systems may improve community partnerships through continuous engagement and improved responsiveness. This approach seeks to raise the quality and accountability of these projects internationally by separating success from propaganda. Additionally, by providing monitored data on the appropriateness and success of pilot programs, business investors can make informed decisions. These targeted customers are the end-users, but not the end-beneficiaries. The primary beneficiaries are ultimately residents in developing communities who are the targets of international development sector interventions.
In later studies, usage and performance data will be recorded to gain insight into the operational effectiveness of the examined interventions. Additionally, secondary data specific to users of the system, such as water treatment and cooking habits, number of people in the family and economic status will be collected to gain additional insight into the performance and usage data. Monitoring data will be disseminated to partner organizations and their response to the monitoring data will be analyzed through qualitative interviews.

Acknowledgments

The authors recognize the significant collaborations in this on-going program, including students and staff at Portland State University and Stevens Water, partners including Mercy Corps, Lemelson Foundation, DelAgua Health, Vestergaard Frandsen, EcoZoom, Berkeley Air Monitoring Group, London School of Hygiene and Tropical Medicine, Texas A&M, Water for People, Living Water International, Cascade Designs and others. Funding has been provided by several grants and commercial partnerships, sources include Mercy Corps, the Lemelson Foundation, the State of Oregon through Oregon BEST, DelAgua Health and Portland State University.

Conflict of Interest

The authors have interest in this technology academically and through commercialization. These interests are not in conflict with the description of effort or results.

References

  1. UNICEF, Pneumonia and Diarrhea: Tackling the Deadliest Diseases for the World’s Poorest Children; UNICEF Report; UNICEF: New York, NY, USA, 2012.
  2. Stanton, B.; Clemens, J.D.; Aziz, K.M.A.; Rahman, M. Twenty-four hour recall, knowledge-attitude-practice questionaires, and direct observations of sanitaty practices: A comparitive study. Bull. WHO 1987, 65, 217–222. [Google Scholar]
  3. Manun’Ebo, M.; Cousens, S.; Haggerty, P.; Kalengaie, M.; Ashworth, A.; Kirkwood, B. Measuring hygiene practices: A comparison of questionnaires with direct observations in rural Zaïre. Trop. Med. Int. Health 1997, 2, 1015–1021. [Google Scholar]
  4. Clasen, T.; Fabini, D.; Boisson, S.; Taneja, J.; Song, J.; Aichinger, E.; Bui, A.; Dadashi, S.; Schmidt, W.; Burt, Z.; et al. Making sanitation count: Developing and testing a device for assessing latrine use in low-income settings. Environ. Sci. Technol. 2012, 46, 3295–3303. [Google Scholar] [CrossRef]
  5. Zwane, A.; Zinman, J.; Dusen, E.; Pariente, W.; Null, C.; Miguel, E.; Kremer, M.; Karlan, D.; Hornbeck, R.; Gine, X.; et al. Being surveyed can change later behavior and related parameter estimates. Proc. Natl. Acad. Sci. USA 2011, 108, 1821–1826. [Google Scholar] [CrossRef]
  6. Wood, L.; Egger, M.; Gluud, L.L.; Schulz, K.F.; Juni, P.; Altman, D.G.; Gluud, C.; Martin, R.M.; Wood, A.J.G.; Sterne, J.A.C. Empirical evidence of bias in treatment effect estimates in controlled trials with different interventions and outcomes: Meta-epidemiological study. BMJ 2008, 336, 601. [Google Scholar] [CrossRef]
  7. Schmidt, W.; Cairncross, S. Household water treatment in poor populations: Is there enough evidence for scaling up now? Environ. Sci. Technol. 2009, 43, 986–992. [Google Scholar] [CrossRef]
  8. Roden, C.A.; Bond, T.C.; Conway, S.; Pinel, A.; MacCarty, N.; Still, D. Laboratory and field investigations of particulate and carbon monoxide emissions from traditional and improved cookstoves. Atmosp. Environ. 2009, 43, 1170–1181. [Google Scholar] [CrossRef]
  9. Thomas, E.; Zumr, Z.; Barstow, C.; Linden, K. Proving Sustainability: The International Development Monitoring Initiative. In Proceedings of the IEEE Global Health and Technology Conference, Seattle, WA, USA, 30 October 2011.
  10. Chowdhury, Z.; Edwards, R.; Johnson, M.; Shields, K.; Allen, T.; Zanuz, E.; Smith, K. An inexpensive light-scattering particle monitor: Field validation. J. Enviorn. Monit. 2007, 9, 1099–1106. [Google Scholar] [CrossRef]
  11. Mercado, I. Temperature dataloggers as stove use monitors (SUMs): Field methods and signal analysis. Biomass Bioenergy 2012, 47, 459–468. [Google Scholar] [CrossRef]
  12. Thomson, P.; Hope, R.; Foster, T. GSM-enabled remote monitoring of rural handpumps: A proof of concept study. J. Hydroinformatics 2012. [Google Scholar] [CrossRef]
  13. Morreale, P.; Qui, F.; Croft, P. A green wireless sensor network for environmental monitoring and risk identification. Int. J. Sens. Netw. 2011, 10, 73–82. [Google Scholar] [CrossRef]
  14. Jaggi, N.; Koushik, K. Multi-sensor activation for temporally correlated event monitoring with renewable energy sources. Int. J. Sens. Netw. 2011, 10, 42–58. [Google Scholar] [CrossRef]
  15. Kafetzoglou, S.; Papavassiliou, S. Energy-efficient framework for data gathering in wireless sensor networks via the combination of sleeping MAC and data aggregation strategies. Int. J. Sens. Netw. 2011, 10, 3–13. [Google Scholar] [CrossRef]
  16. Portland State University. SweetData. Available online: http://www.sweetdata.org (accessed on 30 July 2013).
  17. Institute for Statistics and Mathematics. Available online: http://www.r-project.org (accessed on 30 July 2013).
  18. DoForms. Available online: http://www.doforms.com (accessed on 30 July 2013).

