1. Introduction
Fossil fuel electricity generation accounts for more than 40% of global CO
2 emissions [
1]. Therefore, the electricity generation industry clearly plays a critical role in reducing global CO
2 emissions. In this regard, it is meaningful to benchmark energy efficiency with CO
2 emissions of electricity generation not only for reducing carbon regulation risks but also for increasing the companies’ climate change competitiveness in the near future. Therefore, there is an urgent need for a better understanding of energy efficiency of the fossil fuel power industry.
This is the case even for northeast Asia. China and Korea are two of the largest CO
2 emitters in the world. In fact, Korea ranked seventh in the world in 2011 in terms of total CO
2 emissions. Among the OECD (Organization for Economic Co-operation and Development) countries, Korea has shown the highest CO
2 emissions growth rate since 1990 [
2]. To handle this issue, the Korean government announced its “low carbon/green growth” policy in 2008 and passed a law mandating a reduction in national CO
2 emissions by 30% below business as usual (BAU) in 2020. Since then, the Korean government has proposed some policy initiatives for reducing energy use and CO
2 emissions. In 2010, it assigned greenhouse gas (GHG) emission reduction targets for 470 firms in various industries, and they have introduced emission target management systems.
In particular, the electricity generation industry accounts for more than one third of Korea’s total CO
2 emissions because fossil fuel power plants dominate electricity generation in the country [
3]. In Korea, fossil fuel power plants have been under considerable pressure to reduce CO
2 emissions, and therefore it would be useful to examine the energy and CO
2 emission performance of fossil fuel electricity generation in the country. Thus, the aim of this paper is to benchmark the energy efficiency for Korean power companies. The research question of this study is “Did the GHG emission regulations in Korea improve the power companies’ energy efficiency?”
To answer this question, we should calculate the energy efficiency of Korean power companies. The main methodology to compute energy efficiency is the sequential slacks-based measure approach. The contributions of this research can be divided into two sections: empirically, we first conduct a comparative study on energy efficiency for Korean power industries by using unique firm-level data. Methodologically, we present a relatively new application by incorporating the concepts of sequential environmental technology and the slacks-based measure.
The rest of this paper is organized as follows:
Section 2 presents a literature review for energy efficiency analysis based on Data Envelopment Analysis (DEA).
Section 3 describes the methodology.
Section 4 empirically estimates the energy efficiency with greenhouse gas (GHG) emission of power companies in Korea and presents the results, and
Section 5 concludes.
2. Literature Review
Because energy efficiency is a relative concept, it has been defined in various ways. Three indicators are commonly used to measure it; namely, thermodynamic, physical-based, and monetary-based indicators. The latter refers to the energy requirement per currency output unit (e.g., per unit US dollar output). Additionally, monetary-based and physical-based indicators are frequently employed at the macro-level, for instance, when writing regional or area energy policies [
4]. Owing to growing concerns regarding global climate change due to carbon emissions associated with energy use worldwide, several indicators, including energy intensity (energy/GDP), carbon intensity (carbon/GDP) and the carbon factor (carbon/energy), have been extensively used for the monitoring or tracking of regional performance in terms of energy efficiency and CO
2 emissions over time [
5]. Despite the utility of these indicators, each of them can be viewed as only a partial measurement with partial information provided. Because economic production activity is a joint process, it utilizes energy and other non-energy inputs such as labor and capital to produce desirable economic outputs, along with the simultaneous emission of pollutants. Therefore, energy input on its own cannot produce any one output in the production process [
6]. Thus, it is necessary to use a multiple-factor model to assess correctly the aggregated efficiency of energy usage and environmental impact. Data envelopment analysis (DEA) has recently enjoyed great popularity in measuring energy and environmental efficiency, as it can provide a synthetic energy and environmental performance index with multiple inputs and outputs. To take into account the growing concern regarding environmental impacts owing to energy-related emissions, undesirable outputs can suitably be incorporated into the environmental DEA framework. The relevant literature review in this section is focused on the DEA approach, since other approaches are minor or insignificant in dealing with energy efficiency in the literature.
Charnes
et al. [
7] first proposed the original Data Envelopment Analysis (CCR-DEA). It is a nonparametric approach and measures relative efficiency of decision-making units (DMUs) by comparing multiple inputs with a single output. Later, Banker
et al. [
8] extended it to the Variable Return to Scale DEA (BCC-DEA) model. The DEA is used to identify best practice within the set of comparable decision-making units (DMUs) and form an efficient frontier. The CCR model is appropriately described as providing a radial projection. Specifically, each input is reduced by the same proportionality. The DEA model has been gaining great popularity in various industry sectors such as in the energy field [
6]; banks or financial institutions [
9] and transportation [
10]. The progress in DEA in the past 30 years is well reviewed by [
11].
Hu and Wang [
6] suggest that an energy efficiency index based on data envelopment analysis (DEA) is preferable over the commonly used index because it provides a total-factor energy efficiency measurement. The DEA model has been widely used in energy efficiency measurements at the firm-level [
12], regional level [
13] and country level [
14]. However, neglecting to address undesirable outputs in the fuel combustion process, the results may not prove effective in assessing environmental-friendly energy efficiency. To take into account the growing concern regarding environmental impacts, undesirable outputs of emission should be incorporated into the environmental DEA framework. Generally, these environmental DEA approaches can be divided into four groups. In the first method, undesirable output is treated as another input into the traditional DEA, assuming that they have the same negative characteristics. Shi
et al. [
15] employed input-oriented CCR and BCC models to measure Chinese regional industrial energy efficiency from 2000–2006. Clearly, the treatment of undesirable outputs simply as inputs can incorporate pollutants into the traditional DEA. However, undesirable output is a by-product of energy usage, not an input in the production process; thus, this method is too simple to reflect the actual production activities. The second method is based on the utilization of traditional DEA models with data translation. Lovell
et al. [
16] treated undesirable outputs as normal outputs after taking their reciprocals. Seiford and Zhu [
17] developed a DEA model with negative signs assigned to all undesirable outputs (each undesirable output is multiplied by “−1”) and applied a suitable transition vector by linear programming to all negative outputs into positive undesirable outputs. A weakness of this translation method is that the original data are changed in a manner that would never occur in the actual production process. Therefore, this approach cannot aptly explain actual production activities. The third method is based on the concept of weak disposability assumption in environmental DEA technology proposed by [
18] and employed by [
19,
20]. Weak disposability technology has also been of critical importance recently because of radial adjustment. The fourth method is using the directional distance function (DDF) proposed by [
21]. This approach is an alternative approach to the measurement of energy and environmental performance that can increase desirable outputs while reducing undesirable ones simultaneously. Applications of DDF for modeling environmental performance can be found in [
22,
23].
However, all these approaches to treat undesirable outputs are based on radial efficiency measures with some limitations. The radial model adjusts all undesirable outputs and inputs by the same proportion to efficient targets; thus, it does not provide information regarding the efficiency of the specific inputs such as energy efficiency [
24]. Moreover, radial efficiency measures neglect the slack variables leading to biased estimations [
25] and have a weak discriminating power for ranking and comparing decision-making units (DMUs) [
26]. Because of these limitations, some recent studies have tried to develop non-radial DEA approaches [
24,
25,
26,
27,
28].
Zhou
et al. [
29], Song
et al. [
30] and Zhang and Choi [
31] provided literature reviews on energy and environmental performance by using the DEA method. The survey results showed that among non-radial DEA approaches, the slacks-based measure (SBM) approach proposed by [
32] has gained much popularity, because it can directly accounts for input and output slacks in efficiency measurements, with the advantage of capturing the whole aspect of inefficiency. Some studies also employed SBM approach to measure energy efficiency [
33,
34,
35]. This property is particularly suitable for the reduction of undesirable outputs and energy consumption. Although current literature is progressing, the sequential technology and SBM have not been combined. The purpose of this study is to extend the SBM approach by employing the sequential environmental technology to construct a sequential slacks-based measure (SSBM).
3. Methodology
In this paper, we propose a relatively new application by combining the concept of sequential environmental technology and SBM method referred to as the sequential SBM (SSBM) model. Sequential technology has the additional advantage of reducing the well known dimensionality problem of DEA that overestimates efficiency when the number of variables is too high relative to the number of observations.
Suppose that there are
n companies and that each has three factors—inputs, good outputs, and bad outputs (pollutants)—which are denoted by three vectors:
x ∈Rm,
yg ∈Rs1 and
yb ∈Rs2, respectively. Following Tulkens and Vanden Eeckaut [
36], the sequential technology (ST) is defined as follows:
The weak disposability is usually used for handling undesirable outputs. However, it cannot estimate the environmental efficiency from the target undesirable outputs since it does not include the slack variable for undesirable outputs. Therefore, instead of assuming the weak disposability of undesirable outputs, we add the slack for undesirable outputs by using strong disposability. Equation (1) is usually estimated separately for each time
t, this often translated into wide oscillations. We use the sequential technology which means that the estimation of (1) is conducted each time including not only the current year but also all the years preceding it. The sequential technology has been used for measuring environmental performance and productivity [
37,
38], recently, Gomez-Calvet
et al. [
39] applies the sequential frontier in the SBM framework incorporating undesirable outputs which is very similar with our model. We thank one referee for telling us this point.
Based on Equation (1) and the undesirable output SBM by [
33], we propose the sequential SBM (SSBM) model with undesirable outputs as follows:
| i = 1,2…,m | Index of inputs; |
| M | Number of inputs; |
| r1 = 1,2…,S1 | Index of good (desirable) outputs; |
| r2 = 1,2…,S2 | Index of bad (undesirable) outputs; |
| S1 | Number of good (desirable) outputs; |
| S2 | Number of bad (undesirable) outputs; |
| s0− | Slack variables (potential reduction) of inputs; |
| s0g | Slack variables (potential enhancement) of good outputs; |
| s0b | Slack variables (potential enhancement) of bad outputs; |
| Subscript “0” | The DMU whose efficiency is being estimated in the model now (potential enhancement) of good outputs; |
| λ | A non-negative multiplier vector for PPS construction linear programming |
Model (2) is a non-radial, non-oriented slack-based measurement. If
Φ* = 1, indicating that all of the slack variables are 0, the DMU is efficient in the presence of undesirable outputs. However, the object model (2) is not a linear function; we can use the linear transform model suggested by [
32] to solve the problem.
Following the definition of [
6], our environmental energy efficiency (EE) can be measured using the following equation:
where
xe is the real energy input,
se− is the slack of energy, therefore the (
xe −
se−) is the target energy input.
4. Empirical Findings
We first collect the data for the inputs and outputs described in our framework. The data consist of 18 Korean power companies. We measure the output of each company in their total turnover (T). The input data include capital (K), labor (L) and energy (E). We measure the capital based on the company’s total asset. The labor is measured as number of employees. The energy is based on the fuel used by each company. The undesirable output is the greenhouse gas emissions (G). The energy use and GHG emission data are available in the Greenhouse Gas Inventory & Research Center of Korea, and capital and number of employees are collected from the annual report of each sample firm.
Table 1 shows the descriptive statistics of the data. As shown in
Table 1, both input and output data vary substantially across sample companies.
Table 1.
Descriptive statistics of inputs and outputs, 2007–2011.
Table 1.
Descriptive statistics of inputs and outputs, 2007–2011.
| Variable | Unit | N | Mean | StDev | Min | Max |
|---|
| K | 109 Won | 90 | 1935 | 2063 | 80 | 6451 |
| L | Persons | 90 | 712 | 878 | 40 | 2290 |
| E | 103 TJ | 90 | 151 | 214 | 0.4 | 655 |
| T | 109 Won | 90 | 1422 | 1745 | 4 | 5911 |
| G | 103 T | 90 | 11,318 | 16,685 | 21 | 50,995 |
The fossil fuel power industry in Korea was under large pressure to reduce GHG emissions during the research period because of government regulations. Based on Porter’s hypothesis [
40], which posits that a stricter environmental regulation implies improvements in firm efficiency for more environmentally friendly production processes, we propose the following hypothesis:
H0: The GHG emission regulation in Korea has not had any positive effect on the power companies’ energy efficiency.
The models described in
Section 3 have been applied to examine the environmental energy efficiency of Korean power companies. Clearly, the environmental energy efficiency index lie between zero and unity, and the higher the index, the better the energy efficiency is. If the index is equal to unity, then the company that is on the production technology frontier displays the best energy efficiency. With regard to basic environmental energy efficiency, the results demonstrate that most of the power companies in Korea are not performing energy-efficiently, as they employ massive carbon-based energy resources in the production process.
Table 2 shows the results for the energy efficiency index under the basic slack-based measure (SBM) model. If the basic SBM model is used, there is a great risk of dimensionality problem that is excessive estimates of efficiency when the number of variables is too high relative to the number of observations [
9], in this study, the sample size is not large enough. The sequential technology has the advantage of reducing the dimensionality problem of DEA , because it can increase the number of samples. The efficiency results of basic SBM are presented in
Table 2. The average energy efficiency value from 2007–2011 for all power companies ranges from 0.384–0.505 (average = 0.447). As Model (3) suggests, the ratio of “real energy use” over “target energy use” is 0.447, indicating that 18 companies, on average, could accomplish a 55.3% energy saving if all companies operate on the frontier of production technology. This, in turn, leads to the conclusion that Korean power companies are far from achieving an energy-efficient regime. Thus, most companies appear to have the potential to reduce their energy use and GHG emissions. One possible reason for the low value of average energy efficiency is that many power companies employ massive fossil energy resources in an inefficient way comparing to the “best practice company”. Another reason may stem from that some companies show very low energy efficiency such as “Incheon Total Energy”, that in turn leads to the low average energy efficiency. In the future study, empirical study should be conducted to analyze the determinants of energy efficiency.
Table 2.
Energy efficiency based on SBM, 2007–2011.
Table 2.
Energy efficiency based on SBM, 2007–2011.
| Company | 2007 | 2008 | 2009 | 2010 | 2011 |
|---|
| SEETEC LTD | 1.000 | 1.000 | 1.000 | 1.000 | 1.000 |
| GS Power | 0.545 | 0.498 | 0.470 | 0.530 | 0.524 |
| STX Energy | 0.329 | 0.460 | 0.419 | 0.556 | 1.000 |
| Gunjang Energy | 0.381 | 0.219 | 0.293 | 0.318 | 0.331 |
| Daejeon cogeneration Plant | 0.426 | 0.361 | 0.398 | 0.476 | 0.396 |
| Moorim power tech | 0.842 | 0.409 | 0.332 | 0.387 | 0.356 |
| ASUDI | 0.368 | 0.296 | 0.373 | 0.388 | 0.450 |
| SK E&S | 0.281 | 0.161 | 0.184 | 0.152 | 0.375 |
| Incheon Airport Energy | 0.411 | 0.291 | 0.290 | 0.271 | 0.360 |
| Incheon Total Energy | 0.078 | 0.058 | 0.077 | 0.240 | 0.340 |
| GS EPS | 1.000 | 1.000 | 1.000 | 1.000 | 1.000 |
| Posco Energy | 0.521 | 0.426 | 0.345 | 0.420 | 0.813 |
| Korea Southeast Power | 0.258 | 0.215 | 0.295 | 0.326 | 0.295 |
| Korea Southwest Power | 1.000 | 0.368 | 0.394 | 0.444 | 0.427 |
| Korea East West Power | 0.341 | 0.298 | 0.322 | 0.387 | 0.339 |
| Korea Western Power | 0.595 | 0.315 | 0.335 | 0.430 | 0.411 |
| Korea Midland Power | 0.361 | 0.250 | 0.272 | 0.374 | 0.364 |
| Korea District Heating Co. | 0.339 | 0.298 | 0.318 | 0.319 | 0.318 |
| Mean | 0.504 | 0.384 | 0.395 | 0.445 | 0.505 |
For individual power companies, the SEETEC LTD and GS EPS are the best practices which show the highest average energy efficiency, during the 2010–2011 period. The result shows the energy efficiency as unity indicating that the two companies were always on the frontier during 2010–2011. On the other hand, Incheon Total Energy shows the lowest energy efficiency score with an average value of 0.158, indicating it has great potential to improve its energy efficiency.
The proposed SSBM model is used to measure the environmental energy efficiency of Korean power companies.
Table 3 shows the environmental energy efficiency for each company during 2007–2011 under SSBM. With regard to the average environmental energy efficiency under SSBM, the results demonstrate that most Korean power companies are also not efficient in their energy use. For instance, in 2011, the environmental energy efficiency varied from 0.310–1, with an average value of 0.479. Regarding individual power companies, the
SEETEC LTD and
GS EPS are using best practices, showing the highest average energy efficiency during the 2010–2011 period.
Table 3.
Energy efficiency based on SSBM, 2007–2011.
Table 3.
Energy efficiency based on SSBM, 2007–2011.
| Company | 2007 | 2008 | 2009 | 2010 | 2011 |
|---|
| SEETEC LTD | 1.000 | 1.000 | 0.950 | 0.889 | 1.000 |
| GS Power | 0.545 | 0.496 | 0.430 | 0.463 | 0.506 |
| STX Energy | 0.329 | 0.447 | 0.383 | 0.484 | 0.735 |
| Gunjang Energy | 0.381 | 0.209 | 0.264 | 0.276 | 0.317 |
| Daejeon cogeneration Plant | 0.426 | 0.356 | 0.365 | 0.419 | 0.384 |
| Moorim power tech | 0.842 | 0.389 | 0.305 | 0.342 | 0.346 |
| ASUDI | 0.368 | 0.288 | 0.357 | 0.356 | 0.447 |
| SK E&S | 0.281 | 0.159 | 0.142 | 0.148 | 0.366 |
| Incheon Airport Energy | 0.411 | 0.289 | 0.265 | 0.240 | 0.350 |
| Incheon Total Energy | 0.078 | 0.057 | 0.075 | 0.212 | 0.328 |
| GS EPS | 1.000 | 1.000 | 0.702 | 1.000 | 1.000 |
| Posco Energy | 0.521 | 0.421 | 0.320 | 0.366 | 0.774 |
| Korea Southeast Power | 0.258 | 0.213 | 0.266 | 0.282 | 0.282 |
| Korea Southwest Power | 1.000 | 0.352 | 0.356 | 0.385 | 0.409 |
| Korea East West Power | 0.341 | 0.292 | 0.292 | 0.336 | 0.324 |
| Korea Western Power | 0.595 | 0.303 | 0.303 | 0.374 | 0.393 |
| Korea Midland Power | 0.361 | 0.247 | 0.247 | 0.326 | 0.349 |
| Korea District Heating Co. | 0.339 | 0.285 | 0.299 | 0.286 | 0.310 |
| Mean | 0.504 | 0.378 | 0.351 | 0.399 | 0.479 |
From
Table 3, it was found that over half of the peer companies like
SEETEC LTD and
GS EPS have experienced some sort of regression since 2008. It should be also noted that, in
Table 3, in year 2009, none of the companies have been efficient, which means that peer companies from previous years are setting the frontier. The reason may stem from the fact that Korean power companies were heavily affected by the global economic crisis in 2008.
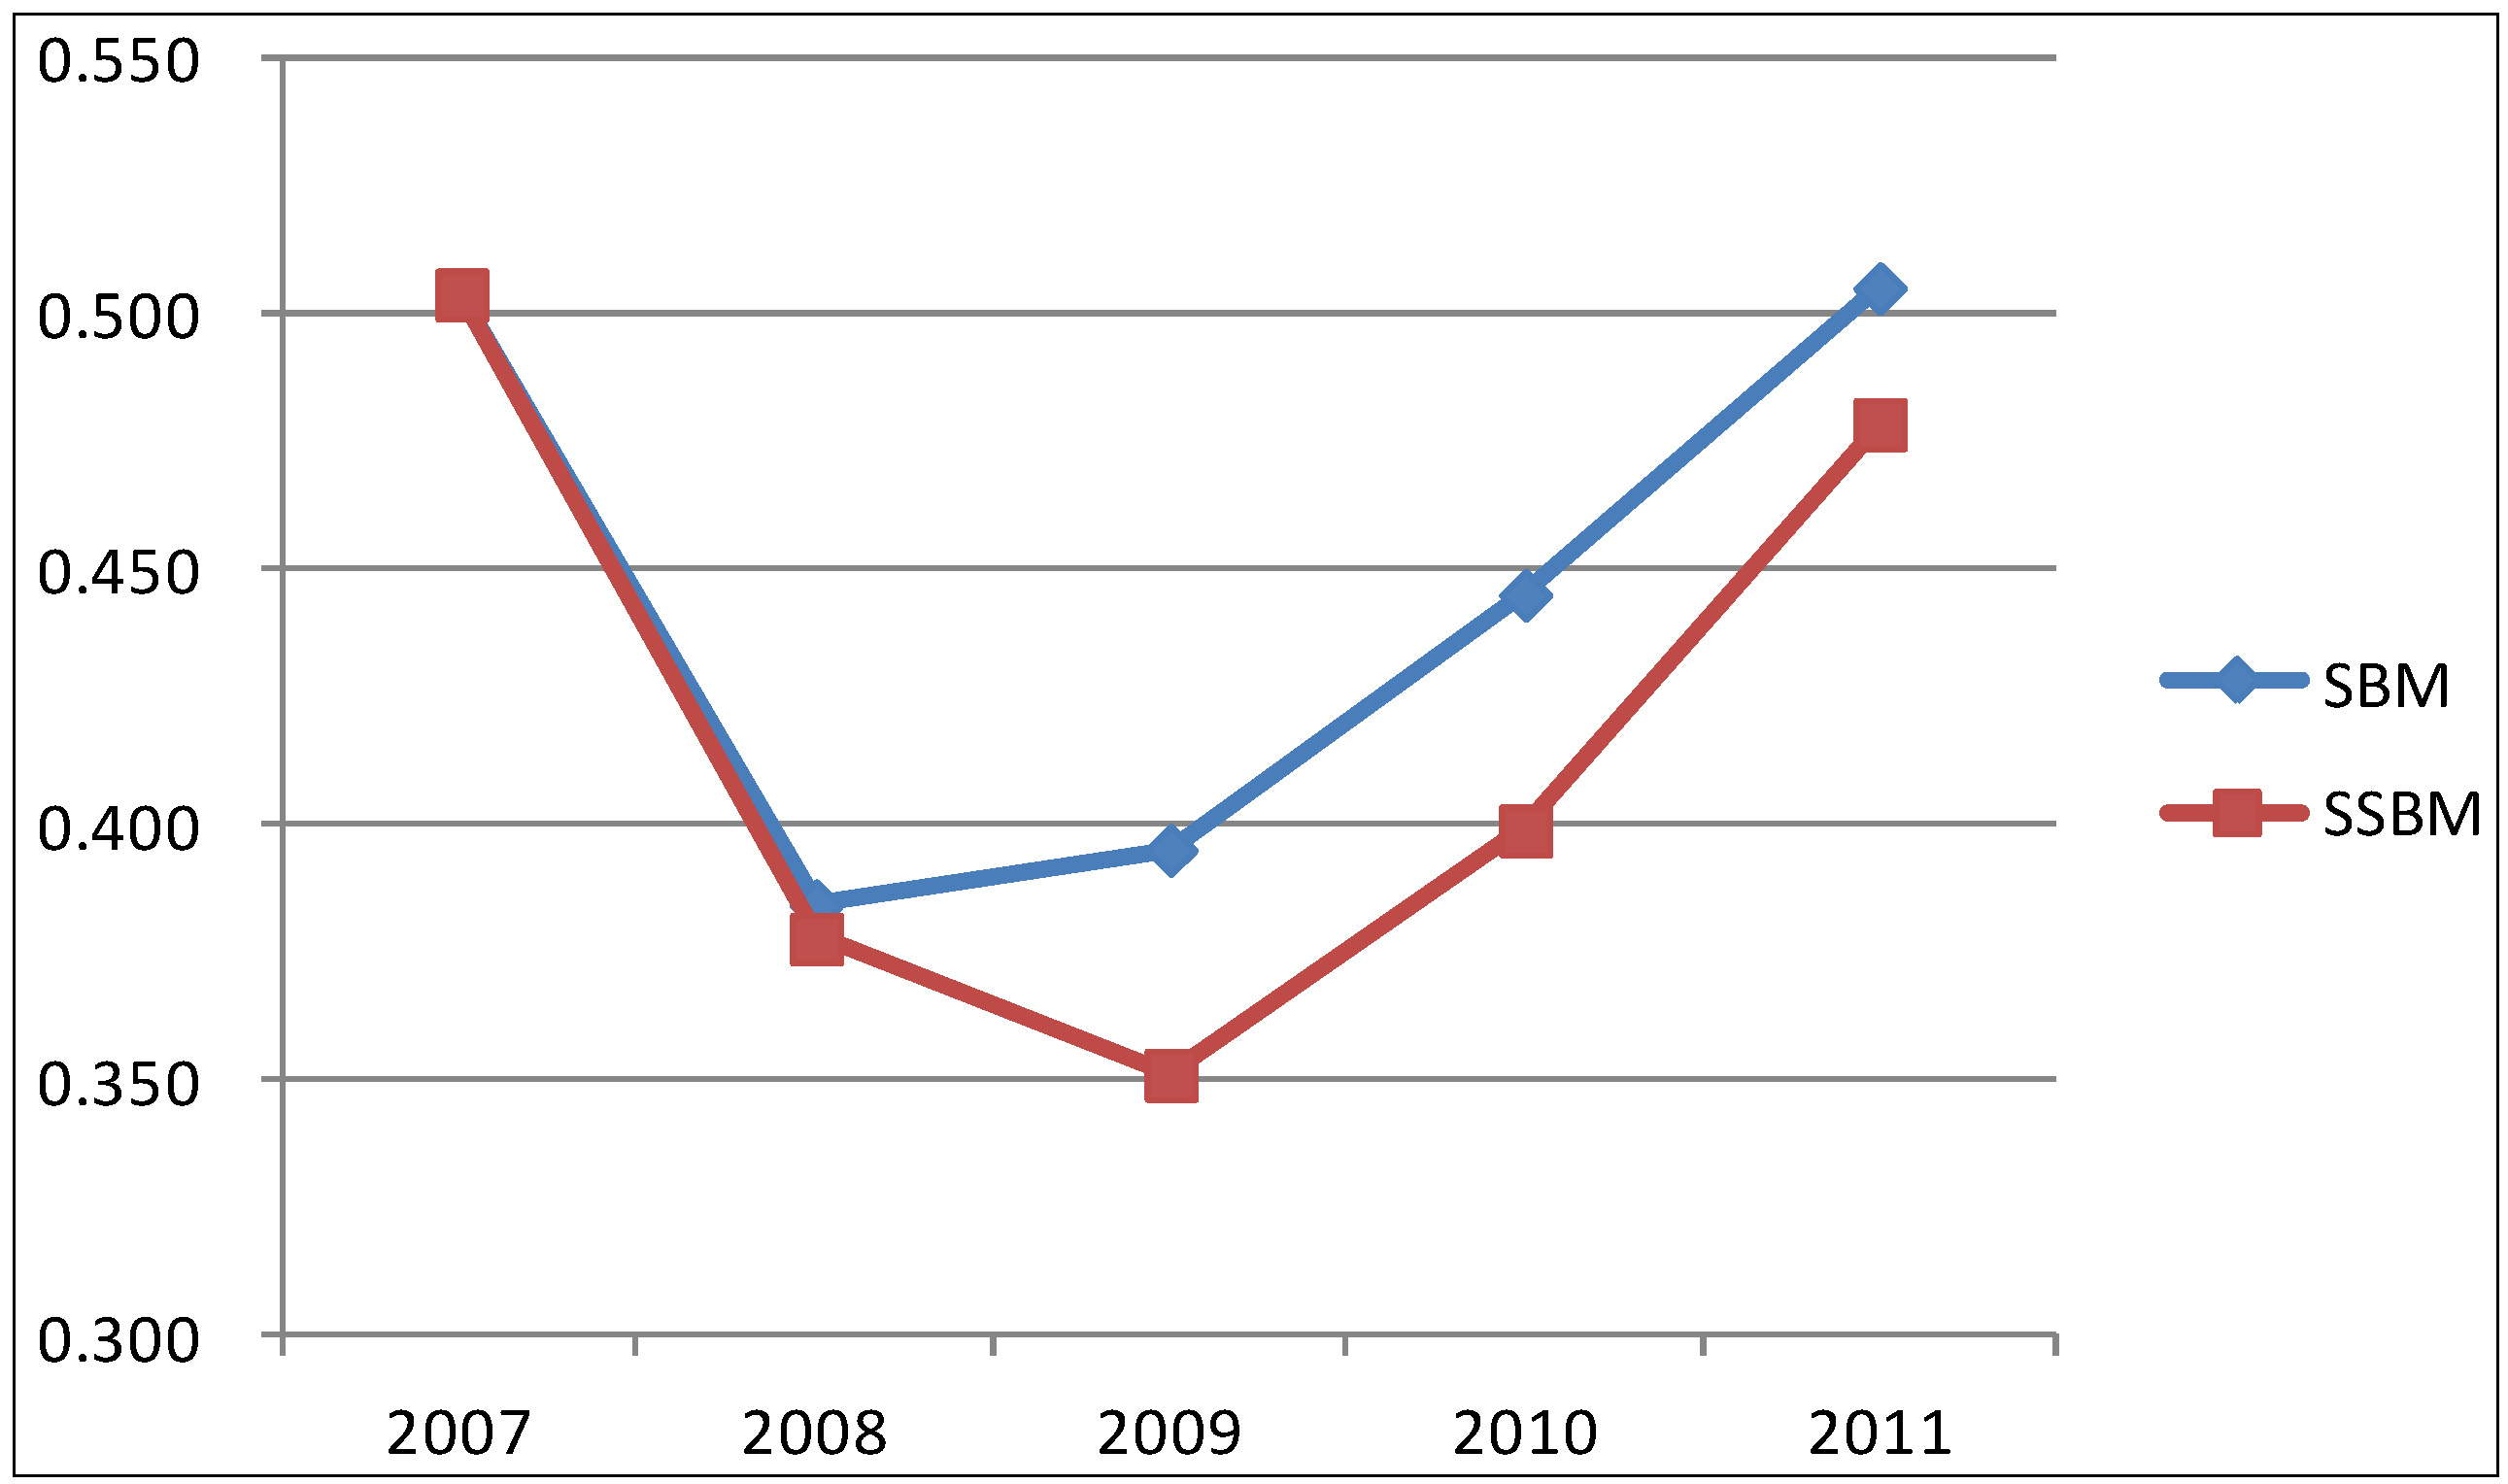
We also examine the trends in energy efficiency.
Figure 1 shows the average environmental energy efficiency trend based on the SSBM and SBM models, respectively. The figure illustrates that both SBM energy efficiency and SSBM energy efficiency show a “U-shape” trend. The sequential energy efficiency decreased during 2007–2009; however, from 2009, the efficiencies showed a continual increase. This empirical result might be attributed to the fact that the “green growth” policy in Korea had a positive impact on green energy efficiency.
Before 2009, the Korean power industry was driven by a period of intensive energy-use by industry, which required enormous amounts of energy; therefore, the energy efficiency showed a decreasing trend. Since then, the Korean government has proposed some policy initiatives for reducing energy use and GHG emissions, named green growth policy. The government’s stricter environmental regulations likely increased energy efficiency. This empirical result supports Porter’s hypothesis and thus rejects our proposed hypothesis.
Figure 1.
The trends of energy efficiency under SSBM and SBM.
Figure 1.
The trends of energy efficiency under SSBM and SBM.
From
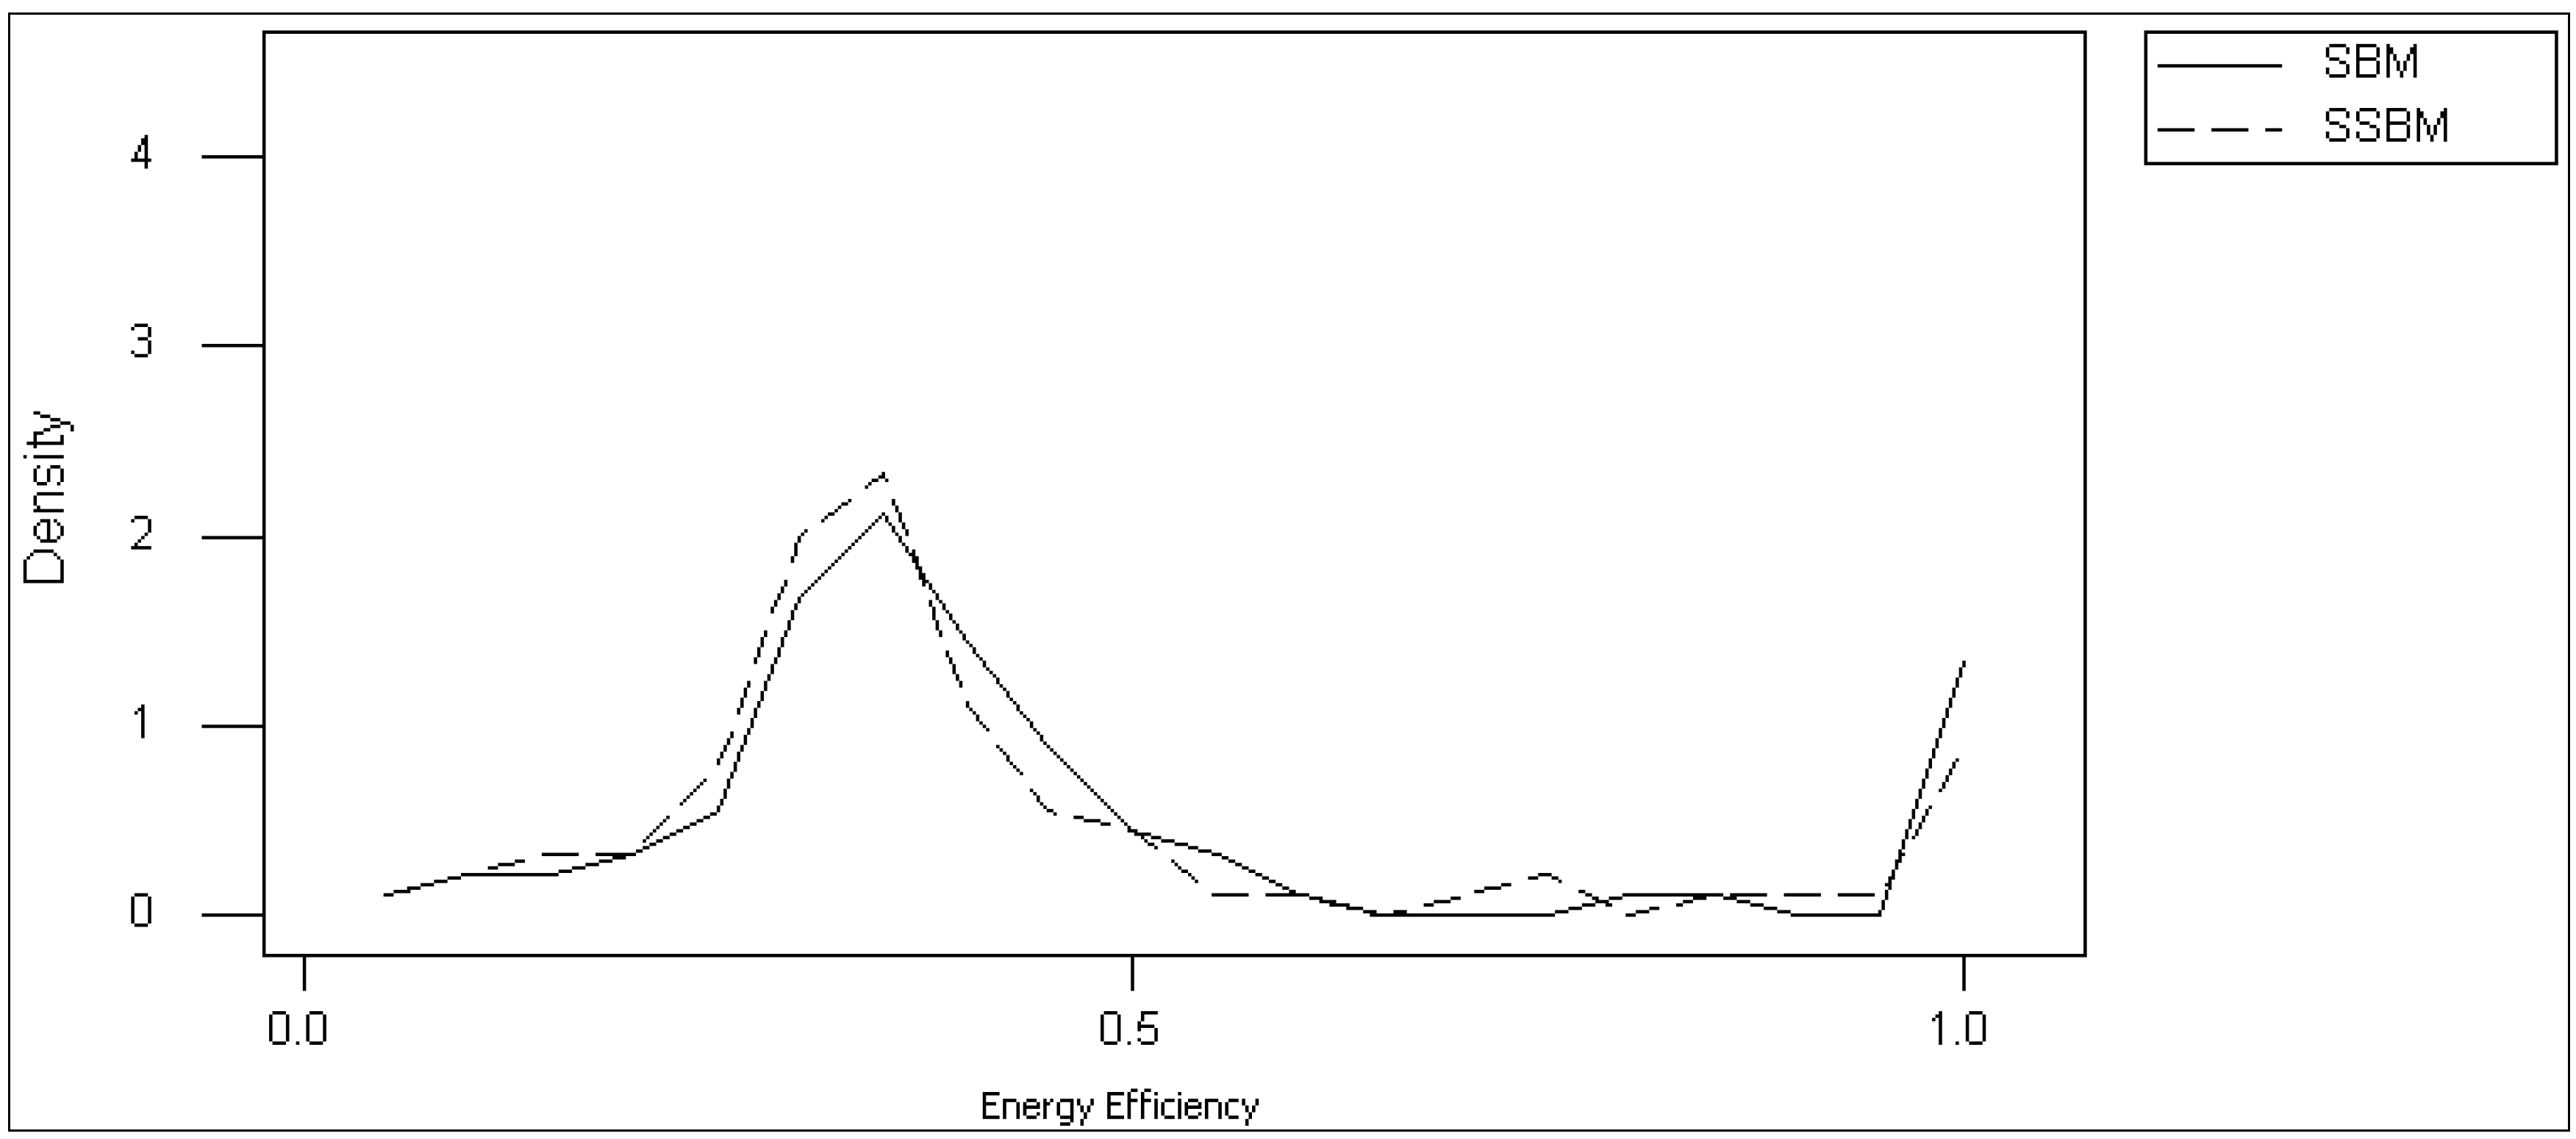
Figure 1, it was also found that energy efficiency from SBM is higher than that from SSBM. It indicates that the conventional SBM model tends to overestimate the real energy efficiency. The kernel density plot in
Figure 2 also shows some differences in the distribution pattern of energy efficiency between SBM and SSBM approaches. We employ the Wilcoxon-Mann-Whitney rank-sum test and Kolmogorov-Smirnov test to determine any significant differences between SBM and SSBM in terms of rank and kernel distribution. As shown in
Table 4, the results reject the null hypothesis at the 1% level, indicating a significant difference between the two energy efficiency values.
Figure 2.
Kernel density of energy efficiency from SSBM and SBM.
Figure 2.
Kernel density of energy efficiency from SSBM and SBM.
Table 4.
Results of the non-parametric test.
Table 4.
Results of the non-parametric test.
| Test | Null Hypothesis (Ho) | Statistics | p-value |
|---|
| Mann-Whitney | Mean (SBM) = Mean (SSBM) | 731.62 | 0.00 |
| Kolmogorov-Smirnov | Distribution (SBM) = Distribution (SSBM) | 8.92 | 0.00 |
5. Concluding Remarks
In this paper, we introduce a relatively new energy efficiency measure based on a sequential slack-based efficiency measure (SSBM) approach to model total-factor energy efficiency with undesirable outputs for Korean power companies. This proposed approach allows for the simultaneous incorporation of the nature of technology, total input slacks, and undesirable outputs into energy efficiency analysis.
We conduct an empirical study of energy efficiency incorporating greenhouse gas emissions for Korean power companies during 2007–2011. The results indicate that most power companies are not performing at high energy efficiency, and thus have great potential to improve their energy efficiency. The “green growth” policy in Korea shows obvious positive impacts on green energy efficiency which supports Porter’s hypothesis.
Some theoretical and practical implications are as follows: First, as seen in the different results between SBM and SSBM, the basic SBM model tends to overestimate energy efficiency, and sequential DEA technology has a significant effect on energy efficiency measurements. Second, the empirical results of target energy efficiency can provide some useful information for the Korean government to negotiate with individual companies as to the GHG reduction targets. Third, high inefficiency for most companies implies that GHG policy of the Korean government should focus on the enhancement of energy efficiency rather than to invest in the development of new energy which is very costly to achieve sustainability.
Using the DEA model requires homogeneity among the evaluated DMUs. One limitation of this study is that there are heterogeneities among power companies in the sample. If the sample size is large enough, the metafrontier SBM approach shall be used for future studies. Another possible extension for this study is that the panel data over the years for multiple DMUs can show intertemporal changes in efficiency and technology development separately using a Malmquist productivity index. All these implications should be factored in to our future studies.


