Article

An Index of Human Well-Being for the U.S.: A TRIO Approach

1
EPA, Office of Research and Development, Gulf Ecology Division, 1 Sabine Island Drive, Gulf Breeze, FL 32561, USA
2
Student Services Contractor for U.S. EPA, University of West Florida, 11000 University Parkway, Pensacola, FL 32514, USA
3
EPA, Gulf Ecology Division, 1 Sabine Island Drive, Gulf Breeze, FL 32561, USA
*
Author to whom correspondence should be addressed.
These authors contributed equally to this work.
Sustainability 2014, 6(6), 3915-3935; https://0-doi-org.brum.beds.ac.uk/10.3390/su6063915
Submission received: 26 February 2014 / Revised: 3 June 2014 / Accepted: 6 June 2014 / Published: 18 June 2014

Abstract

:
In 2011, the US Environmental Protection Agency’s (EPA) Office of Research and Development program, Sustainable and Healthy Communities, coined the term TRIO (Total Resources Impact Outcome) to represent approaches that fully incorporate all three pillars of community sustainability—environmental, economic and social. This holistic approach to sustainability is embodied in the Human Well-Being Index (HWBI) comprised of sub-indices representing environmental well-being, economic well-being and societal well-being (which includes basic human needs and subjective well-being). The development of the HWBI is described in this manuscript along with its application at national, state and county spatial scales. In addition, application at even smaller spatial scales (communities, neighborhoods, demographic and economic sub-groups, and even individuals) is discussed. The potential utility of HWBI for comparing the intended and unintended consequences of alternative decisions is described.

Graphical Abstract

1. Introduction

The US Environmental Protection Agency (EPA) has developed a holistic approach for characterizing human well-being at multiple scales: A Human Well-being Index (HWBI). The HWBI uses a substantial suite of measures to evaluate the influence of social, economic and environmental service flows on components of human well-being in an integrated fashion based on eight domains of well-being (Figure 1) applicable to communities of all scales whether national, regional or local. Figure 1 represents the conceptual model underlying the HWBI and depicts the relationships of natural and built capital, goods and services (including social and economic inequities), the domains of well-being as well as its sub-elements, and the value system of the entity being examined (i.e., relative importance values). When tracked over time, the index has the potential to serve as a measure of sustainability as a function of human well-being and may be linked to alternative decisions that change the ecological, economic, and social states of defined populations. The metrics and methodologies for constructing multiple-scale measures have been developed [1,2,3] and, using this approach, a U.S. HWBI is calculated along with the functional relationships to selected economic, societal and environmental services flows. The HWBI is distinct from other well-being indices in that the approach is scalable and calculated domain and HWBI values are responsive to changes in select economic, social and ecological services, making it well suited as an informative endpoint in the sustainability decision-making process.
The HWBI is designed to inform and empower decision makers to equitably weigh and integrate human health, socio-economic, environmental, and ecological factors to foster sustainability in the built and natural environments; thereby, helping local decision makers understand the effects on sustainability of alternative policies and actions. The HWBI can be used to identify: (a) current environmental, economic, and social trends that signal sustainability shifts; (b) to the extent possible, the thresholds of sustainability for such indicators; and (c) performance metrics that signal that approaches to increasing sustainability are working as intended (including indicators of any unintended consequences).
In 2011, the Sustainable and Healthy Communities Research program (SHC) in EPA’s Office of Research and Development (ORD) coined the term TRIO for Total Resource Impacts and Outcomes [4]. The concept of TRIO encompasses any number of holistic community decision-making approaches that address all three pillars of sustainability—economic, societal and environmental. While TRIO is similar to triple-bottom line accounting [5,6,7], SHC developers believed the term triple-bottom line accounting conveyed too much of an economic connotation and desired a term that would clearly demonstrate full inclusion of all three pillars of sustainability. For example, community-based decisions are often driven by financial burden where “cost” is largely described in economic terms such as valuation. A TRIO approach would evaluate both tangible costs (e.g., capital investment, tax revenue, permitting) and less tangible “costs” (e.g., community service disruption, loss of natural services) that may impact quality of life. This expanded assessment process would be accomplished across all three pillars of sustainability in parallel to help identify not only the expected attributes of the decision but also the unintended consequences of all decision options. In the literature, approaches that consider the three pillars of sustainability have included many different specific methods—The Green Scorecard [8], Triple Bottom-Line Accounting [5,6,7], Happy Planet Index [9], and Millennium Ecosystem Assessment [10] to name a few. Many others (e.g., Ecological Footprint) [11] address one specific aspect of sustainability. All of these approaches relate in one way or another to the improvement of human well-being as an endpoint. As well-being is often an endpoint of concern regarding sustainability, SHC determined the need to adopt or develop an approach or index of human well-being that fully embraced the TRIO aspects of the developing research program. The Human Well-Being Index (HWBI) is the culmination of this research effort.
Figure 1. Conceptual framework for evaluating the influence of service flows on well-being endpoints for the construction of a Human Well-Being Index.
Sustainability 06 03915 g001
In an extensive review, Smith et al. [12] examined twenty approaches to assessing human well-being (e.g., Gallup-Healthways Well-Being Index, Gross National Happiness Index) in order to determine if true TRIO-like approaches existed. A brief summary describing the indices considered and their inclusiveness of well-being elements is shown in Table 1. While their findings suggested that several approaches were close to a full-TRIO assessment (i.e., addressing all three pillars of well-being and sustainability), most approaches focused on one or two of the sustainability pillars rather than on all three. As an example, the Gallup-Healthways Well-Being Index (Gallup) was determined to have significant information pertaining to social drivers like health and little or no information concerning the economic and environmental pillars of well-being. In addition, many of these reviewed approaches relied on subjective perceived information from surveys rather than measured objective data. As shown in Table 1, the HWBI is a substantive measure of human well-being, when compared directly to other measures of well-being, and addresses all three pillars of well-being with a clear combination of objective and subjective indicators and metrics relating to each pillar. When linked to services flows, the HWBI epitomizes the TRIO approach.
Table 1. Well-being elements represented in reviewed indices [9]. X denotes the element was directly represented and addressed in the index; (X) denotes that element was indirectly represented but not directly addressed in the description of the indicators and domains. N denotes national scale, R denotes regional scale, S denotes state scale, L denotes local scale, and M denotes multiple scales.
IndexScaleEconomic
Well-Being
Basic NeedsEnvironmental
Well-Being
Subjective
Well-Being
The Economic Intelligence Unit’s
Quality of Life [13]
NXX
Australian Unity Wellbeing Index [14]NXXX
Human Development Index [15]NXX
Quality of Life Index for Developing Countries [16]NXX(X)X
The Well-being of Nations [17]NXXX
Sustainable Society Index [18]NXXX
Hong Kong Quality of Life [19]RXXXX
Well-being in EU Countries—Multidimensional Index of Sustainability [20]NXXX
National Well-being Index—Life Satisfaction [21]NXXX(X)
Child and Youth Well-being Index [22]NXX
Canadian Index of Well-being [23]NXXX
Happy Planet Index [9]N XXX
Index of Child Well-Being in Europe [24]NXX X
Index of Social Health [25]NXX
Gallup-Healthways Well-Being Index [26]M X X
The State of the Commonwealth Index [27]SXXXX
QOL 2007 in Twelve of New Zealand’s Cities [28]LXXXX
Nova Scotia 2008 GPI [29]RXXX
Gross National Happiness [30]NXXXX
Human Well-Being Index [this manuscript]MXXXX
This paper describes the approaches used to develop the HWBI and to assess services provisioning. The HWBI is compared to other measures of well-being measures to evaluate index performance. Lastly, the integrated concept of the interactions among social, economic and environmental drivers linked to well-being endpoints is demonstrated as a TRIO assessment.

2. Index Development, Application and Discussion

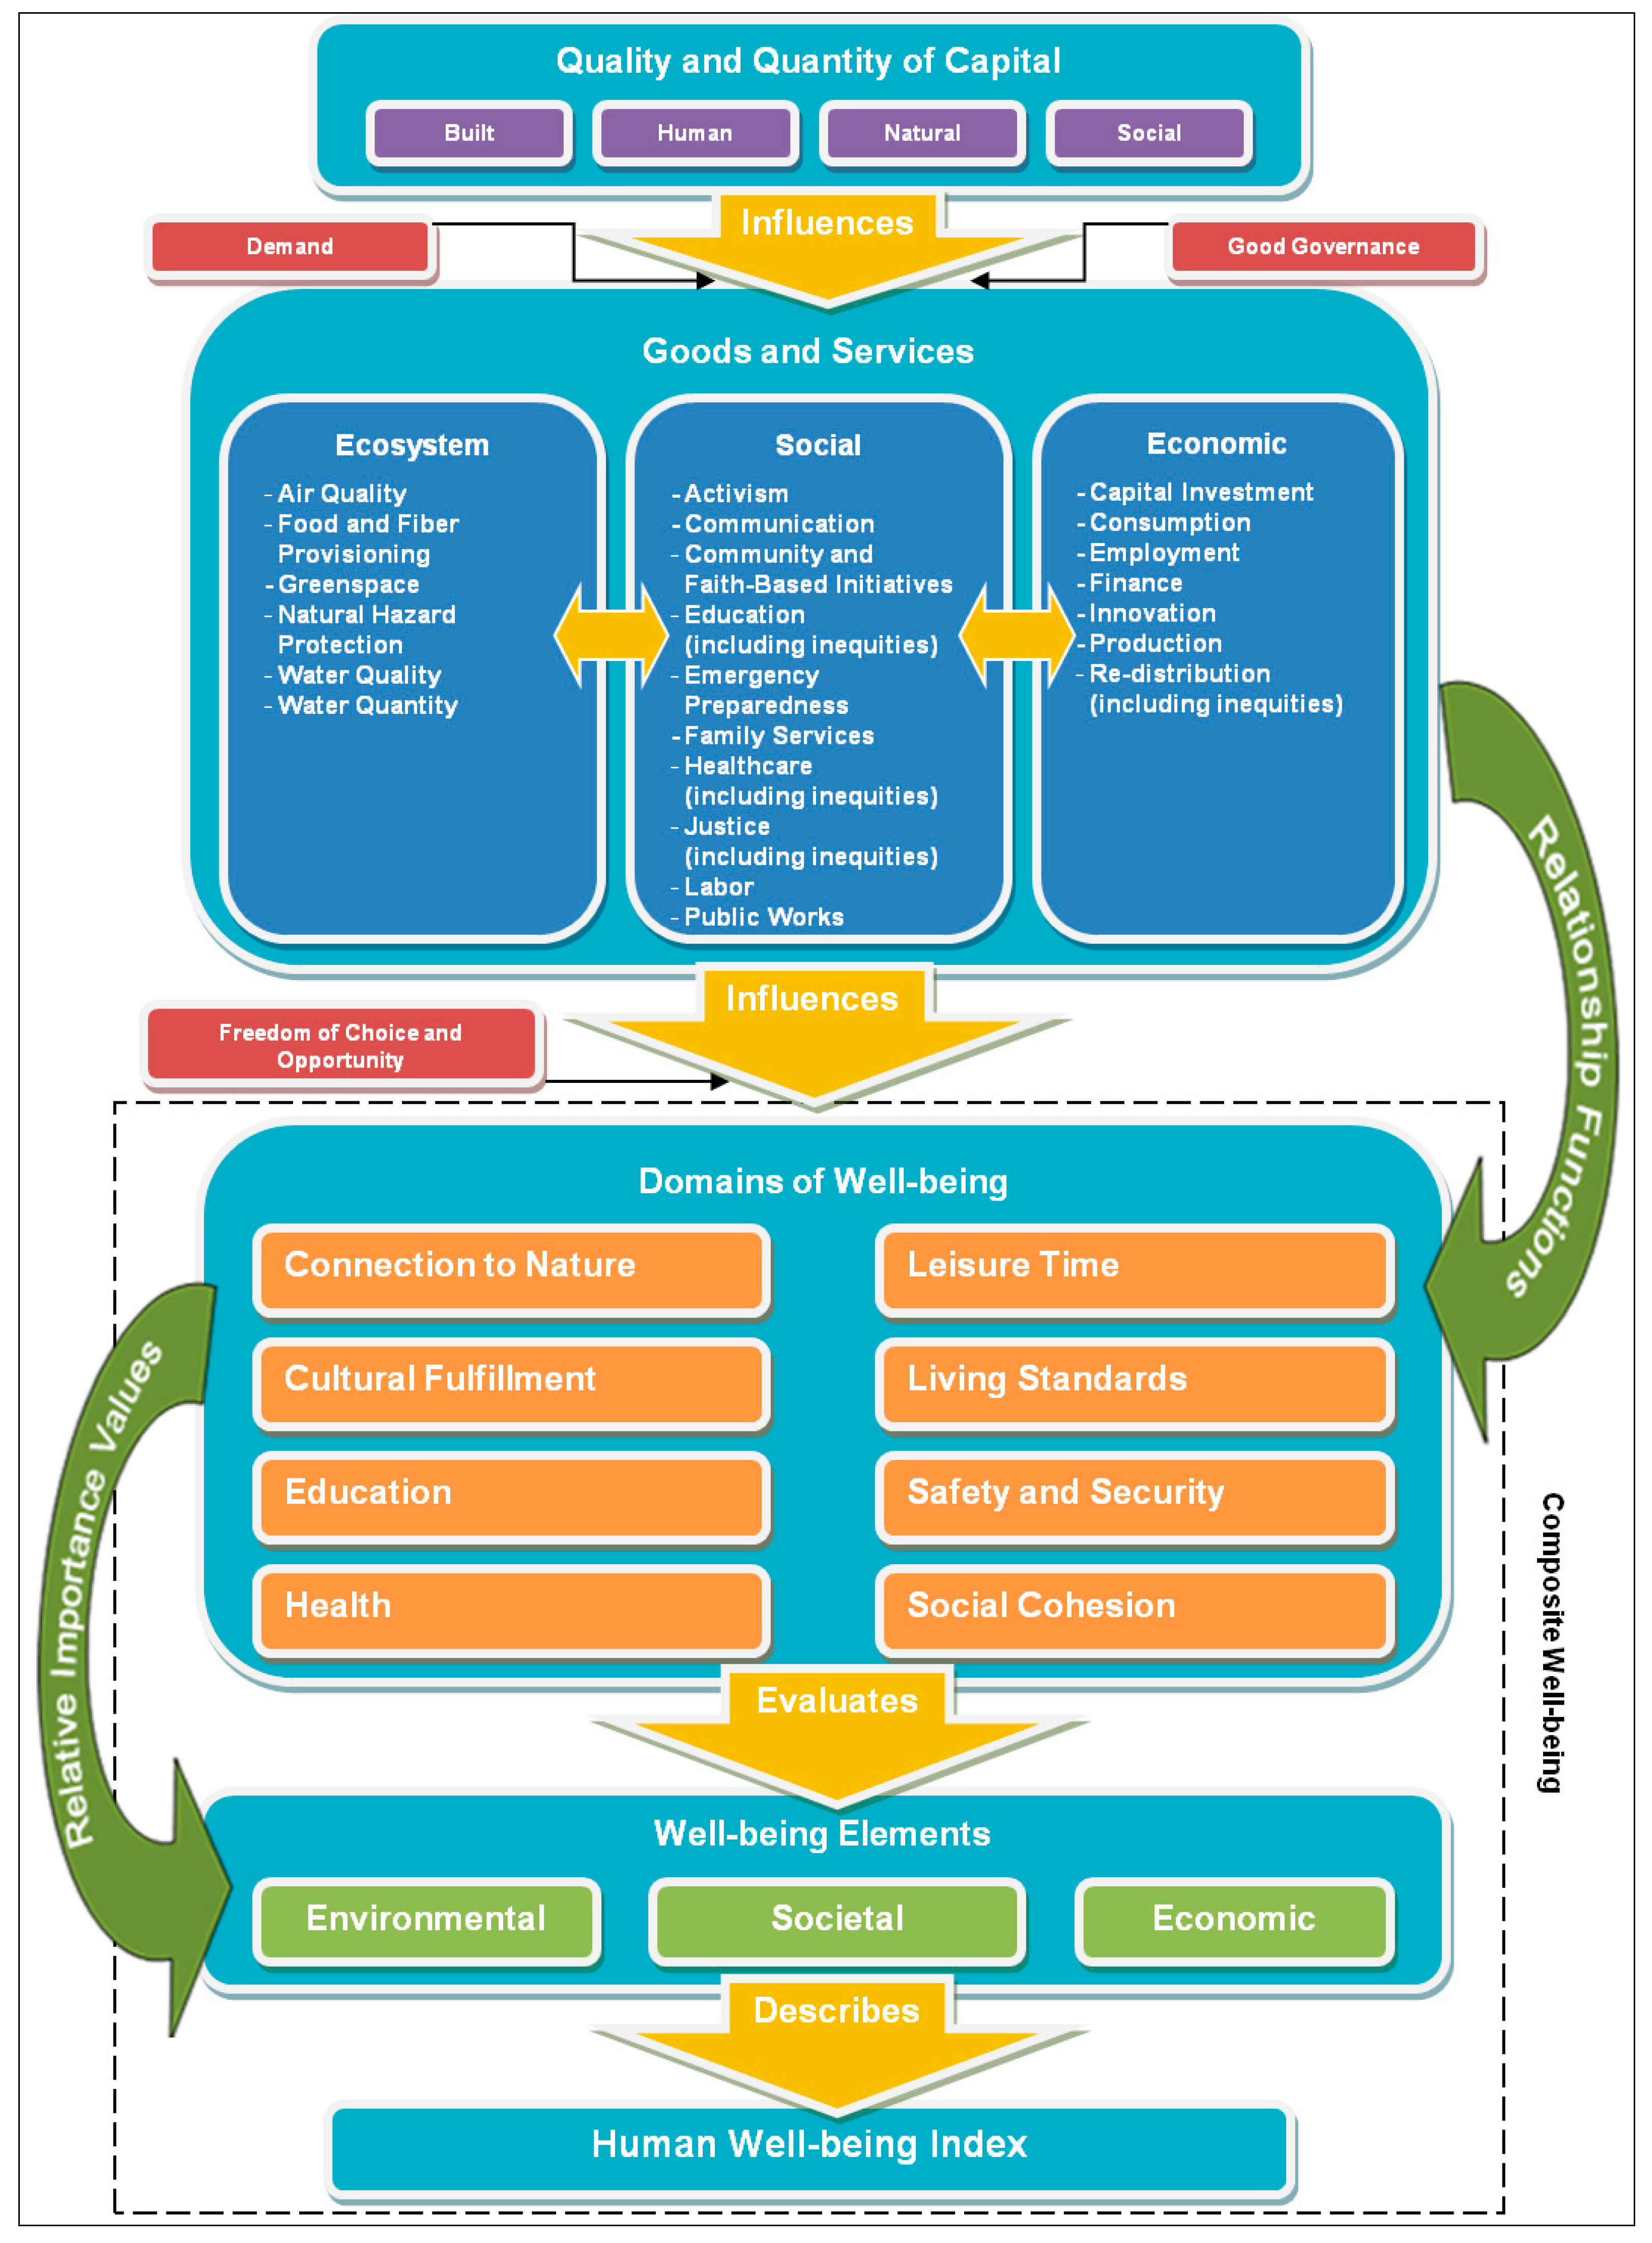
2.1. Characterizing Well-Being

2.1.1. Index Description

The HWBI is an index based on a combination of objective data, subjective data collected through surveys, available data from other well-being surveys, and combined at the smallest spatial scale generally available (most often county level data). The conceptual model depicted in Figure 1 shows the interplay of goods and services and their influence on the eight domains of well-being used in HWBI, the use of relative importance values to describe the community value structures, and the combination of all information into the three well-being elements and their subsequent combination into a single value representing well-being. The index utilizes 8 domains, 25 indicators and 79 metrics (Table 2). First, metrics are combined to create an indicator ﴾k﴿ score for a spatial area ﴾xk﴿ using the following equation:
Sustainability 06 03915 i001
where nc represents the number of locations (county by year) in an area (e.g., a region, state), nm refers to the number of metrics, wi equals the population weight for location i, and xmi is the metric value for location i and metric m combination.
A domain ﴾d﴿ is scored for a given area ﴾xd ﴿as follows:
Sustainability 06 03915 i002
where k represents an indicator, ﴾xk﴿ refers to the indicator score and nk total number of indicators.
Economic, environmental, and social well-being element values ﴾e﴿ are derived from the geometric mean of all domains factored by a relative importance value specific to each element. The overall element scoring ﴾xe﴿ for an area is given by the following equation:
Sustainability 06 03915 i003
where RIV(d, e) is the Relative Importance Value between domain d and element e.
Finally, the HWBI is calculated using a relative importance factor for each element-to-overall well-being relationship as shown below:
HWBI = RIVecoxeco + RIVenvxenv + RIVsocxsoc
where RIVeco, RIVenv, RIVsoc, and xeco, xenv, xsoc are the Relative Importance Values and scores for the economic, environmental, and social elements, respectively.
Table 2. Indicators and metrics associated with each of the eight domains used to characterize human well-being and calculate the index.
DomainIndicatorMetrics
Connection to NatureBiophiliaConnection to Life
Spiritual Fulfillment
Cultural FulfillmentActivity ParticipationPerforming Arts Attendance
Rate of Congregational Adherence
EducationBasic Educational Knowledge and Skills of YouthMathematics Skills
Reading Skills
Science Skills
Participation and AttainmentAdult Literacy
High School Completion
Participation
Post-Secondary Attainment
Social, Emotional and Developmental AspectsBullying
Contextual Factors
Physical Health
Social Relationships and Emotional Well-being
HealthHealthcarePopulation with a Regular Family Doctor
Satisfaction with Healthcare
Life Expectancy and MortalityAsthma Mortality
Cancer Mortality
Diabetes Mortality
Heart Disease Mortality
Infant Mortality
Life Expectancy
Suicide Mortality
Lifestyle and BehaviorAlcohol Consumption
Healthy Behaviors Index
Teen Pregnancy
Teen Smoking Rate
Personal Well-beingHappiness
Life Satisfaction
Perceived Health
Physical and Mental Health ConditionsAdult Asthma Prevalence
Cancer Prevalence
Childhood Asthma Prevalence
Coronary Heart Disease Prevalence
Depression Prevalence
Diabetes Prevalence
Heart Attack Prevalence
Obesity Prevalence
Stroke Prevalence
Leisure TimeActivity ParticipationAverage Nights on Vacation
Physical Activity
Time SpentLeisure Activities
Working Age AdultsAdults who Provide Care to Seniors
Adults Working Long Hours
Adults Working Standard Hours
Living StandardsBasic NecessitiesFood Security
Housing Affordability
IncomeIncidence of Low Income
Median Household Income
Persistence of Low Income
WealthMedian Home Value
Mortgage Debt
WorkJob Quality
Job Satisfaction
Safety and SecurityActual SafetyAccidental Morbidity and Mortality
Loss of Human Life
Property Crime
Violent Crime
Perceived SafetyCommunity Safety
RiskSocial Vulnerability Index
Social CohesionAttitude toward Others and the CommunityBelonging to Community
City Satisfaction
Discrimination
Helping Others
Trust
Democratic EngagementInterest in Politics
Registered Voters
Satisfaction with Democracy
Trust in Government
Voice in Government Decisions
Voter Turnout
Family BondingExceeded Screen Time Guidelines
Frequency of Meals at Home
Parent-child Reading Activities
Social EngagementParticipation in Group Activities
Participation in Organized, Extracurricular Activities
Volunteering
Social SupportClose Friends and Family
Emotional Support

2.1.2. Indicators and Data Source Selection

The domains, indicators and metrics included in the HWBI and its service drivers are shown in Table 2 and Table 3. Objective and subjective data were collected from various publically accessible sources and organized hierarchically by spatial and temporal resolution (e.g., national, regional, state, and county by year) for the years 2000–2010 to populate these metrics. When multiple spatial scales existed for a metric, the finest scale (e.g., county versus state) was selected for processing. Data source determination was primarily driven by temporal and spatial coverage of offered data. To the extent possible, factors such as data reliability and credibility, historic data continuity, and future data accessibility were consider in the data selection process.
Table 3. Indicators and number of metrics associated with each of the three service types used to generally characterize the provisioning of goods and services that influence the human well-being index.
Service TypeServiceIndicatorNumber of Metrics
EconomicCapital InvestmentCapital Formation1
Commercial Durables1
New Housing Starts1
New Infrastructure Investments4
ConsumptionCost of Living1
Discretionary Spending1
Goods and Services3
Sustainable Consumption1
EmploymentEmployment3
Employment Diversity1
Underemployment1
Unemployment1
FinanceGovernance2
Loans4
Savings1
InnovationInvestment2
Patents and Products1
ProductionExports1
Household Services1
Market goods and services2
Sustainable Production1
RedistributionInequality1
Public Support5
EcosystemAir QualityUsable Air1
Food and Fiber ProvisioningEnergy4
Food and Fiber3
Raw Materials5
Green SpaceNatural Areas4
Recreation and Aesthetics3
Natural Hazard ProtectionNatural Hazard Exposure4
Water QualityUsable Water2
Water QuantityAvailable Water2
SocialActivismParticipation4
CommunicationAccessibility3
Industry Infrastructure3
Providers1
Public Service Communication1
Quality2
Community and Faith-based InitiativesInvestment1
Providers1
Education (services)Accessibility3
Confidence1
Investment2
Providers2
Emergency PreparednessPost-Disaster Response1
Pre-Disaster Planning1
Responders1
Family ServicesAccessibility2
Effectiveness3
Investment1
Providers1
HealthcareAccessibility5
Investment3
Providers1
Quality1
JusticeAccessibility2
Confidence1
Environmental4
Investment2
Providers1
Quality1
LaborConfidence1
Effectiveness1
Employee Rights2
Public WorksAccessibility2
Investment4
Providers1
Quality5
Quantity5

2.1.3. Data Imputation, Outliers and Standardization

Data gaps caused by spatial and temporal disparities found among data sources were filled using a carry-forward substitution imputation technique [31] using cross-year county or within year state or regional data. The carry-forward method was utilized to allow for data analyses that are more robust. A secondary imputation was accomplished in an effort to calculate imputed values for counties exhibiting similar characteristics. From the spatially and temporally complete data set, county groupings were created using a combination of the Rural-Urban Continuum Code (RUCC) classifications [32] and the Gini Index for Household Income Inequality (HII) quintiles [33]. The RUCC-HII permutations generated county data groupings that generally reflected the relative spatial relationship of a county to the nearest large urban center and its measured income dispersion. Within-year median values were calculated for each RUCC-HII banding. Missing values in the original aggregate of metric data were substituted with the resulting RUCC-HII banding values.
Box-and-whisker analyses were completed for each fully enumerated HWBI metric. Extreme lower and upper outlier measures were set to minimum and maximum values, respectively. The maximum values were calculated to be three times the 75% percentile for each metric and the minimum values were calculated as minus three times the 25% percentile. Any outliers of this three times far-fence technique were set to the metric value closest to the fence. All data were standardized on a scale from 0.1 to 0.9 following the Organization for Economic Co-Operation and Development’s (OECD) Better Life Index approach [34] with minor modification to account for the difference in scale. The resulting HWBI metric data set included both imputed and non-imputed standardized data for 3143 counties of the U.S that represented greater than 2.7 million data points, collectively.

2.1.4. Calculating the HWBI

The HWBI was derived from indicator scores calculated as the population weighted average of the standardized metric values. Indicator scores were averaged for each domain score. Finally, a scaled geometric mean was calculated across domain scores to produce the final the HWBI. Higher HWBI scores indicate greater levels of well-being. Both the hierarchical organization of the metric data and the step-wise calculation process provided the means for examining well-being and its constituents at multiple scales from the national level down to individual counties. For example, the mean decadal HWBI for the nation was 52.8 ± 0.1. At more refined scales, the New England region scored highest among the GSS regions and the West South Central region scored lowest in the decadal HWBI assessments while New Hampshire had the highest decadal score (55.8 ± 1.0) and Louisiana the lowest (49.9 ± 0.4) at the state level (Figure 2).
At the finest spatial scale, chloropleth maps (Figure 3) show the mean decadal domain scores for all counties across the U.S. This disassembled view of domain values shows observable patterns in the components that describe overall well-being. For example, the pattern for the domain of Leisure Time appears inversely related to Living Standards and Education may be linked to Health. While there is no specific indication of causality or directionality, the ability to make these types of observations may provide a starting point for identifying well-being related decision priorities.
HWBI metric data for scales smaller than county were typically not available. To account for this limitation, an approach was developed to include the option of using relative importance values (RIVs) derived following methods described in Smith et al. [35]. RIVs are externally supplied weighting factors that represent a set of contribution priorities that may be applied to the domain and element components prior to the final calculation of the HWBI. An example application of the priority-based well-being index has been demonstrated for the Tampa Bay metropolitan area [36].
Figure 2. Mean decadal Human Well-Being Index (HWBI) for each state across the U.S.
Sustainability 06 03915 g002

2.2. Uncertainty and Sensitivity

Uncertainty analyses evaluated the estimated errors associated with the HWBI scores. For each spatial and temporal scale, the standard error for each indicator was calculated from the standardized metric values. Additionally, estimated errors introduced by the imputation process were propagated to the indicator level and added to the standard error estimate. The total indicator error was set to the maximum value of 0.5 or 100% error when either the standard error or the imputation error could not be estimated, or where the total error exceeded 0.5. The indicator error estimates were then propagated through the index calculation to estimate the uncertainty associated with domain, element and final index values (Table 4). As expected, the average reported error was much greater for indices calculated at the county-level. The HWBI calculations for counties relied on large numbers of imputed values because fewer measurement data were available.
Figure 3. Spatial distribution of decadal county-level domain scores.
Sustainability 06 03915 g003
Sensitivity analyses were conducted to identify index measures susceptible to bias caused by unknown random or systematic error. Sensitivity to random error was tested for each metric using a one-at-a-time Monte Carlo simulation method by introducing zero-mean centered normally distributed noise of varying degrees to raw metric values and observing the influence on output HWBI values and errors. Sensitivity to methodological bias was evaluated by adding fixed values (e.g., ±1) to various subsets of standardized metrics and recalculating the HWBI after each treatment. The analyses were run to examine the effects of spatial, temporal, or combined spatial-temporal missing value imputation methods. For random error effects, 7 of 83 metrics used in calculating the HWBI showed consistently higher bias relative to the group average (Z > 1.65, P < 0.05) (Table 5). The Connection to Nature and Cultural Fulfillment domains were most sensitive to both temporal and spatial methodological bias. The domain of Social Cohesion exhibited spatial bias sensitivity while the Health domain was, spatially and temporally, the most robust.
Table 4. Summary statistics for estimates of uncertainty at the various spatial and temporal scales.
Time PeriodScaleAverage ErrorStandard DeviationMinimumMaximum
AnnualNational0.400.030.330.43
GSS Region1.090.360.541.83
State2.341.310.988.10
County9.512.995.9324.09
2000–2010National0.122N/AN/AN/A
GSS Region0.330.110.190.51
State0.700.380.332.09
County2.640.901.836.93
Table 5. List of domains and indicators affected by metric bias.
DomainIndicatorMetric
Connection to NatureBiophiliaSpiritual Fulfillment
Connection to Life
Cultural FulfillmentActivity ParticipationPerformance Arts Attendance
Rate of Congregational Adherence
Safety and SecurityActual SafetyLoss from Natural Hazards
Perceived SafetyCommunity Safety
Social CohesionAttitude Toward Others and the CommunityCity Satisfaction

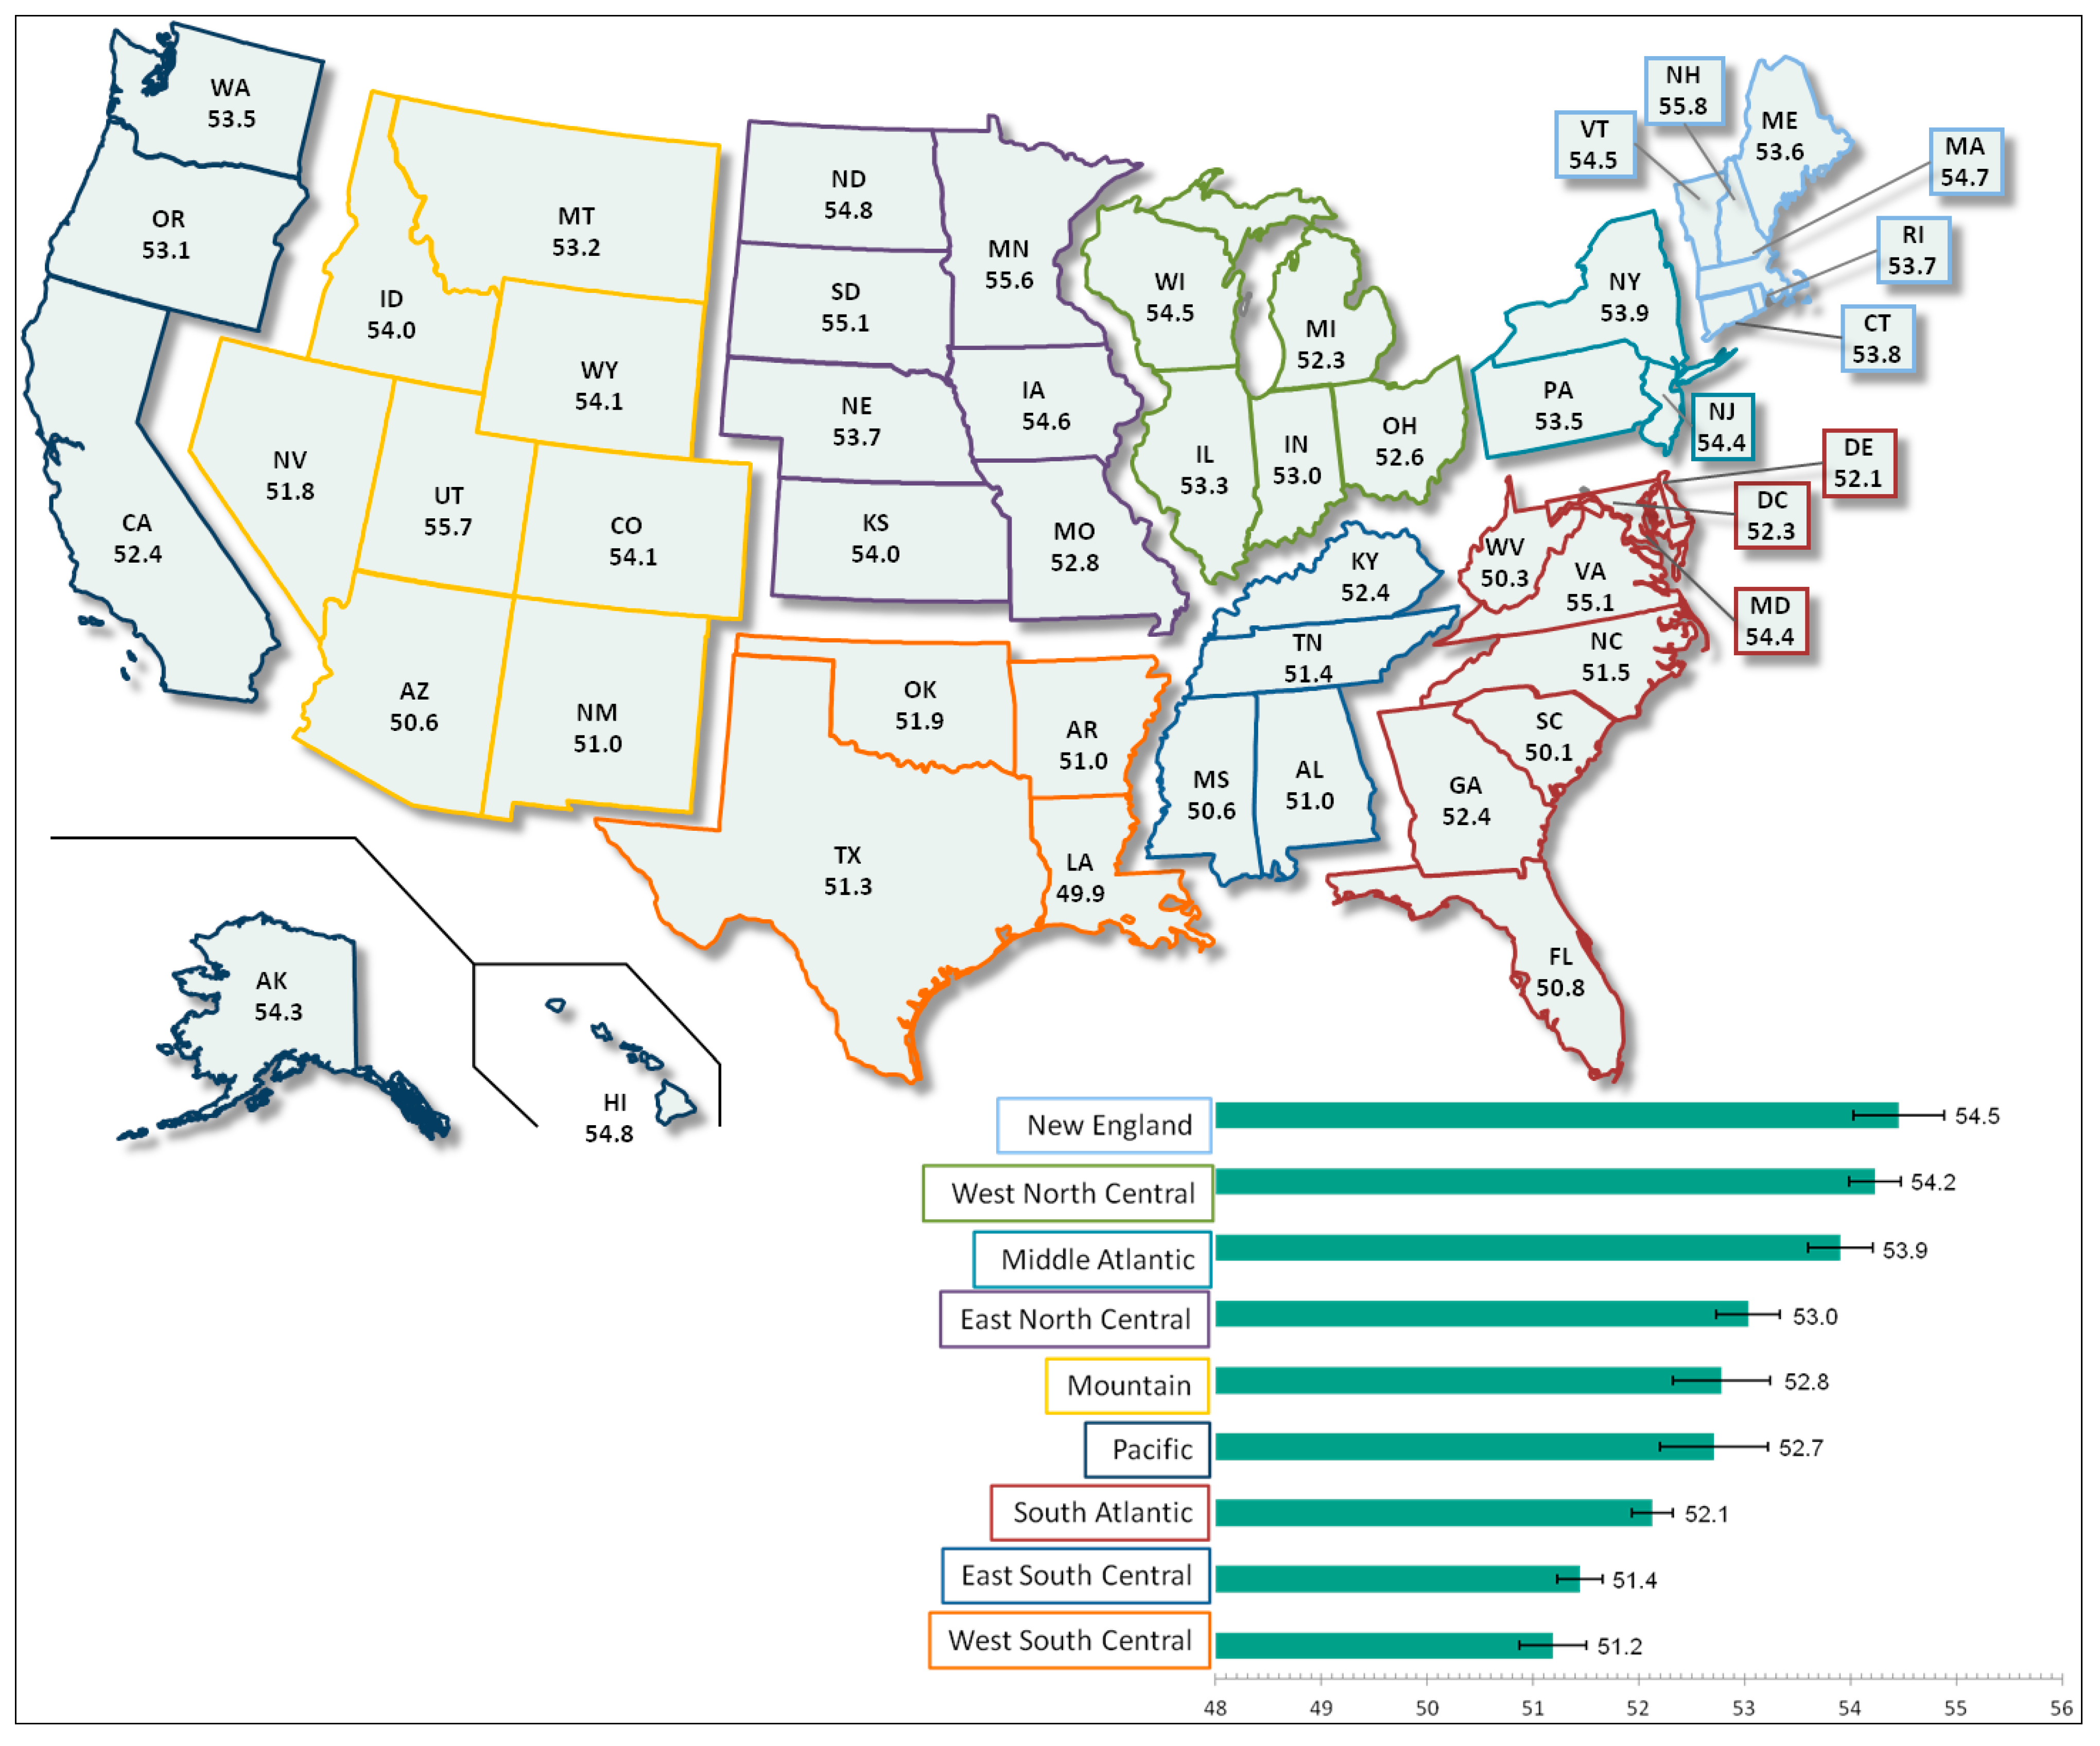
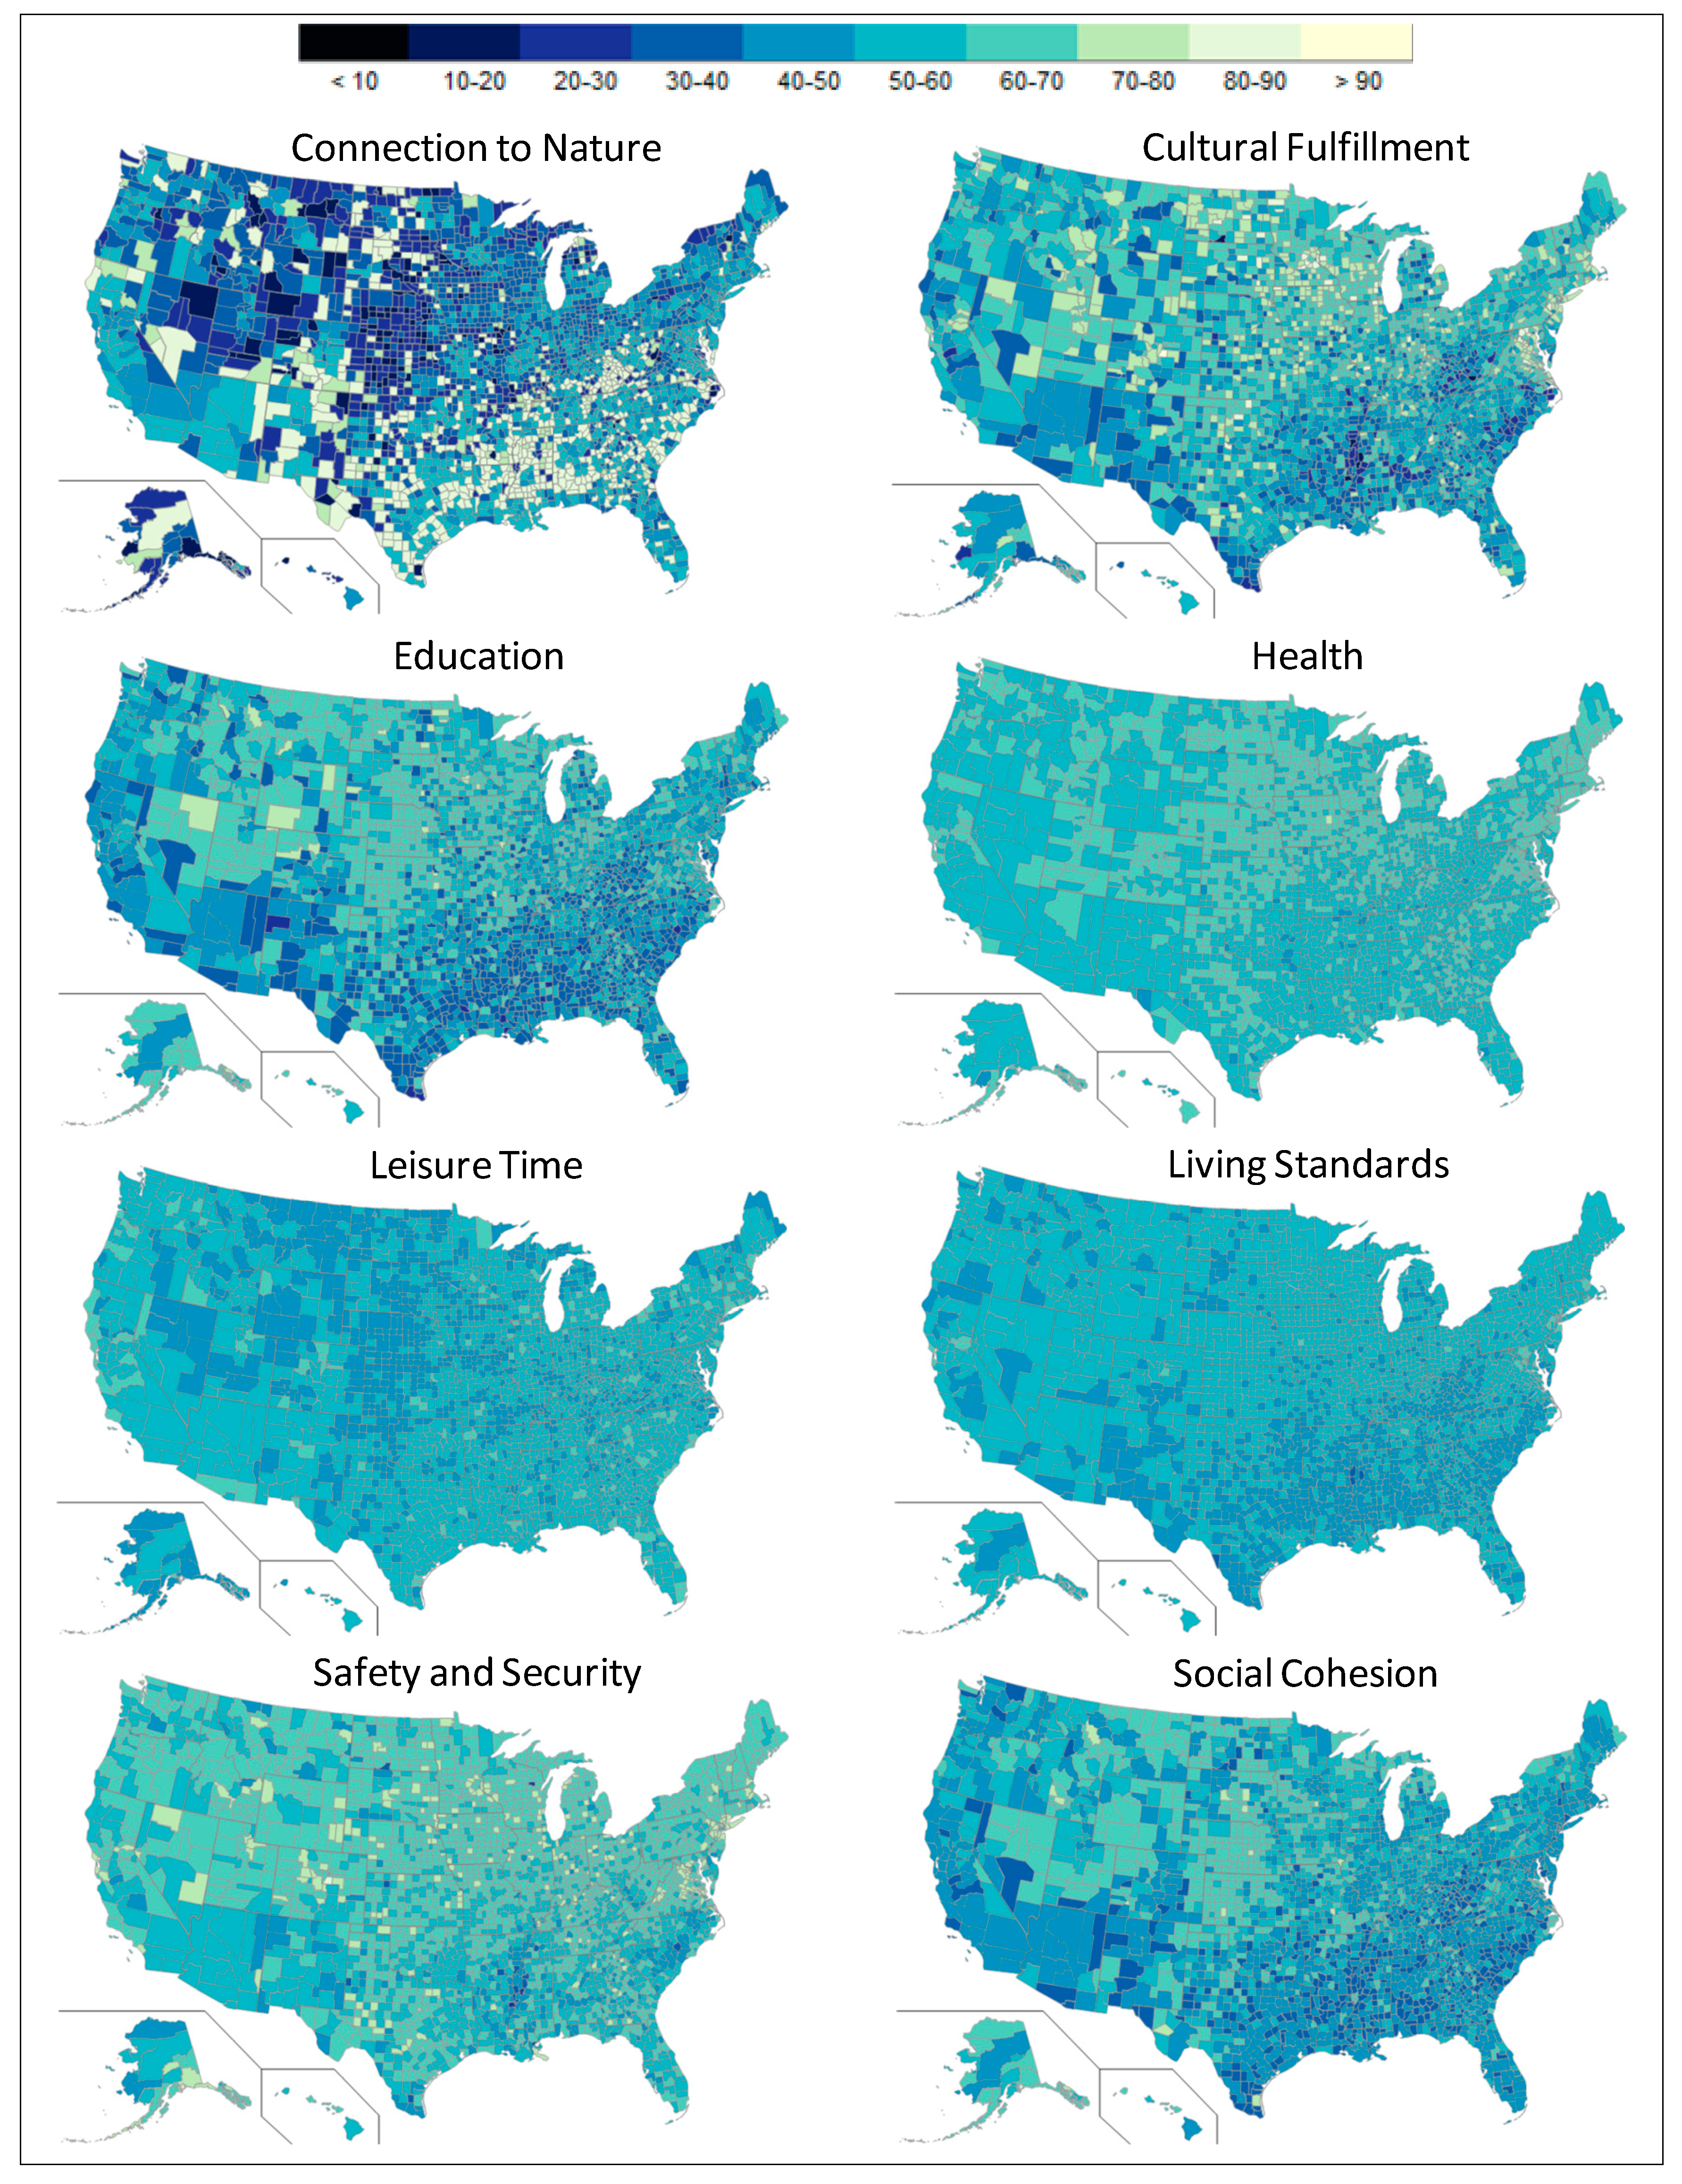
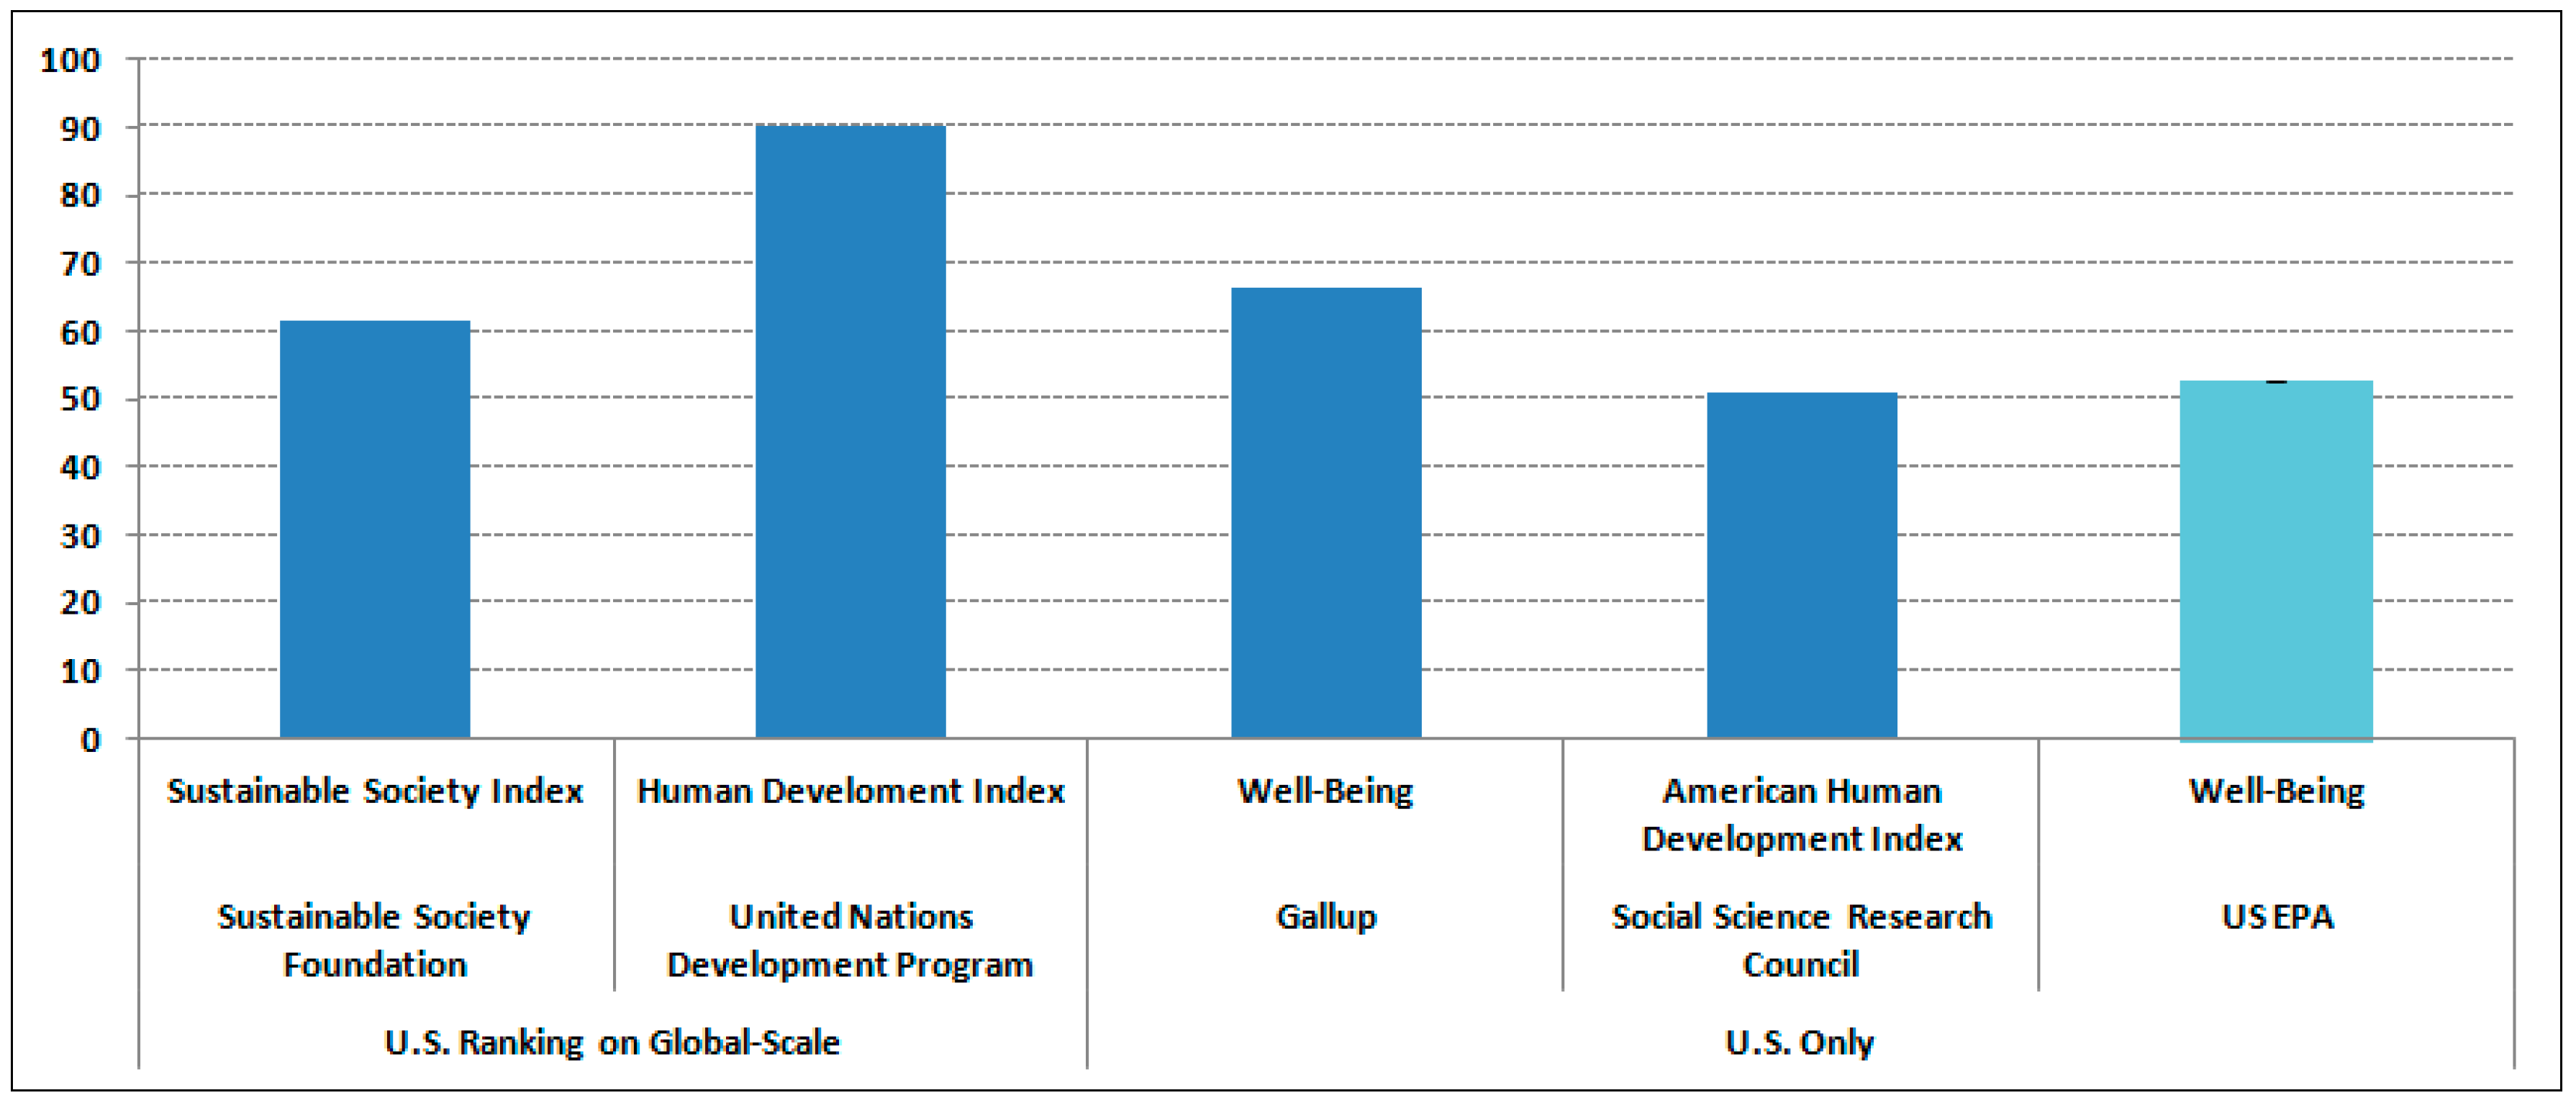
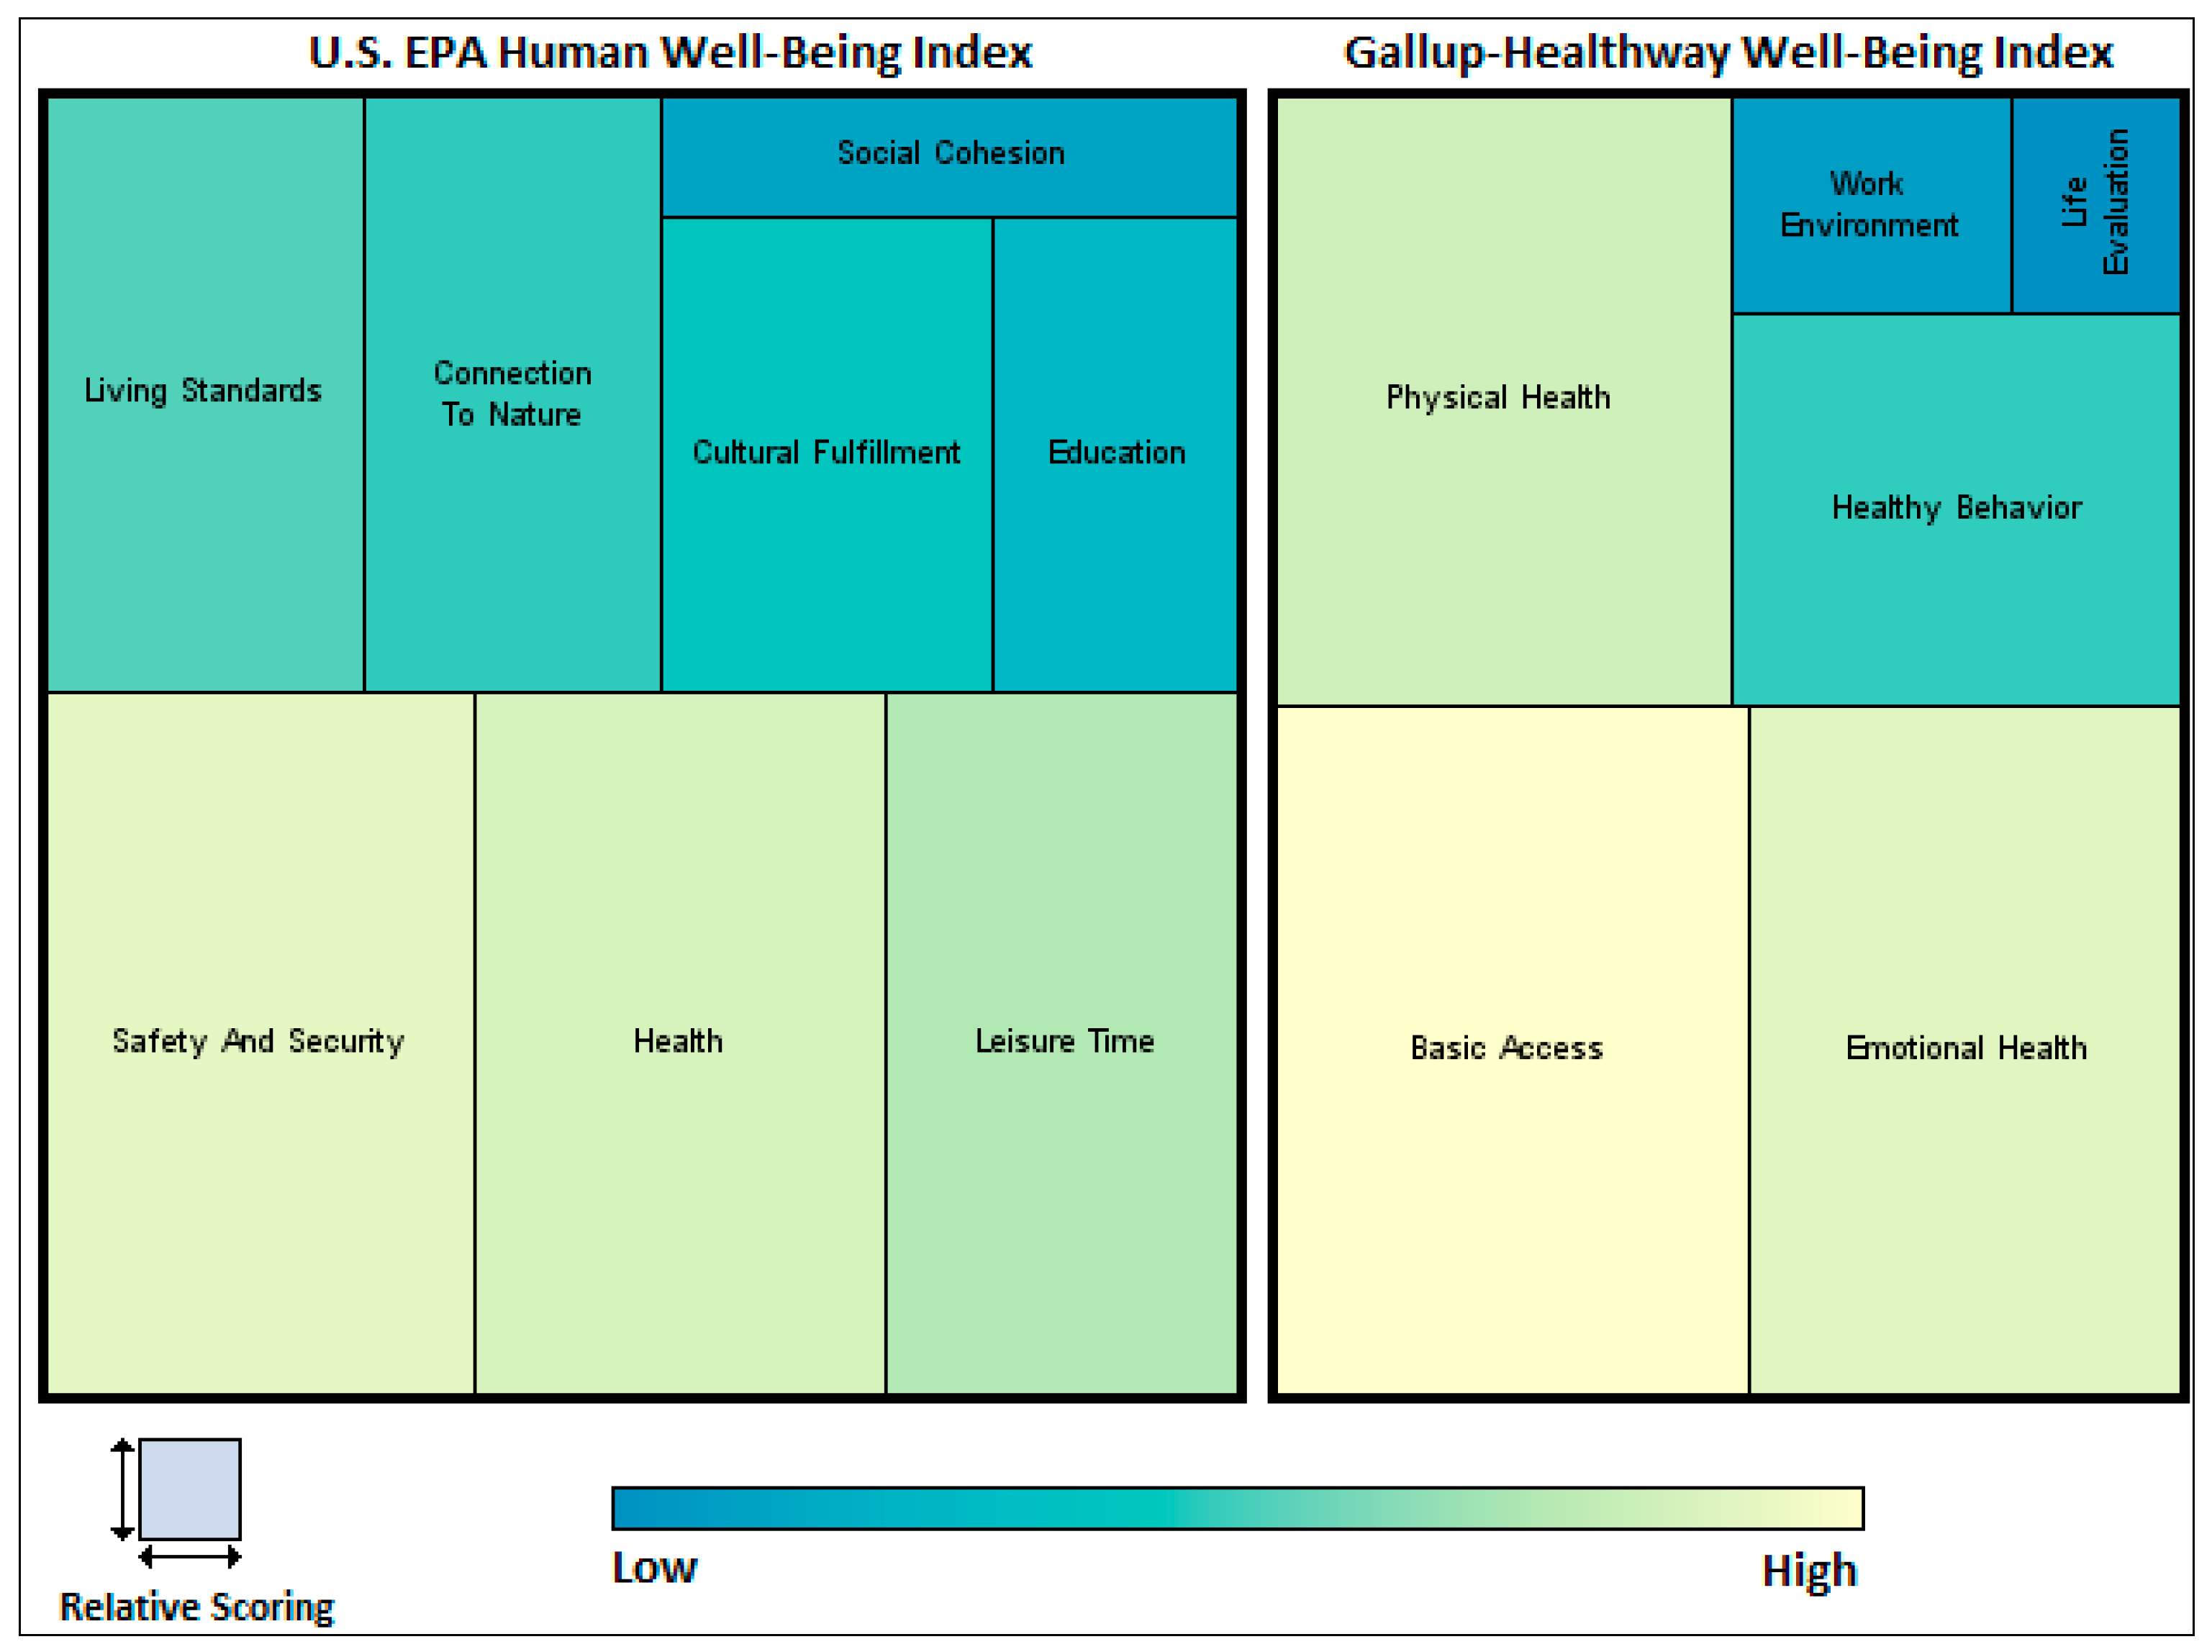
2.3. Index Performance

The performance of the HWBI was assessed by comparing HWBI results with established indices of similar scope to confirm the rationale and soundness of indicator choices and development approach. The indices chosen for comparison (Table 6) [11,18,37,38] shared a common theme—a “measure” of the U.S. for two or more years within the 2000–2010 time frame using a composite value derived from economic, social and environmental indicators.
Using the Kruskal-Wallis test, the indices differed significantly (χ2(5, n = 33) = 30.03, p < 0.0001). Analysis emphasized how scale (i.e., Global versus U.S. only) and data choices influence the perspective of various measures of well-being. For instance, two of four comparison well-being measures focused solely on the U.S. ranking within a global context. For these indices, the U.S. generally scored higher than the HWBI for well-being. Conversely, the HWBI tracked closely with Gallup [23] and Social Science Research Council’s American Human Development Index (AHDI) [37], both U.S. focused indices. HWBI calculations used both subjective and objective metrics, which did not extensively overlap with measures used in Gallup (subjective) and AHDI (objective). Index values for all five indices are presented in Figure 4.
Table 6. List of independent national scale indices used to test the fidelity of the HWBI.
SourceIndex Name
Gallup-HealthwaysWell-Being Index
Social Science Research CouncilAmerican Human Development Index
Sustainable Society FoundationSustainable Society Index
United Nations Development ProgrammeHuman Development Index
Figure 4. Average well-being type measures for four national indices and US EPA’s HWBI—based on reported 2000–2010 results. The calculated error for the HWBI is <1.
Sustainability 06 03915 g004
The HWBI performed most similarly to the Sustainable Society Foundation’s Sustainable Society Index (SSI) [33], the only other composite index calculated using a TRIO-like approach (Figure 5). The average environmental well-being measures were almost identical between the two indices. The sizable discrepancy between the two human/societal well-being measures may be linked to the more global perspective of the SSI. The U.S. ranks in neither the top or bottom 10 countries on the SSI international scale.
Figure 5. Total Resources Impact Outcome (TRIO)-like measures used in the Sustainable Society Index (SSI) and HWBI calculations.
Sustainability 06 03915 g005
The Gallup index is comprised of six indicators, values that were available for this review. Mean indicator scores from Gallup (2008–2010) and mean domain scores from the HWBI (2000–2010) were calculated. The relative scoring assigned to each of the HWBI and Gallup components are depicted as a tree map in Figure 6. This disassembling of the indices accentuates the similarities and differences among the components that contribute to the respective well-being index calculations.
Figure 6. The relative scores (scale 0–100) of Gallup Healthways Well-Being indicators and the HWBI domains.
Sustainability 06 03915 g006

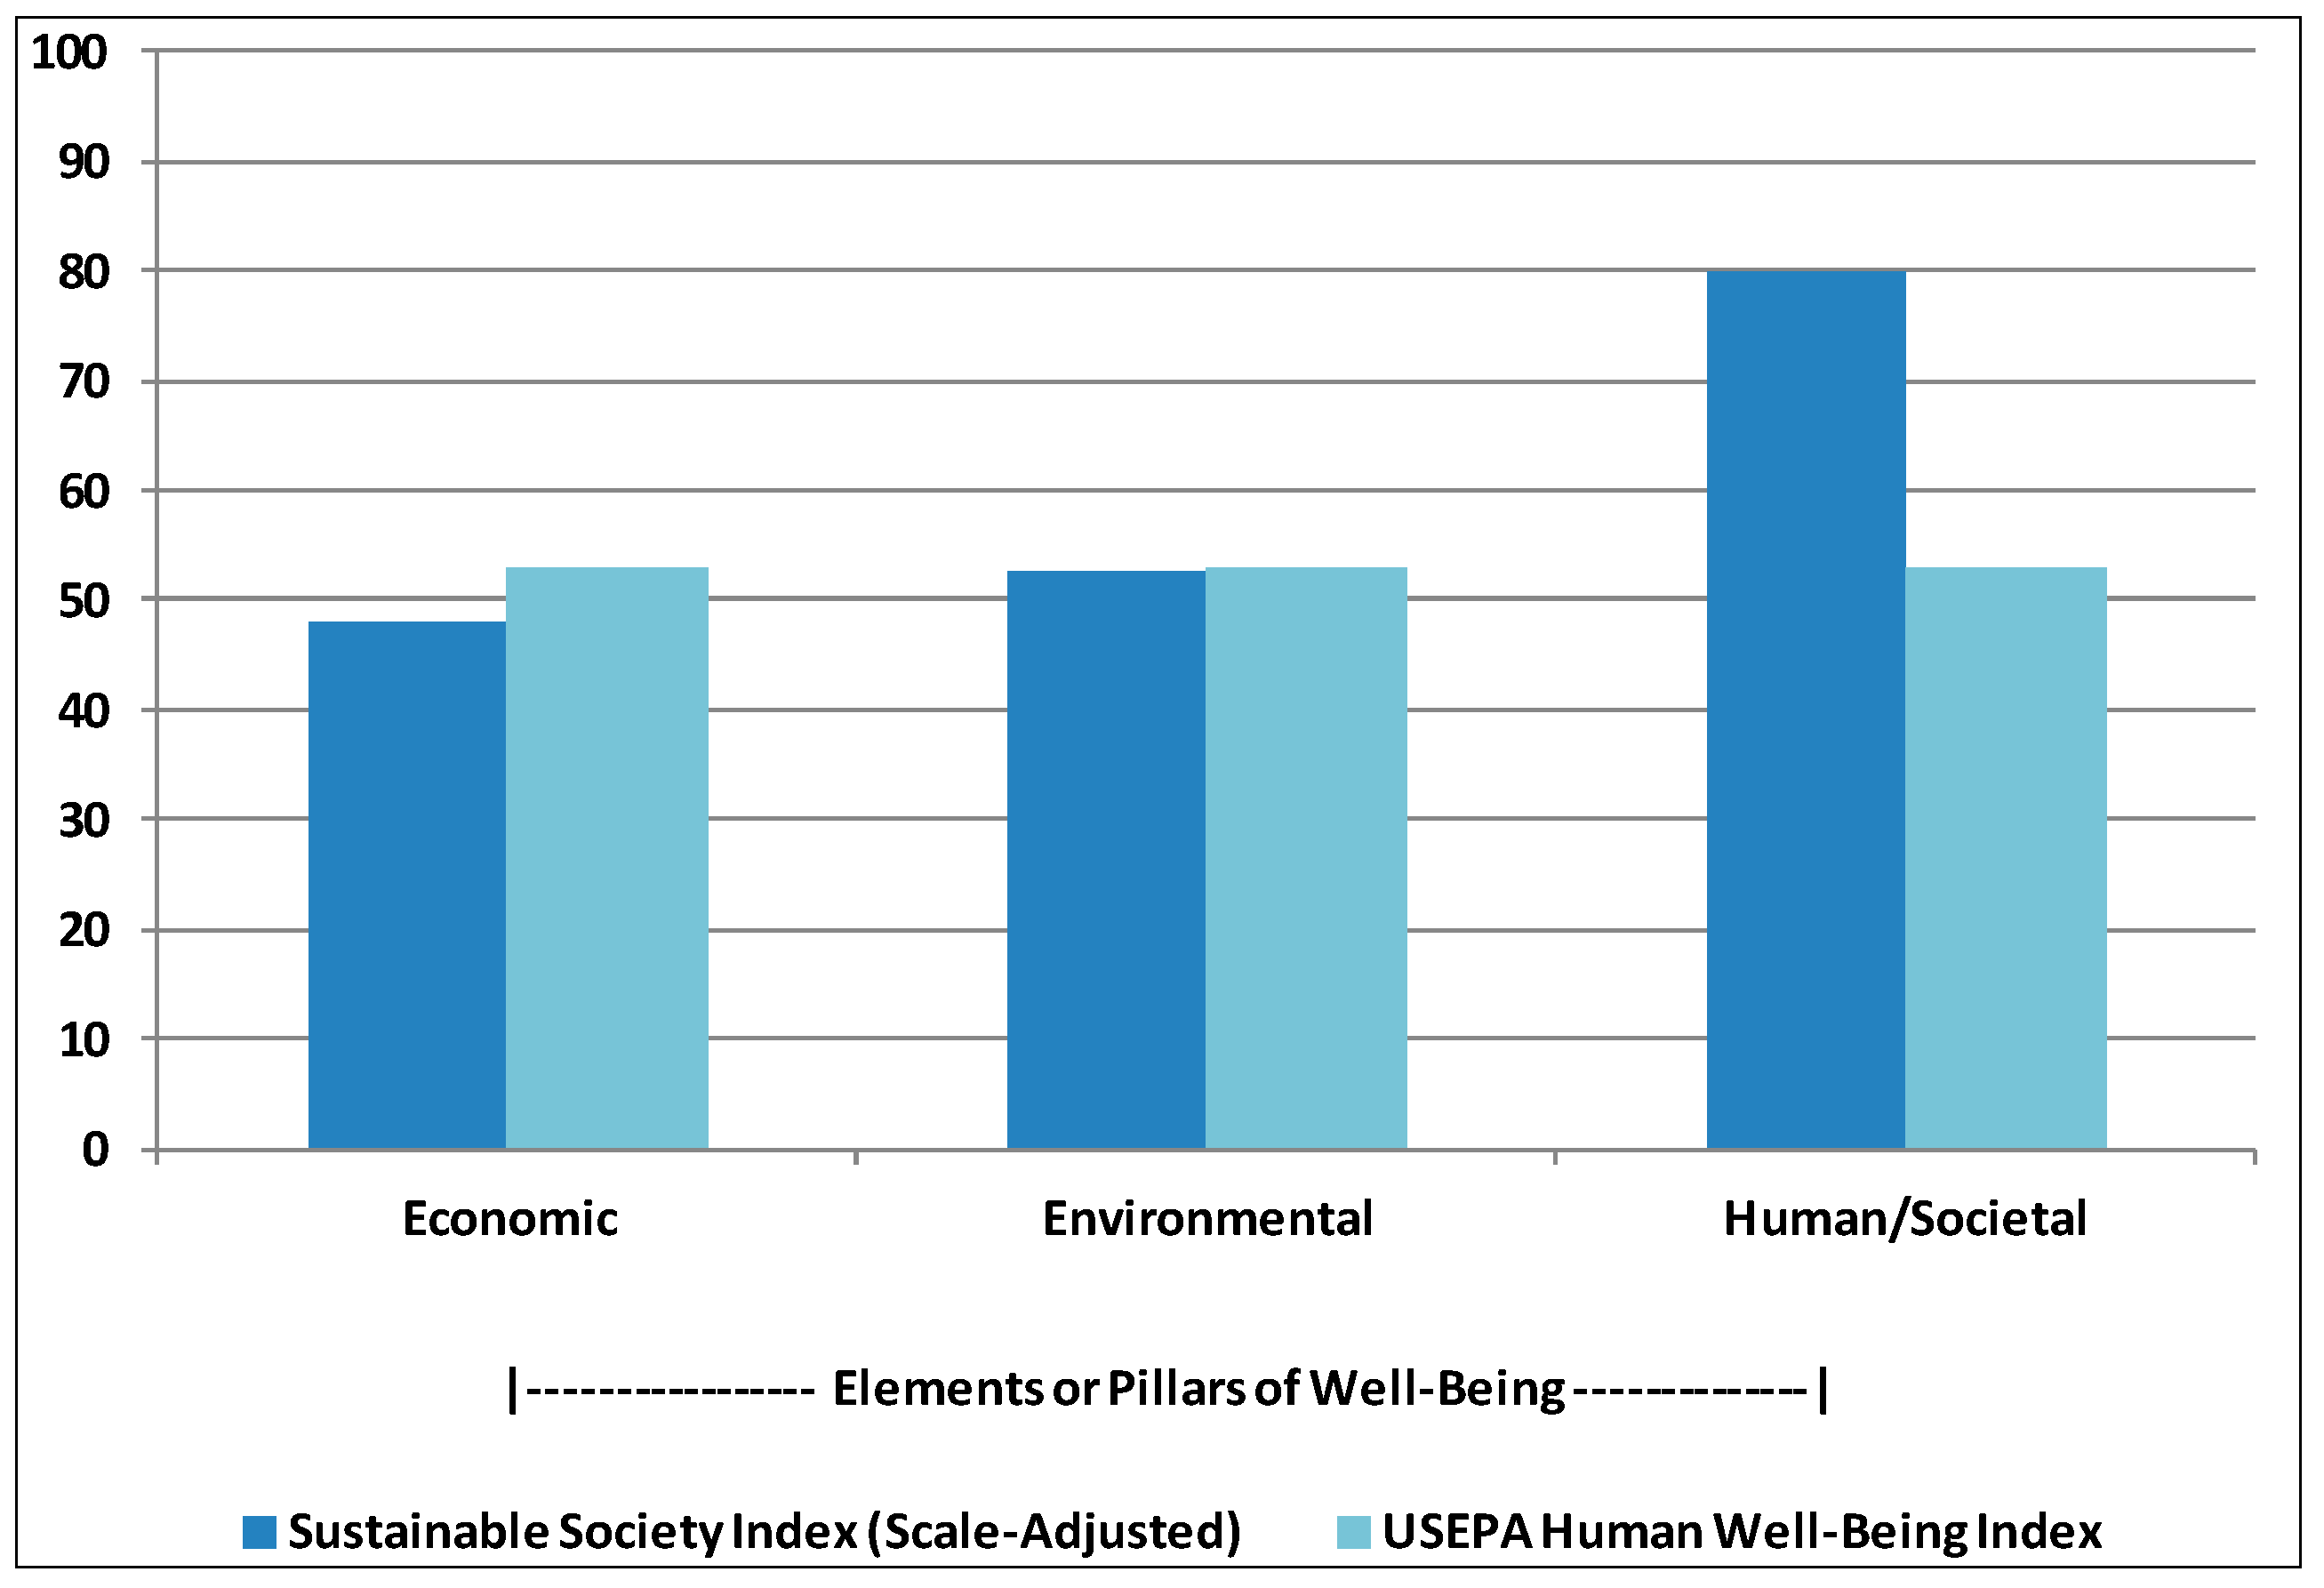
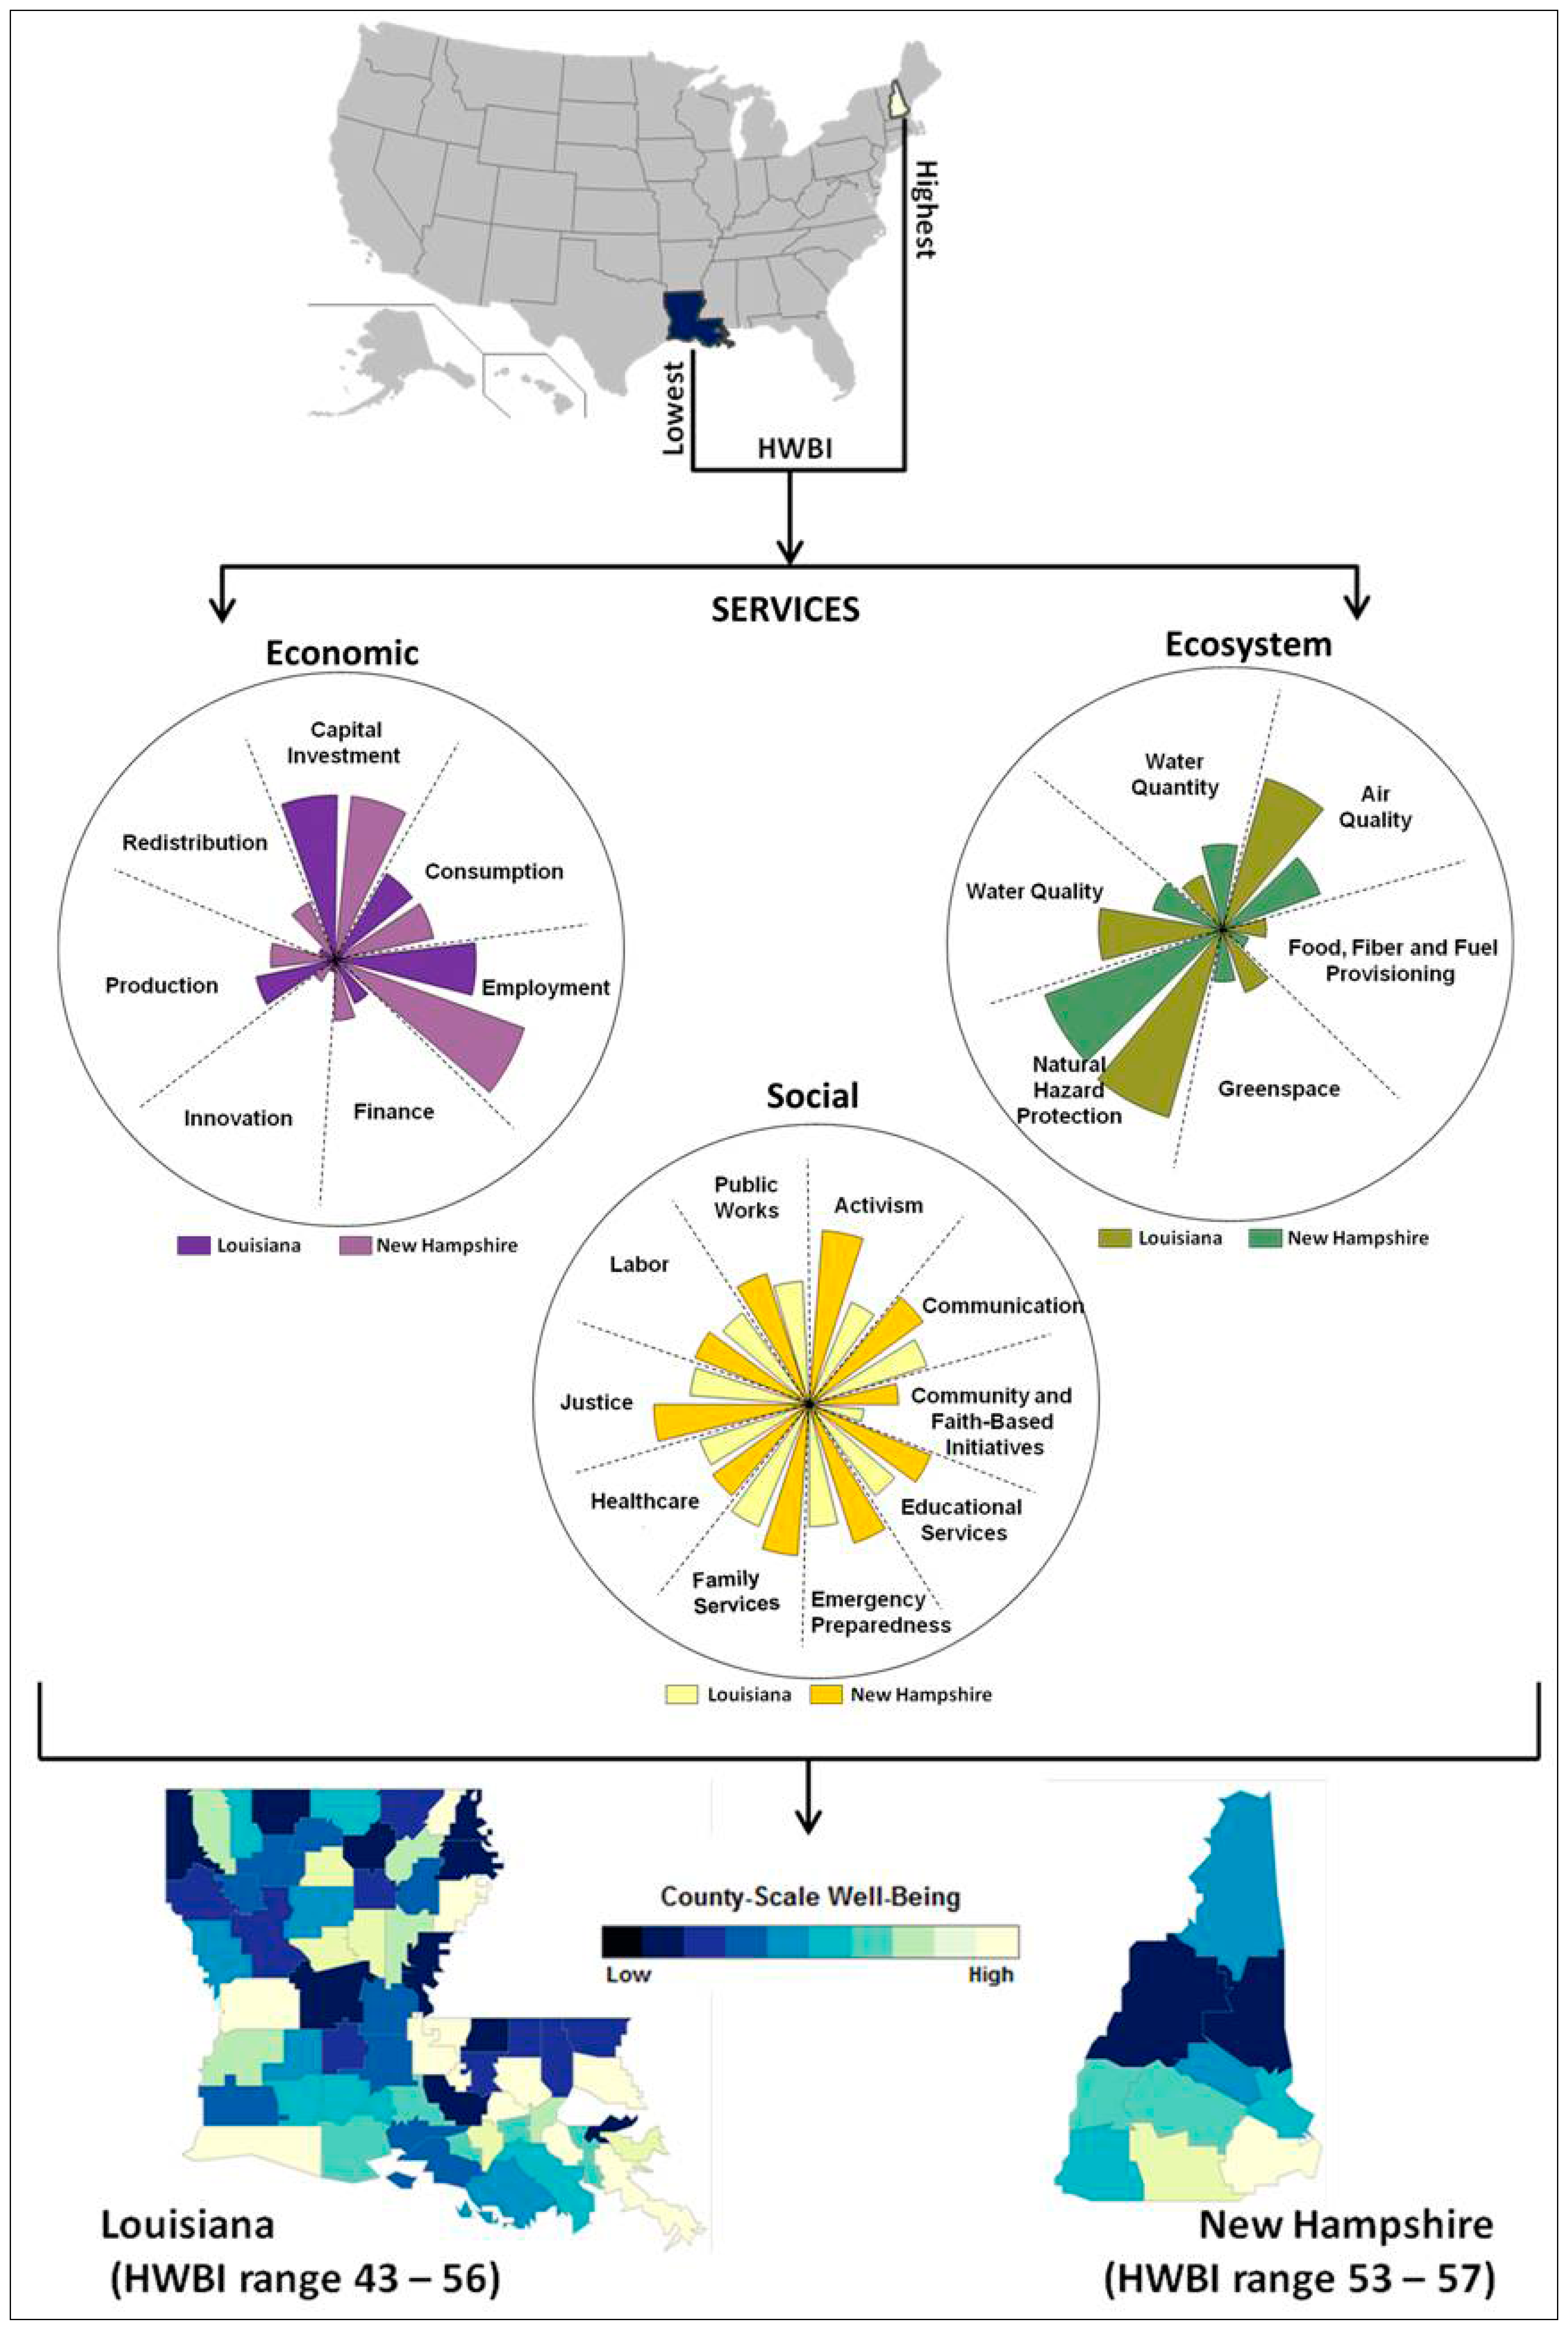
2.4. Well-Being in the Context of TRIO

The HWBI approach generates a measure that characterizes the general state of well-being within the context of the economic, environmental, and social drivers. Metric data quantifying social, natural and built capital provisioning were collected and summarized to help describe the relationship of service flows to overall well-being [28]. To conceptualize well-being as a TRIO measure, service indicators for the states with the highest and lowest HWBI scores were visualized along with the county-level well-being gradient for each of the two states (Figure 7).
Differences across annual HWBI values (2000–2010) for the states reported with the highest and lowest well-being were significant (t = −14.96, p < 0.0001). Similarly, the state-scale services provisioning values for these states were also significantly different (t = −2.43, p < 0.0015). Each combination of service by year scores was compared to the expected median value using a median two-sample test. The overall difference in the number of service provisioning scores that fell either above or below the median value was significant between the states (Figure 8). Ongoing research seeks to expand upon these observations toward developing service-to-domain relationship functions from which alternate HWBI outcomes may be predicted based on changes in the provisioning of reported services and services interactions.
Figure 7. Hierarchical view showing the provisioning of state-level services and county HWBI gradients for states with the highest and the lowest HWBI.
Sustainability 06 03915 g007
Figure 8. Median two-sample test showed a significant difference (χ2(1,N = 253) = 20.6021, p < 0.0001) for services provisioning between states with the lowest and highest HWBI.
Sustainability 06 03915 g008

3. Conclusions

The index presented here offers a necessary measure of the influence of policies and services (environmental, economic and social) on aspects of social welfare and overall human well-being [39].
These integrated concepts of the interactions of social, economic and environmental drivers allow a better understanding of the human condition and its collective relationship to service flows and, thus, will permit decision makers to examine the impact of specific decision alternatives on the well-being of their constituencies. Coupling this type of decision scenario testing with specific targets of social equity and intergenerational equity should also permit selected decisions to create more sustainable conditions for communities [40].
As stated in earlier publications, the primary reason for the development of the HWBI is to include explicit connections between human well-being and environmental drivers and services [9]. Earlier versions of well-being indices (e.g., [6,10,11,12,13,14,15,16,17,18,19,20,21,22,23,24,25,26,27]) were determined to address two of the three pillars of well-being well but to either ignore the third pillar or inadequately address it [9]. The present HWBI described here includes critical aspects of all three pillars of well-being in a balanced manner such that all three pillars contribute to the well-being of the constituency being assessed. Furthermore, the index is fully adjusted to the target community (nation, state, county, community) based on information regarding the value structure of the community using multipliers to reflect the relative importance of elements of the value structure [9].
Increasingly, communities across the U.S. are examining the management of growth through sustainable development. The HWBI approach allows the U.S., states, counties and communities to assess the impact of decisions on the sustained well-being of their constituencies (e.g., effects of economic decisions, both intended and unintended, on social and environmental well-being). Additionally, the HWBI allows these governmental entities to assess not only the direct impacts of decisions (e.g., effects of economic decisions on jobs) but also to assess the indirect impacts (unintended consequences) of these decisions (e.g., economic decisions on social and environmental issues). Many earlier indices focused on the point where human well-being and environmental conditions intersected rather than how they related. The HWBI represents a critical advancement in this area by emphasizing the symbiotic relationships between nature, humans and economies. Similarly, rather than vilifying all human activity as being detrimental to the natural environment, the HWBI embraces that natural ecosystems provide goods and services that are not only directly useful to humans but are essential for their well-being. Since people are the beneficiaries of sustainable solutions, it is essential that metrics reflect the dependence of humans on ecosystems—services provided that contribute to economic and social well-being in order to progress sustainably.
Many obstacles exist in developing comparable measures of human well-being at multiple spatial scales—lack of consistently available data, transparency of performance indicators and domains and cultural differences. In the construction of the HWBI, we have returned to first principles and developed an index that is based on indicators and domains that can be shown to clearly impact well-being. While the data necessary for the HWBI implementation are not always available at smaller spatial scales, they can be collected and applied in a meaningful way at any scale in a meaningful way. Similarly, the value-based weighting factors (RIVs) are collected at the appropriate scale to represent the community and the demographic populations (e.g., socio-economic groups, cultural entities) to which the index is applied. Additionally, in the construction of the HWBI, we have striven to provide transparency information regarding the selection and performance of indicators [28,29,30] and the uncertainty levels associated with their use. With the exception of the connection to nature domain, many of the domains included in the HWBI and their associated indicators and metrics are those commonly used in similar indices developed prior to the HWBI. The HWBI described here sets itself apart from other existing measures, in that: (1) it openly includes metrics associated with all three pillars of sustainability; (2) it provides clear measures of the uncertainty associated with the index; and (3) the approach is easily transferable to any spatial scale for which the appropriate information is available. Our development of the HWBI provides a significant step forward in a community’s (or larger spatial entity’s) ability to assess the short- and long-term impacts of potential decision alternatives on the well-being of their constituencies.

Acknowledgments

The authors would like to acknowledge to intellectual support of Rick Linthurst and Michael Slimak, past and present National Program Directors for EPA ORD’s Sustainable and Healthy Communities (SHC) Research Program. Additionally, we would like to acknowledge the contributions of Elizabeth Smith, Kathryn Saterson, Iris Goodman and Rochelle Araujo to the original development of the acronym TRIO in the SHC program.

Author Contributions

The first three co-authors (Summers, L. Smith and Harwell) contributed equally to the reported research in terms of conception and design, acquisition and analysis and interpretation of data. The remaining authors (Case, Straub and H. Smith) contributed to data acquisition, analysis and interpretation. The corresponding author was the primarily responsible for drafting and revising the article. All authors contributed to the final approval of the version to be published of the paper.

Conflicts of Interest

The authors declare no conflict of interest.

References

  1. U.S. Environmental Protection Agency (USEPA). Indicators and Methods for Constructing a U.S. Human Well-being Index (HWBI) for Ecosystem Services Research; EPA/600/R-12/023; USEPA/ORD/NHEERL: Washington, DC, USA, 2012; p. 120. [Google Scholar]
  2. U.S. Environmental Protection Agency (USEPA). Indicators and Methods for Constructing a U.S. Tribal Well-being Index for Sustainable and Healthy Communities Research; Supplement 1 to EPA/600/R-12-023; USEPA: Washington, DC, USA, 2014; p. 24. [Google Scholar]
  3. U.S. Environmental Protection Agency (USEPA). Indicators and Methods for Evaluating Ecosystem, Economic and Social Services Provisioning; draft; USEPA: Washington, DC, USA, 2014; p. 115. [Google Scholar]
  4. U.S. Environmental Protection Agency (USEPA). Sustainable and Healthy Communities: Strategic Research Action Plan 2012–2016; EPA 601/R-12/005; USEPA/Office of Research and Development: Washington, DC, USA, 2012. [Google Scholar]
  5. Elkington, J. The triple bottom line for 21st century business. In The Earthscan Reader in Business and Sustainable Development; Sterling Publishers: London, UK, 2001; pp. 20–43. [Google Scholar]
  6. Willard, B. The Sustainability Advantage: Seven Business Case Benefits of a Triple Bottom Line; New Society Publishers: Gabriola Island, BC, Canada, 2002. [Google Scholar]
  7. Savitz, A.W.; Weber, K. The Triple Bottom Line: How Today’s Best-Run Companies Are Achieving Economic, Social and Environmental Success—And How You Can Too; Jossey-Bass Publishing Company: San Francisco, CA, USA, 2006. [Google Scholar]
  8. Phillips, P.P.; Phillips, J.J. The Green Scorecard; Nicholas Beasley Publishing: Boston, MA, USA, 2011. [Google Scholar]
  9. Marks, N.; Simms, A.; Thompson, S.; Abdallah, S. The Happy Planet Index: An Index of Human Well-Being and Environmental Impact; New Economics Foundation: London, UK, 2006. [Google Scholar]
  10. World Health Organization. Ecosystems and Human Well-Being: Health Synthesis; WHO Press: Geneva, Switzerland, 2005. [Google Scholar]
  11. Wackernagel, M.; Schultz, N.; Deumling, D.; Linares, A.; Kapos, V.; Montfredo, C.; Loh, J.; Myers, N.; Norgaard, R.; Rardis, J. Tracking the ecological overshoot of the human economy. Proc. Natl. Acad. Sci. USA 2002, 99, 9266–9271. [Google Scholar] [CrossRef]
  12. Smith, L.M.; Case, J.L.; Smith, H.M.; Harwell, L.C.; Summers, J.K. Relating ecosystem services to domains of human well-being: Foundation for a U.S. index. Ecol. Indic. 2013, 28, 79–90. [Google Scholar] [CrossRef]
  13. Economist Intelligence Unit (EIU). The Economist Intelligence Unit’s quality-of-Life Index. Available online: http://www.economist.com/media/pdf/QUALITY_OF_LIFE.pdf (accessed on 20 February 2014).
  14. Cummins, R.A.; Eckersley, R.; Pallant, J.; van Vugt, J.; Msagon, R. Developing a national index of subjective well-being: The Australian Unity Wellbeing Index. Soc. Indic. Res. 2003, 64, 159–190. [Google Scholar] [CrossRef]
  15. United Nations Development Programme. Human Development Index. In Human Development Reports: Indices & Data. Available online: http://hdr.undp.org/en/statistics/hdi/ (accessed on 3 December 2013).
  16. Diener, E.D. A value based index for measuring national quality of life. Soc. Indic. Res. 1995, 36, 107–127. [Google Scholar] [CrossRef]
  17. Prescott-Allen, R. The Wellbeing of Nations: A Country-by-Country Index of Quality of Life and the Environment; Island Press: Washington, DC, USA, 2001. [Google Scholar]
  18. Van de Kerk, G.; Manuel, A.R. A comprehensive index for a sustainable society: The SSI—The Sustainable Society Index. Ecol. Econ. 2008, 66, 228–242. [Google Scholar] [CrossRef]
  19. Chan, Y.; Kwan, C.; Shek, T. Quality of life in Hong Kong: The CUHK Kong Kong quality of life index. Soc. Indic. Res. 2005, 71, 259–289. [Google Scholar] [CrossRef]
  20. Distaso, A. Well-being and/or quality of life in EU countries through a multi-dimensional index of sustainability. Ecol. Econ. 2007, 64, 163–180. [Google Scholar] [CrossRef]
  21. Vemuri, A.W.; Costanza, R. The role of human, social, built, and natural capital in explaining life satisfaction at the country level: Towards a National Well-Being Index (NWI). Ecol. Econ. 2006, 58, 119–133. [Google Scholar] [CrossRef]
  22. Land, K.C.; Lamb, V.L.; Mustillo, S.K. Child and youth well-being in the United States 1975–1998: Some findings from a new index. Soc. Indic. Res. 2001, 56, 241–318. [Google Scholar] [CrossRef]
  23. Institute of Well-Being. How Are Canadians Really Doing? The First Report of the Institute of Well-Being. Available online: http://www.ciw.ca/en/TheCanadianIndexofWellbeing.aspx (accessed on 20 February 2014).
  24. Bradshaw, G.A.; Richardson, D. An index of child well-being in Europe. Child Indic. Res. 2009, 2, 319–351. [Google Scholar]
  25. Miringoff, M.; Miringoff, M.L. The Social Health of the Nation: How America is Really Doing; Oxford Press: New York, NY, USA, 1999. [Google Scholar]
  26. Gallup-Healthways. Well-Being Index. In Gallup Well-Being. Available online: http://www.gallup.com/poll/125066/State-States.aspx (accessed on 9 April 2014).
  27. Watts, A. New Index Measures Well-Being and Ranks Kentucky. Foresight 11 2004. Available online: http://kltprc.info/foresight/Vol11no1.pdf (accessed on 20 February 2014).
  28. Jamieson, K. Quality of Life 07 in Twelve of New Zealand Cities. The Quality of Life Project. Available online: http://www.qualityoflifeproject.govt.nz (accessed on 20 February 2014).
  29. Pannozzo, L.; Colman, R.; Ayer, N.; Charles, T.; Burbridge, C.; Sawyer, D.; Stiebert, S.; Savelson, A.; Dodds, C. The 2008 Nova Scotia GPI Accounts: Indicators of Genuine Progress GPI Atlantic; GPI Atlantic: Glen Haven, NS, Canada, 2009. [Google Scholar]
  30. Ura, K. Explanation of GNH Index. Gross National Happiness. The Centre for Bhutan Studies. Available online: http://www.grossnationalhappiness.com/gnhindex/introductionGNH.aspx#_ftn1 (accessed on 20 February 2014).
  31. Zhang, S.; Liao, J.; Zhu, Z. A SAS® Macro for Single Imputation. In Proceedings of the Annual Pharmaceutical Industry SAS Users Group, Atlanta, GA, USA, 1–4 June 2008.
  32. USDA. Rural-Urban Continuum Codes: Documentation. USDA Economic Research Services. Available online: http://www.ers.usda.gov/data-products/rural-urban-continuum-codes/documentation.aspx#.Ufpo49LVCfU (accessed on 20 February 2014).
  33. US Census Bureau. Household Income Inequality within U.S. Counties: 2006–2010 American Community Survey Briefs; ACSBR/10-18; US Census Bureau: Suitland, MD, USA, 2012. [Google Scholar]
  34. OECD. Compendium of OECD Well-Being Indicators. Paris, France. Available online: http://www.oecd.org/document/28/0,3746,en.2649.201185.47916764.1.1.1,00.html (accessed on 20 February 2014).
  35. Smith, L.M.; Case, J.L.; Harwell, L.C.; Smith, H.M.; Summers, J.K. Development of relative importance values as contribution weights for evaluating human wellbeing: An ecosystem services example. Hum. Ecol. 2013, 41, 631–641. [Google Scholar] [CrossRef]
  36. Tampa’s Well-Being: A Demonstration of a Human Well-Being Index. Available online: http://www.epa.gov/ged/tbes/tampaswellbeing.html (accessed on 11 June 2014).
  37. Social Science Research Council. About Human Development. In Measure of America. Available online: http://www.measureofamerica.org/human-development/ (accessed on 3 December 2013).
  38. Sustainable Society Foundation. Sustainable Society Index. In Sustainable Society Index—Your Compass to Sustainability. Available online: http://www.ssfindex.com/about-ssf/ (accessed on 2 December 2013).
  39. Summers, J.K.; Smith, L.M.; Case, J.; Linthurst, R.A. A review of the elements of human wellbeing with an emphasis on the contributions of ecosystem services. AMBIO 2012, 41, 327–340. [Google Scholar] [CrossRef]
  40. Summers, J.K.; Smith, L.M. The role of social and intergenerational equity in making changes in human well-being sustainable. AMBIO 2014. [Google Scholar] [CrossRef]

