Assessing Heat Health Risk for Sustainability in Beijing’s Urban Heat Island


Abstract
:1. Introduction
2. Methods
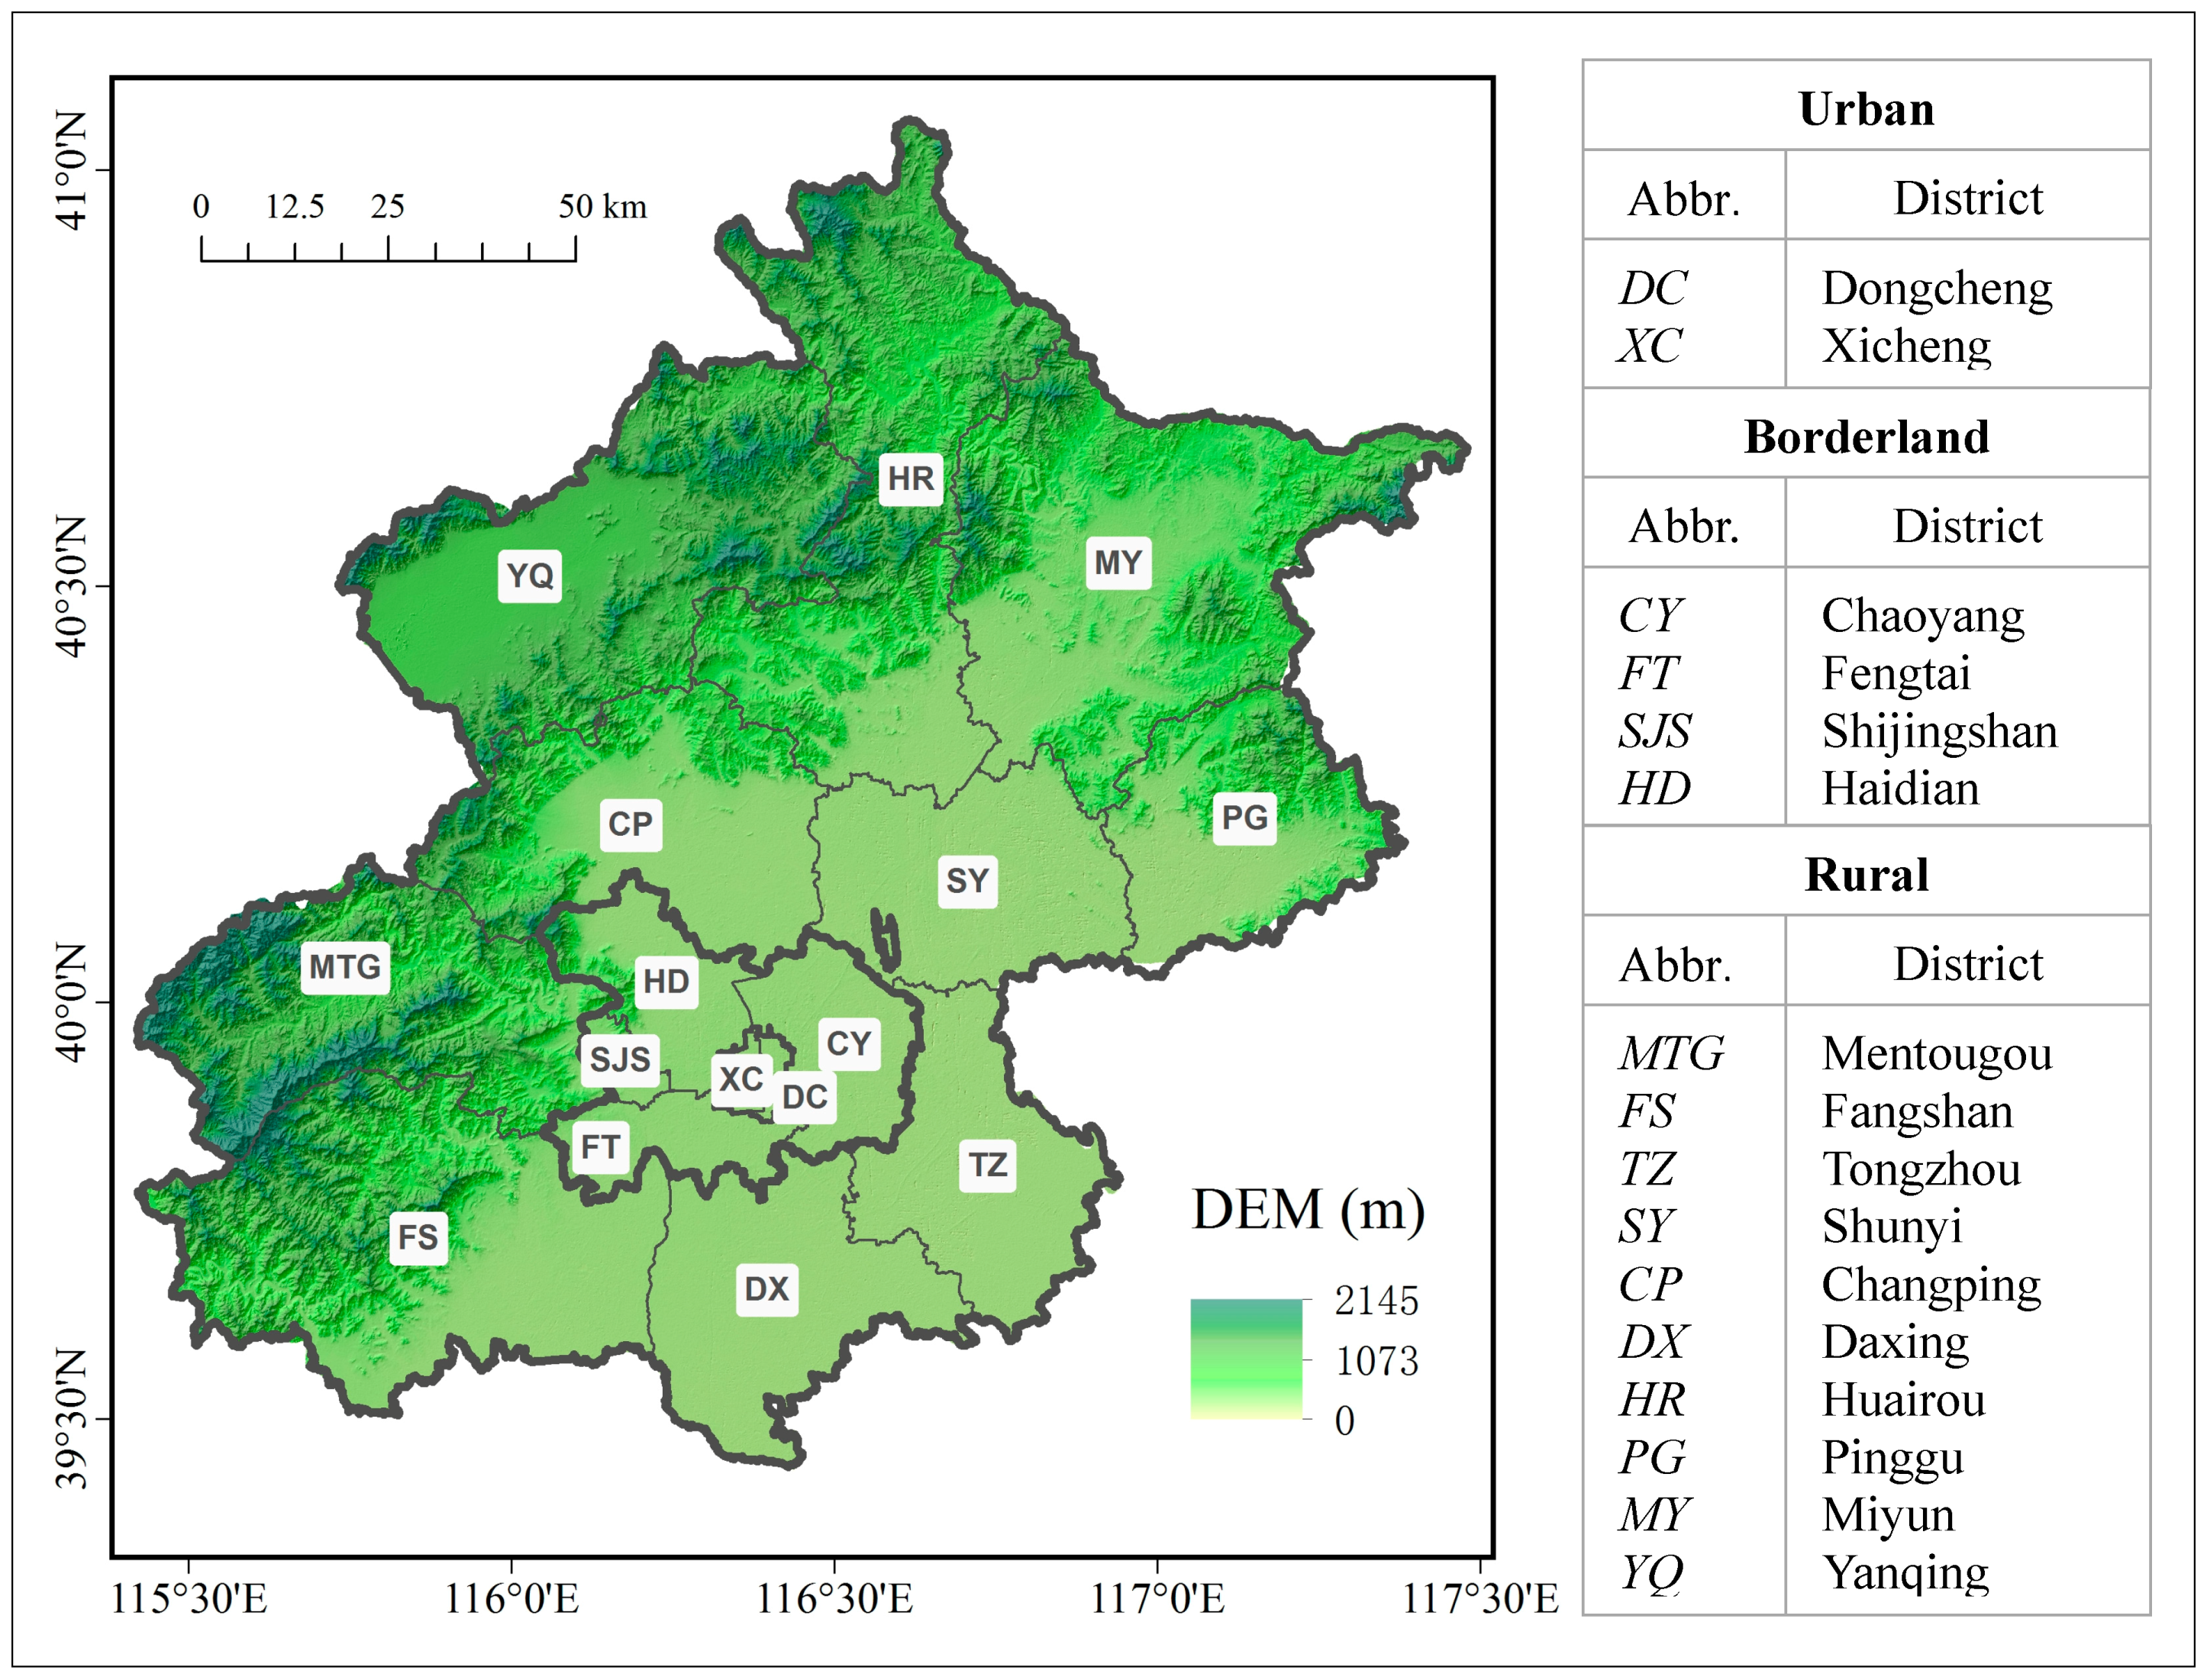
2.1. Study Area

2.2. Hazard

2.3. Vulnerability
2.4. Environment
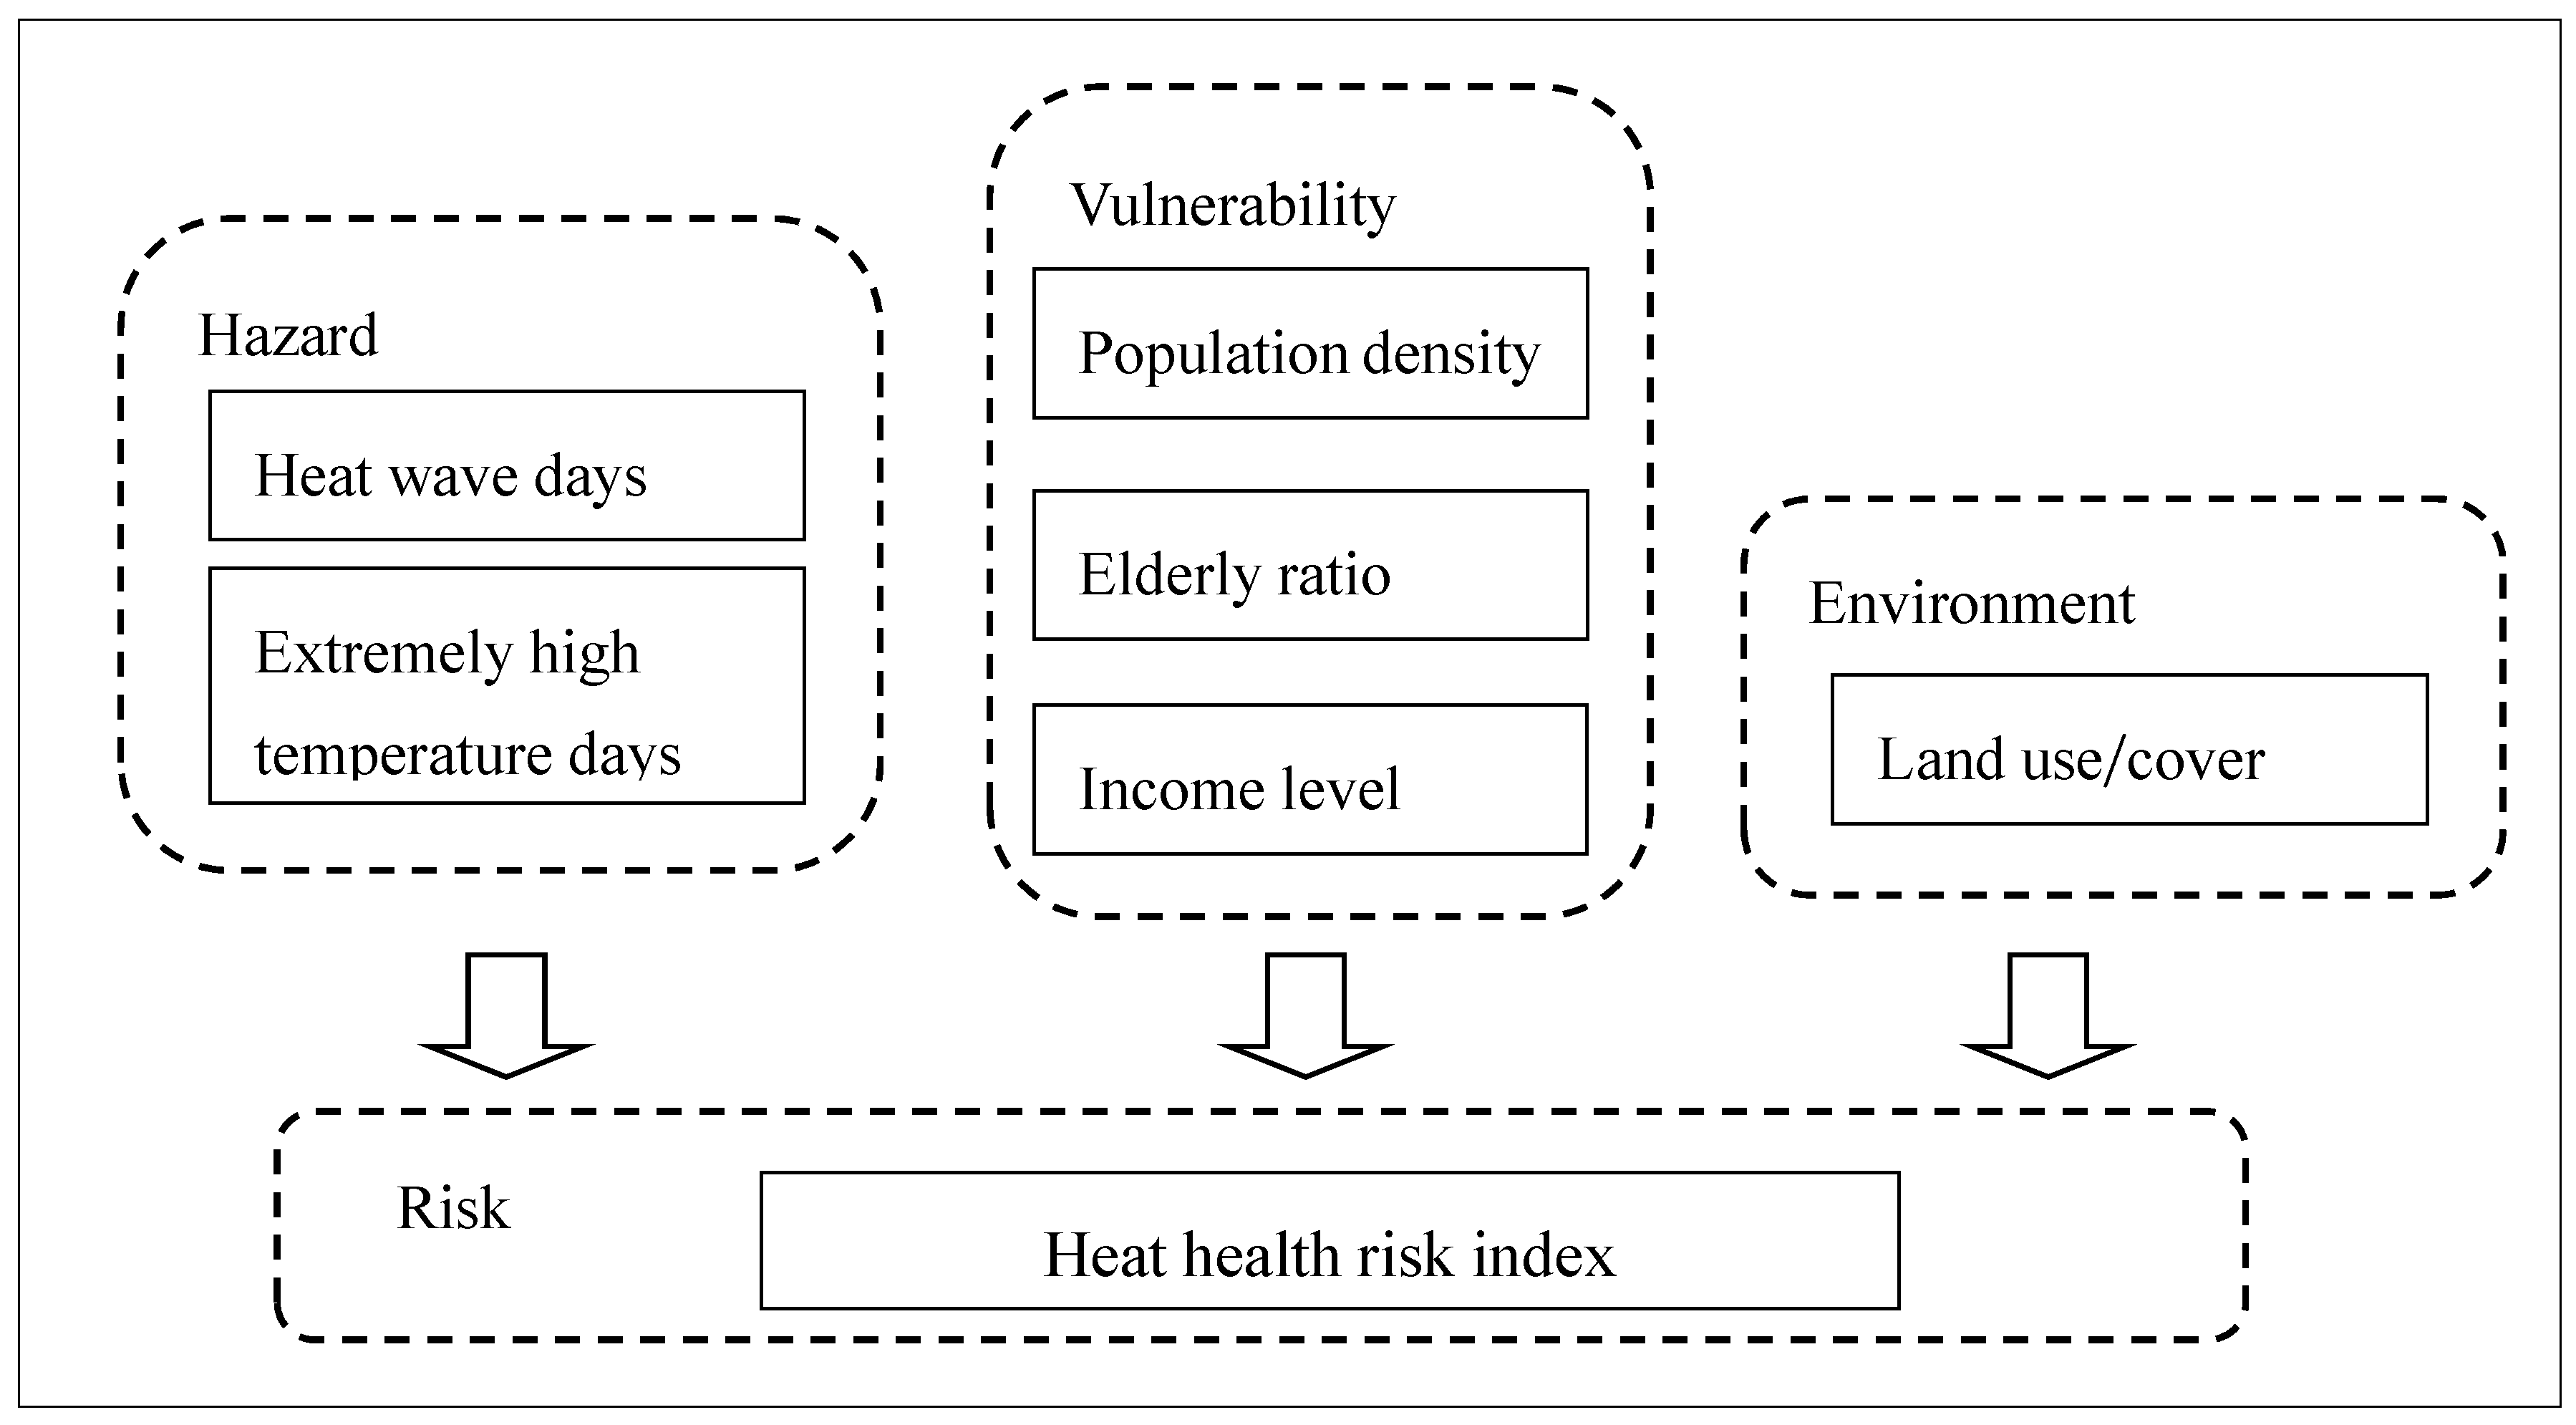
2.5. Spatial Heat Health Risk Assessment

3. Results
3.1. Hazard

3.2. Vulnerability

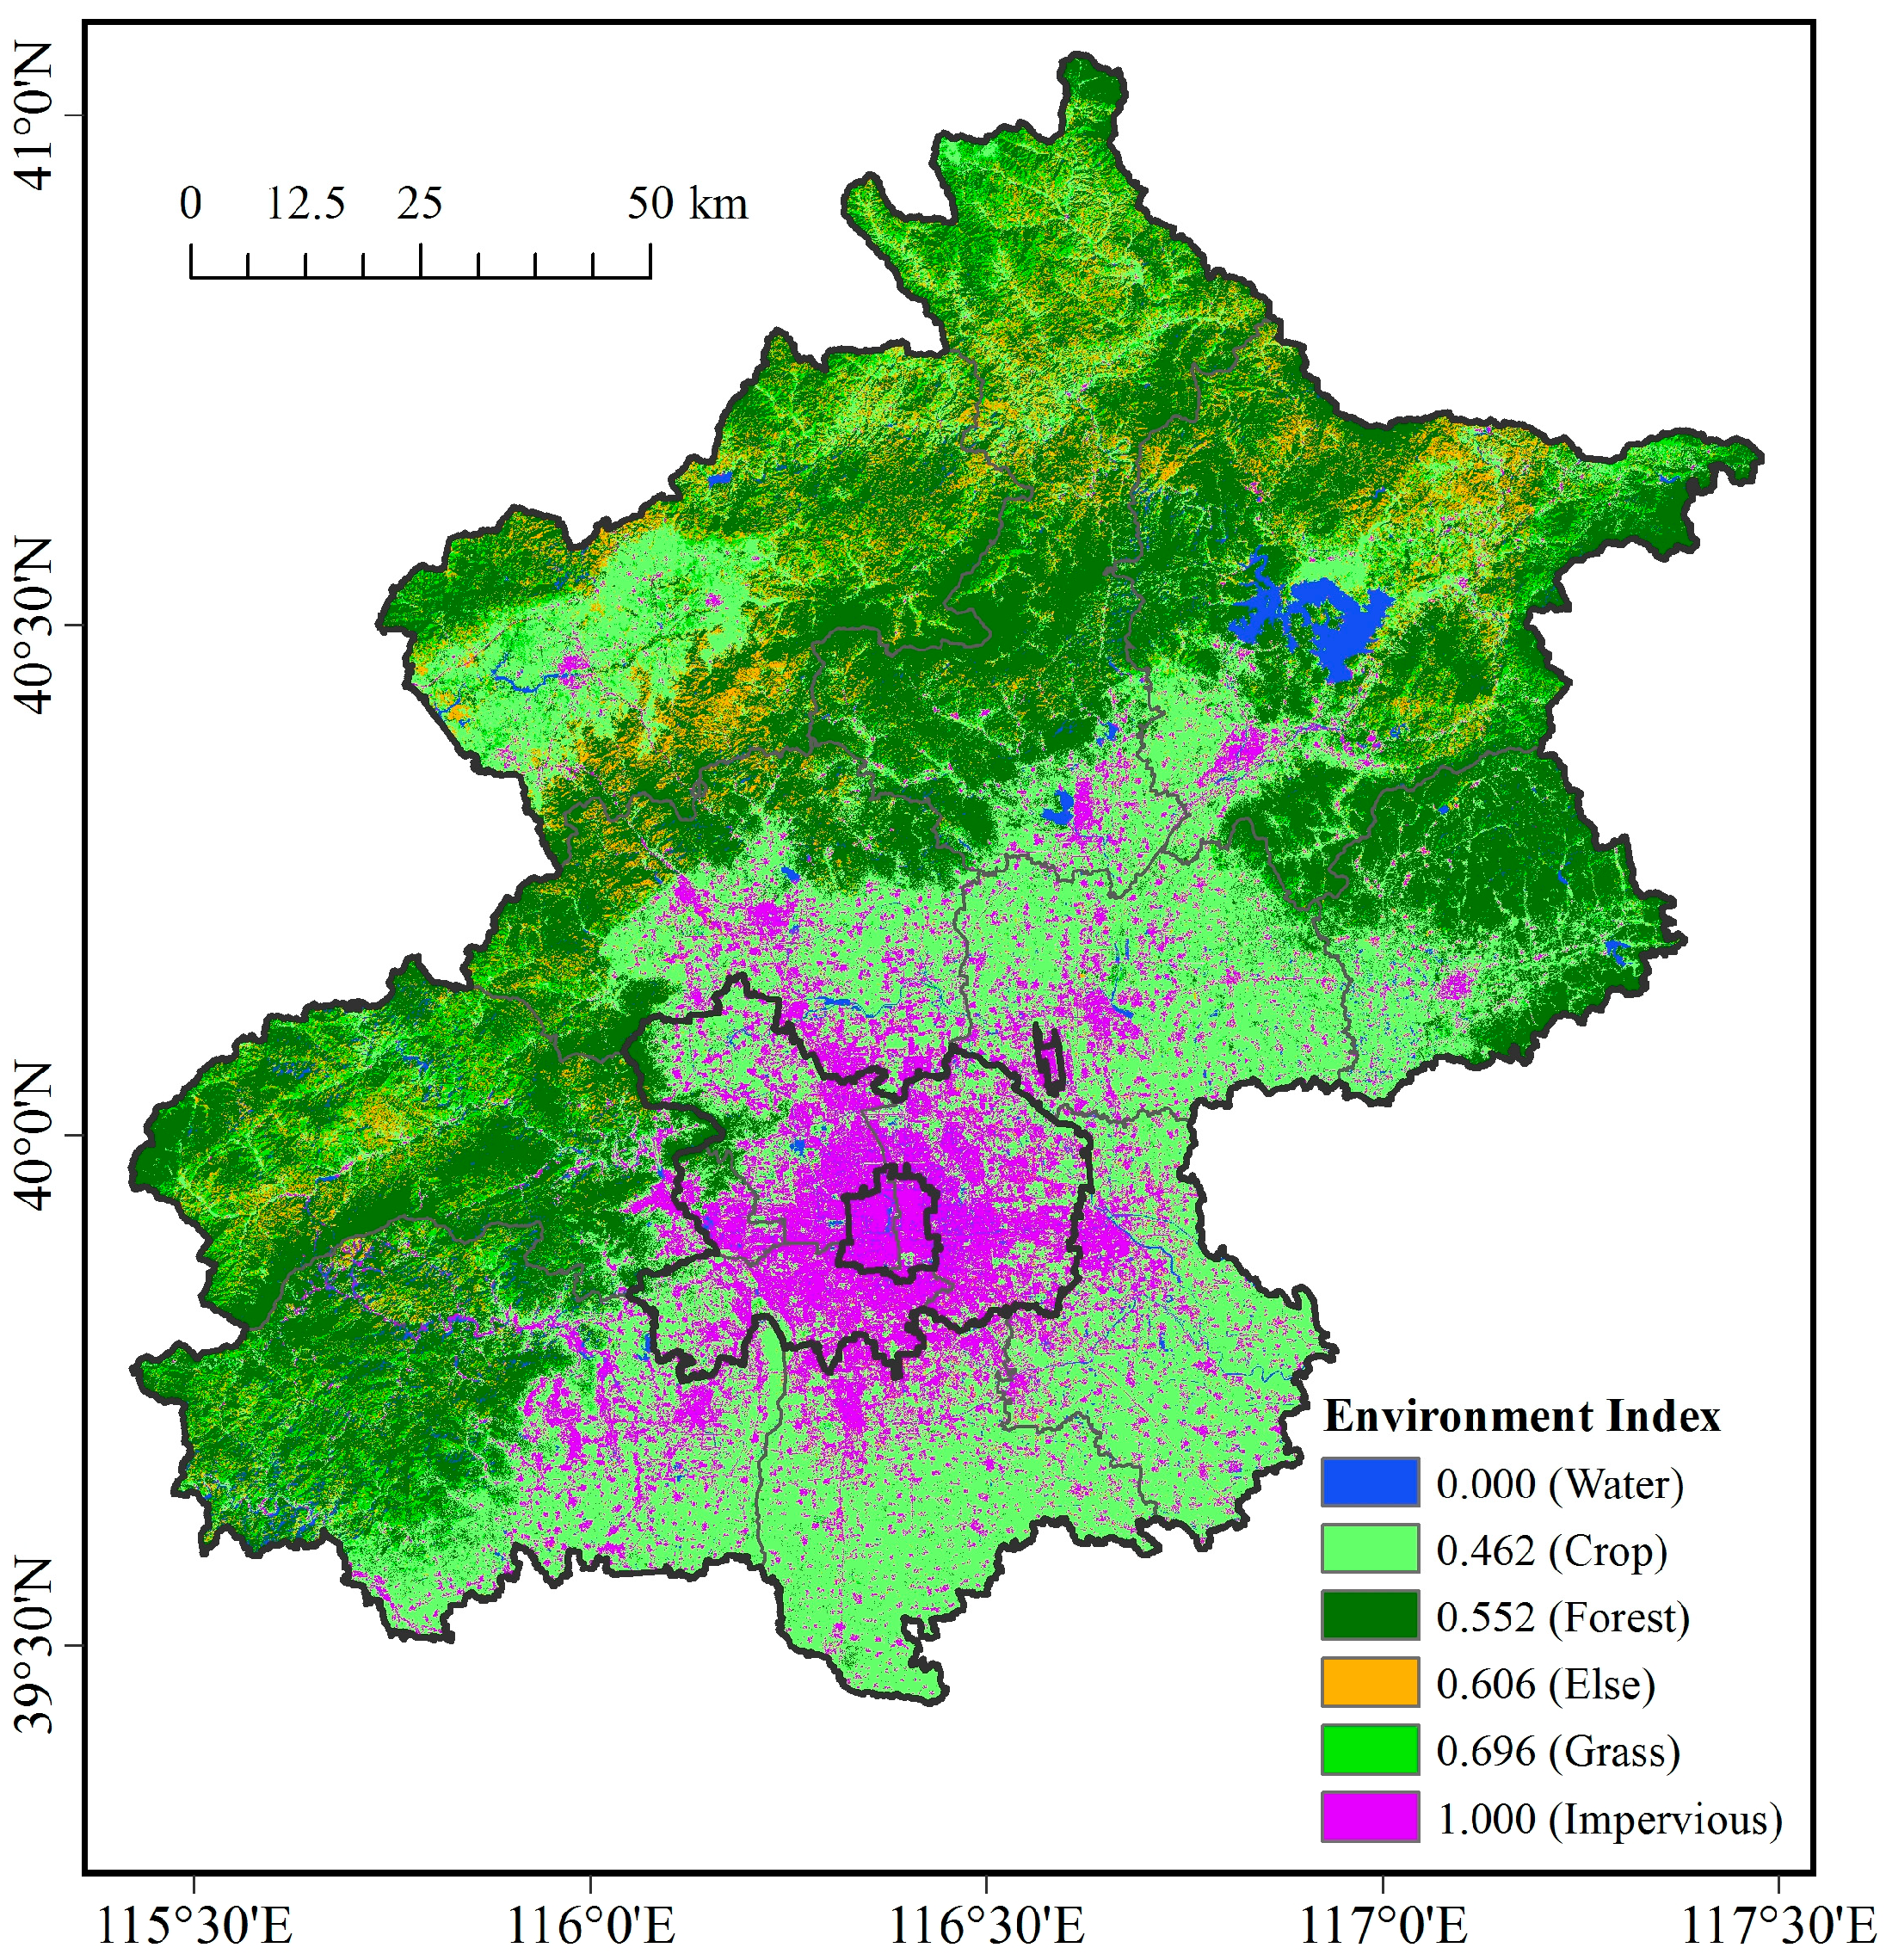
3.3. Environment

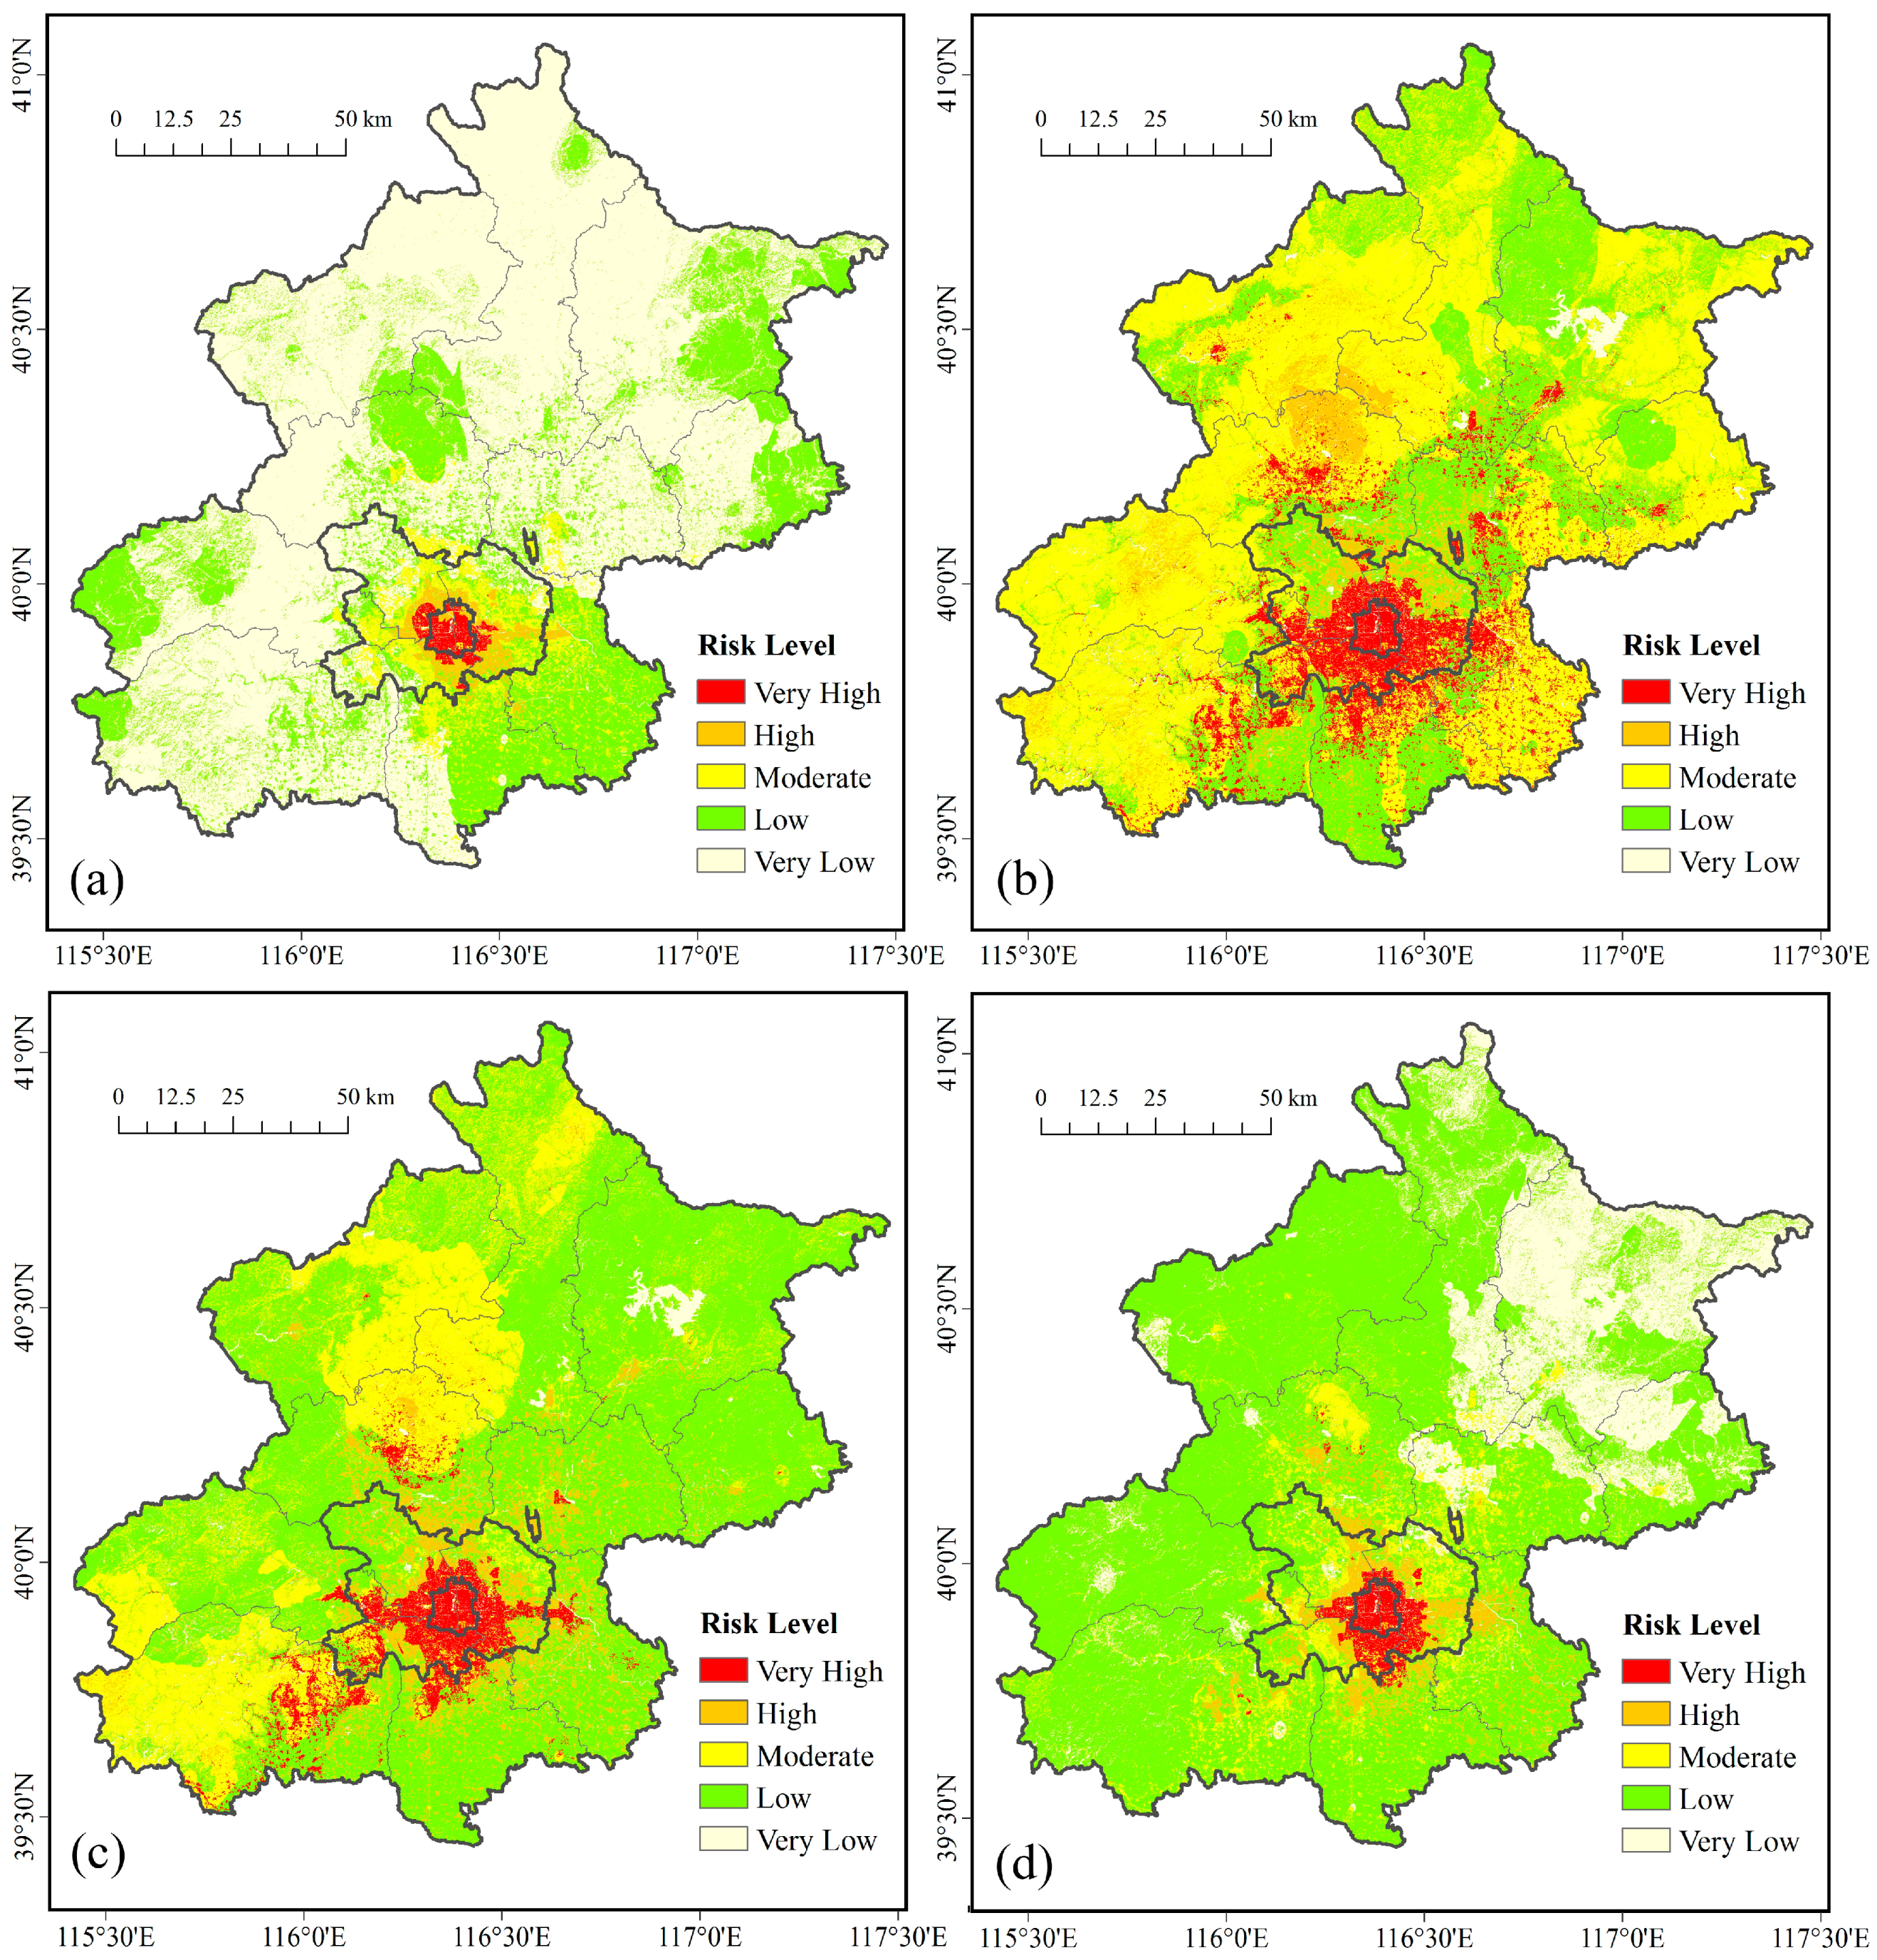
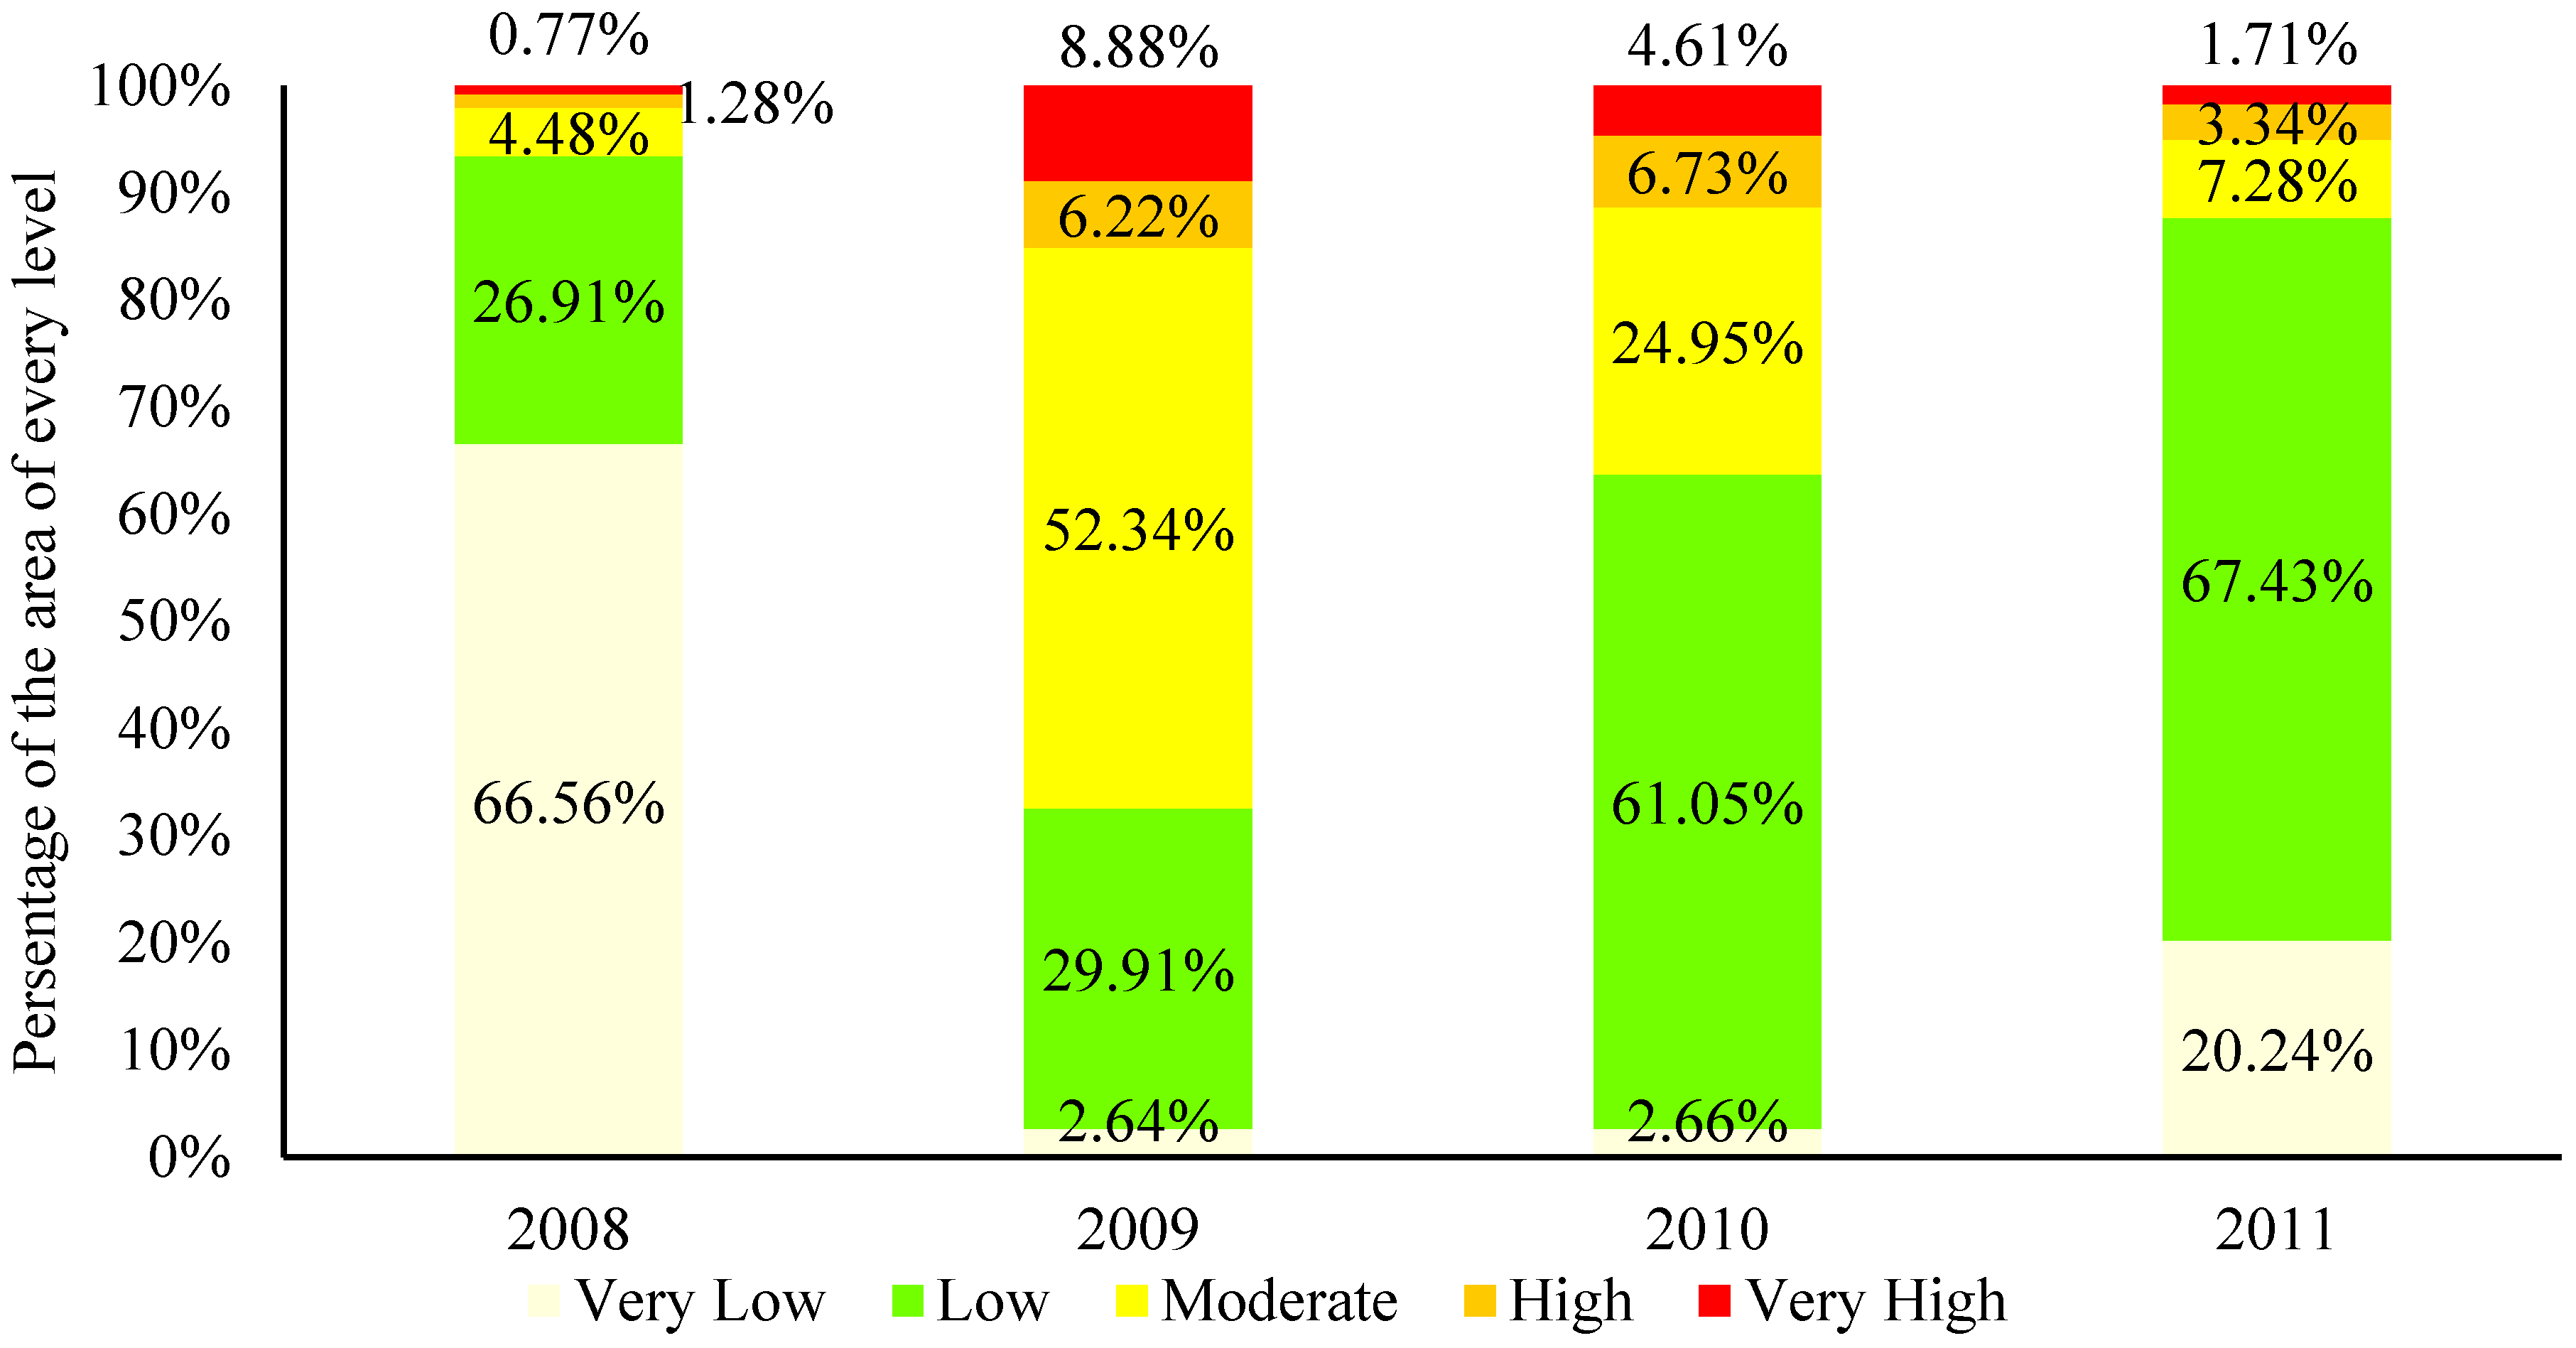
3.4. Heat Health Risk in Beijing


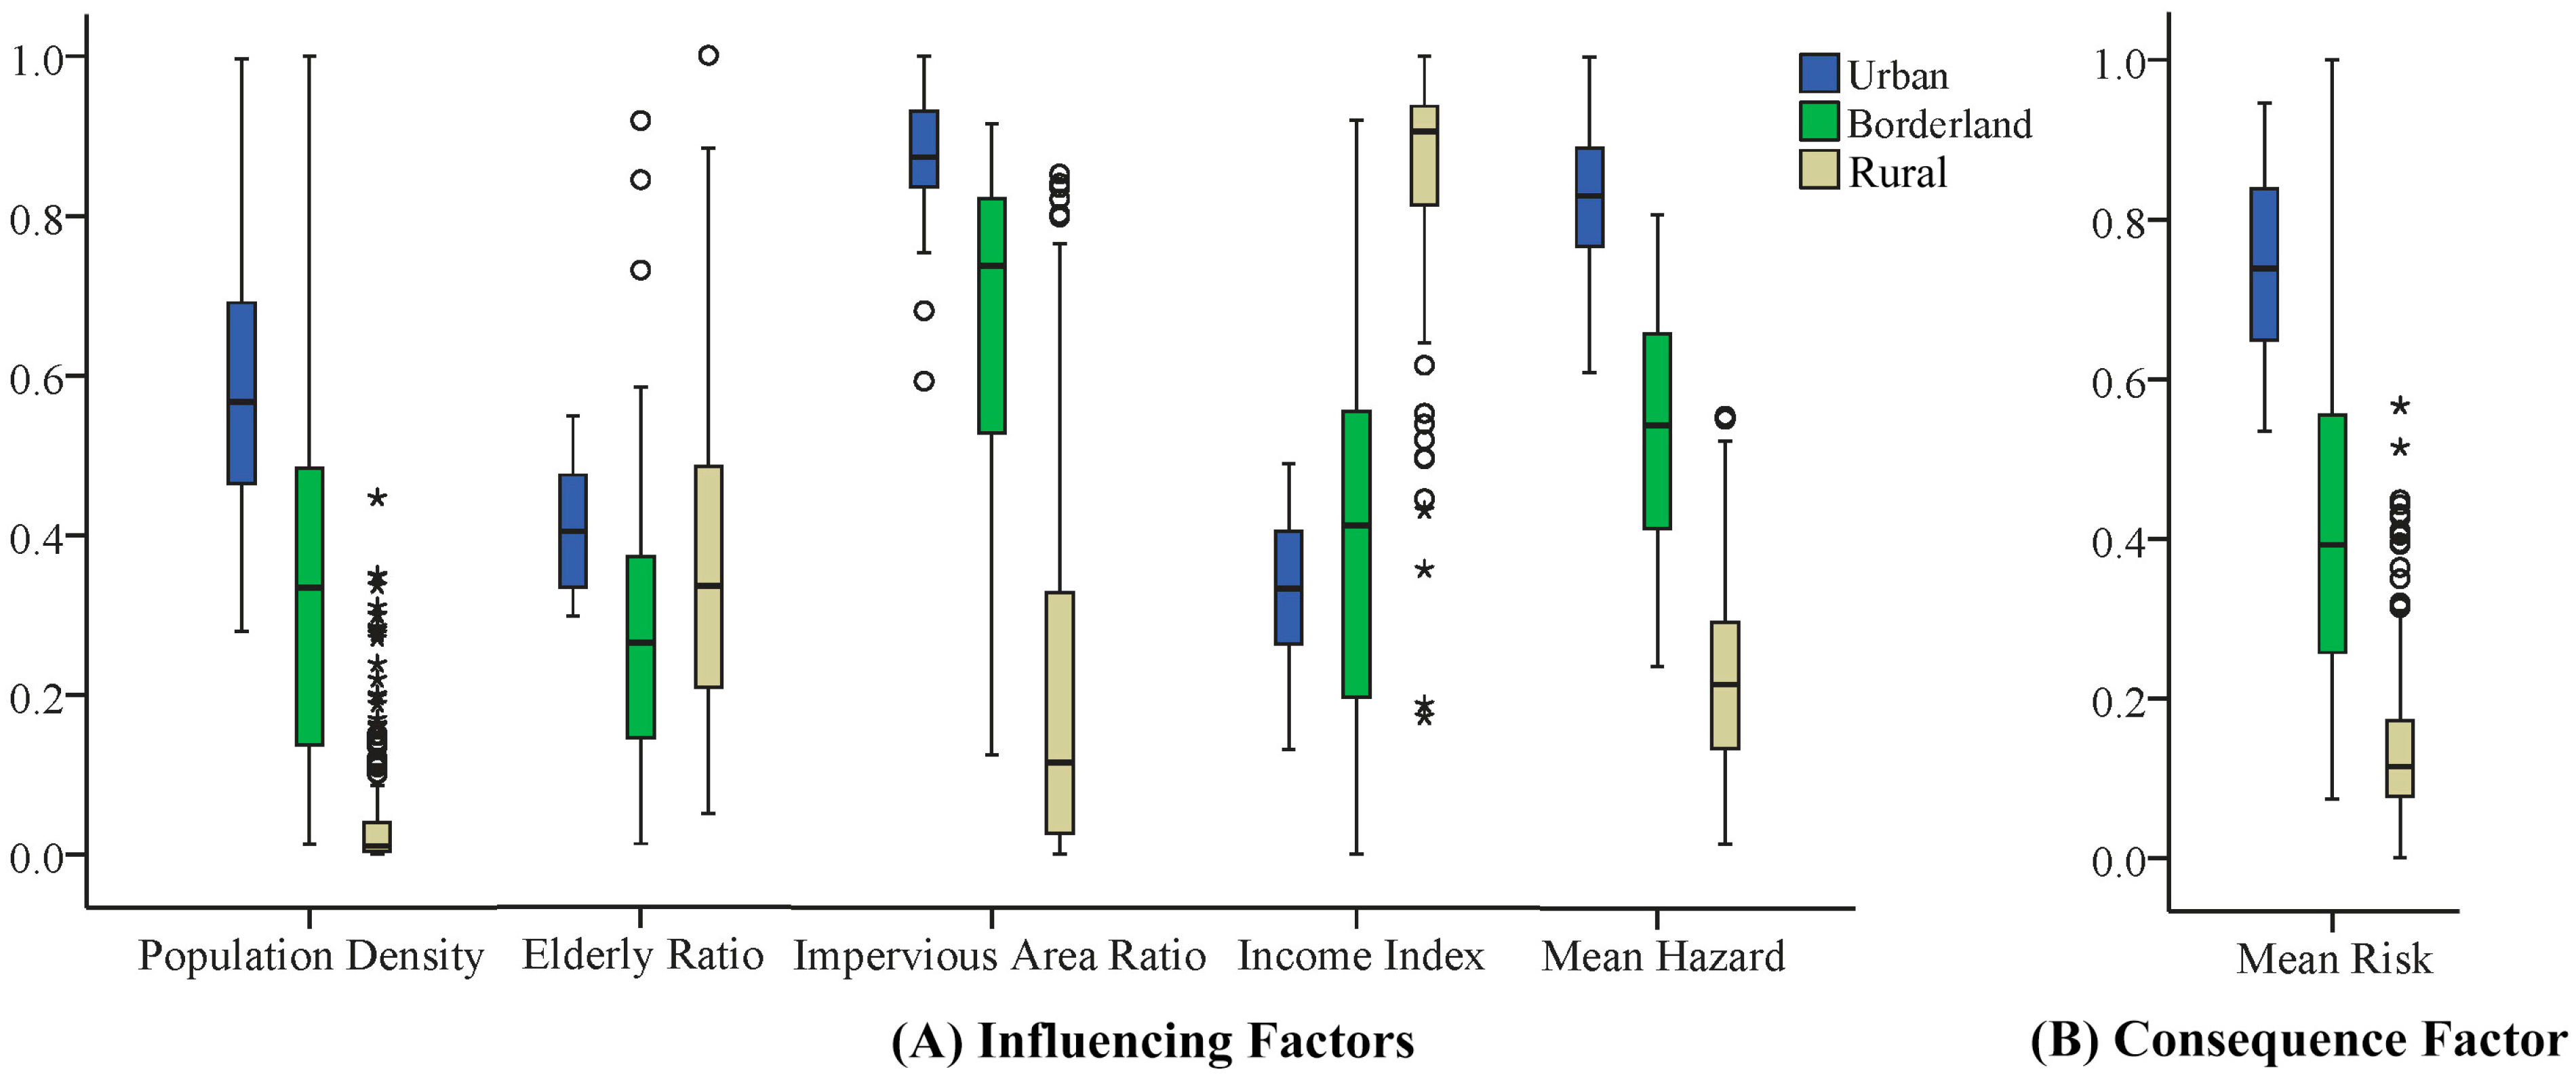
3.5. Comparison of the Borderland Area and Urban Area


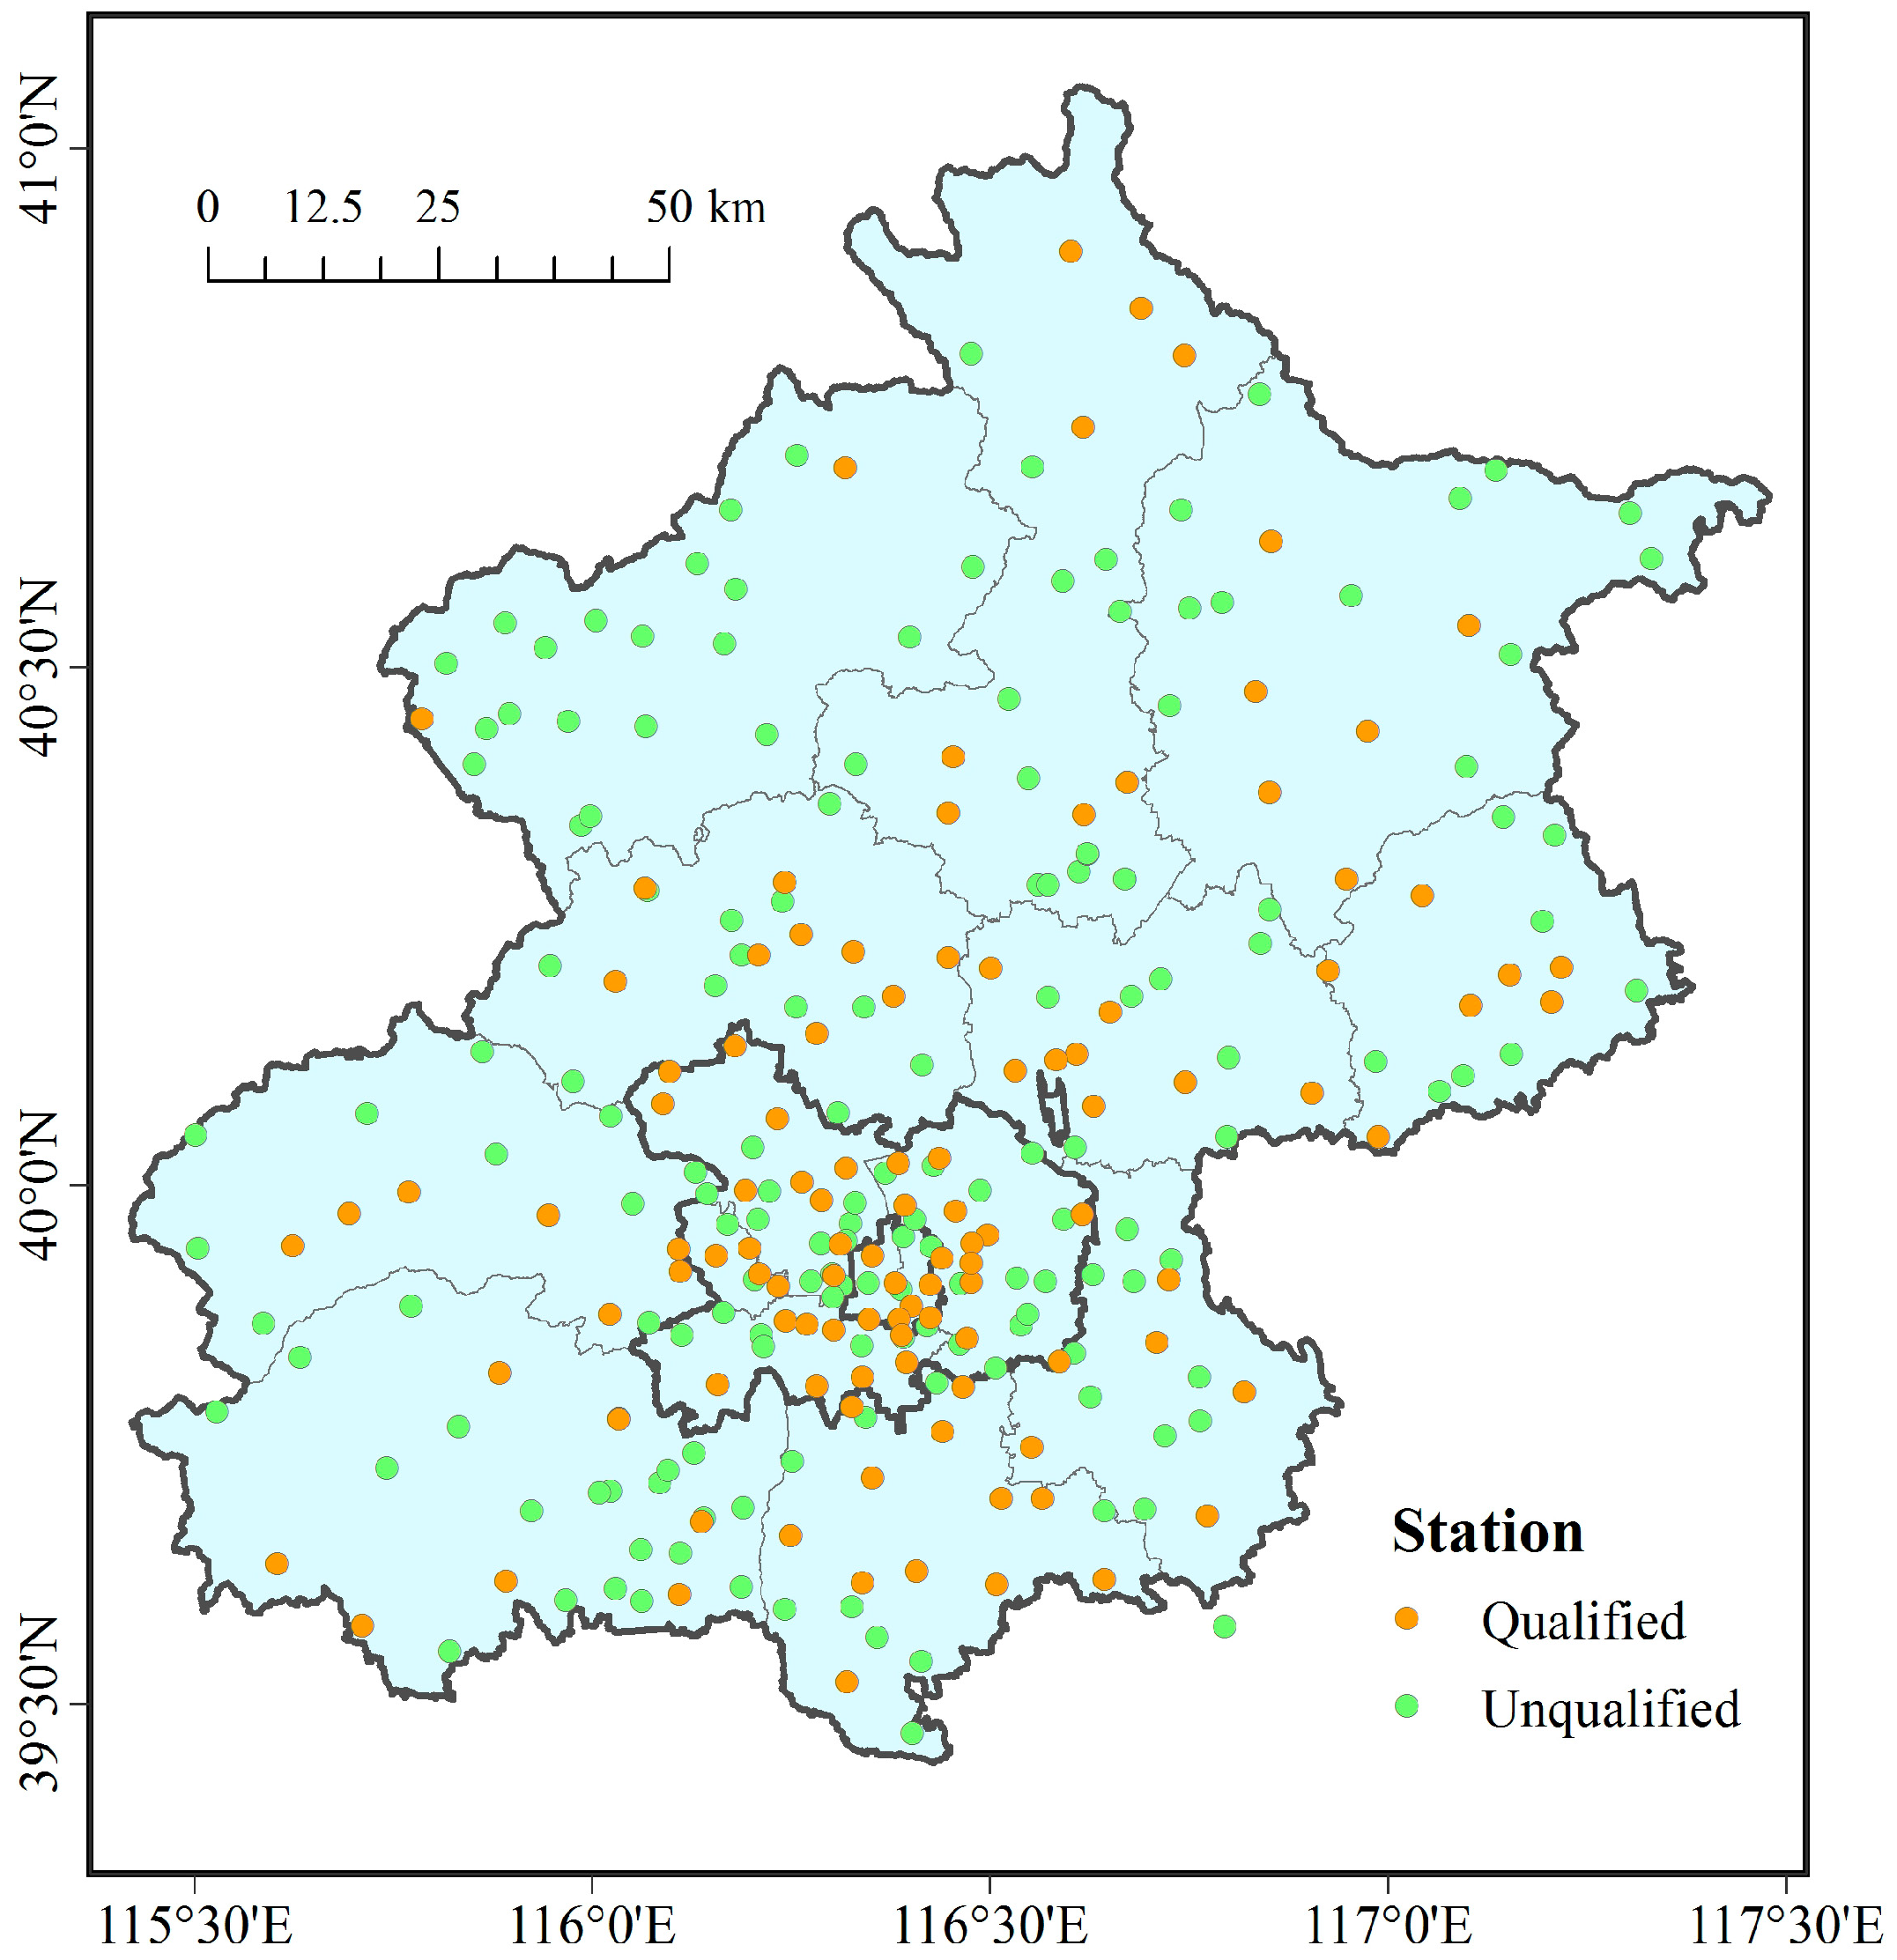
3.6. Validation
4. Discussion and Conclusions
- (a)
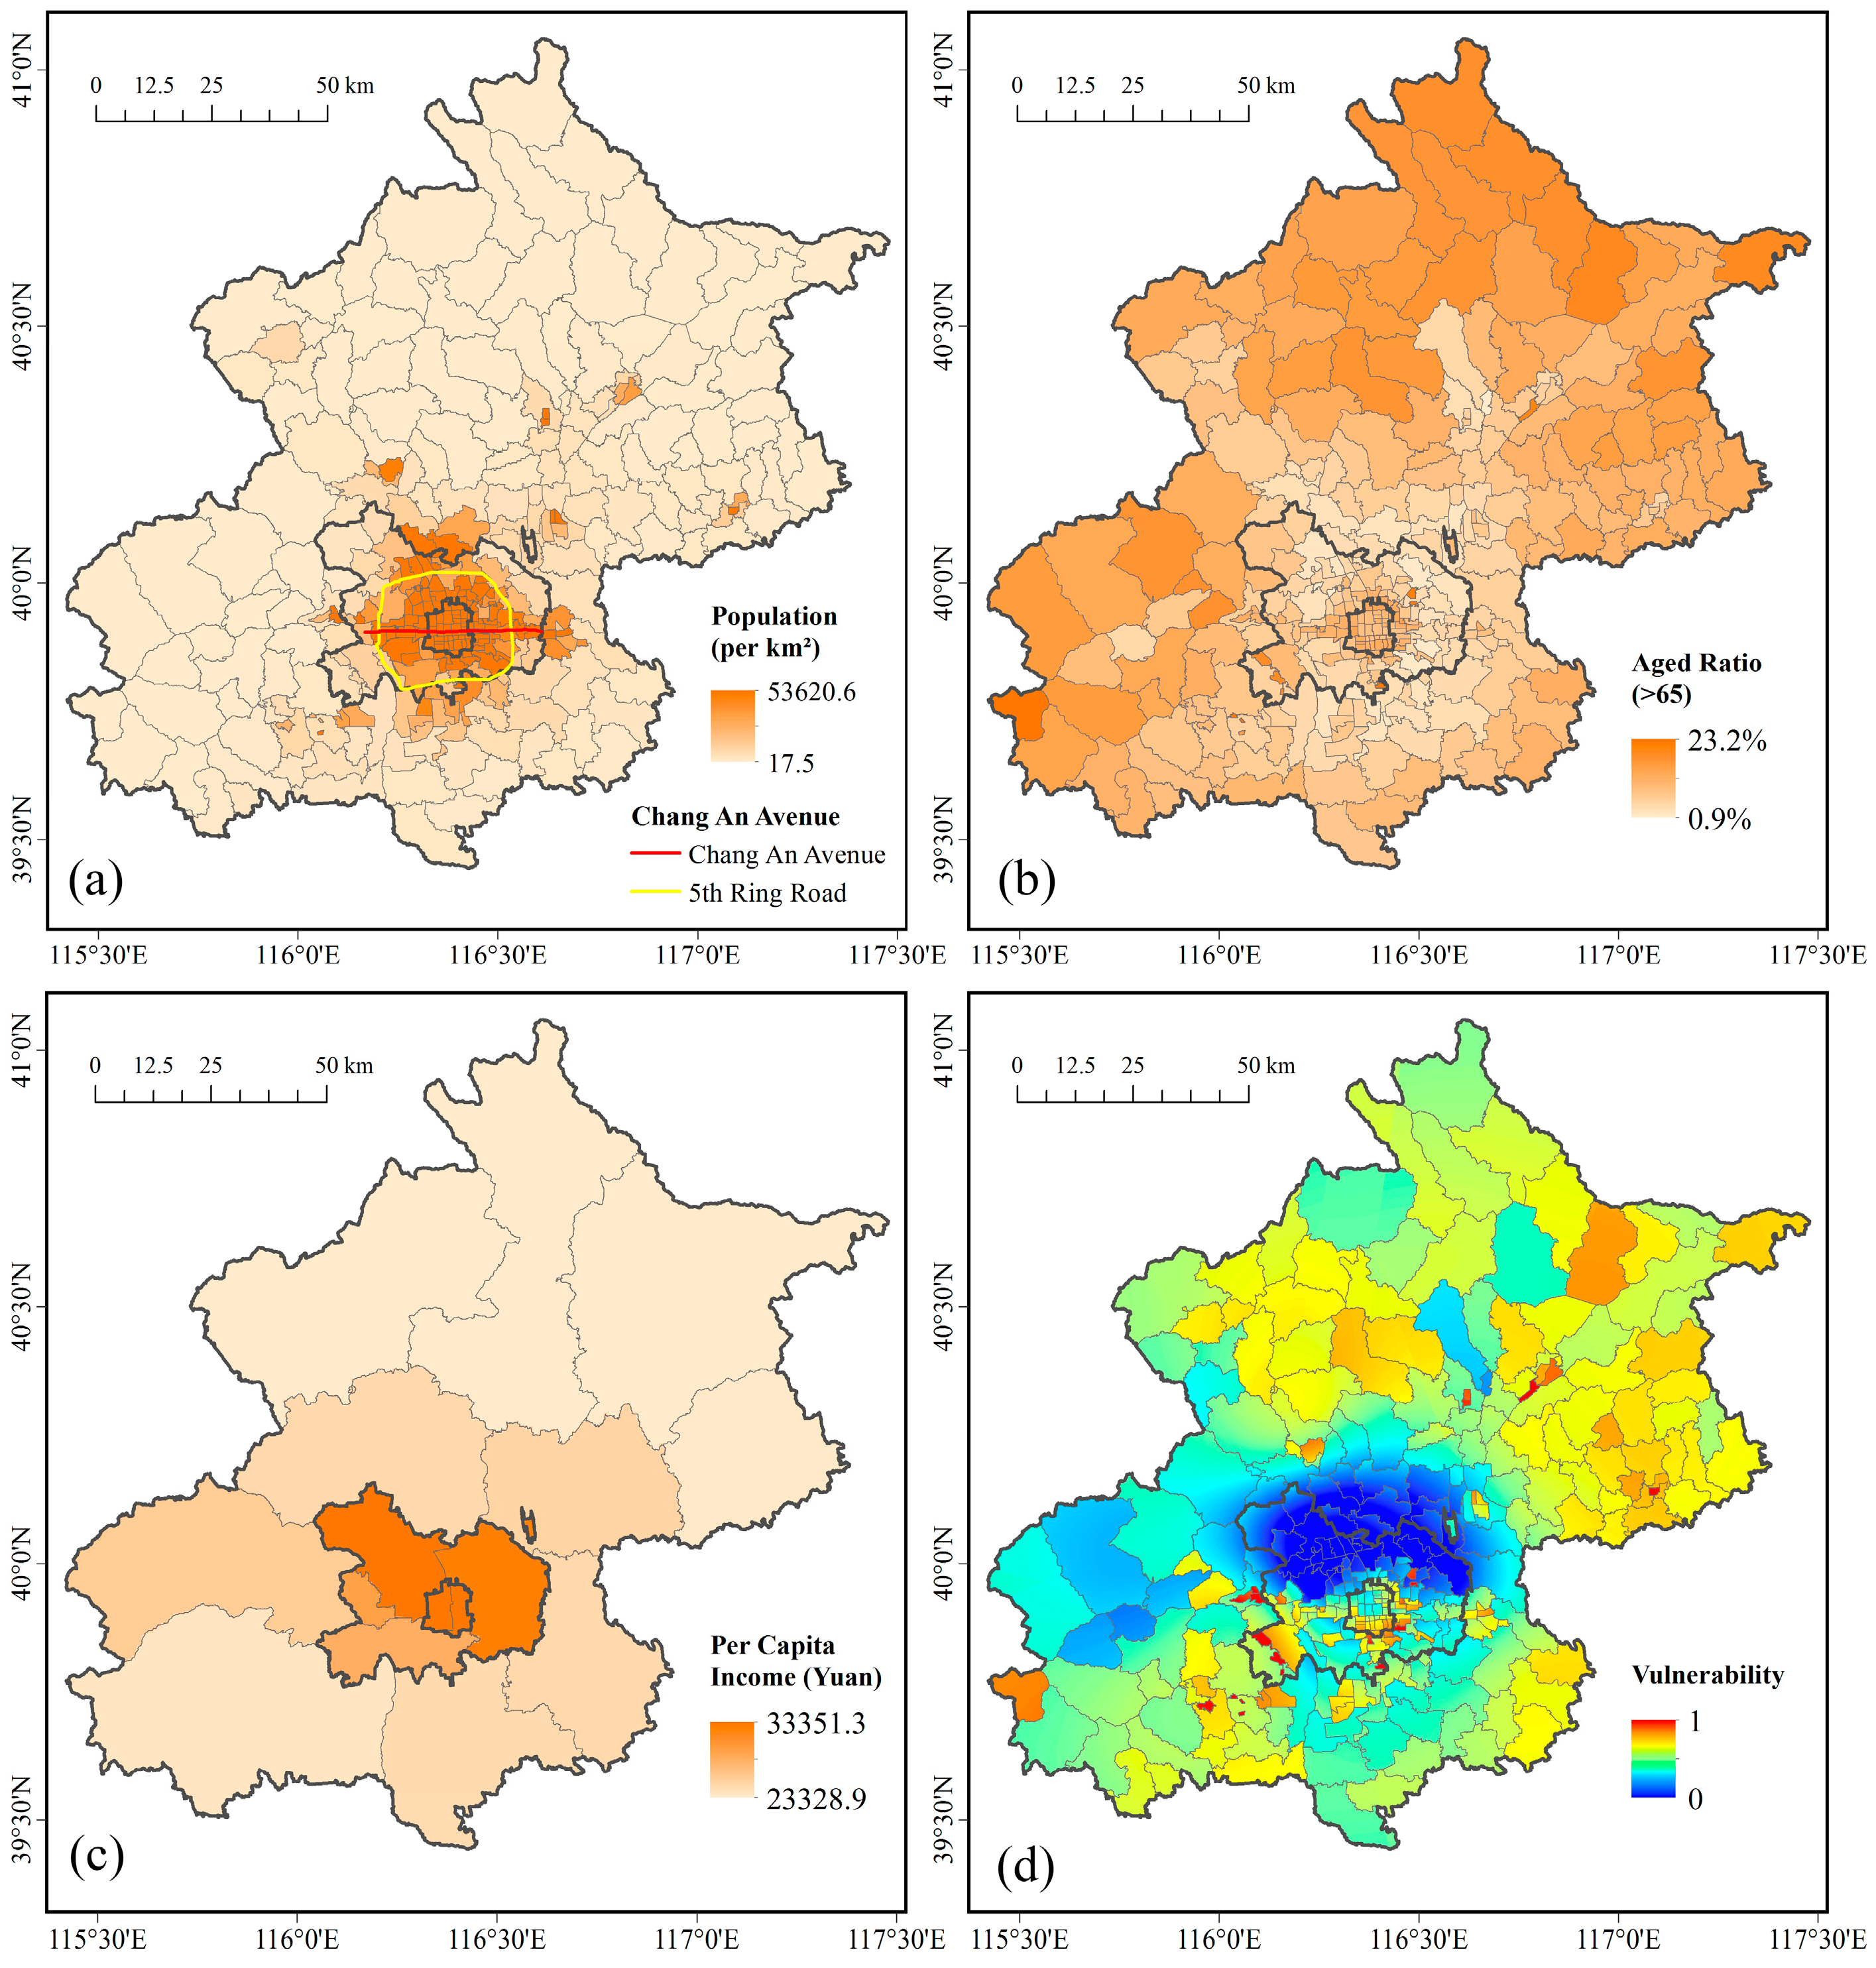
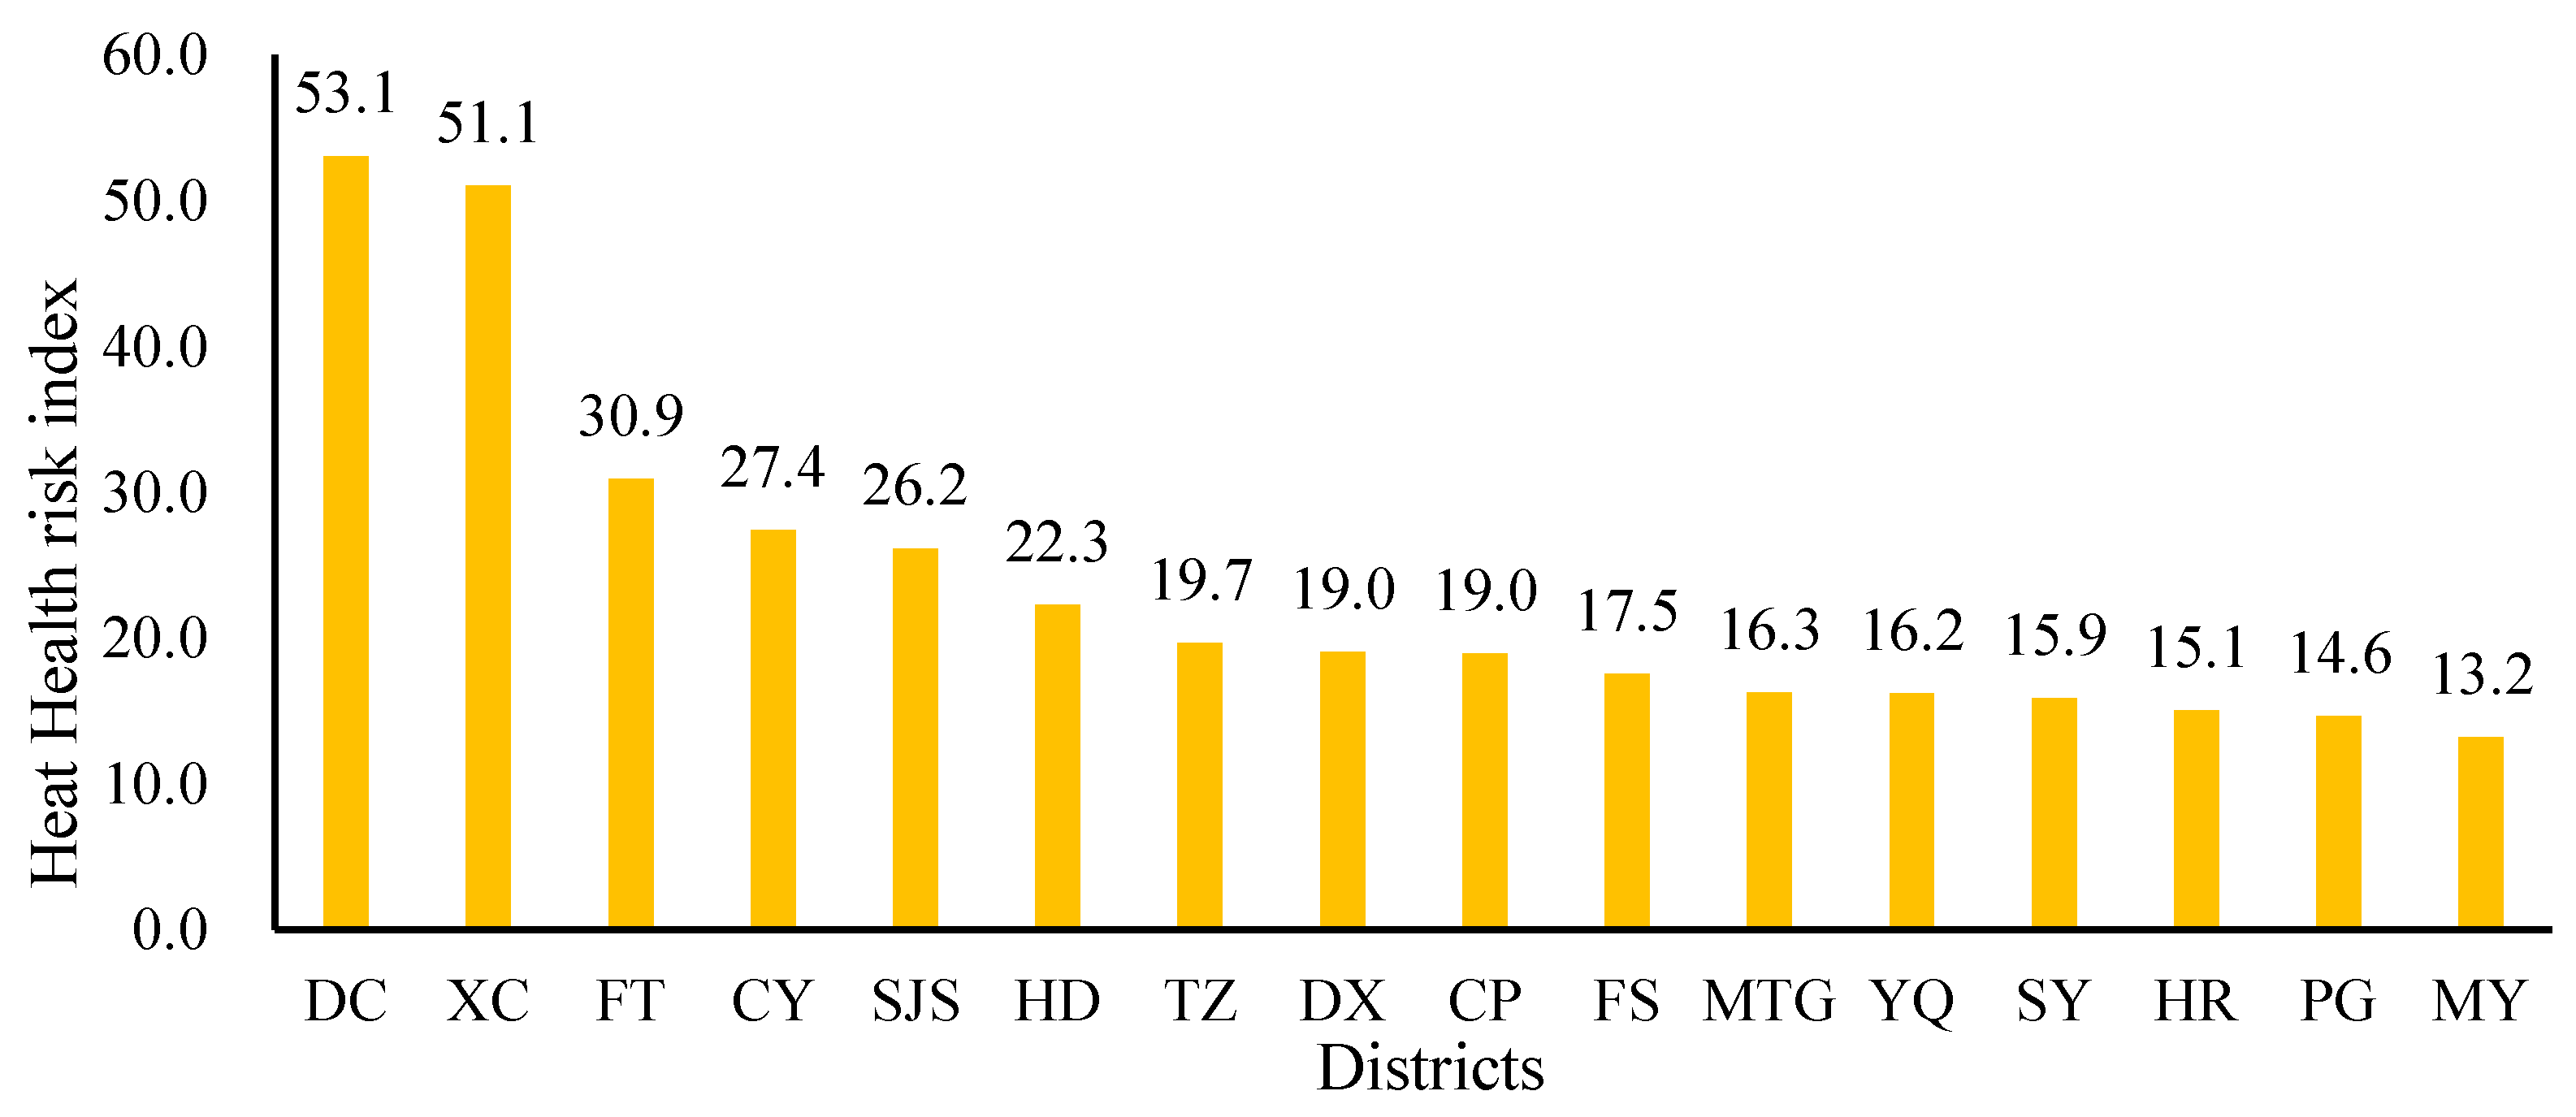
- The high heat wave risk of some seats of government, such as the PG, MY and YQ towns is primarily as result of the high population density. Limiting the number of people moving onto these streets is the best way to control the heat wave risk.
- (b)
- The high proportion of elderly people results in the high heat wave risk of the DC, XC, HR, YQ and MTG Districts. Building well-equipped nursing homes to provide good care to elderly people is the best way. Besides to reduce the heat health risk. Furthermore, increasing the proportion of water and forest areas can also decrease the heat wave risk.
- (c)
- The low-income areas, such as the FS, YQ, HR, MY and PG Districts, also have a high heat wave risk. Developing the economy and increasing the per capita income of these areas can help decrease the heat wave risk.
- (a)
- The authorities should consolidate the related laws and regulations, refine the local heat health warning systems, and intensify the prevention measures. The power supply departments should ensure the power supply during heat wave days. Moreover, it is essential that clean drinking water is guaranteed by the municipal water-supply departments.
- (b)
- Furthermore, publicize health protection knowledge against heat-related diseases and ensure that people learn how to save themselves or others in time. Vulnerable groups, especially the elderly, should be cared for during extremely hot days. People should change their habits in the hot days.
- (c)
- People should extend their efforts towards increasing the proportion of urban green areas, especially by planting more forests. The urban planning administration is responsible for effectively guiding the design and planning the quantity, species and distribution of urban green space. City planning should increase the proportion of green spaces in poor areas and increase the living conditions of poor people.
- (d)
- People’s homes and hospitals should implement cooling measures. Plant trees around houses to reduce the solar heat gain. Water the plants more and by water evaporation will reduce the temperature. Thicken curtains and paint houses with temperature-minimizing materials. It is important that hospitals and other public places be equipped with air-conditioning.
Acknowledgments
Author Contributions
Conflicts of Interest
References
- Gosling, S.N.; Lowe, J.A.; McGregor, G.R.; Pelling, M.; Malamud, B.D. Associations between elevated atmospheric temperature and human mortality: A critical review of the literature. Clim. Chang. 2009, 92, 299–341. [Google Scholar] [CrossRef]
- Robine, J.-M.; Cheung, S.L.K.; Le Roy, S.; van Oyen, H.; Griffiths, C.; Michel, J.-P.; Herrmann, F.R. Death toll exceeded 70,000 in Europe during the summer of 2003. Comptes Rendus Biol. 2008, 331, 171–178. [Google Scholar] [CrossRef]
- Semenza, J.C.; Rubin, C.H.; Falter, K.H.; Selanikio, J.D.; Flanders, W.D.; Howe, H.L.; Wilhelm, J.L. Heat-related deaths during the july 1995 heat wave in Chicago. N. Engl. J. Med. 1996, 335, 84–90. [Google Scholar] [CrossRef] [PubMed]
- Huang, W.; Kan, H.; Kovats, S. The impact of the 2003 heat wave on mortality in Shanghai, China. Sci. Total Environ. 2010, 408, 2418–2420. [Google Scholar] [CrossRef] [PubMed]
- Meehl, G.A.; Zwiers, F.; Evans, J.; Knutson, T.; Mearns, L.; Whetton, P. Trends in extreme weather and climate events: Issues related to modeling extremes in projections of future climate change. Bull. Am. Meteorol. Soc. 2000, 81, 427–436. [Google Scholar] [CrossRef]
- Koppe, C.; Kovats, S.; Jendritzky, G.; Menne, B. Health and Global Environmental Change Series, No. 2 Heat-Waves: Risks and Responses; World Health Organization: Geneva, Switzerland, 2004. [Google Scholar]
- Barrow, M.W.; Clark, K.A. Heat-related illnesses. Am. Fam. Physician 1998, 58, 749–756. [Google Scholar] [PubMed]
- Bouchama, A.; Knochel, J.P. Heat stroke. New Engl. J. Med. 2002, 346, 1978–1988. [Google Scholar] [CrossRef] [PubMed]
- Tian, Z.; Li, S.; Zhang, J.; Guo, Y. The characteristic of heat wave effects on coronary heart disease mortality in Beijing, China: A time series study. PLoS One 2013, 8, e77321. [Google Scholar] [CrossRef] [PubMed]
- Braga, A.L.; Zanobetti, A.; Schwartz, J. The effect of weather on respiratory and cardiovascular deaths in 12 U.S. cities. Environ. Health Perspect. 2002, 110, 859–863. [Google Scholar] [CrossRef] [PubMed]
- Vaneckova, P.; Beggs, P.J.; de Dear, R.J.; McCracken, K.W. Effect of temperature on mortality during the six warmer months in Sydney, Australia, between 1993 and 2004. Environ. Res. 2008, 108, 361–369. [Google Scholar] [CrossRef] [PubMed]
- Fouillet, A.; Rey, G.; Laurent, F.; Pavillon, G.; Bellec, S.; Guihenneuc-Jouyaux, C.; Clavel, J.; Jougla, E.; Hmon, D. Excess mortality related to the august 2003 heat wave in France. Int. Arch. Occup. Environ. Health 2006, 80, 16–24. [Google Scholar] [CrossRef] [PubMed] [Green Version]
- Hansen, A.L.; Bi, P.; Ryan, P.; Nitschke, M.; Pisaniello, D.; Tucker, G. The effect of heat waves on hospital admissions for renal disease in a temperate city of Australia. Int. J. Epidemiol. 2008, 37, 1359–1365. [Google Scholar] [CrossRef] [PubMed]
- Centre for Research on the Epidemiology of Disasters (CRED). Emergency Events Database (EM-DAT). Available online: http://www.emdat.be/ (accessed on 15 June 2014).
- Guha-Sapir, D.; Vos, F.; Below, R.; Ponserre, S. Annual disaster statistical review 2010. Available online: http://www.cred.be/sites/default/files/ADSR_2010.pdf (accessed on 15 June 2014).
- World Meteorological Organization (WMO). 2001–2010: A decade of climate extremes. Available online: http://library.wmo.int/pmb_ged/wmo_1103_en.pdf (accessed on 15 June 2014).
- Meehl, G.A.; Tebaldi, C. More intense, more frequent, and longer lasting heat waves in the 21st century. Science 2004, 305, 994–997. [Google Scholar] [CrossRef] [PubMed]
- Weng, Q. Fractal analysis of satellite-detected urban heat island effect. Photogramm. Eng. Rem. Sens. 2003, 69, 555–566. [Google Scholar] [CrossRef]
- Field, C.B.; Barros, V.; Stocker, T.F.; Dahe, Q. Managing the Risks of Extreme Events and Disasters to Advance cliMate Change Adaptation: Special Report of the Intergovernmental Panel on Climate Change; Cambridge University Press: Cambridge, UK, 2012. [Google Scholar]
- Kim, H.H. Urban heat island. Int. J. Rem. Sens. 1992, 13, 2319–2336. [Google Scholar] [CrossRef]
- Seto, K.C.; Shepherd, J.M. Global urban land-use trends and climate impacts. Curr. Opin. Environ. Sustain. 2009, 1, 89–95. [Google Scholar] [CrossRef]
- Coutts, A.M.; Beringer, J.; Tapper, N.J. Impact of increasing urban density on local climate: Spatial and temporal variations in the surface energy balance in Melbourne, Australia. J. Appl. Meteorol. Climatol. 2007, 46, 477–493. [Google Scholar] [CrossRef]
- Stabler, L.B.; Martin, C.A.; Brazel, A.J. Microclimates in a desert city were related to land use and vegetation index. Urban For. Urban Green. 2005, 3, 137–147. [Google Scholar] [CrossRef]
- Grossman-Clarke, S.; Zehnder, J.A.; Loridan, T.; Grimmond, C.S.B. Contribution of land use changes to near-surface air temperatures during recent summer extreme heat events in the Phoenix metropolitan area. J. Appl. Meteorol. Climatol. 2010, 49, 1649–1664. [Google Scholar] [CrossRef]
- Wong, N.H.; Yu, C. Study of green areas and urban heat island in a tropical city. Habitat Int. 2005, 29, 547–558. [Google Scholar] [CrossRef]
- Tan, J.; Zheng, Y.; Song, G.; Kalkstein, L.S.; Kalkstein, A.J.; Tang, X. Heat wave impacts on mortality in Shanghai, 1998 and 2003. Int. J. Biometeorol. 2007, 51, 193–200. [Google Scholar] [CrossRef] [PubMed]
- Buscail, C.; Upegui, E.; Viel, J.-F. Mapping heatwave health risk at the community level for public health action. Int. J. Health Geogr. 2012. [Google Scholar] [CrossRef] [Green Version]
- Yardley, J.; Sigal, R.J.; Kenny, G.P. Heat health planning: The importance of social and community factors. Global Environ. Chang. 2011, 21, 670–679. [Google Scholar] [CrossRef]
- Depietri, Y.; Welle, T.; Renaud, F.G. Social vulnerability assessment of the cologne urban area (Germany) to heat waves: Links to ecosystem services. Int. J. Disaster Risk Reduct. 2013, 6, 98–117. [Google Scholar] [CrossRef]
- Bowler, D.E.; Buyung-Ali, L.; Knight, T.M.; Pullin, A.S. Urban greening to cool towns and cities: A systematic review of the empirical evidence. Landsc. Urban Plan. 2010, 97, 147–155. [Google Scholar] [CrossRef]
- Taha, H. Urban climates and heat islands: Albedo, evapotranspiration, and anthropogenic heat. Energy Build. 1997, 25, 99–103. [Google Scholar] [CrossRef]
- Dimoudi, A.; Nikolopoulou, M. Vegetation in the urban environment: Microclimatic analysis and benefits. Energy Build. 2003, 35, 69–76. [Google Scholar] [CrossRef]
- Burkhard, B.; Kroll, F.; Müller, F.; Windhorst, W. Landscapes’ capacities to provide ecosystem services—A concept for land-cover based assessments. Landsc. Online 2009, 15, 1–22. [Google Scholar]
- Gong, A.; Chen, Y.; Li, J.; Hu, H. Study on relationship between urban heat island and urban land use and cover change in Beijing. J. Image Graph. 2007, 12, 1476–1482. [Google Scholar]
- Karl, T.R.; Diaz, H.F.; Kukla, G. Urbanization: Its detection and effect in the United States climate record. J. Clim. 1988, 1, 1099–1123. [Google Scholar] [CrossRef]
- Wang, Y.; Hu, F. Variations of the urban heat island in summer of the recent 10 years over Beijing and its environment effect. Chin. J. Geophys. 2006, 49, 61–68. [Google Scholar]
- Yang, P.; Ren, G.; Liu, W. Spatial and temporal characteristics of Beijing urban heat island intensity. J. Appl. Meteorol. Climatol. 2013, 52, 1803–1816. [Google Scholar] [CrossRef]
- Ren, G.; Chu, Z.; Chen, Z.; Ren, Y. Implications of temporal change in urban heat island intensity observed at Beijing and Wuhan stations. Geophys. Res. Lett. 2007, 34, 1–5. [Google Scholar]
- Wang, F.; Zhang, W. Population distribution and its change of Beijing since the reform and opening up policy. Popul. Res. 2001, 25, 62–66. (In Chinese) [Google Scholar]
- Robinson, P.J. On the definition of a heat wave. J. Appl. Meteorol. 2001, 40, 762–775. [Google Scholar] [CrossRef]
- World Meteorological Organization (WMO). International Meteorological Vocabulary, No. 182. Available online: http://www.wmo.int/ (accessed on 15 June 2014).
- Garssen, J.; Harmsen, C.; de Beer, J. The effect of the summer 2003 heat wave on mortality in The Netherlands. Eurosurveillance 2005, 10, 165–167. [Google Scholar] [PubMed]
- China Meteorological Administration (CMA). Heat wave meteorological level forecast implementation plan. Available online: http://www.cma.gov.cn/ (accessed on 15 June 2014).
- Katnich, L.O.; Quirante, F.P. Fatal heat stroke in a schizophrenic patient. Case Rep. Crit. Care 2012. [Google Scholar] [CrossRef]
- Tomlinson, C.J.; Chapman, L.; Thornes, J.E.; Baker, C.J. Including the urban heat island in spatial heat health risk assessment strategies: A case study for Birmingham, UK. Int. J. Health Geogr. 2011. [Google Scholar] [CrossRef] [Green Version]
- Vescovi, L.; Rebetez, M.; Rong, F. Assessing public health risk due to extremely high temperature events: Climate and social parameters. Clim. Res. 2005, 30, 71–78. [Google Scholar] [CrossRef]
- Wisner, B. At Risk: Natural Hazards, People’s Vulnerability and Disasters; Psychology Press: East Sussex, UK, 2004. [Google Scholar]
- Harlan, S.L.; Brazel, A.J.; Prashad, L.; Stefanov, W.L.; Larsen, L. Neighborhood microclimates and vulnerability to heat stress. Soc. Sci. Med. 2006, 63, 2847–2863. [Google Scholar] [CrossRef] [PubMed]
- Dolney, T.J.; Sheridan, S.C. The relationship between extreme heat and ambulance response calls for the city of Toronto, Ontario, Canada. Environ. Res. 2006, 101, 94–103. [Google Scholar] [CrossRef] [PubMed]
- Hajat, S.; Kosatky, T. Heat-related mortality: A review and exploration of heterogeneity. J. Epidemiol. Comm. Health 2010, 64, 753–760. [Google Scholar] [CrossRef]
- Smith, C.; Lindley, S.; Levermore, G. Estimating spatial and temporal patterns of urban anthropogenic heat fluxes for UK cities: The case of Manchester. Theor. Appl. Climatol. 2009, 98, 19–35. [Google Scholar] [CrossRef]
- Pan, W.-H.; Li, L.-A.; Tsai, M.-J. Temperature extremes and mortality from coronary heart disease and cerebral infarction in elderly Chinese. Lancet 1995, 345, 353–355. [Google Scholar] [CrossRef] [PubMed]
- Saez, M.; Sunyer, J.; Catellsague, J.; Murillo, C.; Anto, J.M. Relationship between weather temperature and mortality: A time series analysis approach in Barcelona. Int. J. Epidemiol. 1995, 24, 576–582. [Google Scholar] [CrossRef] [PubMed]
- Havenith, G. Temperature regulation and technology. Gerontechnology 2001, 1, 41–49. [Google Scholar] [CrossRef]
- Poumadere, M.; Mays, C.; Mer, S.L.; Blong, R. The 2003 heat wave in France: Dangerous climate change here and now. Risk Analysis 2005, 25, 1483–1494. [Google Scholar] [CrossRef] [PubMed]
- Vaneckova, P.; Beggs, P.J.; Jacobson, C.R. Spatial analysis of heat-related mortality among the elderly between 1993 and 2004 in Sydney, Australia. Soc. Sci. Med. 2010, 70, 293–304. [Google Scholar] [CrossRef] [PubMed]
- Peng, R.D.; Bobb, J.F.; Tebaldi, C.; McDaniel, L.; Bell, M.L.; Dominici, F. Toward a quantitative estimate of future heat wave mortality under global climate change. Environ. Health Perspect. 2011, 119, 701–706. [Google Scholar] [CrossRef] [PubMed]
- Jones, T.S.; Liang, A.P.; Kilbourne, E.M.; Griffin, M.R.; Patriarca, P.A.; Wassilak, S.G.F.; Mullan, R.J.; Herrick, R.F.; Donnell, H.D., Jr.; Choi, K. Morbidity and mortality associated with the july 1980 heat wave in St Louis and Kansas City, Mo. JAMA J. Am. Med. Assoc. 1982, 247, 3327–3331. [Google Scholar] [CrossRef]
- Kilbourne, E.M.; Choi, K.; Jones, T.S.; Thacker, S.B. Risk factors for heatstroke. Jama 1982, 247, 3332–3334. [Google Scholar] [CrossRef] [PubMed]
- Bassil, K.L.; Cole, D.C.; Moineddin, R.; Craig, A.M.; Wendy Lou, W.; Schwartz, B.; Rea, E. Temporal and spatial variation of heat-related illness using 911 medical dispatch data. Environ. Res. 2009, 109, 600–606. [Google Scholar] [CrossRef] [PubMed]
- Stafoggia, M.; Forastiere, F.; Agostini, D.; Biggeri, A.; Bisanti, L.; Cadum, E.; Caranci, N.; de Donato, F.; de Lisio, S.; de Maria, M. Vulnerability to heat-related mortality: A multicity, population-based, case-crossover analysis. Epidemiology 2006, 17, 315–323. [Google Scholar] [CrossRef] [PubMed]
- Center for Earth System Science (CESS). Finer Resolution Observation and Monitoring—Global Land Cover. Available online: http://data.ess.tsinghua.edu.cn/ (accessed on 15 June 2014).
- Gong, P.; Wang, J.; Yu, L.; Zhao, Y.; Zhao, Y.; Liang, L.; Niu, Z.; Huang, X.; Fu, H.; Liu, S. Finer resolution observation and monitoring of global land cover: First mapping results with landsat Tm and Etm+ data. Int. J. Rem. Sens. 2013, 34, 2607–2654. [Google Scholar] [CrossRef]
- Thumerer, T.; Jones, A.; Brown, D. A gis based coastal management system for climate change associated flood risk assessment on the east coast of England. Int. J. Geogr. Inf. Sci. 2000, 14, 265–281. [Google Scholar] [CrossRef]
- Wilhelmi, O.V.; Wilhite, D.A. Assessing vulnerability to agricultural drought: A Nebraska case study. Nat. Hazards 2002, 25, 37–58. [Google Scholar] [CrossRef]
- Taramelli, A.; Melelli, L.; Pasqui, M.; Sorichetta, A. Estimating hurricane hazards using a GIS system. Nat. Hazards Earth Syst. Sci. 2008, 8, 839–854. [Google Scholar] [CrossRef]
- Mejía-Navarro, M.; Wohl, E.E.; Oaks, S.D. Geological hazards, vulnerability, and risk assessment using GIS: Model for Glenwood Springs, Colorado. Geomorphology 1994, 10, 331–354. [Google Scholar] [CrossRef]
- Zerger, A.; Smith, D.I. Impediments to using GIS for real-time disaster decision support. Comput. Environ. Urban Syst. 2003, 27, 123–141. [Google Scholar] [CrossRef]
- Crichton, D. The risk triangle. In Natural Disaster Management: A Presentation to Commemorate the International Decade for Natural Disaster Reduction (IDNDR), 1990–2000; Ingleton, J., Ed.; Tudor Rose: Leicester, UK, 1999; pp. 102–103. [Google Scholar]
- Kestens, Y.; Brand, A.; Fournier, M.; Goudreau, S.; Kosatsky, T.; Maloley, M.; Smargiassi, A. Modelling the variation of land surface temperature as determinant of risk of heat-related health events. Int. J. Health Geogr. 2011, 10, 1–9. [Google Scholar] [CrossRef] [PubMed]
- Le Tertre, A.; Lefranc, A.; Eilstein, D.; Declercq, C.; Medina, S.; Blanchard, M.; Chardon, B.; Fabre, P.; Filleul, L.; Jusot, J.-F. Impact of the 2003 heatwave on all-cause mortality in 9 French cities. Epidemiology 2006, 17, 75–79. [Google Scholar]
- Reid, C.E.; O’Neill, M.S.; Gronlund, C.J.; Brines, S.J.; Brown, D.G.; Diez-Roux, A.V.; Schwartz, J. Mapping community determinants of heat vulnerability. Environ. Health Perspect. 2009, 117, 1730–1736. [Google Scholar] [PubMed]
- United Nations Disaster Relief Organization (UNDRO). Mitigating Natural Disasters: Phenomena, Effects and Options : A Manual for Policy Makers and Planners; United Nations: New York, NY, USA, 1991. [Google Scholar]
- Corobov, R.; Sheridan, S.; Opopol, N.; Ebi, K. Heat-related mortality in Moldova: The summer of 2007. Int. J. Climatol. 2013, 33, 2551–2560. [Google Scholar] [CrossRef]
- Davis, R.E.; Knappenberger, P.C.; Michaels, P.J.; Novicoff, W.M. Changing heat-related mortality in the United States. Environ. Health Perspect. 2003, 111, 1712–1718. [Google Scholar] [CrossRef] [PubMed]
- Dessai, S. Heat stress and mortality in Lisbon part 1. Model construction and validation. Int. J. Biometeorol. 2002, 47, 6–12. [Google Scholar] [CrossRef] [PubMed]
- Xuemei, B.; Peijun, S.; Yansui, L. Realizing China’s urban dream. Nature 2014, 509, 158–160. [Google Scholar] [CrossRef] [PubMed]
- Grimm, N.B.; Faeth, S.H.; Golubiewski, N.E.; Redman, C.L.; Wu, J.; Bai, X.; Briggs, J.M. Global change and the ecology of cities. Science 2008, 319, 756–760. [Google Scholar] [CrossRef] [PubMed]
- Lundgren, K.; Kjellstrom, T. Sustainability challenges from climate change and air conditioning use in urban areas. Sustainability 2013, 5, 3116–3128. [Google Scholar] [CrossRef]
- Cutter, S.L.; Boruff, B.J.; Shirley, W.L. Social vulnerability to environmental hazards. Soc. Sci. Q. 2003, 84, 242–261. [Google Scholar] [CrossRef]
- Johnson, D.P.; Stanforth, A.; Lulla, V.; Luber, G. Developing an applied extreme heat vulnerability index utilizing socioeconomic and environmental data. Appl. Geogr. 2012, 35, 23–31. [Google Scholar] [CrossRef]
- Luber, G.; McGeehin, M. Climate change and extreme heat events. Am. J. Prev. Med. 2008, 35, 429–435. [Google Scholar] [CrossRef] [PubMed]
- Collins, T.W.; Grineski, S.E.; de Lourdes Romo Aguilar, M. Vulnerability to environmental hazards in the Ciudad Juárez (Mexico)—EI Paso (USA) metropolis: A model for spatial risk assessment in transnational context. Appl. Geogr. 2009, 29, 448–461. [Google Scholar] [CrossRef]
© 2014 by the authors; licensee MDPI, Basel, Switzerland. This article is an open access article distributed under the terms and conditions of the Creative Commons Attribution license (http://creativecommons.org/licenses/by/4.0/).
Share and Cite
Dong, W.; Liu, Z.; Zhang, L.; Tang, Q.; Liao, H.; Li, X. Assessing Heat Health Risk for Sustainability in Beijing’s Urban Heat Island. Sustainability 2014, 6, 7334-7357. https://0-doi-org.brum.beds.ac.uk/10.3390/su6107334
Dong W, Liu Z, Zhang L, Tang Q, Liao H, Li X. Assessing Heat Health Risk for Sustainability in Beijing’s Urban Heat Island. Sustainability. 2014; 6(10):7334-7357. https://0-doi-org.brum.beds.ac.uk/10.3390/su6107334
Chicago/Turabian StyleDong, Weihua, Zhao Liu, Lijie Zhang, Qiuhong Tang, Hua Liao, and Xian'en Li. 2014. "Assessing Heat Health Risk for Sustainability in Beijing’s Urban Heat Island" Sustainability 6, no. 10: 7334-7357. https://0-doi-org.brum.beds.ac.uk/10.3390/su6107334