1. Introduction
With the improvement in living standards, the demand for animal products has dramatically increased in rural areas in China. The stockbreeding industry is expanding rapidly in rural areas around large Chinese cities such as Beijing [
1]. However, majority of stockbreeding wastes have been improperly treated and carry a high environmental risk in terms of COD (chemical oxygen demand), T-N (total nitrogen) and T-P (total phosphorus) levels because of large amounts of water pollutants released to rivers. Now, stockbreeding wastes have become the most serious pollution source in rural areas. The annual gross output of stockbreeding waste is about 1.73 billion tonnes, which is 2.7 times industrial wastes. More than 80% of the medium and large-scale farms are without the necessary facilities to treat the concentration of water pollution, and about 25%–30% of total net load of water pollution COD, T-N and T-P emitted by stockbreeding wastes directly flows into surface water [
2].
However, as a typical carbon neutral biomass resource, stockbreeding wastes can be used as an energy source with advanced technologies. Through the main biomass technologies, it is good not only in the sense that it provides carbon neutral energy and materials and it provides new business opportunities but also in that the utilization itself is a proper and perhaps one of the best treatment methods of wastes in the stockbreeding industry [
1]. Biomass conversion and energy utilization technology have great potential for reducing water pollution and increasing energy production.
Therefore, it is absolutely necessary and possible to research the optimal policies and technologies for effective utilization of stockbreeding wastes as a biomass resource and improvement of water environments in rural areas of China. Besides this, with integrated policies, we can also provide biomass resources and energy, and realize the harmonious development of the economy, resources and water environments, which is feasible and foreseeable in the future. Therefore, in formulating effective policies to reduce the quantities of water pollutants in rural areas, we need to construct a model that describes socio-economic activities, the load of water pollution and apply instruments in order to reduce water pollution without compromising socio-economic development.
In this paper, we formulate a comprehensive system by way of a linear optimization model with a mathematical optimization software package, LINGO. This enables us to simultaneously simulate the water environment system and the socio-economic system by creating as much linearity as possible in functions that is close to the reality. Detailed discussions of linear programming theory may be found in books by Hadley [
3], Hillier [
4] and Wagner [
5].
Optimization simulation is an effective approach to estimate more precisely the impacts that may result from different environmental policies. Here, we formulated the dynamic, comprehensive evaluation system to accomplish the optimization simulation. The principal method used in this research is to develop dynamic mathematical models based on several theoretical principles. The model is built based on the principal of material balance, Harrod-Domar model, input output table and other macroeconomic indicators to analyze the interrelation between water environment systems and socio-economic systems, and evaluate the efficiency of the integrated water environment management policies with the adoption of advanced technology.
Theoretically, the synthetic modeling approach was adopted to construct the model in this study summarized in the following:
Synthetic approaches have been used in modeling since the late 1960s, whereby input-output models were applied to environmental or natural resource areas. Most of them have been concerned with the effects of pollution from one or more industrial sectors on the output of other sectors such as Ayres and Kneese [
6], Leontief [
7], Forsund [
8], Lee [
9] and Perrings [
10]. In many integrated economic-ecological models, natural resource inputs and pollutants are expressed in physical units, while economic exchanges are expressed in monetary units.
Mathematically, the way of estimations methods and the description of the variables in equations are used based on the studies carried out in the Lake Kasumigaura by Higano and Sawada [
11], Higano and Yoneta [
12] and Hirose and Higano [
13]. These studies addressed the lake pollution issues considering socio-economic activities related to reduction of pollution by introducing an integrated dynamic linear or non-linear modeling approach.
The field of synthetic evaluation has been represented by Higano
et al. [
14], who evaluated biomass resources from both the total ecological system and the socio-economic perspective and proposed a new aspect of synthetic environmental evaluation and policy to control pollution and realize the optimization and harmony of society. Then, Yan
et al. [
15] improved the simulation model and focused on evaluation of the integrated policies with the adoption of traditional technology. However, the majority of the models did not carry out an empirical application analysis by advanced biomass utilization technologies based on the actual situation of China. In most current studies about biomass utilization, conclusions are derived from simple data analysis and foreign experiences. There has been little research on the construction and analysis of a comprehensive simulation policy that is tailored to suit China’s economy and social state and include the introduction of advanced technologies to control water pollutant emissions without compromising socio-economic activities [
1]. Therefore, a feasible simulation should be constructed to realize the simultaneous pursuit of water environment preservation and economic development on the basis of characteristics of China.
Based on these considerations, this study utilized a dynamic optimization model to demonstrate water environment policies with the introduction of advanced stockbreeding biomass resource utilization technology to enhance the stockbreeding production and improve the water environment from sustainable development viewpoints. The integrated simulation model aims to reflect current and future water environment management policies and their impacts, which includes water pollutants flow balance sub-model, socio-economic sub-model and biomass energy sub-model with introduction of effective biomass resource utilization technology in one systematic model. In this article, we selected a typical region of rural area in China, Shunyi district of Beijing, which is the most important pig supply source of Beijing. Considering the specific and special characteristics of China’s economy and social state in terms of sustained economic growth rate, financial subordination relations and regional water environment management policies, we improved the simulation model and focused on the evaluation of the harmonious development of water quality improvement and economic growth based on the utilization of stockbreeding biomass resources. Our principal goal here is to develop a mathematical optimization model by computer simulation in order to evaluate whether the integrated water environment management policies can satisfy the simultaneous pursuit of water environment preservation and economic development in the target area.
2. Synthetic Model Construction and Specification
In order to construct an effective simulation model, we need to have basic information on the current situation in the target area which includes the social and economic situation, water pollutants’ flow process and emission, and biomass resource generation and treatment process.
2.1. Framework of the Model
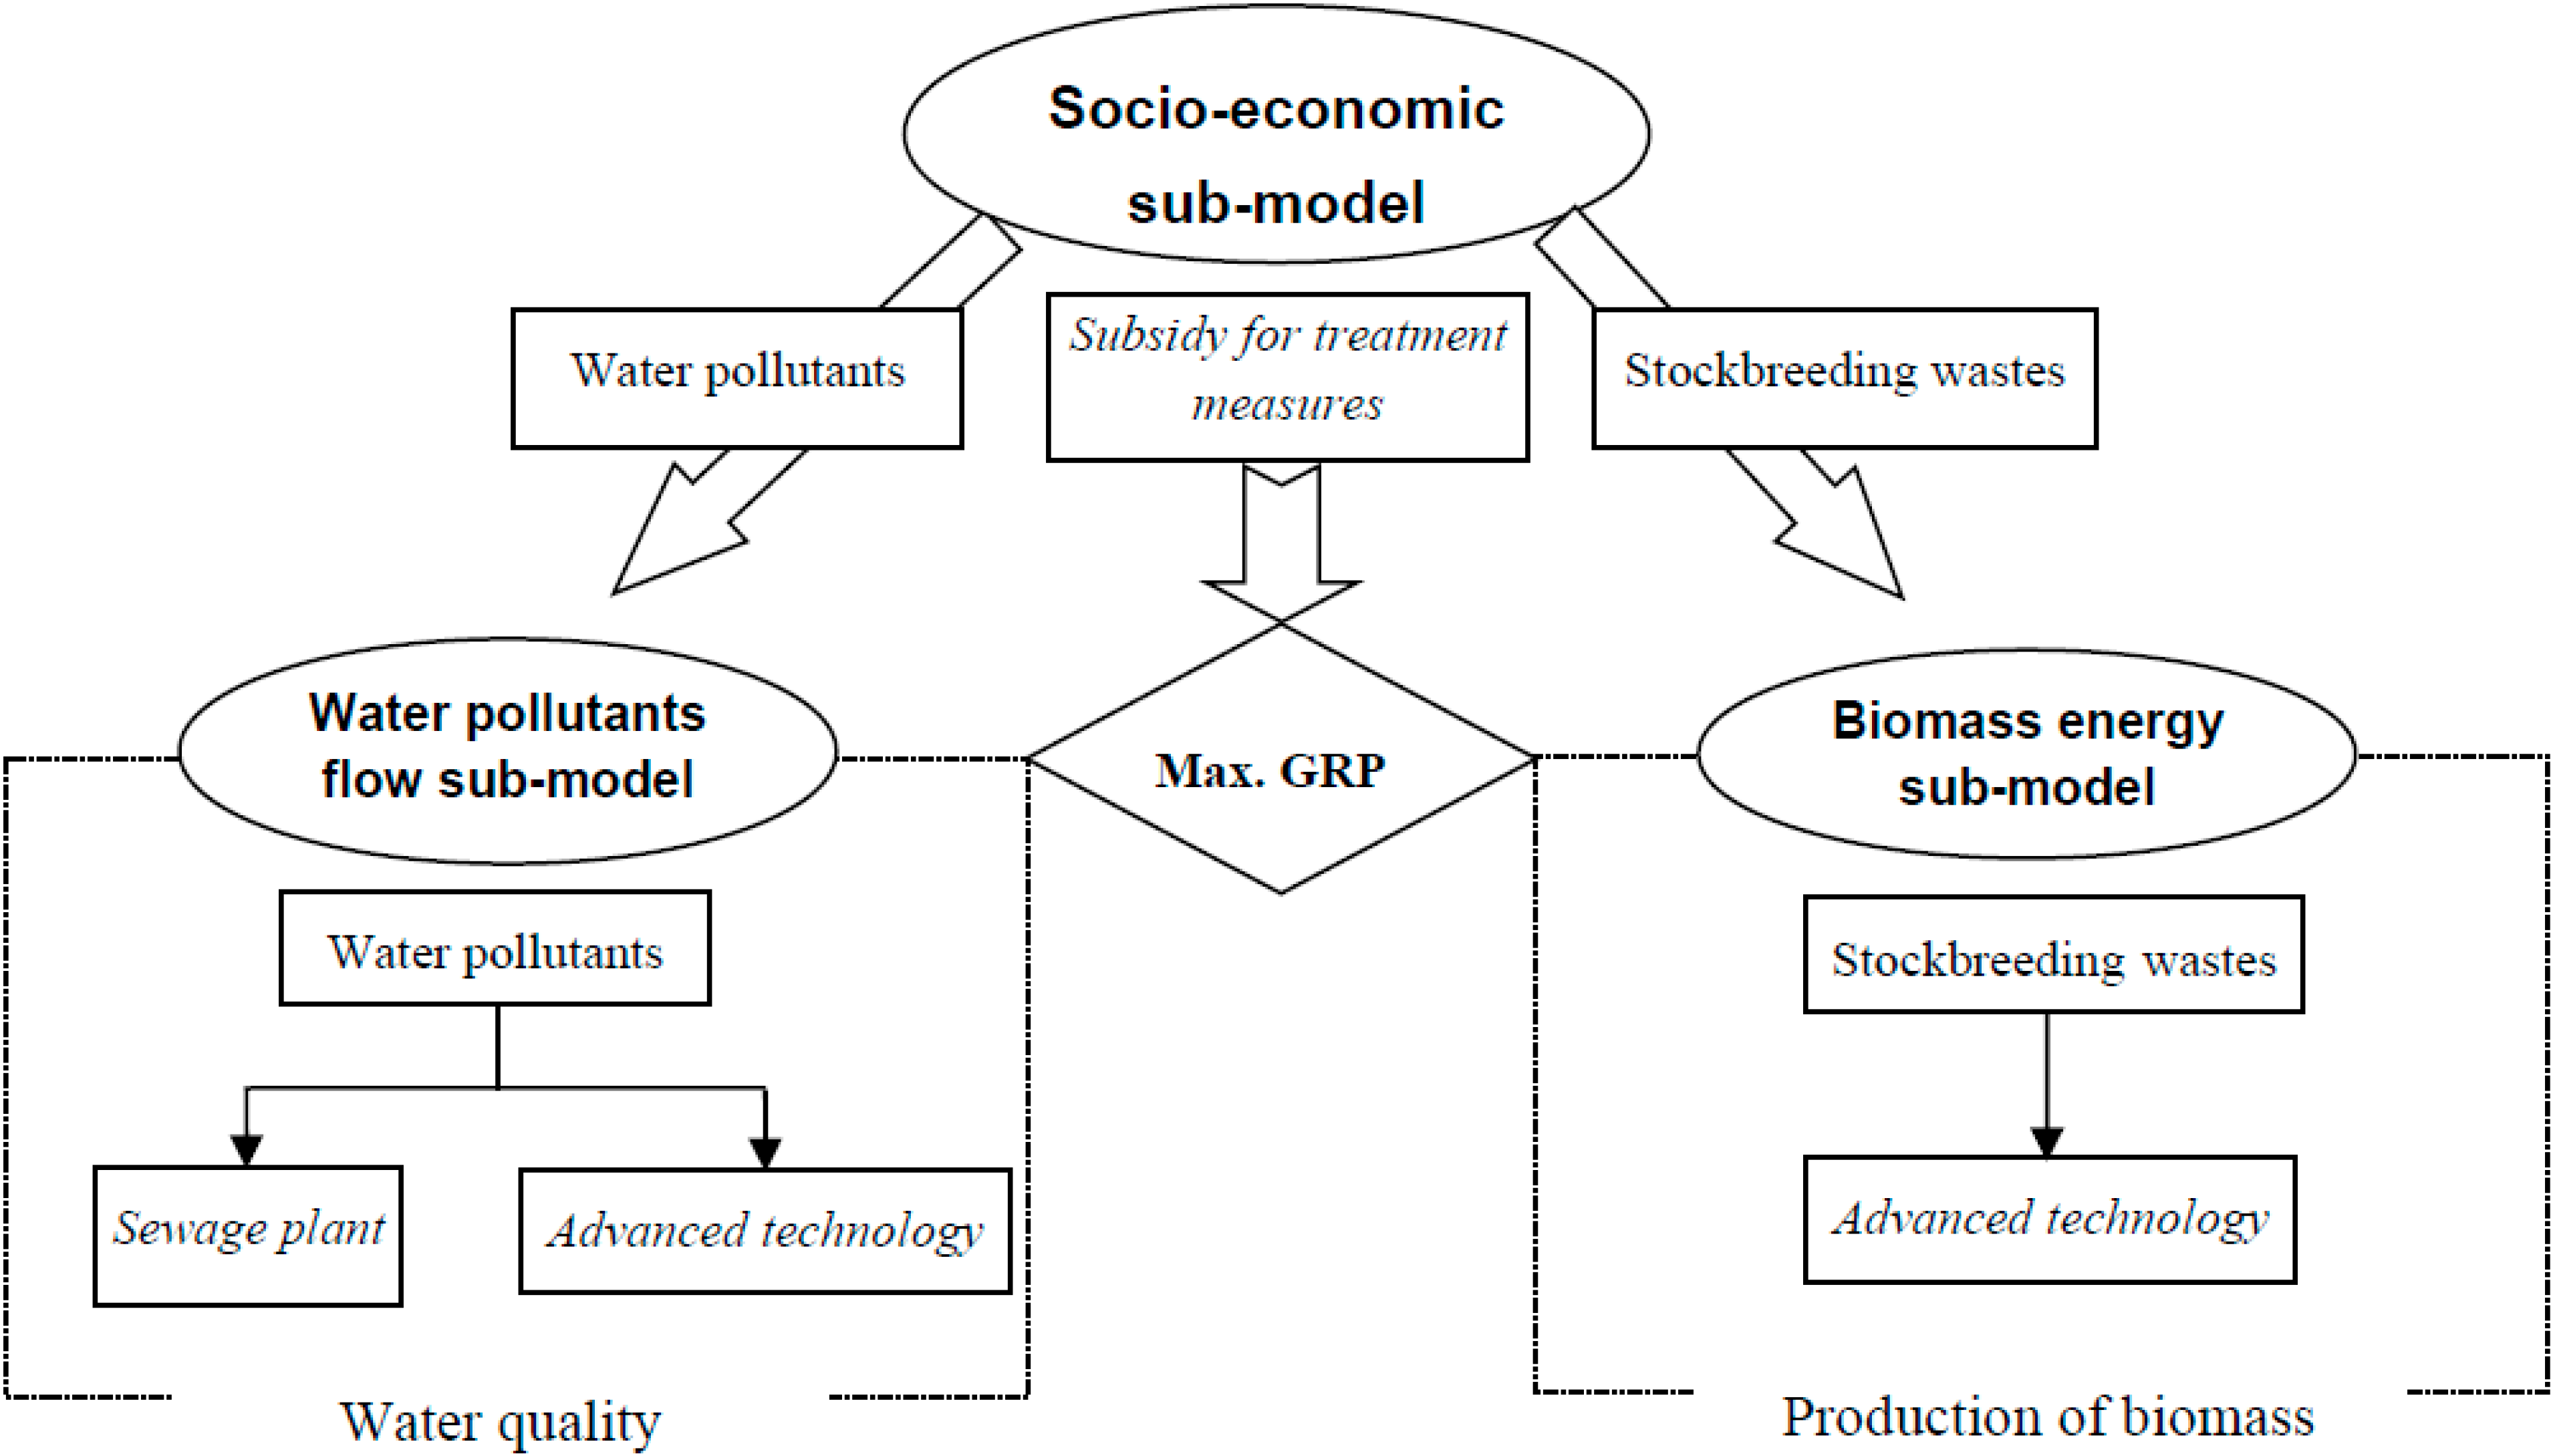
The dynamic model contains three sub-models: a socio-economic sub-model, water pollutants flow balance model, biomass resource energy sub-model and one objective function. These three sub-models react with each other and the structure of the model must consider the material flow balance, energy flow balance and value balance. The objective function was derived to maximize GRP (Gross Regional Production), which was subjected to analysis by the sub-models. The framework of the sub-models is shown in
Figure 1. The water pollutants flow sub-model describes how the water pollutants flow into the river. The socio-economic model represents the social and economic activities in the region and the relationship between the emission of water pollutants and social and economic activities. The energy sub-model simulated how much stockbreeding biomass energy can be produced by the advanced technology.
Figure 1.
The framework of simulation model.
Figure 1.
The framework of simulation model.
2.2. Objective Function
In Shunyi district, the speed of socio-economic development is higher compared with other rural areas of Beijing. The local government has set the target to become a new rural area and maintain steady growth in recent years. Therefore, in this simulation, an objective function was constructed to maximize the total GRP over the target term to reflect the development of the local socio-economy. Because of the limitation of space, this paper just demonstrates the representative equations which can illustrate the topic of this dynamic model (en. = endogenous, ex. = exogenous).
in which, GRP(t) (en.) is the gross regional production of the target area at time t, which is determined by the production of industry and value-added rate; ρ (ex.) is social discount rate (=0.05); ν (ex.) is row vector of ith element is rate of added value in the ith industry ; X(t) (en.) is the column vector of the m-th element that is the total production of industry m in th target area at time
t;
t is the simulation period, and
t = 1: 2011,…,10: 2020.
2.3. Socio-Economic Sub-Model
The socio-economic sub-model is derived from input-output model and Harrod-Domer model. The production of industry is restricted by input-output coefficient matrix, investment and so on.
in which,
(en.) is total production of industry
m in region
j at time
t;
(ex.) is the ratio of capital to output in industry m;
(en.) is capital available for industry m in region
j at time
t;
(en.) is subsidy for production curtailment of region
j at time
t;
(en.) is capital available for industry m in region j at time
t + 1;
(en.) is investment by industry
m in region
j at time
t + 1;
(ex.) is depreciation rate of industry
m.
in which,
(en.) is column vector of the m-th element that is the total product of industry
m in the basin at time t;
A (ex.) is input-output coefficient matrix;
C(
t) (en.) is the total consumption at time
t;
(ex.) is the total investment at time t;
BSP (ex.) is the column vector of m-th coefficient that induced production in industry m by construction of sewage plant;
ISP(
t) (en.) is the total investment for construction of sewage plant at time
t;
BAT (ex.) is the column vector of m-th coefficient that induced production in industry m by construction of advanced technology;
IAT(
t) (en.) is the total investment for construction of advanced technology at time
t;
(ex.) is the column vector of m-th coefficient that induced production in industry m by maintenance of advanced technology;
(en.) is the capital of advanced technology available in region
j at time
t and
e(
t) is the column vector of net export at time
t.
2.4. Water Pollutants Flow Balanced Sub-Model
In the rural areas, the rapid growth of population and stockbreeding industry pose a significant threat to the water environment due to the emission of huge amounts of pollutants in terms of COD, T-N and T-P. The net load of water pollutants in the target area is defined as the total water pollutants that flow thorough the rivers, including discharges by sewage plants, and untreated wastes from households, and rainfall in the target area.
in which,
(en.) is the load of water pollutant
p in region
j at time
t;
(ex.) is the current velocity at time
t;
(en.) is the water pollutant emitted by socio-economic activities that flowing into region
j at time
t;
(ex.) is the pollution emission coefficient of sewage plant in the area at time
t;
(ex.) is the population that use the sewage plant of the region
j at time
t;
RPP(
t) (ex.) is the water pollutant
p from rainfall that flows into the area. In the simulation equations at time
t,
p = 1 represent the water pollutant T-N,
p = 2 represents T-P and
p = 3 represents COD. All the pollutants emitted by socio-economic activities flow through rivers.
The total water pollutants emitted by socio-economic activities in the area are discharged from households, non-point sources, and point sources.
in which,
(en.) is the water pollutant
p (excluding those through sewage) loaded by households in region
j at time
t;
(en.) is the water pollutant p emitted by non-point sources in region
j at time
t and
(en.) is the water pollutant
p emitted by socio-economic activities in region
j at time
t.
Water pollutants are discharged by household, which is associated with the population in each municipality.
in which,
(ex.) is the emission coefficient of water pollutant
p by household wastewater without sewage plant and
(en.) is the population that do not use sewage plant in region
j and discharges pollutants into river at time t.
in which,
ELpk (ex.) is the coefficient of water pollutant
p emitted through land use k and
(en.) is the area of land use
k in region
j that emitted pollutants into river at time
t.
in which,
(ex.) is the coefficient of water pollutant
p emitted by industry
m;
(en.) is the production of industry
m in the area of region
j that emitted pollutants into the rivers at time
t;
(ex.) is the coefficient of water pollutant
p emitted in pig feces and urine without any treatment;
(en.) is the number of pigs for which feces and urine were not treated in region
j at time
t;
(ex.) is the coefficient of water pollutant
p emitted by pigs whose feces and urine treated by advanced technology and
(en.) is the number of pigs whose feces and urine is treated by advanced technology in region
j at time
t.
2.5. Stockbreeding Biomass Energy Sub-Model and Water Pollutant Treatment Policies
In order to demonstrate the contributions of sewage system treatment and advanced biomass utilization technologies on water pollution reduction and biomass energy production ability, we need to select demonstrative technologies to suit characteristics of the local situation. Sewage system treatment and advanced biomass utilization technologies choice and distribution are based on the different regional scales of population, the pig farming industry and the demand for water pollutants reduction. Also, construction investment and maintenance costs of sewage system and biomass utilization facilities are determined by local financial budget limitations that are provided by the local government. The amount of electric energy generated by the advanced technology is dependent on its capital.
in which,
(en.) is the amount of electric energy generated by advanced technology in region
j at time t;
(ex.) is the coefficient of electric energy generation of advanced technology and
(en.) is the capital of advanced technology available in region
j at time
t.
in which,
(en.) is the investment for construction of advanced technology in region
j at time
t;
(ex.) is the rate of subsidization for construction of advanced technology by the local government and
(en.) is the subsidization for construction of advanced technology by the local government at time
t.
in which,
(en.) is the construction investment of municipality
i for sewage plant at time
t;
(ex.) is the rate for investment of sewage system from the municipality
i;
(ex.) is the rate transfer for investment of household wastewater from the total finance of municipality
i;
(en.) is the total finance of municipality
i at time
t;
(ex.) is the rate transfer for maintenance cost of household wastewater from the total finance of municipality i;
(ex.) is the rate transfer for treatment of household wastewater from the total finance and
(en.) is the subsidy for households wastewater treatment in municipality
i at time
t, which is granted by the local government.
It is assumed that the local government provides budget for implementing the countermeasures every year. This figure is based on the actual budget that has been directly and indirectly spent to improve the quality of the water environment.
in which,
(ex.) is the total budget spent by the local government for implementing the countermeasures at time t and
(en.) is the subsidy for industry
m in region
j at time
t.
Because the model consisted of 45 mathematical formulas, we only listed the demonstrative equations to reflect synthetic water environment and socio-economic system; there are also other equations to construct the simulation model, such as the population changes, the quantitative change in pig supply and treatment policies for non-point sources.
3. Target Area and Data
In this paper, we select seven towns along the banks of Chaobai river basin in Shunyi district of Beijing as the target area. Shunyi district is the most important key pig supply place of Beijing, the quantity of pigs slaughtered of Shunyi district accounts for 31% of the total quantity of Beijing [
16]. The pig farming industry has become the pillar industry of Shunyi district. At the same time, as the largest reservoir of Beijing is built on the upper reaches of the Chaobai River, the water environment is very important to Shunyi district, even to Beijing. Chaobai river flows through the seven towns of Shunyi district into Beijing city. The protection of the water environment in seven towns of Shunyi district holds high priority. Meanwhile, the development of the pig farming industry and population growth has increased the pressure for water environment management. According to our calculation based on the statistics and the coefficient of stockbreeding sewage, stockbreeding wastes in the target area contribute heavily to water pollution, especially with the pig farming industry becoming the source of the most serious pollution in Shunyi district (
Table 1). The T-N emitted by the pig farming industry accounted for about 21% of total amount of T-N, while 34% of T-P and 27% of COD were emitted by pig farming industry. The pig farming industry has become a source of serious water pollution in the target area [
16,
17,
18,
19].
Therefore, it will be useful and necessary for the target area to have an integrated plan for water environment management with emphasis on effective pig farming biomass resource utilization. This study will adopt water environment management policies to simulate and predict the influence of effective utilization of pig farming biomass resources on water environment improvement and economic development.
Table 1.
The scale of pig farming and water pollution emission of the pig farming industry.
Table 1.
The scale of pig farming and water pollution emission of the pig farming industry.
| Towns | Land of Area | Numbers of Pig | Production of Pig Farming | Net Load of Pollutants t/Year |
|---|
| km2 | Head | RMB | T-N | T-P | COD |
|---|
| Niulanshan town | 31.4 | 37,847 | 30,277,600 | 178.83 | 70.48 | 1100.30 |
| Mapo town | 35.1 | 20,481 | 16,384,800 | 96.77 | 38.14 | 595.43 |
| Renhe town | 54 | 35,906 | 28,724,800 | 169.66 | 66.86 | 1043.87 |
| Liqiao town | 75.18 | 17,539 | 14,031,200 | 82.87 | 32.66 | 509.90 |
| Beixiaoying town | 55.8 | 71,470 | 57,176,000 | 337.70 | 133.08 | 2077.79 |
| Nancai town | 57.6 | 47,243 | 37,794,400 | 223.22 | 87.97 | 1373.46 |
| Lisui town | 40.22 | 49,714 | 39,771,200 | 234.90 | 92.57 | 1445.30 |
| Total | 349.3 | 280,200 | 224,160,000 | 1323.95 | 521.76 | 8146.04 |
3.1. Classification of the Target Area and Settings for the Simulation
3.1.1. Classification of the Target Area
The Chaobai river is the main river flowing into Beijing city. The river flows through seven towns of Shunyi district—they are Niulanshan town, Mapo town, Renhe town, Liqiao town, Beixiaoying town, Nancai town and Lisui town—and other small rivers in the basin flow into the Chaobai river.
We measured three water pollutants in the simulation, including T-N, T-P and COD. The different coefficient generation sources were classified as household, non-point, production and pig farming. Industry was classified as pig farming industry, other stockbreeding industries, planting industry, manufacturing industry and other industries based on the characteristics of the target area.
According to the data collected through a sample survey, we have gathered relevant data on the socio-economic and water pollution in the target area. To achieve our research purposes, we structured the comprehensive simulation model including a water pollutant flow balance sub-model, a socio-economic sub-model, a biomass energy sub-model and one objective function to express all the factors and parameters to reflect the influence of effective pig wastes biomass resource utilization on water environment.
3.1.2. Constraints and Setting for the Simulation Model
Optimization model enables us to simultaneously simulate the water environment management and socio-economic situation by creating as much linearity as possible in the functions that is close to the reality [
1]. Therefore, we formulate the comprehensive system as a linear optimization model which we solve using a mathematical optimization software package, LINGO.
In the simulation case study, we set a series of constraints for this comprehensive water environment management model. The water pollutant emission limitation is set as the local government target, 15% COD reduction by 2020 compared with 2010. The socio-economic development constraints are defined by the input-output model.
3.2. Introduction of Water Environment Management Policies
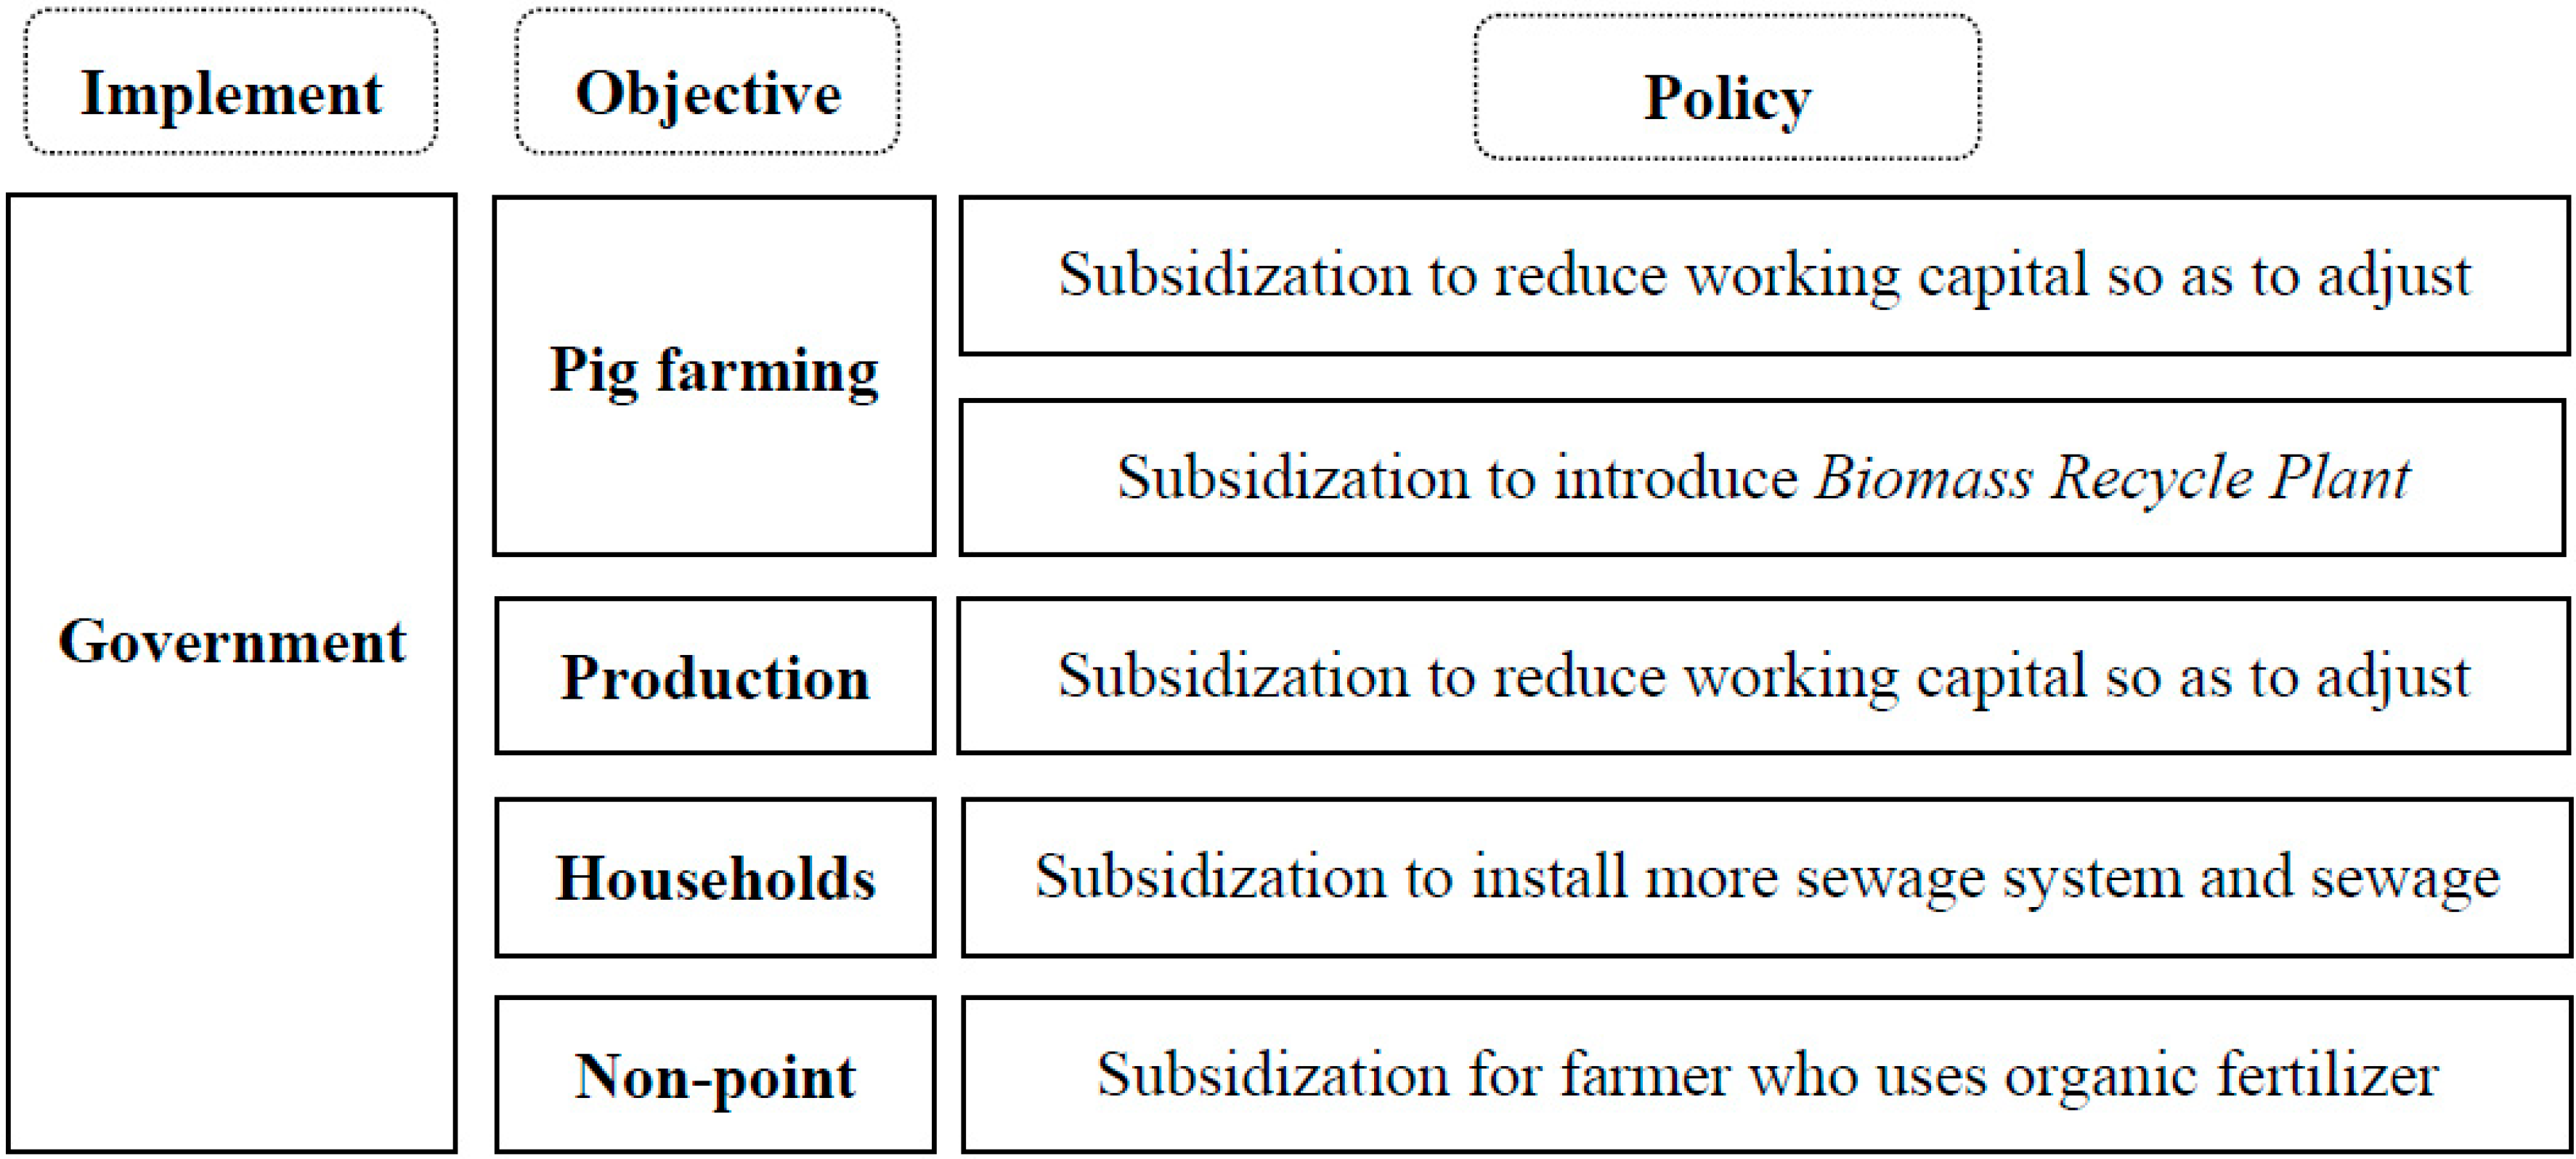
Based on the present technology and policies that the local government has adopted and the advanced technology that we introduced to the target area, the integrated water environment management policies used in the simulation were incorporated to reduce water pollutants for the target area. Particularly, the government of the target area adopted wet methane fermentation technology and composting to treat sewages emitted by the pig farming industry. Since we utilize sewage treatment and advanced biomass resource utilization technology to solve current water environment problems and produce more biomass energy for the target area, we introduced a biomass recycling plant from Japan as the advanced technology in the integrated water environment management policies based on the characteristics and scales of pig farms in the target area (
Figure 2).
Figure 2.
Integrated policies of the target area.
Figure 2.
Integrated policies of the target area.
Biomass recycle plant technology is adopted as advanced technology to treat serious pollutants emitted by the pig farming industry. The process consists of methane fermentation, electrified treatment and a heat and power supply system. Compared with the treatment technology for pig waste that was adopted by the target area, the treatment and biomass energy transition of the biomass recycling plant technology is much higher (
Table 2), but its investment and installation costs are also higher than that of wet methane fermentation technology and composting (
Table 3). Therefore, we should search for the optimal arrangement of the advanced technologies and the treatment efficiency based on subsidy restrictions and water environment requirements of the target area.
Table 2.
Pollutant coefficient of different technologies [
1,
20].
Table 2.
Pollutant coefficient of different technologies [1,20].
| Technology | Water Pollutants Treatment Coefficient kg/One Pig-Year |
|---|
| T-N | T-P | COD |
|---|
| Compost | 5.18 | 0.047 | 2.85 |
| Wet methane fermentation | 3.25 | 0.021 | 1.79 |
| Biomass recycle plant | 0.034 | 0.003 | 0.034 |
Table 3.
Investment of advanced technology [
1,
20].
Table 3.
Investment of advanced technology [1,20].
| Data | Biomass Recycle Plant | Unit |
|---|
| Construction Cost | 6.5 million | RMB Yuan |
| Maintenance Cost | 0.39 million | RMB Yuan |
| Electricity Generated | 227.59 thousand | kWh/year |
| Target Scale of Pig Farm | 1000 | Pigs |
3.3. Data
The basic data were obtained from the yearbook of Shunyi district 2011 [
18], Shunyi district Environment Bulletin in 2011 [
21], the digital data for the simulations were calculated based on this basic data and related statistics from the State Environmental Protection Administration of China [
17], and partial data of the technologies were obtained from the research paper of Yan
et al. [
20].
4. Simulation Results
Based on the data processing and simulation, the comprehensive water environment management model results can provide a forecast of water pollutant generation and treatment, water quality improvement, economic development and biomass energy production in the simulation period (2011–2020) under certain cases.
In the simulation, we defined the water pollutants’ emission limitation according to the local government target to decrease 15% of COD emission by 2020 compared with that in 2010, and water pollutants were assumed to be descending year by year. Feasible solutions were achieved in Case 15 (COD deceases of 15% in 2020 as compared with 2010) when we adopted the water environment management policies both with introduction of the advanced technology and without introduction of the advanced technology.
4.1. Objective Function
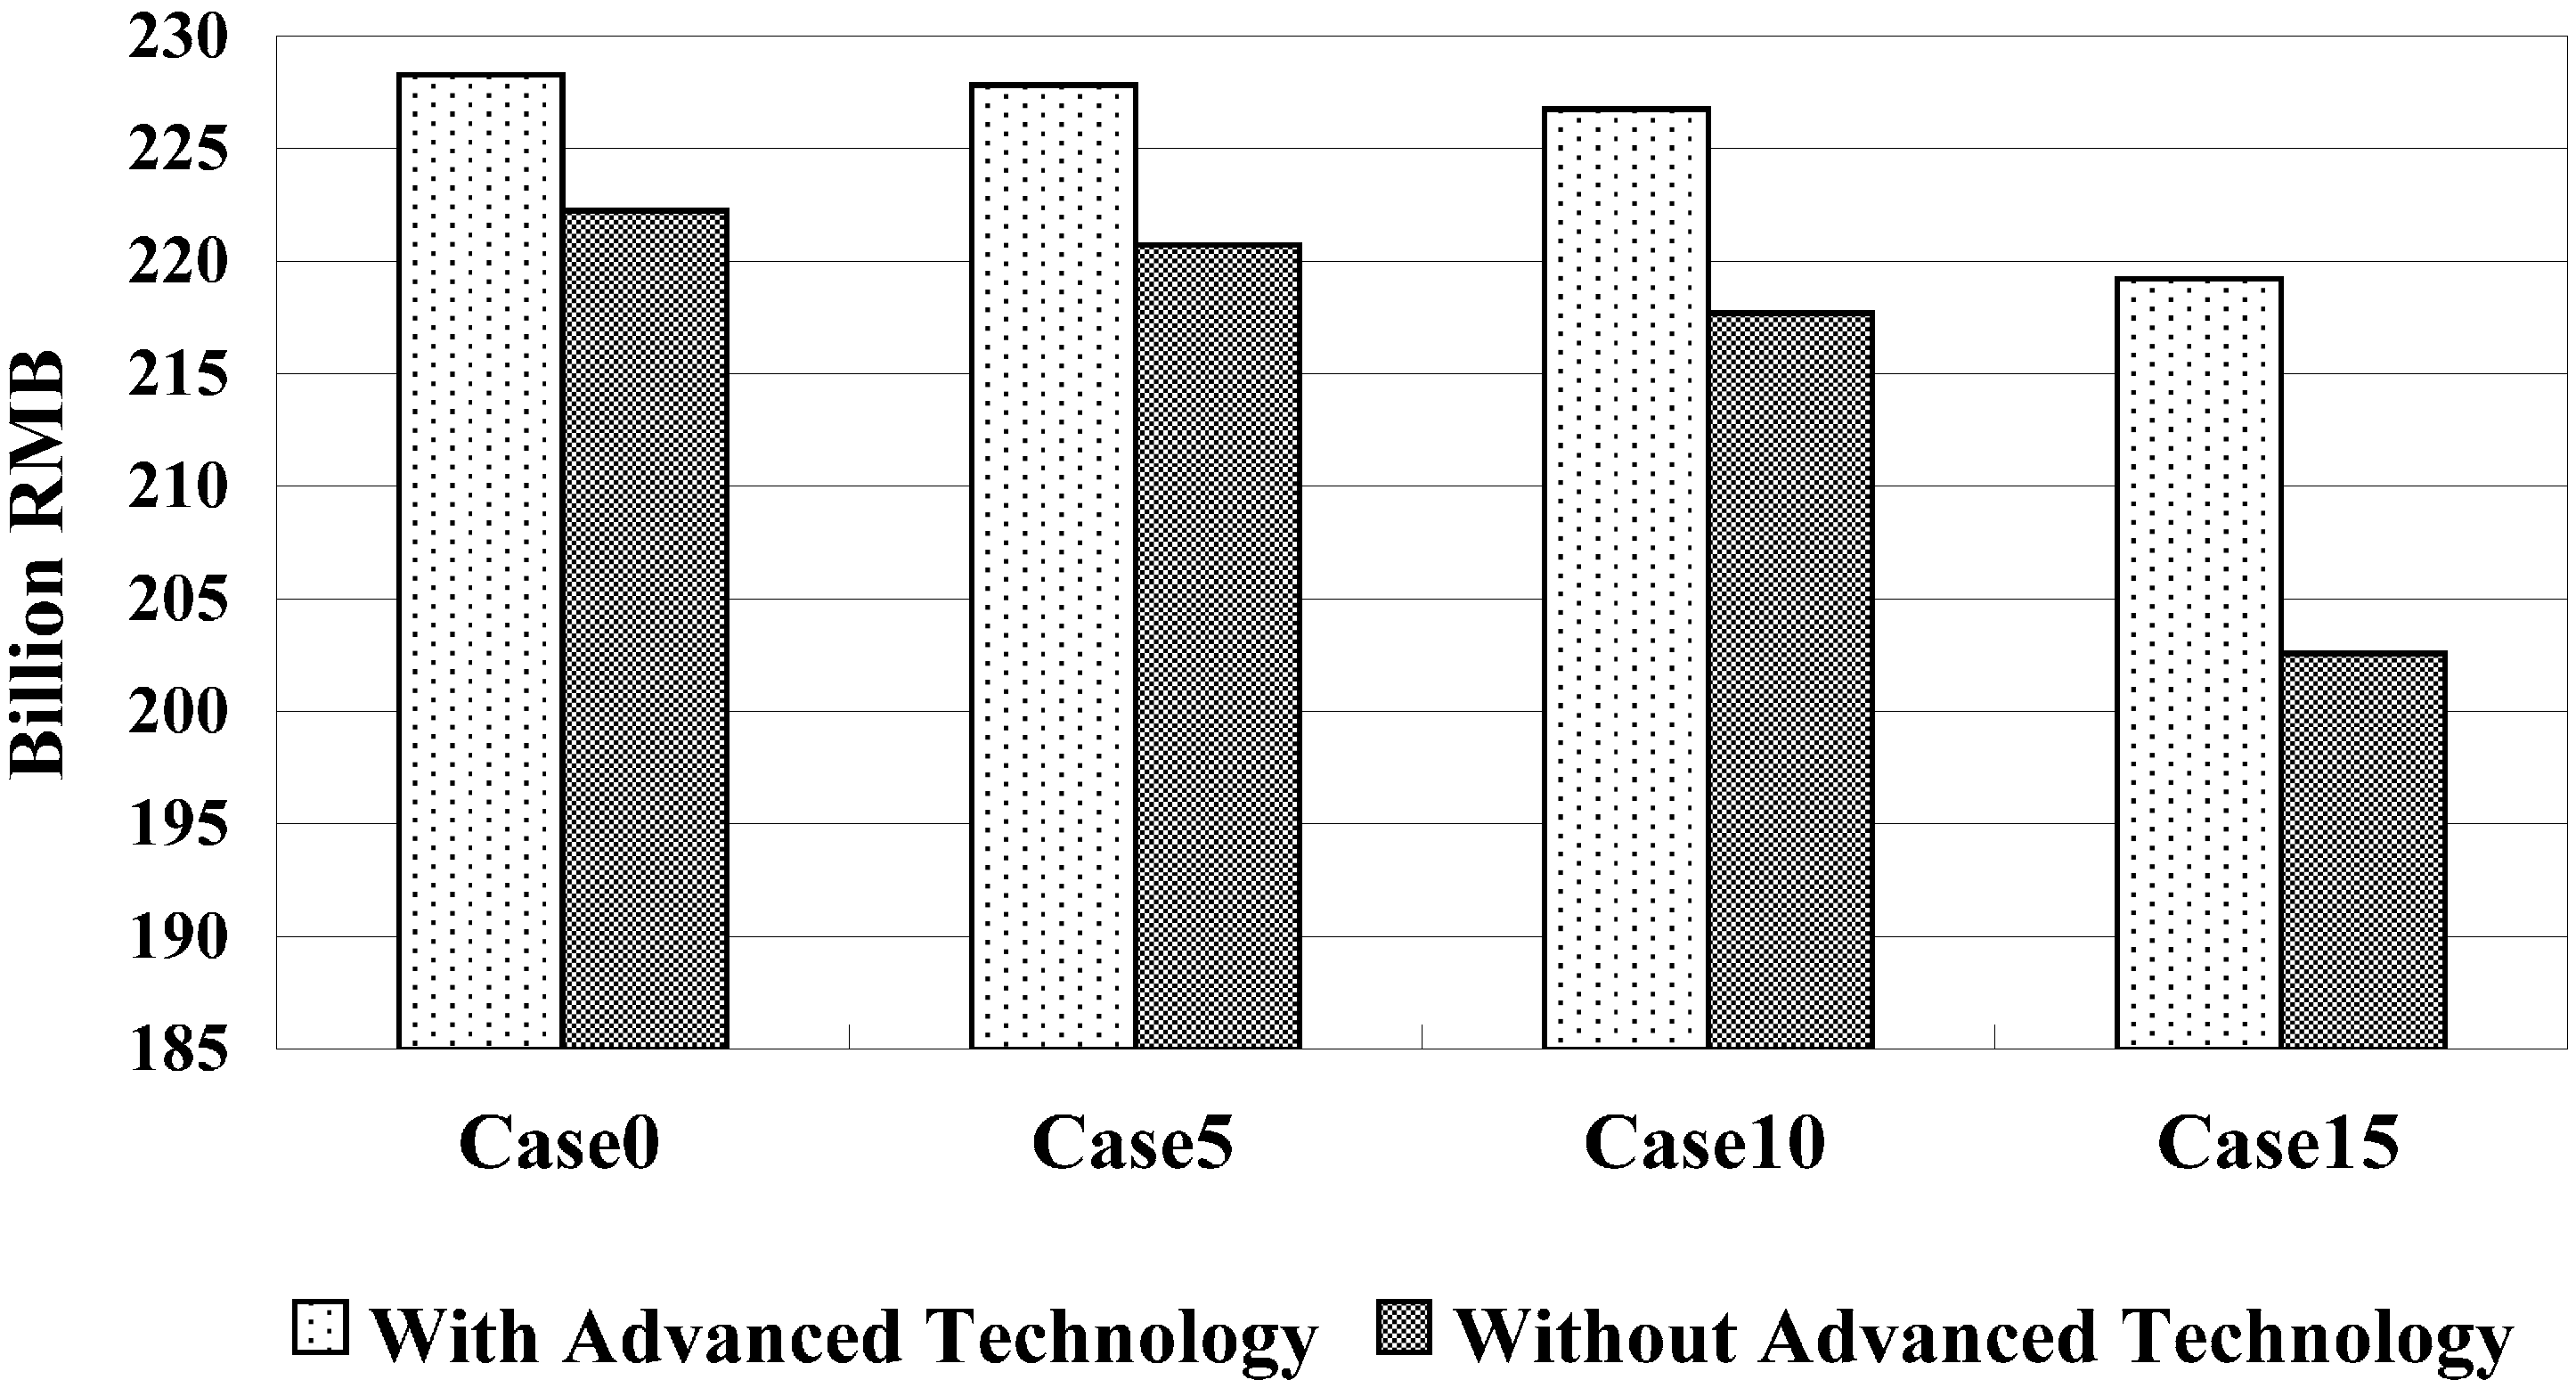
Although we obtained the feasible solution for Case 0 to Case 15 in the simulation, the results of objective function demonstrated that Case 15 with adoption of advanced technology achieved the high level of GRP from 2011–2020 as compared with when not adopted, the introduction of advanced technology is more effective to simultaneously realize water environment purification and economic development.
When introduction of the advanced technology and COD decreased by 15% compared to 2010; the total GRP accumulated for 10 years had a difference of more than 16.63 billion RMB when the advanced technology was adopted in Case 15 as compared to when it was not adopted (
Figure 3). Introduction of advanced technology raised GRP by 7.6% as compared to without the introduction of advanced technology.
Figure 3.
Accumulated total GRP (2011–2020).
Figure 3.
Accumulated total GRP (2011–2020).
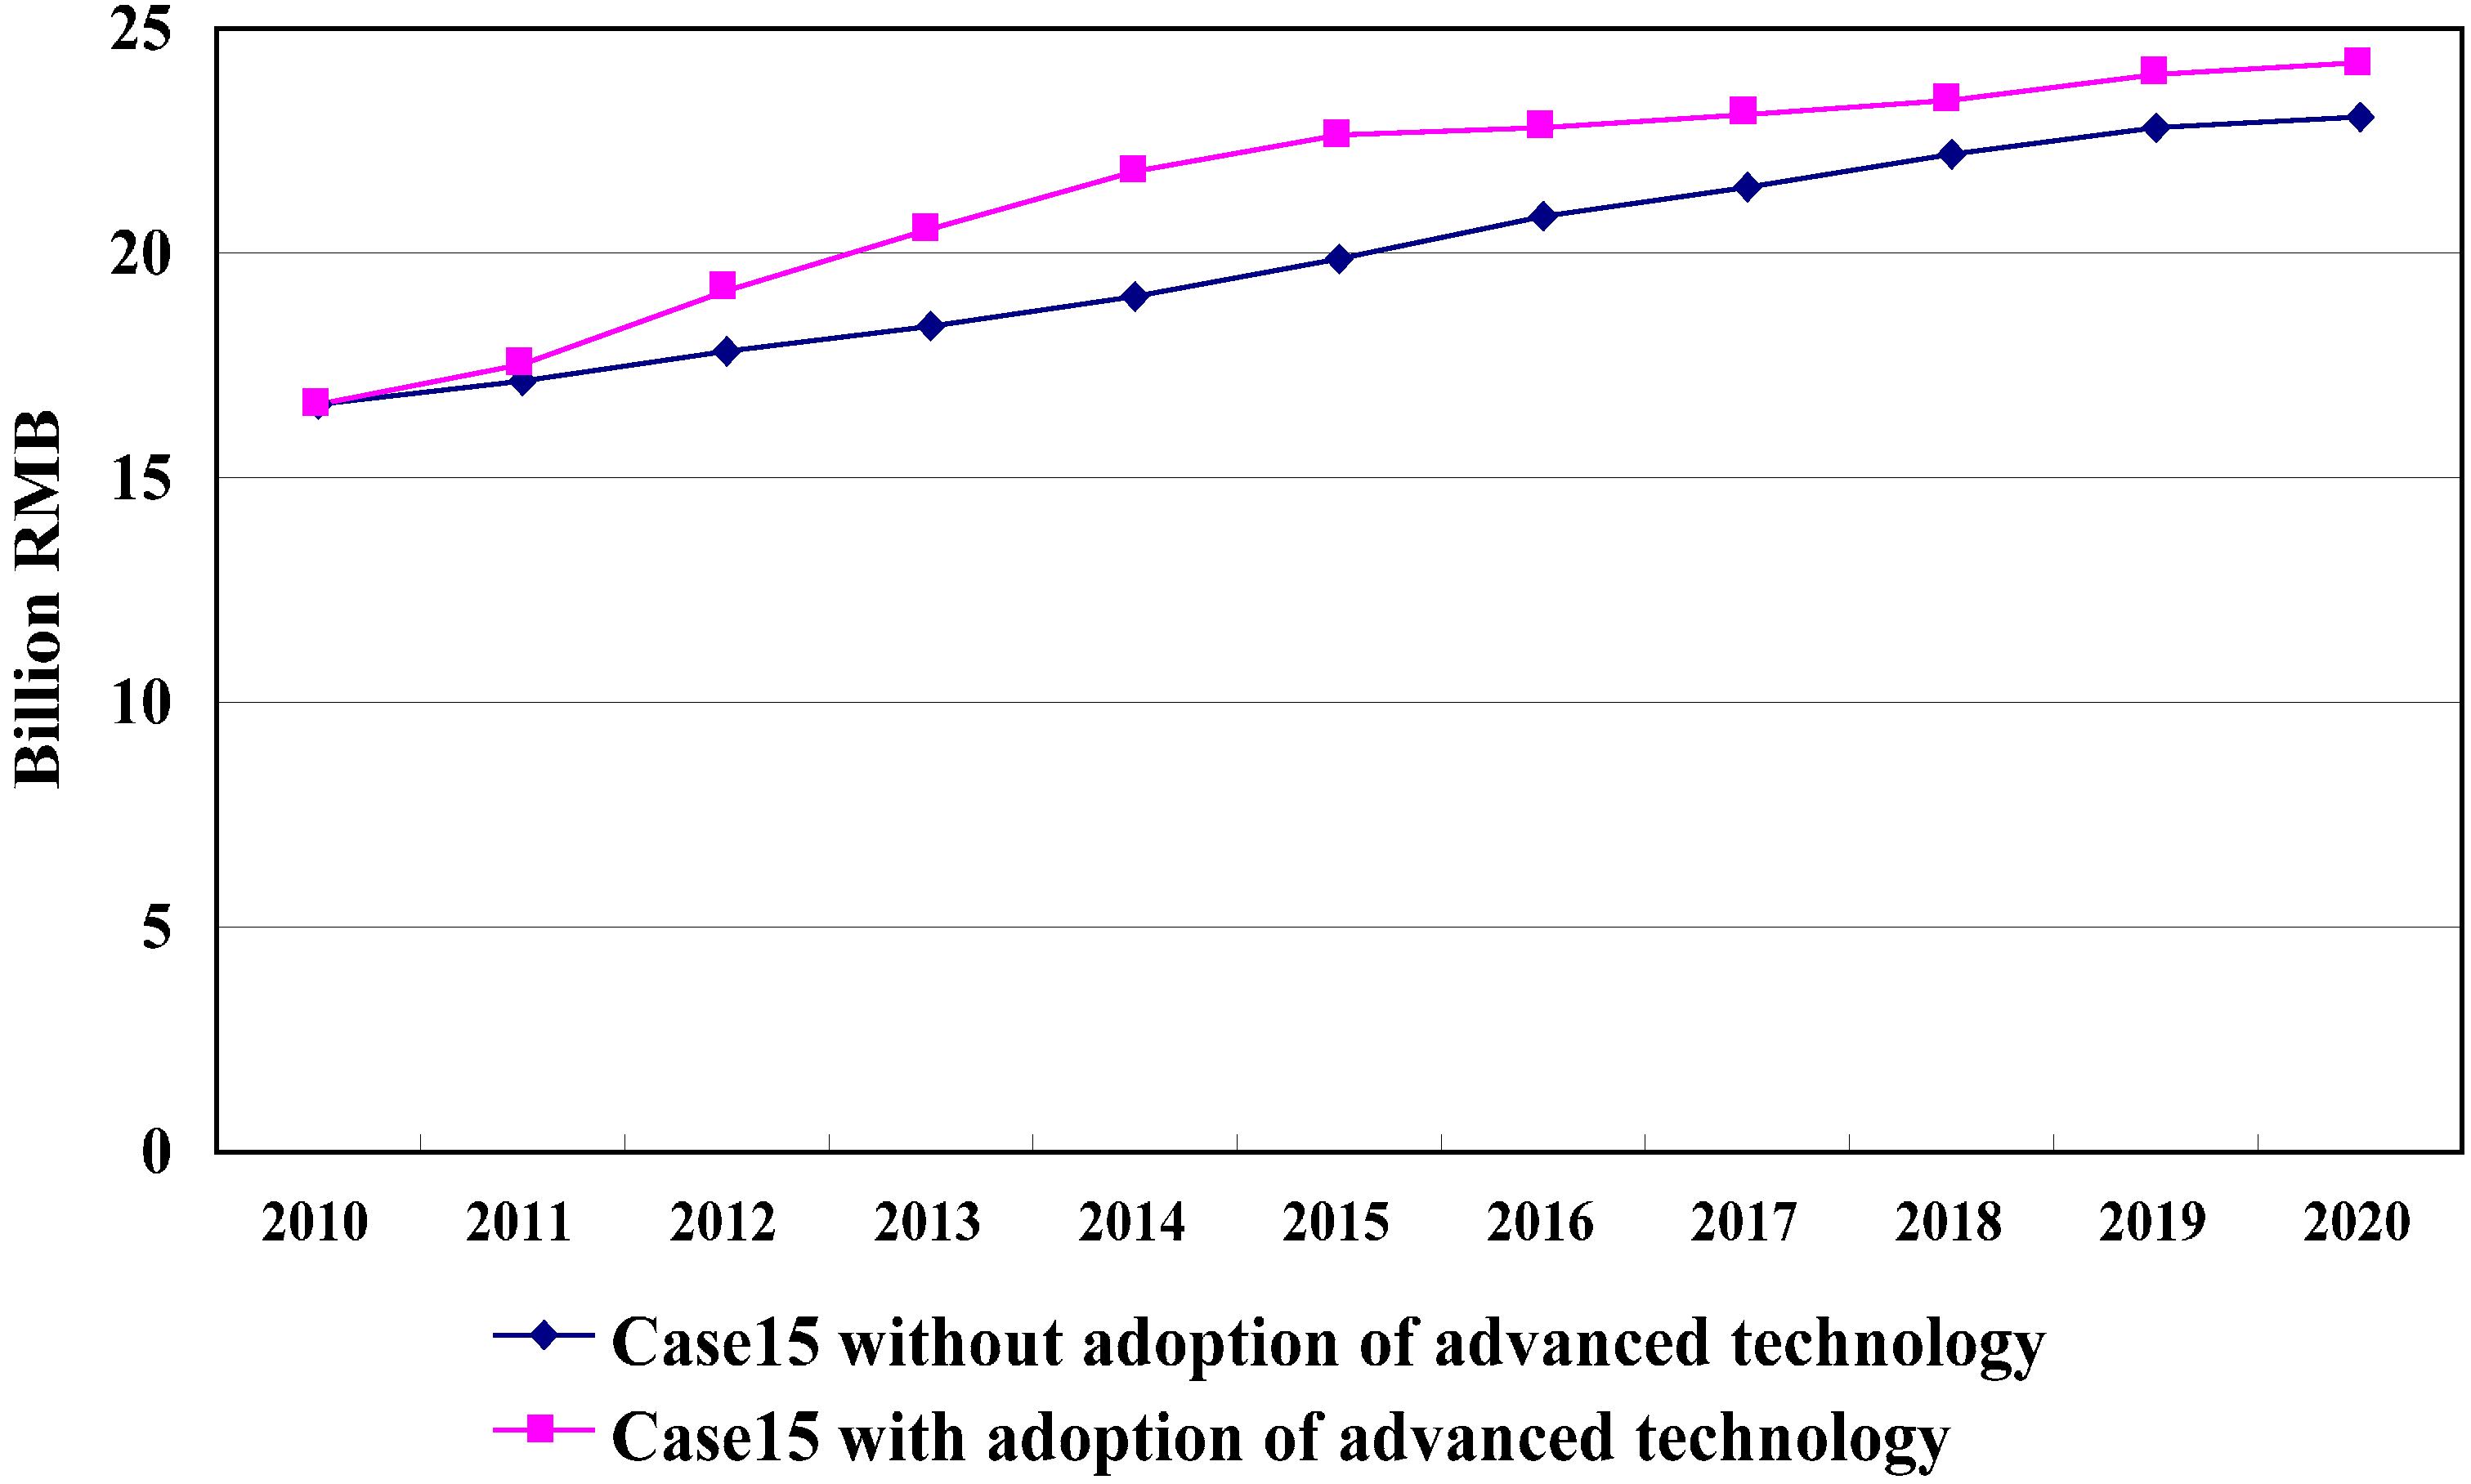
The variation in GRP from 2011–2020 is shown in
Figure 4. In Case 15, the GRP increased 7.3% in 2020 with adoption of the advanced technology when compared with no adoption. This result verifies that the advanced technology we introduced in the water environment management policies had positive impacts on the regional economic development with the restriction of water pollutant emissions. However, we can find from
Figure 4 that the GRP increase rate in Case 15 with adoption of advanced technology was about 2% from 2016–2020. This simulation result shows that current technology and water environment management policies or the strict water pollutant constraint is not adequate for economic and water environment management, and it is necessary to develop new water purification technologies or other incentive policies of water environment management in the future to treat the water pollution emitted by households and the manufacturing industry in the target area.
Figure 4.
Change in GRP (Case 15).
Figure 4.
Change in GRP (Case 15).
4.2. Improvement of Water Environment
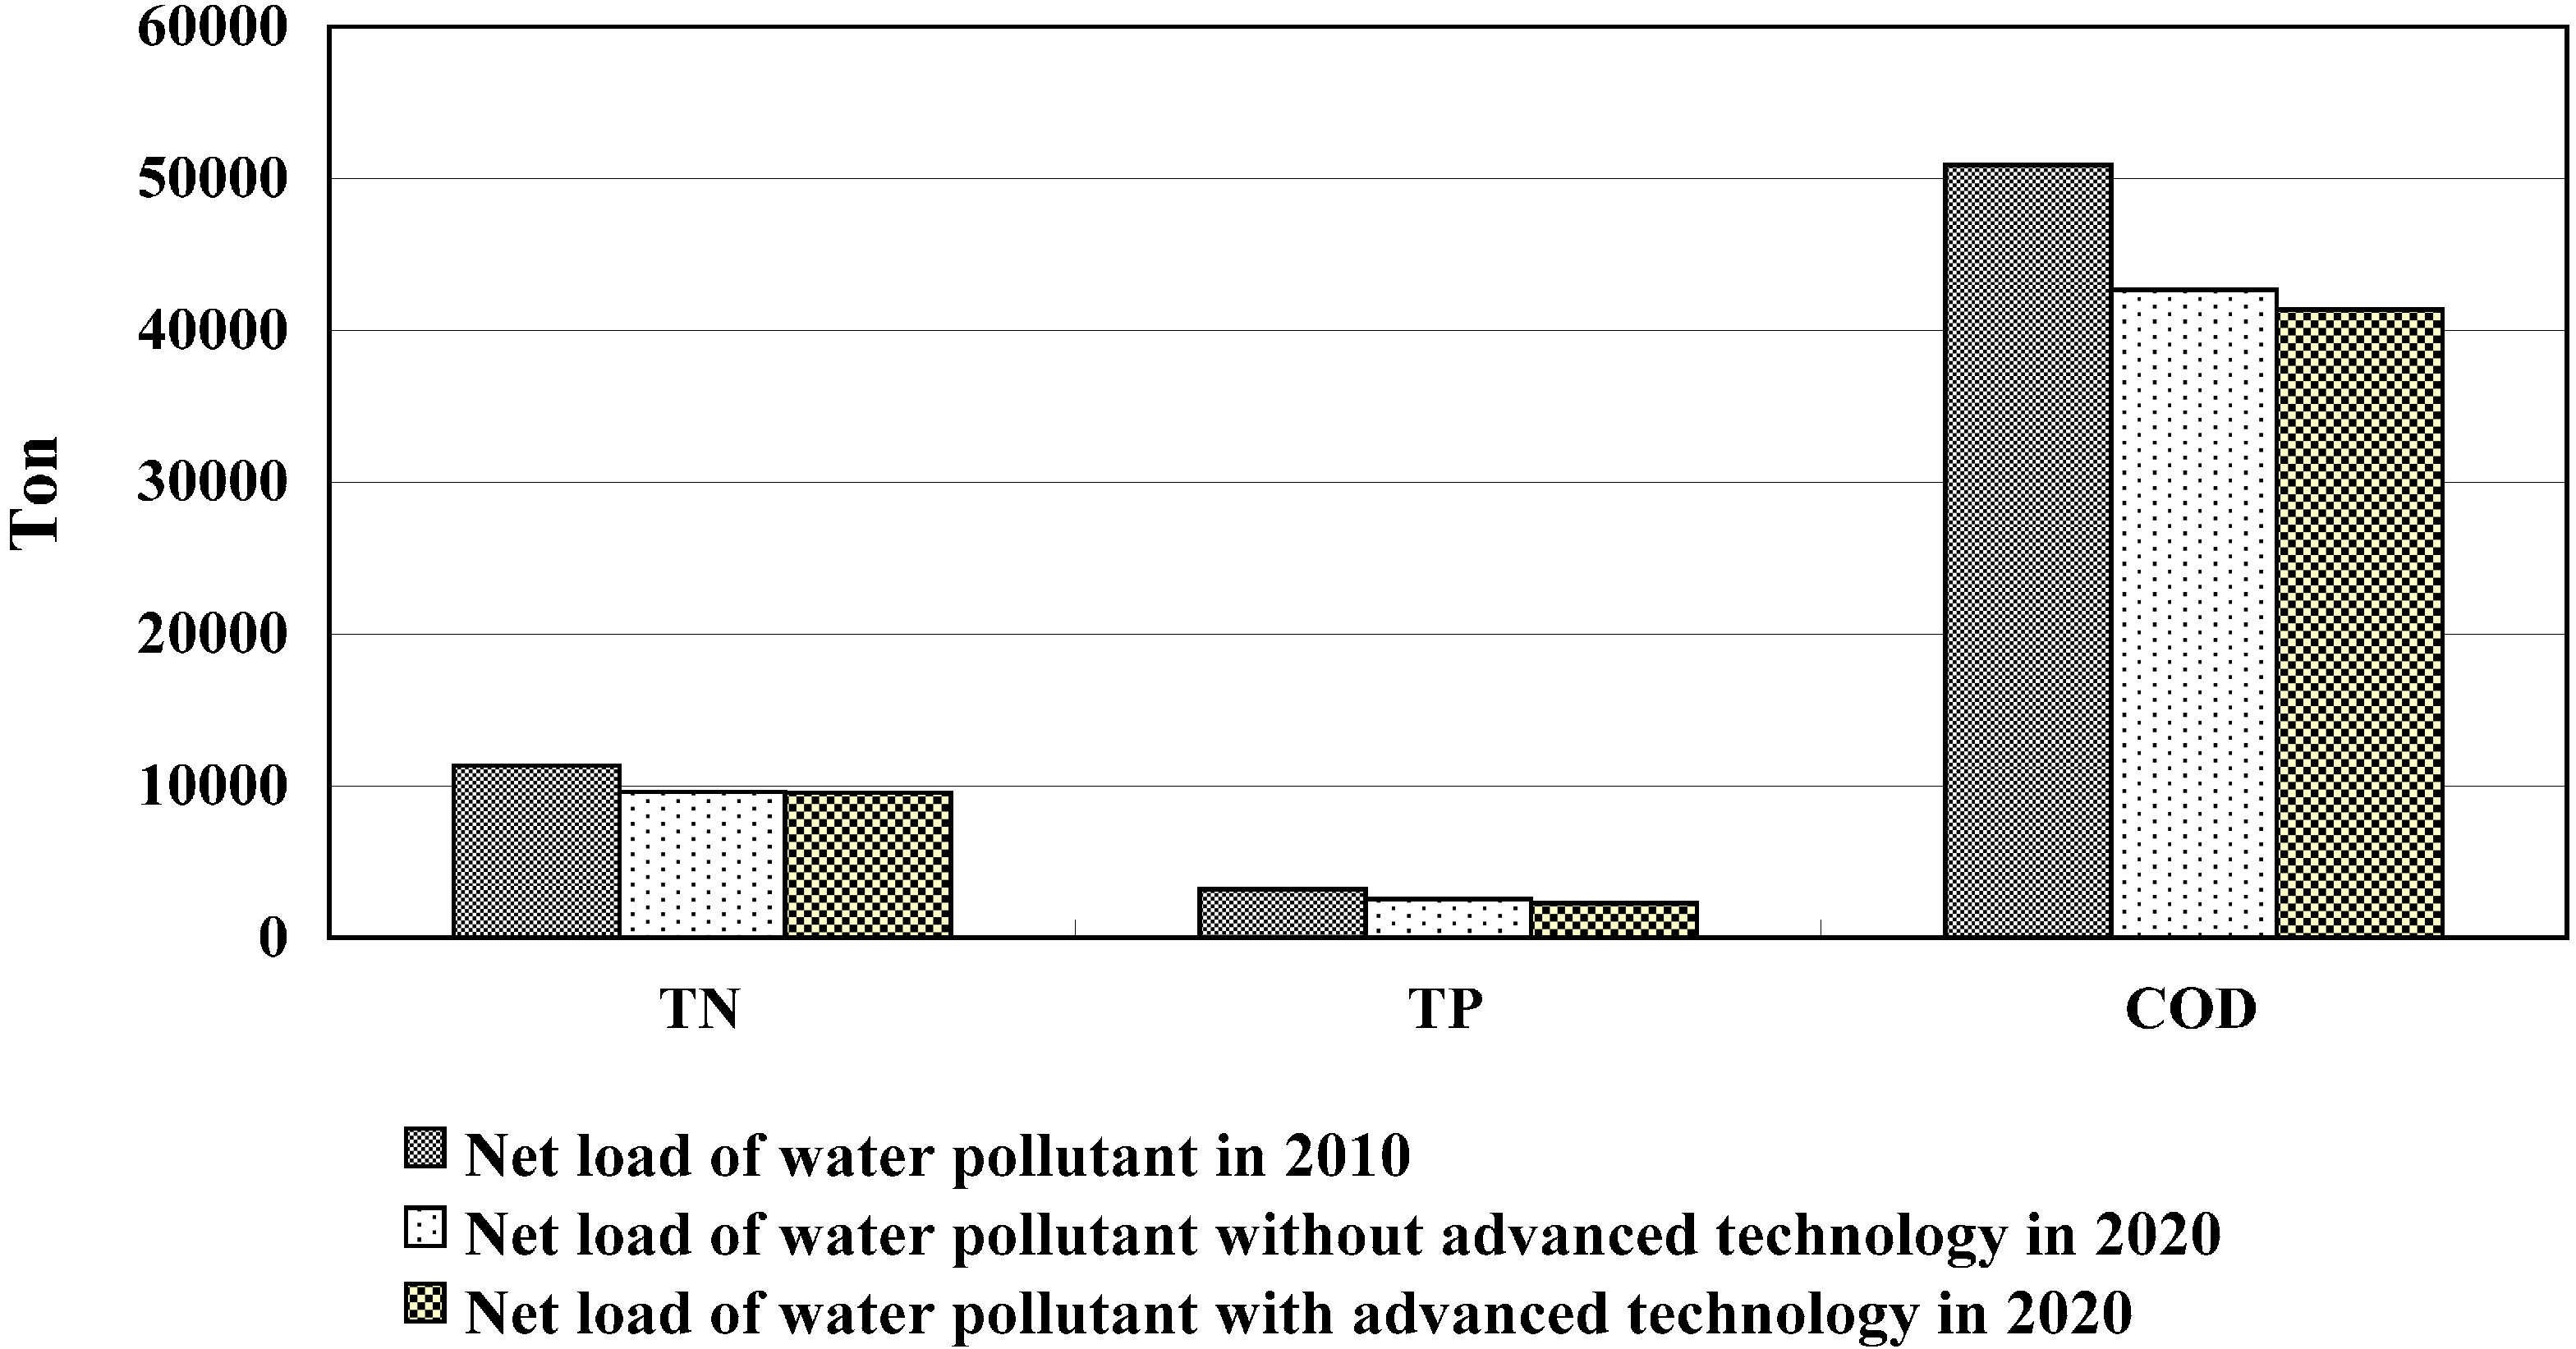
The net load of water pollutant (T-N, T-P and COD) flowing into Chaobai river in 2020 is shown in
Figure 5. The introduction of advanced technology is effective to reduce water pollutants and achieve economic development simultaneously. With the introduction of the advanced technology, the net load of T-N was reduced by 15.7% and the net load of T-P and COD was reduced 27.6% and 18.7%, respectively, in 2020. Meanwhile, the net load of T-N was reduced by 15.1%, and the net load of T-P and COD was reduced 18.7% and 16.2%, respectively, in 2020 without adoption of the advanced technology. The introduction of advanced technology contributes substantially to the improvement of the water environment even through socio-economic activities are maintaining a stable increasing trend.
Figure 5.
Net load of water pollutants of T-N, T-P and COD.
Figure 5.
Net load of water pollutants of T-N, T-P and COD.
4.3. Subsidization for Each Objective
The subsidization for each objective in the policy system is provided by local government. The government must select the best combination of policies and the proper assignment of budget as subsidization for implementation of the best policies. In the simulation, we assumed that the limitation of annual budget is 300 million RMB Yuan that the government spends directly and indirectly on subsidization for each objective. According to the environmental policies of Shunyi government, it will provide 35% of investment construction cost as subsidization for introduction of high efficiency waste treatment technology.
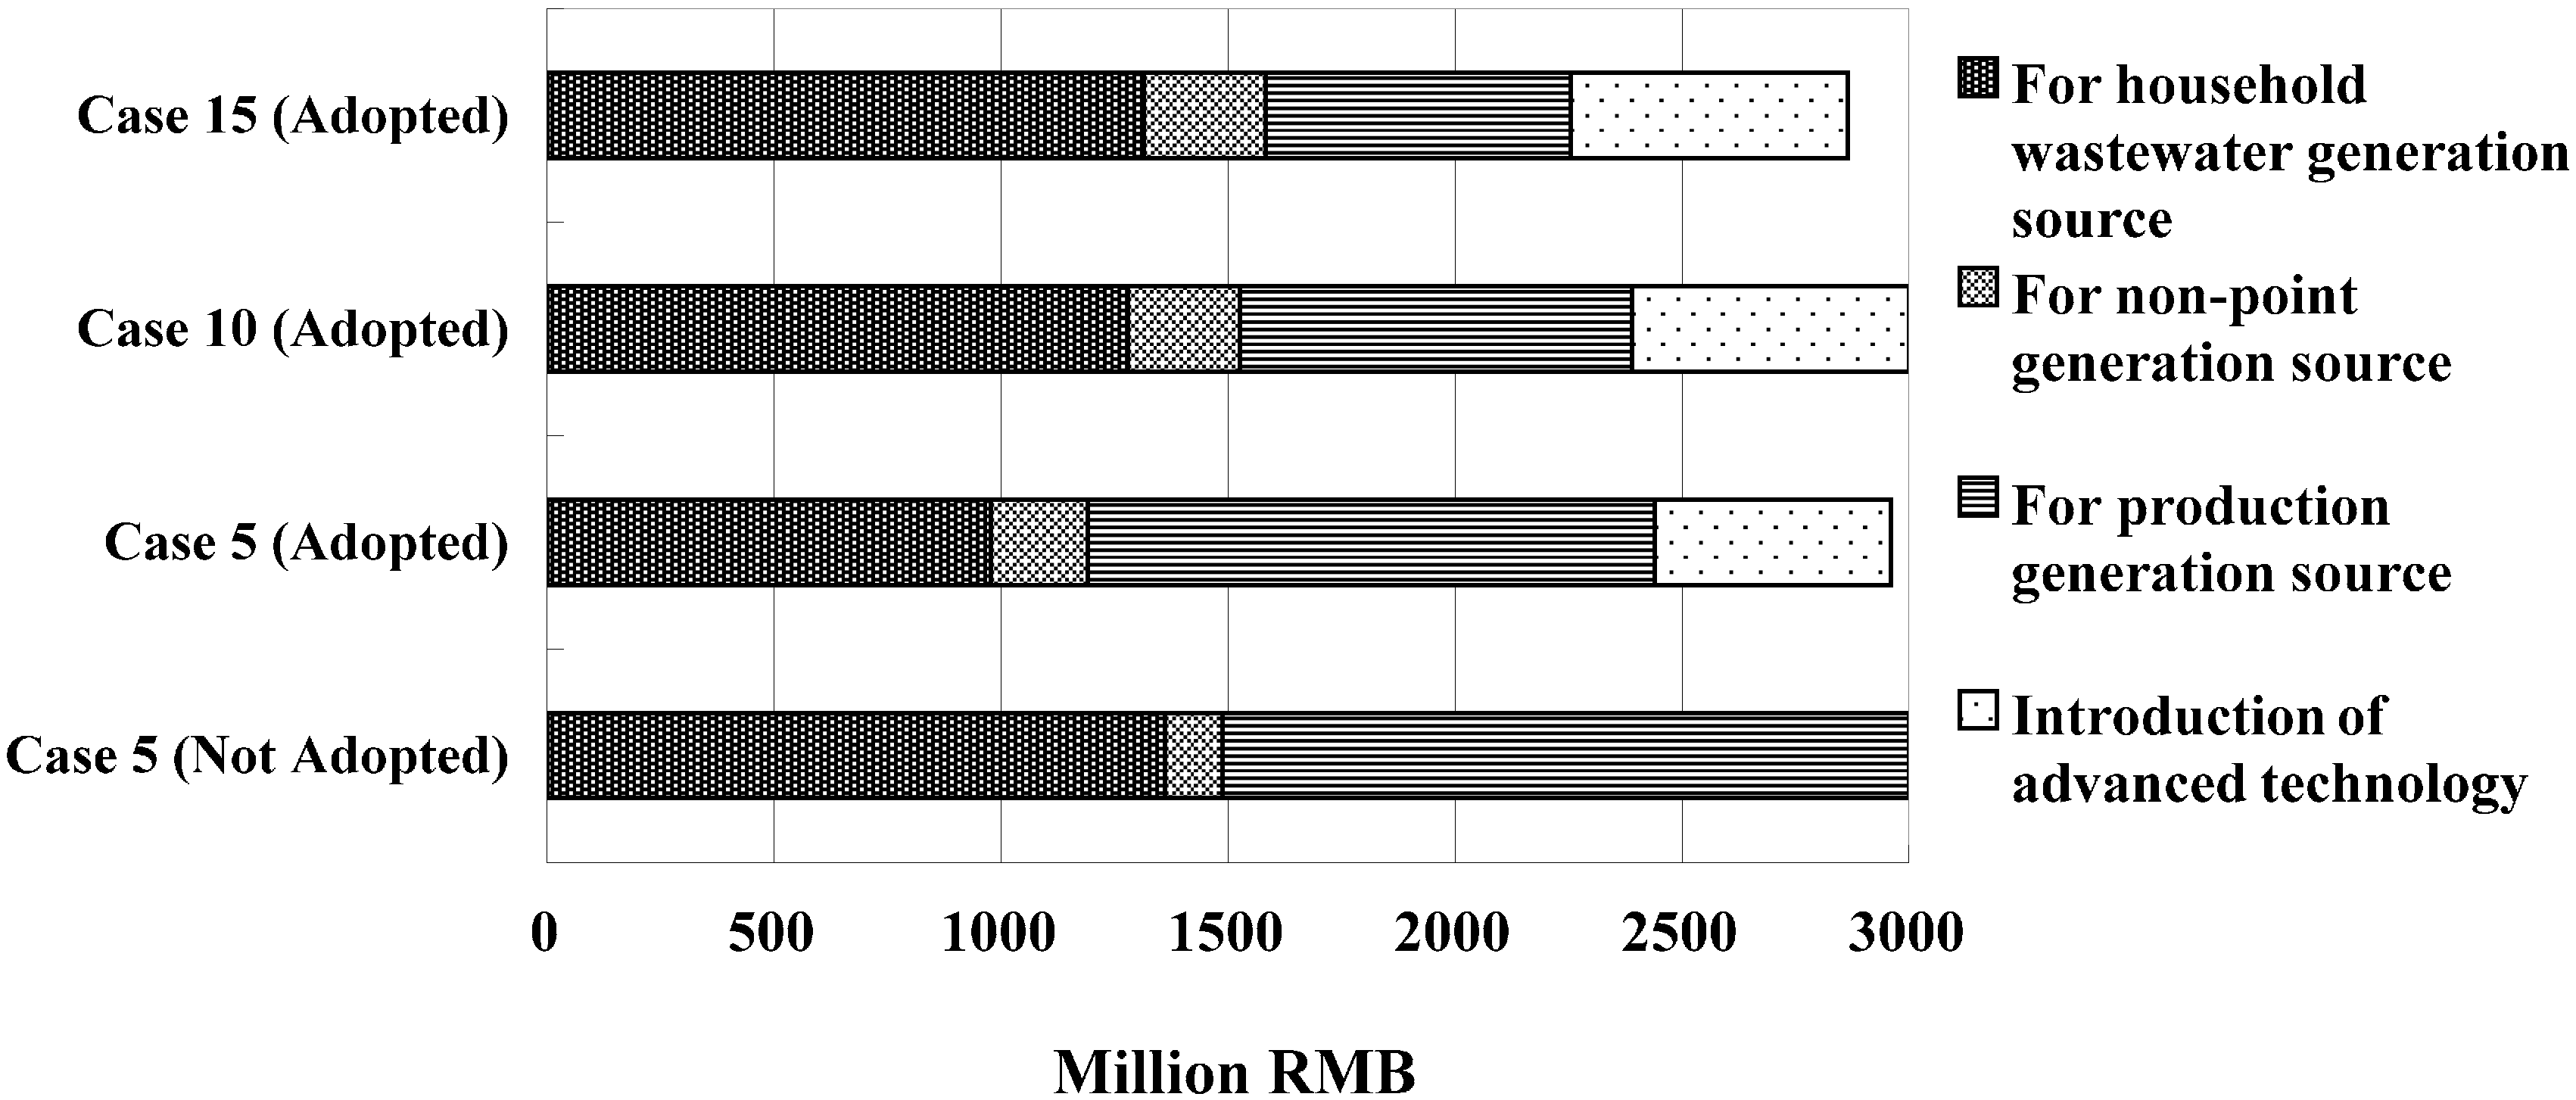
In
Figure 6, we showed the accumulation of subsidization allotment in Case 10 to Case 15. According to the results of this simulation, we found that the measured costs for household waste water and non-point generation are slightly different in Case 10 to Case 15 when the advanced technology was adopted. This result illustrated that the installation of more sewage plants and subsidization for using organic fertilizer are effective to reduce water pollutants emitted by households and industry. We also found that the measured cost for advanced technology became larger as the reduction rate became larger, and the measured cost for the production generation source decreased when the advanced technology was adopted in Case 10 to Case 15. These results demonstrated that the introduction of advanced technology did not add additional budget burden on the local government as compared to that without the introduction of advanced technology.
Figure 6.
Accumulated total subsidization for each objective.
Figure 6.
Accumulated total subsidization for each objective.
4.4. Development of the Pig Farming Industry
The variation in production of the pig farming industry is shown in
Figure 7. In this simulation, the amount of production of the pig farming industry increases by 4.46% in 2020 as compared to 2010 when we introduced advanced technology. The accumulated amount of production of pig farming industry increases 695.44 million RMB over a total of 10 years for the simulation period as compared with no adoption of advanced technology.
Figure 7.
Change in production of pig farming industry.
Figure 7.
Change in production of pig farming industry.
Because of the strict limitation of water pollutant emissions, the development of the pig farming industry is seriously affected as the most important water pollutants’ generation source. The pig farming industry production steadily deceased during the simulation period without introduction of the advanced technology.
This result shows that the contribution to the water pollution by wastewater from pig farming industry is higher than ever considered, and the efficiency of the current technologies is not sufficient to treat the high concentrations of wastewater. It also shows that the most important factor for the development of new technology in the future is how to enable treatment of wastewater with higher concentrations of pollutants.
4.5. Development of Other Industries
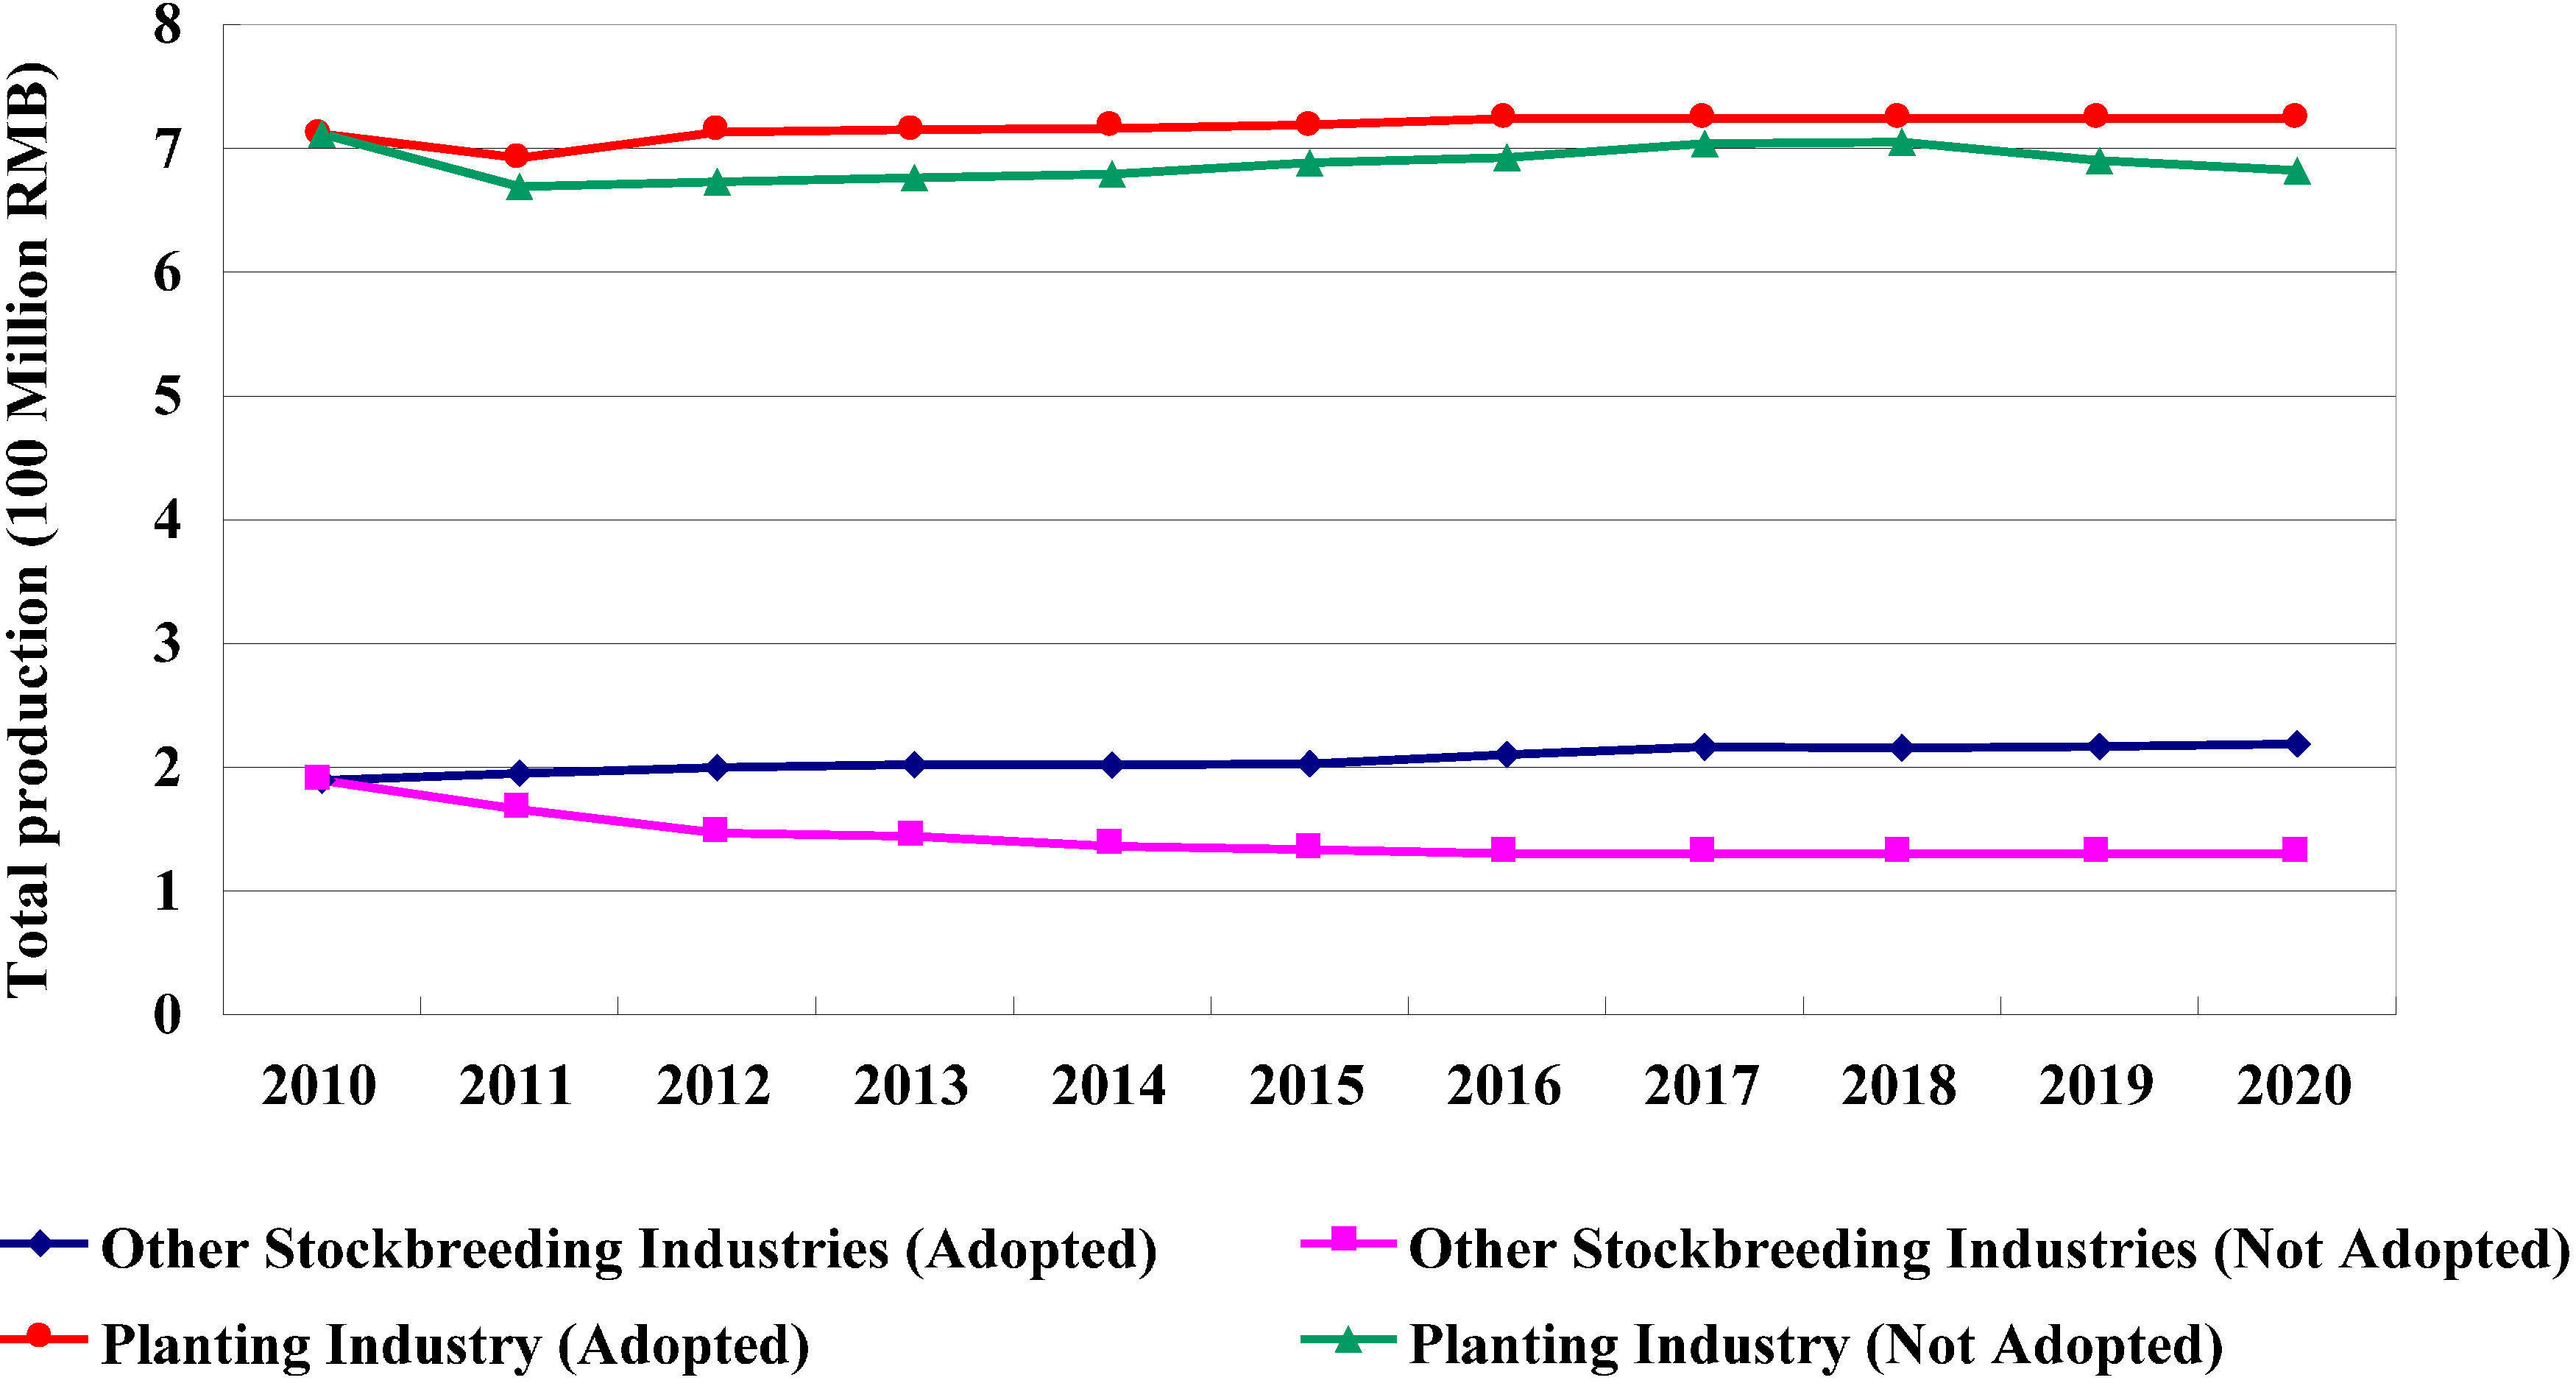
Variation in the planting industry and other stockbreeding industries in Case 15 is shown in
Figure 8. The production of other stockbreeding industries steadily decreased without adoption of advanced technology because of the strict limitation of water pollutant emissions. The productions of planting industry and other stockbreeding industries increased in Case 15 when we adopted advanced technology. The rapid decline of water pollutant emissions of the pig farming industry allows a greater capacity for other stockbreeding industries and the planting industry in order to improve the development of these two industries.
Figure 8.
Change in production of other stockbreeding industries and the planting industry.
Figure 8.
Change in production of other stockbreeding industries and the planting industry.
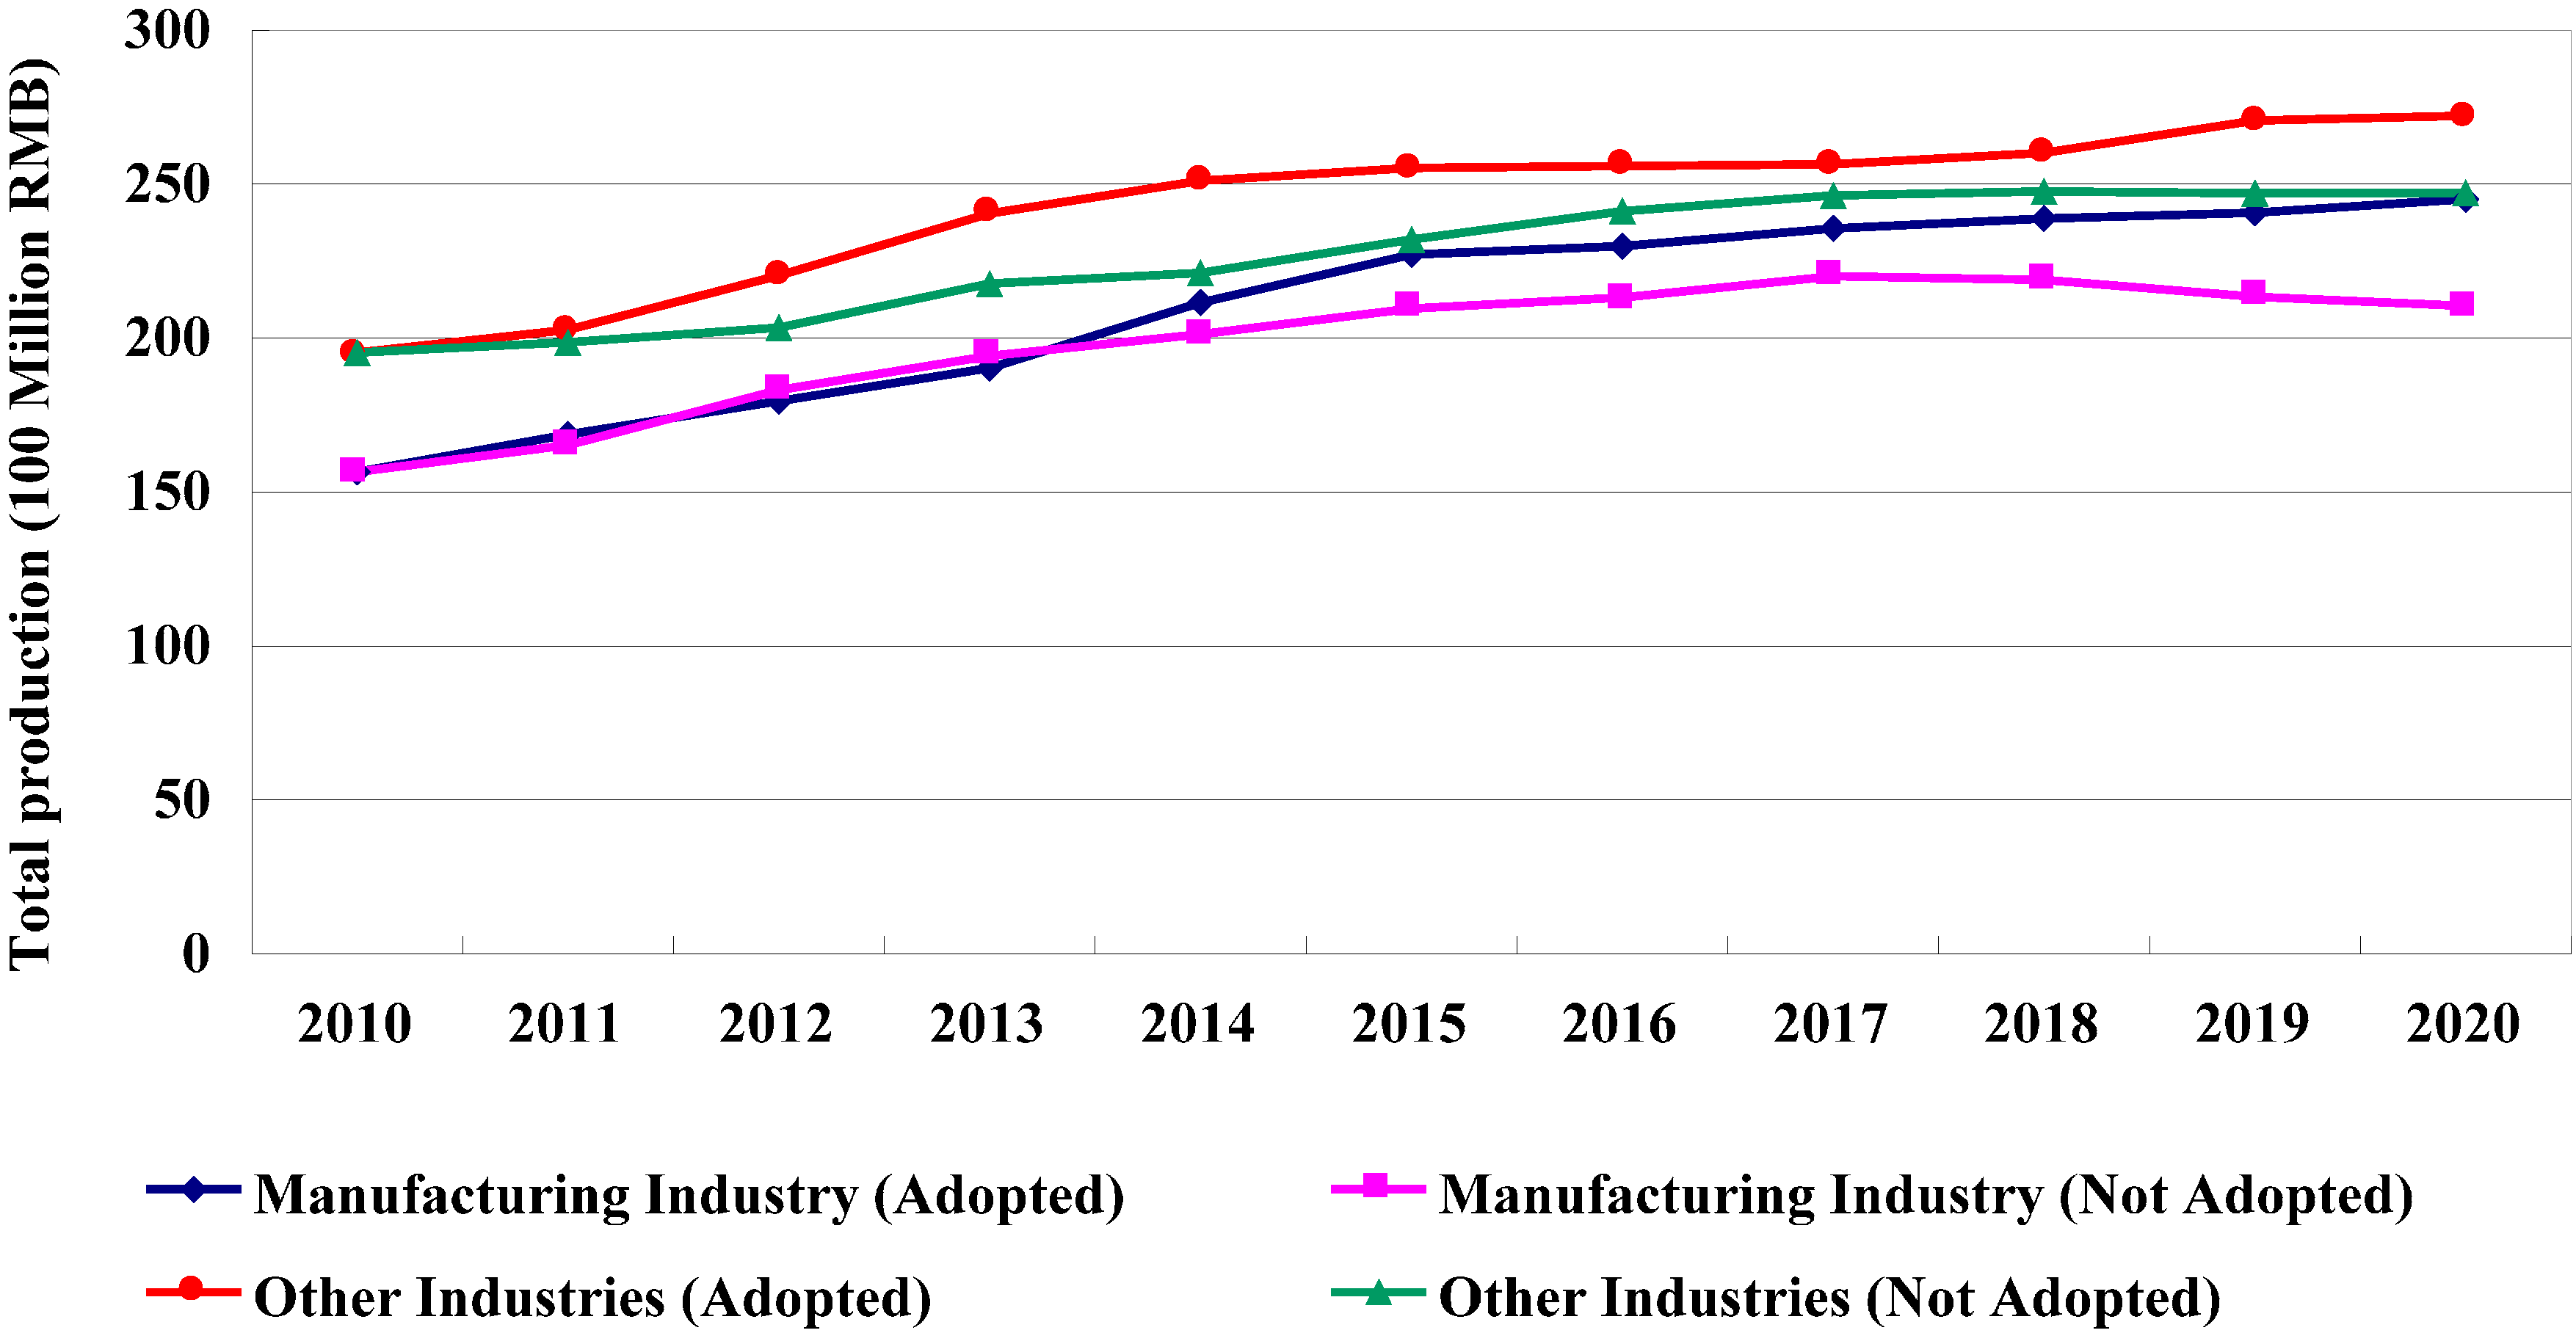
Figure 9 illustrated the production of the manufacturing industry and other industries. The production of the manufacturing industry and other industries steadily increased 56.6% and 39.4%, respectively, in 2020 as compared with 2010 in Case 15 with adoption of advanced technology. The manufacturing industry plays a dominant role in most cities and rural areas in China [
20]; the production of the manufacturing industry steadily increased in the former years, even without introduction of advanced technology. However, under the strict restriction of water pollutant emissions, they must decrease their own production to achieve the water pollutant constraints. Accordingly, the production of manufacturing industry decreased in the latter years.
Figure 9.
Change in production of manufacturing industry and other industries.
Figure 9.
Change in production of manufacturing industry and other industries.
4.6. Implementation of Advanced Technology and Production of Biomass Electric Energy
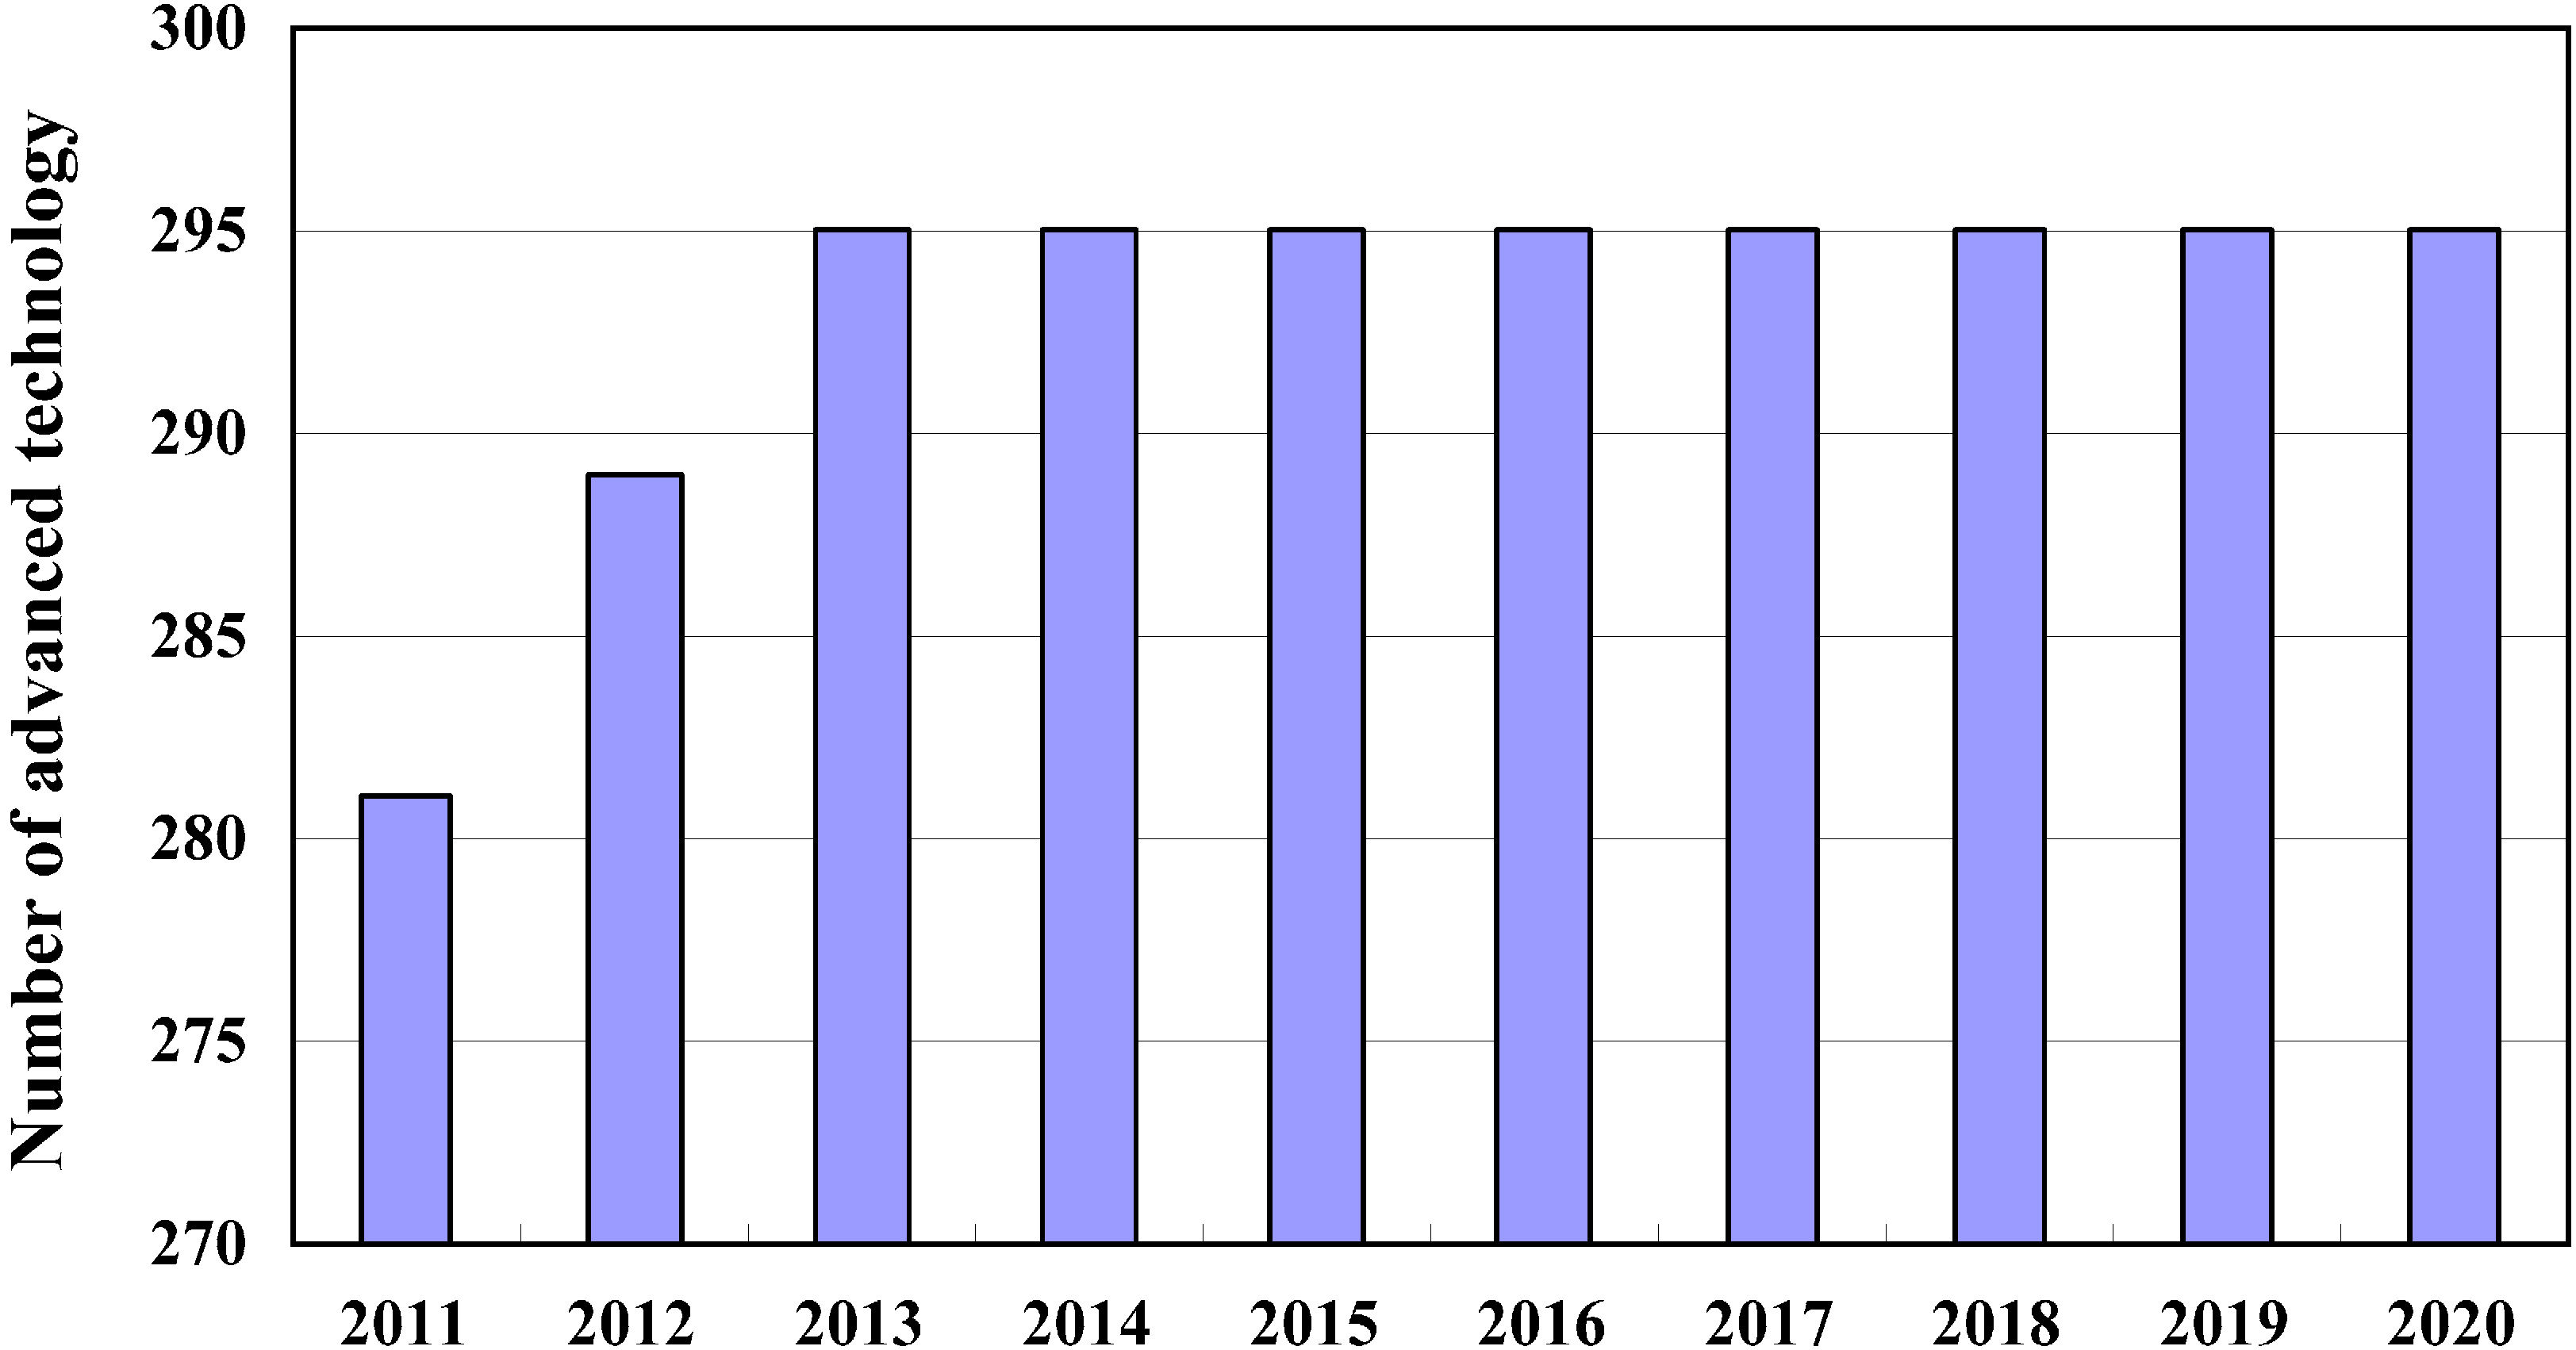
The simulation carried out in Case 15 with adoption of advanced technology demonstrated that 295 facilities should be installed to treat pig waste in 2020 (
Figure 10). According the investment of advanced technology in
Table 3, the total cost of advanced technology is about 202 billion RMB Yuan over 10 years, and the accumulated total GRP would increase about 219.2 billion RMB Yuan over the same period. It should be noted that data of maintenance cost of advanced technology is estimated based on that in Japan; when we introduce this technology in China, the maintenance cost and construction investment cost would be modified and reduced according to the actual situation and labor price in the target area. Therefore, the promotion of the advanced technology will be more feasible and acceptable.
Figure 10.
Number of facilities of advanced technology (Case 15).
Figure 10.
Number of facilities of advanced technology (Case 15).
In the simulation, it is can be calculated that about 667 million kwh electrical energy over 10 years can be produced, if we introduced the advanced technology in Case 15. It can be calculated that the total amount of electric energy equals 333 million RMB Yuan. Therefore, these results show that there is great feasibility and possibility to introduce this advanced technology in the target area.
The simulation results indicate that it is effective to describe the relationship between the water environment and the socio-economic system in one integrated system with the construction of an optimization model incorporating water environment management policies. Based on the results, we can conclude that the introduction of advanced technology for the target area is absolutely necessary, and the utilization of biomass resources allows simultaneous pursuit of environmental preservation and economic sustainable development.
5. Conclusions
In this study, we constructed an integrated water environment, socio-economic and biomass energy synthetic model for the target area to realize the simultaneous development of water environment preservation, effective biomass resource utilization and the regional economy. It can be concluded that the integrated approach is an effective method in providing valuable information that is linked to the sources of pollution and to their contributions and relation with economic indicators in the target area, with the purpose of introducing policy instruments to address water environment problems. In addition, this study indicated that any approach to dealing the environmental problems cannot succeed if socio-economic and environmental statuses and their interrelation are not taken into consideration based on the characteristics of the target area [
1]. This comprehensive simulation modeling approach can serve as a pre-evaluation resource for local government and provide a basis for policy-making and for the development of specific plans [
22]. The dynamic simulation also can forecast the economic and water environment development in the future with the introduction of synthetic policies.
The simulation practice in the study also demonstrated that the water environment management policy with introduction of advanced technology is very effective and the utilization of biomass resource supports the sustainable development of water environments and the socio-economy. In the simulation results, it was found that the most important factor for the development of advanced technology in the future is how to enable treatment of wastewater with higher concentrations of water pollutants.
For future extensions of this research, we need to consider the air pollution in the comprehensive simulation and the policy of pollution tax in the environment management policy system to evaluate the reduction of greenhouse gases and economic instruments based on material balance and value balance. We will continue our work to achieve a more integrated environment management system to provide comprehensive regional plans.
Finally, dynamic simulation modeling can be an effective tool in simultaneously achieving socio-economic development and water environment conservation in the target area. This comprehensive evaluation is also expected to improve effective biomass resource utilization and form the basis of policy decision-making for sustainable development of rural regions in China.


