Article

Speciation of Metals and Assessment of Contamination in Surface Sediments from Daya Bay, South China Sea

1
School of Earth Sciences and Engineering Geology, Guangdong Provincial Key Laboratory of Geological Processes and Mineral Resource Exploration, Sun Yat-sen University, Guangzhou 510275, China
2
South China Sea Marine Environment Monitoring Center, State Oceanic Administration People's Republic of China, Guangzhou 510915, China
3
South China Sea Marine Engineering and Environment Institute, State Oceanic Administration People's Republic of China, Guangzhou 510300, China
*
Authors to whom correspondence should be addressed.
These authors contributed equally to this work.
Sustainability 2014, 6(12), 9096-9113; https://0-doi-org.brum.beds.ac.uk/10.3390/su6129096
Submission received: 23 October 2014 / Revised: 28 November 2014 / Accepted: 28 November 2014 / Published: 9 December 2014
(This article belongs to the Section Environmental Sustainability and Applications)

Abstract

:
The contents, speciation, source factors and potential ecological risks of the selected metals (Cr, Ni, Cu, Pb, Zn, Cd and As) were analyzed in surface sediments from Daya Bay (DYB). The results show that, with the exception of Pb, metal concentrations have decreased at all sites over the past decade. The distribution features of these concentrations represent a ring shape that descends from shore to bay by varying degrees. Speciation analysis showed that Cr, Ni, Cu, Zn and As exist mainly in the residual fraction and, thus, are of low bioavailability, while Cd and Pb were found to be abundant in the non-residual fraction and, thus, have high potential mobility. The ratio of heavy metals in non-residual form in descending order is Pb (78.83%), Cd (78.65%), Cu (48.54%), Zn (48.10%), Ni (38.31%), Cr (28.43%) and As (27.76%). The ratio of Pb content is the highest, meaning the highest mobility of Pb. The metals’ potential ecological risks to the environment were also assessed using the methods of the mean effect range-median quotient and the criteria of risk assessment code. The results showed that Cd presents the highest risk, and Pb and Cu are generally considered to be medium risks in the sub-basins of Daya Bay. The principal component analysis (PCA) revealed that natural coastal weathering and erosion of rock caused the highest input, followed by mariculture and industrial wastewater and, finally, domestic sewage discharge.

1. Introduction

In recent decades, environmental and ecological problems have been widely reported due to the presence of different contaminants from anthropogenic activity in terrestrial and aquatic ecosystems, which can pose a serious hazard to the environment and to human health [1,2,3,4]. Considerable research has been focused on the environmental and ecological problems caused by various contaminants in terrestrial and aquatic ecosystems [5,6,7]. Among the environmental matrixes, sediments are more easily impacted by the negative factors of anthropogenic activities due to their close relationship with the water and atmosphere [8]. The sediments function as a natural reservoir for metals; they are, in a sense, the source of the pollution. Once metal concentrations surpass certain thresholds in sediments, they may cause serious environmental problems due to their toxicity, non-biodegradable properties and widespread distribution [9]. Therefore, the health status of sediments is a crucial criterion to assess the state of the environment; thus, the determination of heavy metals in sediments is a significant measure to understand the possible environmental changes caused by human activities.
The contamination of heavy metals in marine sediments depends not only on their concentrations, but also on both their associations and specific chemical species and binding states [10]. The optimized three-stage sequential extraction procedure proposed by the European Community Bureau of Reference (BCR) is a useful approach to reveal the different affinity to various solid-phase fraction samples, including freshwater sediments, salt water sediments, soil, sewage sludge and particulate matter. Furthermore, the method has been widely applied and adopted by a large number of researchers to study the speciation and possible associations between metals and sediment components [11]. Evaluating metal speciation can provide detailed information concerning the origin, mobilization, biological availability and toxicity of metals. Therefore, it is of considerable interest to distinguish and quantify the forms of these elements to obtain a better estimate of the potential and environmental impact of contaminated sediments.
Metal contamination and environmental degradation have gradually increased in China’s coastal regions in recent years due to a substantial increase in population and industrial activities. Located along the southern coast of China, Daya Bay is one of the most important economic development districts in Guangdong [5]. Research concerning metals present in Daya Bay sediments has increased in recent years [6]. Daya Bay (DYB) is a semi-enclosed shallow embayment with an area of approximately 600 km2 that is located in the southern part of PRD. It is composed of a series of sub-basins, including Dapeng’ao, Yaling Bay and Fanhe Bay. No major rivers discharge into Daya Bay, and most of its water originates in the South China Sea. Since the 1980s, population numbers and contamination associated with increased aquacultural and industrial activities have increased dramatically along the harbors and coastline. Fish, shrimp and shellfish aquaculture are well developed with a combined 14,000 ha caged culture area in 2005, a phenomenal growth of nearly 600% over the past 17 years. Two nuclear power stations, the Daya Bay Nuclear Power Plant (DNPP) and the Ling’ao Nuclear Power Plant (LNPP), which came into operation in 1994 and 2003, respectively, are situated on its western coast. Daya Bay Petrochemical Industrial Park (DPIK), which began operations in 2009, is located along the northern coast. These human-induced perturbations, especially the introduction of heavy metals, have likely impacted the aquatic environment of DYB and present potential contamination problems. More research on the environmental and social implications of heavy metal contamination in DYB is clearly needed.
Initial surface sediment studies of metals in DYB analyzed total concentrations. Subsequent research focused on deposition, migration, accumulation mechanisms and toxicity evaluation. Further research is now needed on the distribution of heavy metals and their speciation in different areas of the sediment. Specifically, a comprehensive multi-factor characteristics analysis should be conducted.
Therefore, the purpose of the present study is as follows: (1) to reveal the accumulation, spatial distribution and speciation of the selected metals; (2) to assess the enrichment status and potential ecological risk using several contamination indices; and (3) to use correlation analysis (CA) and principal component analysis (PCA) to define the potential sources of the metals.

2. Materials and Methods

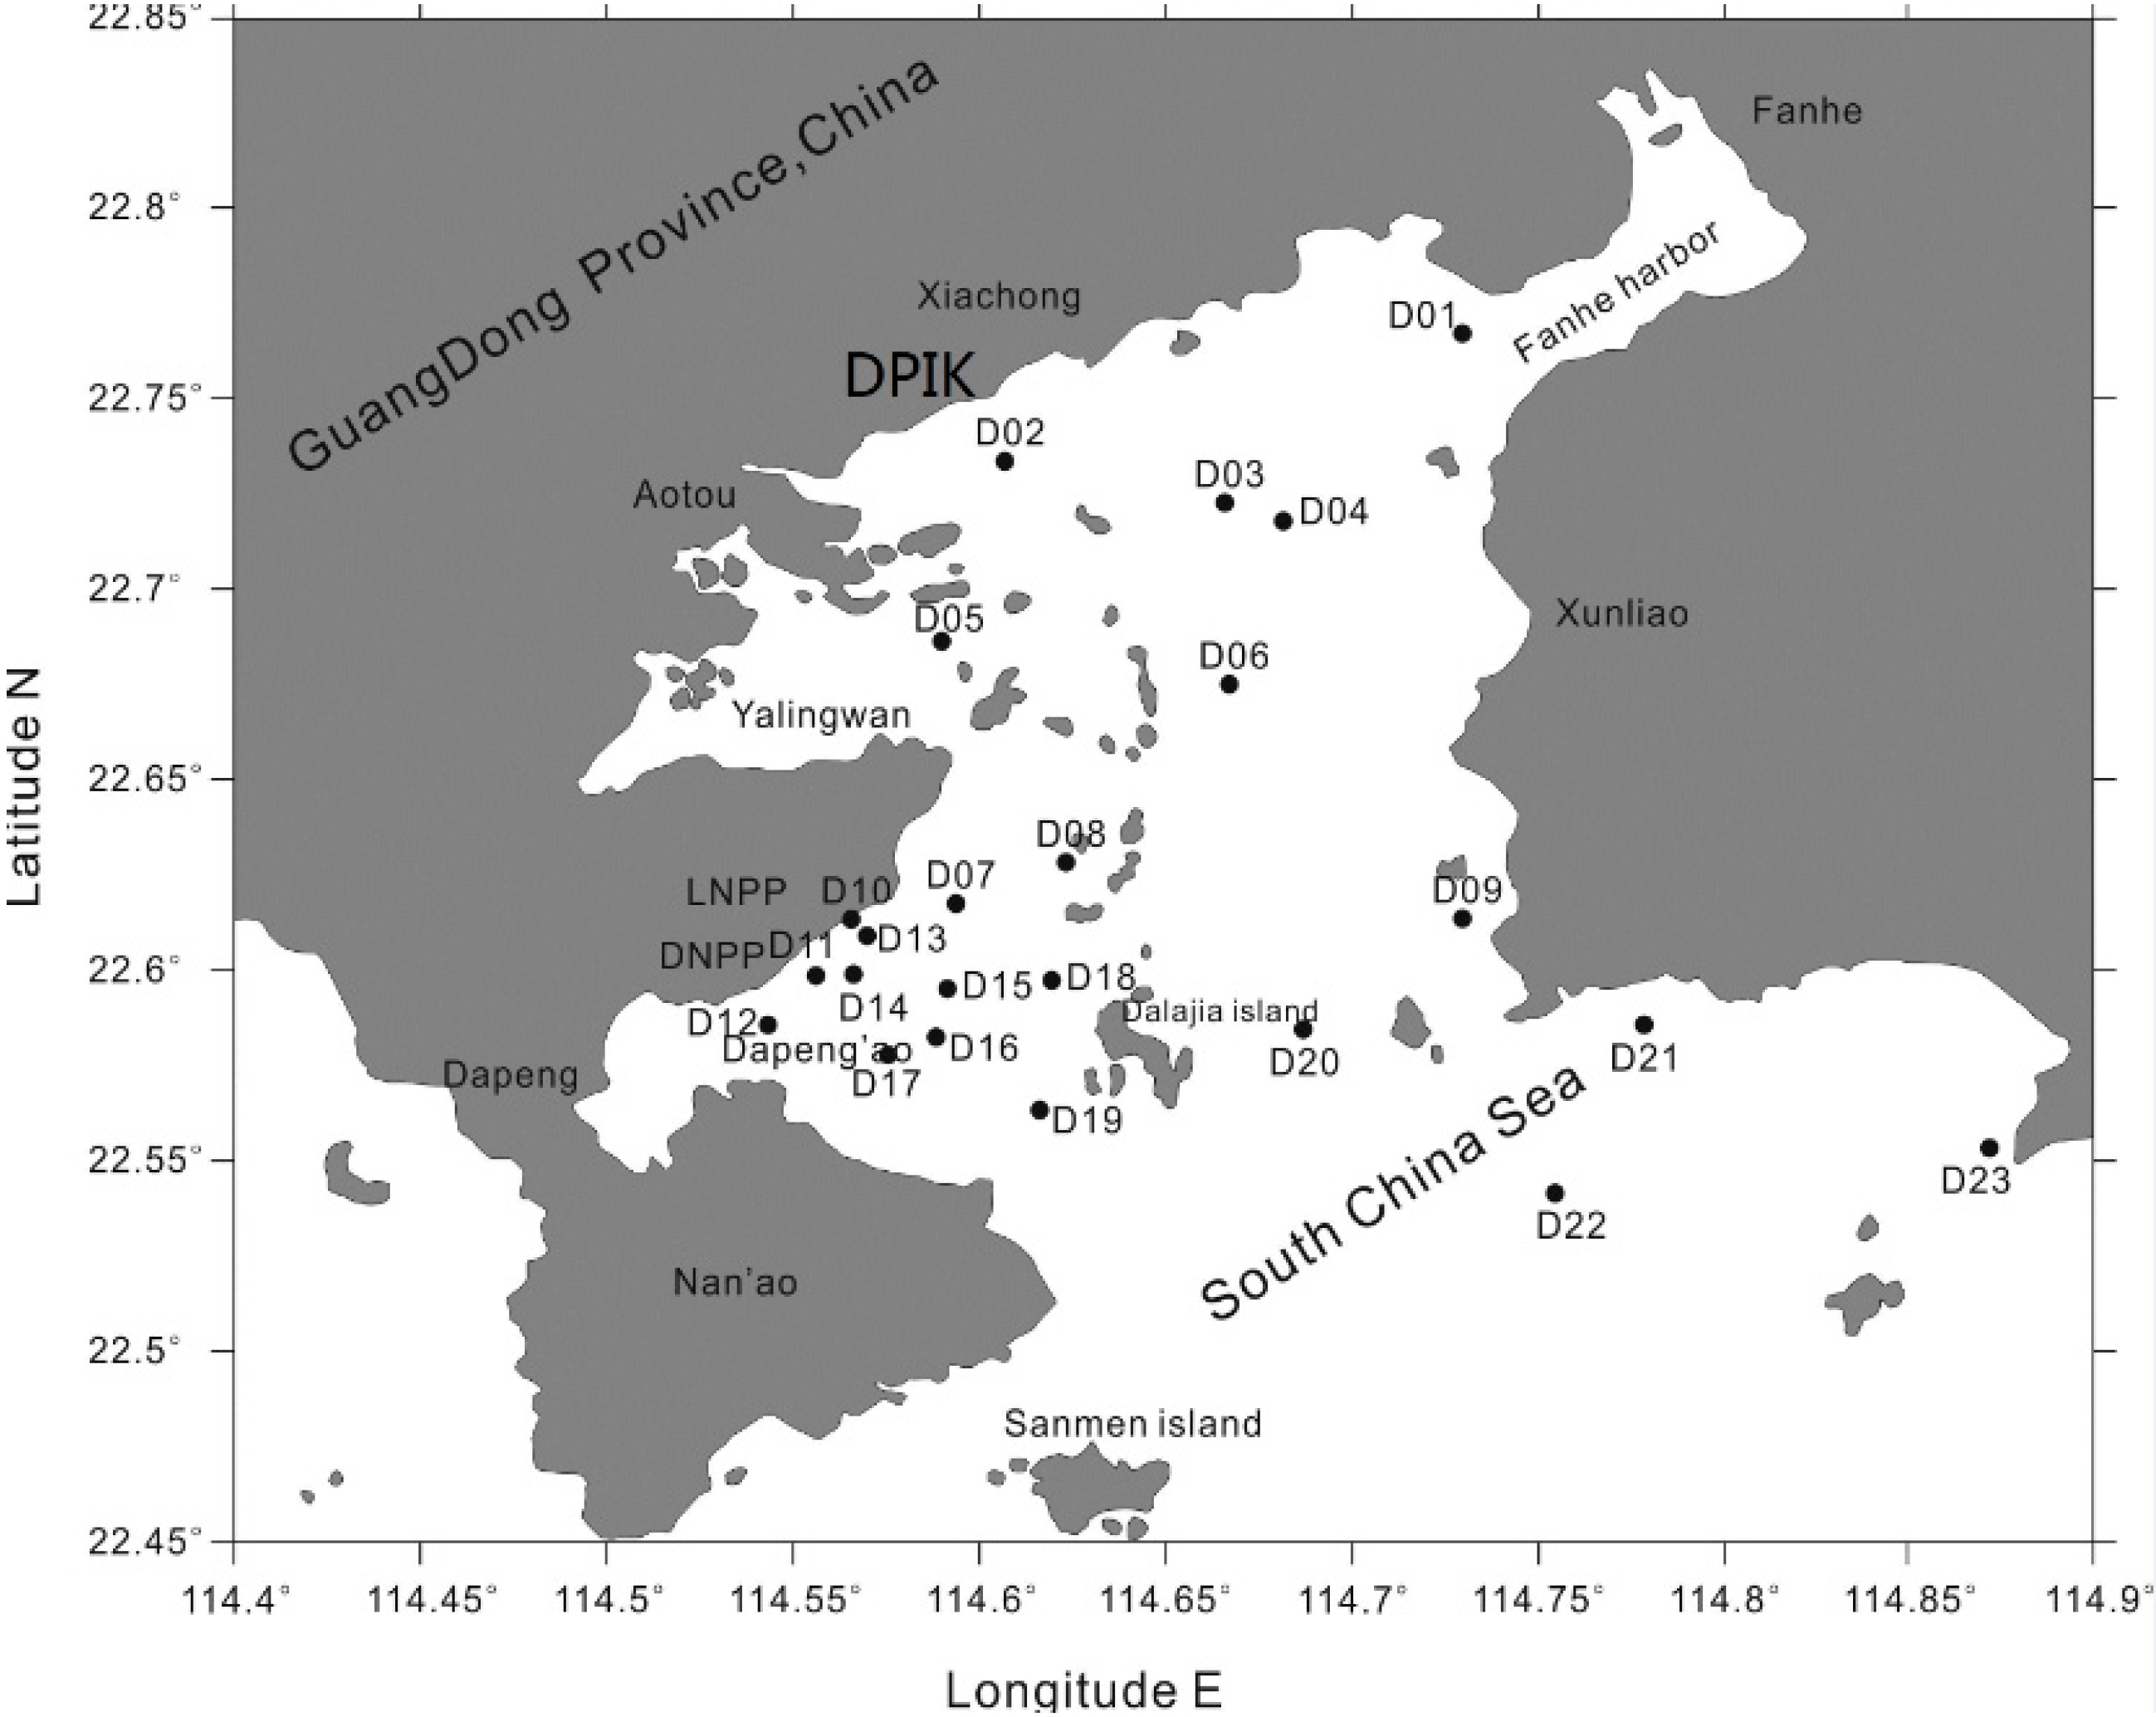
2.1. Sampling and Sediment Pretreatment

Surface sediment samples (0–5 cm) were carefully collected in May 2011, from 23 sites located in the DYB using Peterson grab. A map of the sampling locations is shown in Figure 1. Two sets of samples were obtained with a plastic spatula and then placed in plastic zip-lock bags. All samples were preserved with ice and immediately transferred to the laboratory. One set of samples was kept frozen at −4 °C and another at −20 °C until analysis. The samples frozen at −4 °C were used for grain size analysis. The samples refrigerated at −20 °C were dried in an oven at 60 °C until constant weight, ground gently with an agate pestle and mortar, sieved to collect the <63 μm grain size fraction for homogenization and then stored in glass bottles for metal analyses. The sampling sites were located in the areas considered to be less affected by the continuous dredging activity and dumped material. Station locations were obtained by the Global Positioning System.

2.2. Analysis

2.2.1. Total Concentrations and Phase Partitioning of Metals

Approximately 0.2 g of dried and homogenized sediment samples were weighed and placed into an acid-washed PTFE digestion vessel and digested with a HNO3–HClO4 mixture. The total concentrations of Cr, Ni, Cu, Pb, Zn and Cd were then detected by inductively-coupled plasma-mass spectrometry (ICP-MASS). Cold vapor atomic fluorescence spectroscopy (CVAFS) was applied for the determination of As. The optimized BCR sequential extraction procedure reported [12] was used to partition the metals into four geochemical parts, as acid-soluble (F1), reducible (F2), oxidizable (F3) and residual (R) fractions. The detailed procedures for the sequential extraction used have been described elsewhere in this study [9]. The concentrations of metals in the four geochemical fractions were determined by atomic absorption spectrophotometry (AAS, Hitachi Z2000, Chiyoda, Tokyo, Japan). The AAS detection limits were calculated as 3δ/S (δ is the standard deviation of the blank signal, and S is the sensitivity).The detection limits (mg/kg) were severally 0.03(Cd), 0.1 (Pb), 0.5(As), 0.2 (Cr), 0.1 (Ni), 0.05 (Cu) and 0.6 (Zn).
Figure 1. Map of sampling stations of the surface sediments. LNPP, Ling’ao Nuclear Power Plant; DNPP, Daya Bay Nuclear Power Plant; DPIK, Daya Bay Petrochemical Industrial Park.
Sustainability 06 09096 g001

2.2.2. Particle Size and Total Organic Carbon

Pretreatments of particle size were carried out based on the China National Standards (GB/T12763.8-2007). The sample granulometry was determined using a Malven Laser Mastersizer 2000 Particle Size Analyzer-MS 2000 (0.02–2000 um). The total organic carbon (TOC) content of the sediment samples was determined by the loss on ignition method using a CHENS Elemental Analyzer-Varia EL.

2.2.3. Statistical Analysis

Pearson correlation and multivariate principal component analysis (PCA) were performed on IBM SPSS 19.0 for Windows (IBM Corporation, Armonk, NY, USA). When p < 0.05, this represents a significant difference. PCA was performed on the standardized dataset to minimize the effects of the differences in the measurement units or variance and to render the data dimensionless. It was then used to analyze and identify the potential sources of the metals and to evaluate the degree of association among the variables.

2.2.4. Quality Control

Precision and accuracy were verified using standard reference materials from China National Standard material (Offshore Marine sediment, GBW 07314). Accepted recoveries for the seven metals ranged between 82% and 110%. All chemicals used in the experiment were guaranteed reagent grade. Blank determinations were performed for each set of analysis using the same reagents. To verify the accuracy of the sequential extraction procedure, the certified reference material, Certified Reference Material (CRM) 701, was used, and the ranges of Cd, Pb, As, Cr, Cu, Zn and Ni in the acid soluble, reducible and oxidizable fractions were 89%–99%, 85%–98% and 96%–112%, respectively.

3. Results and Analyses

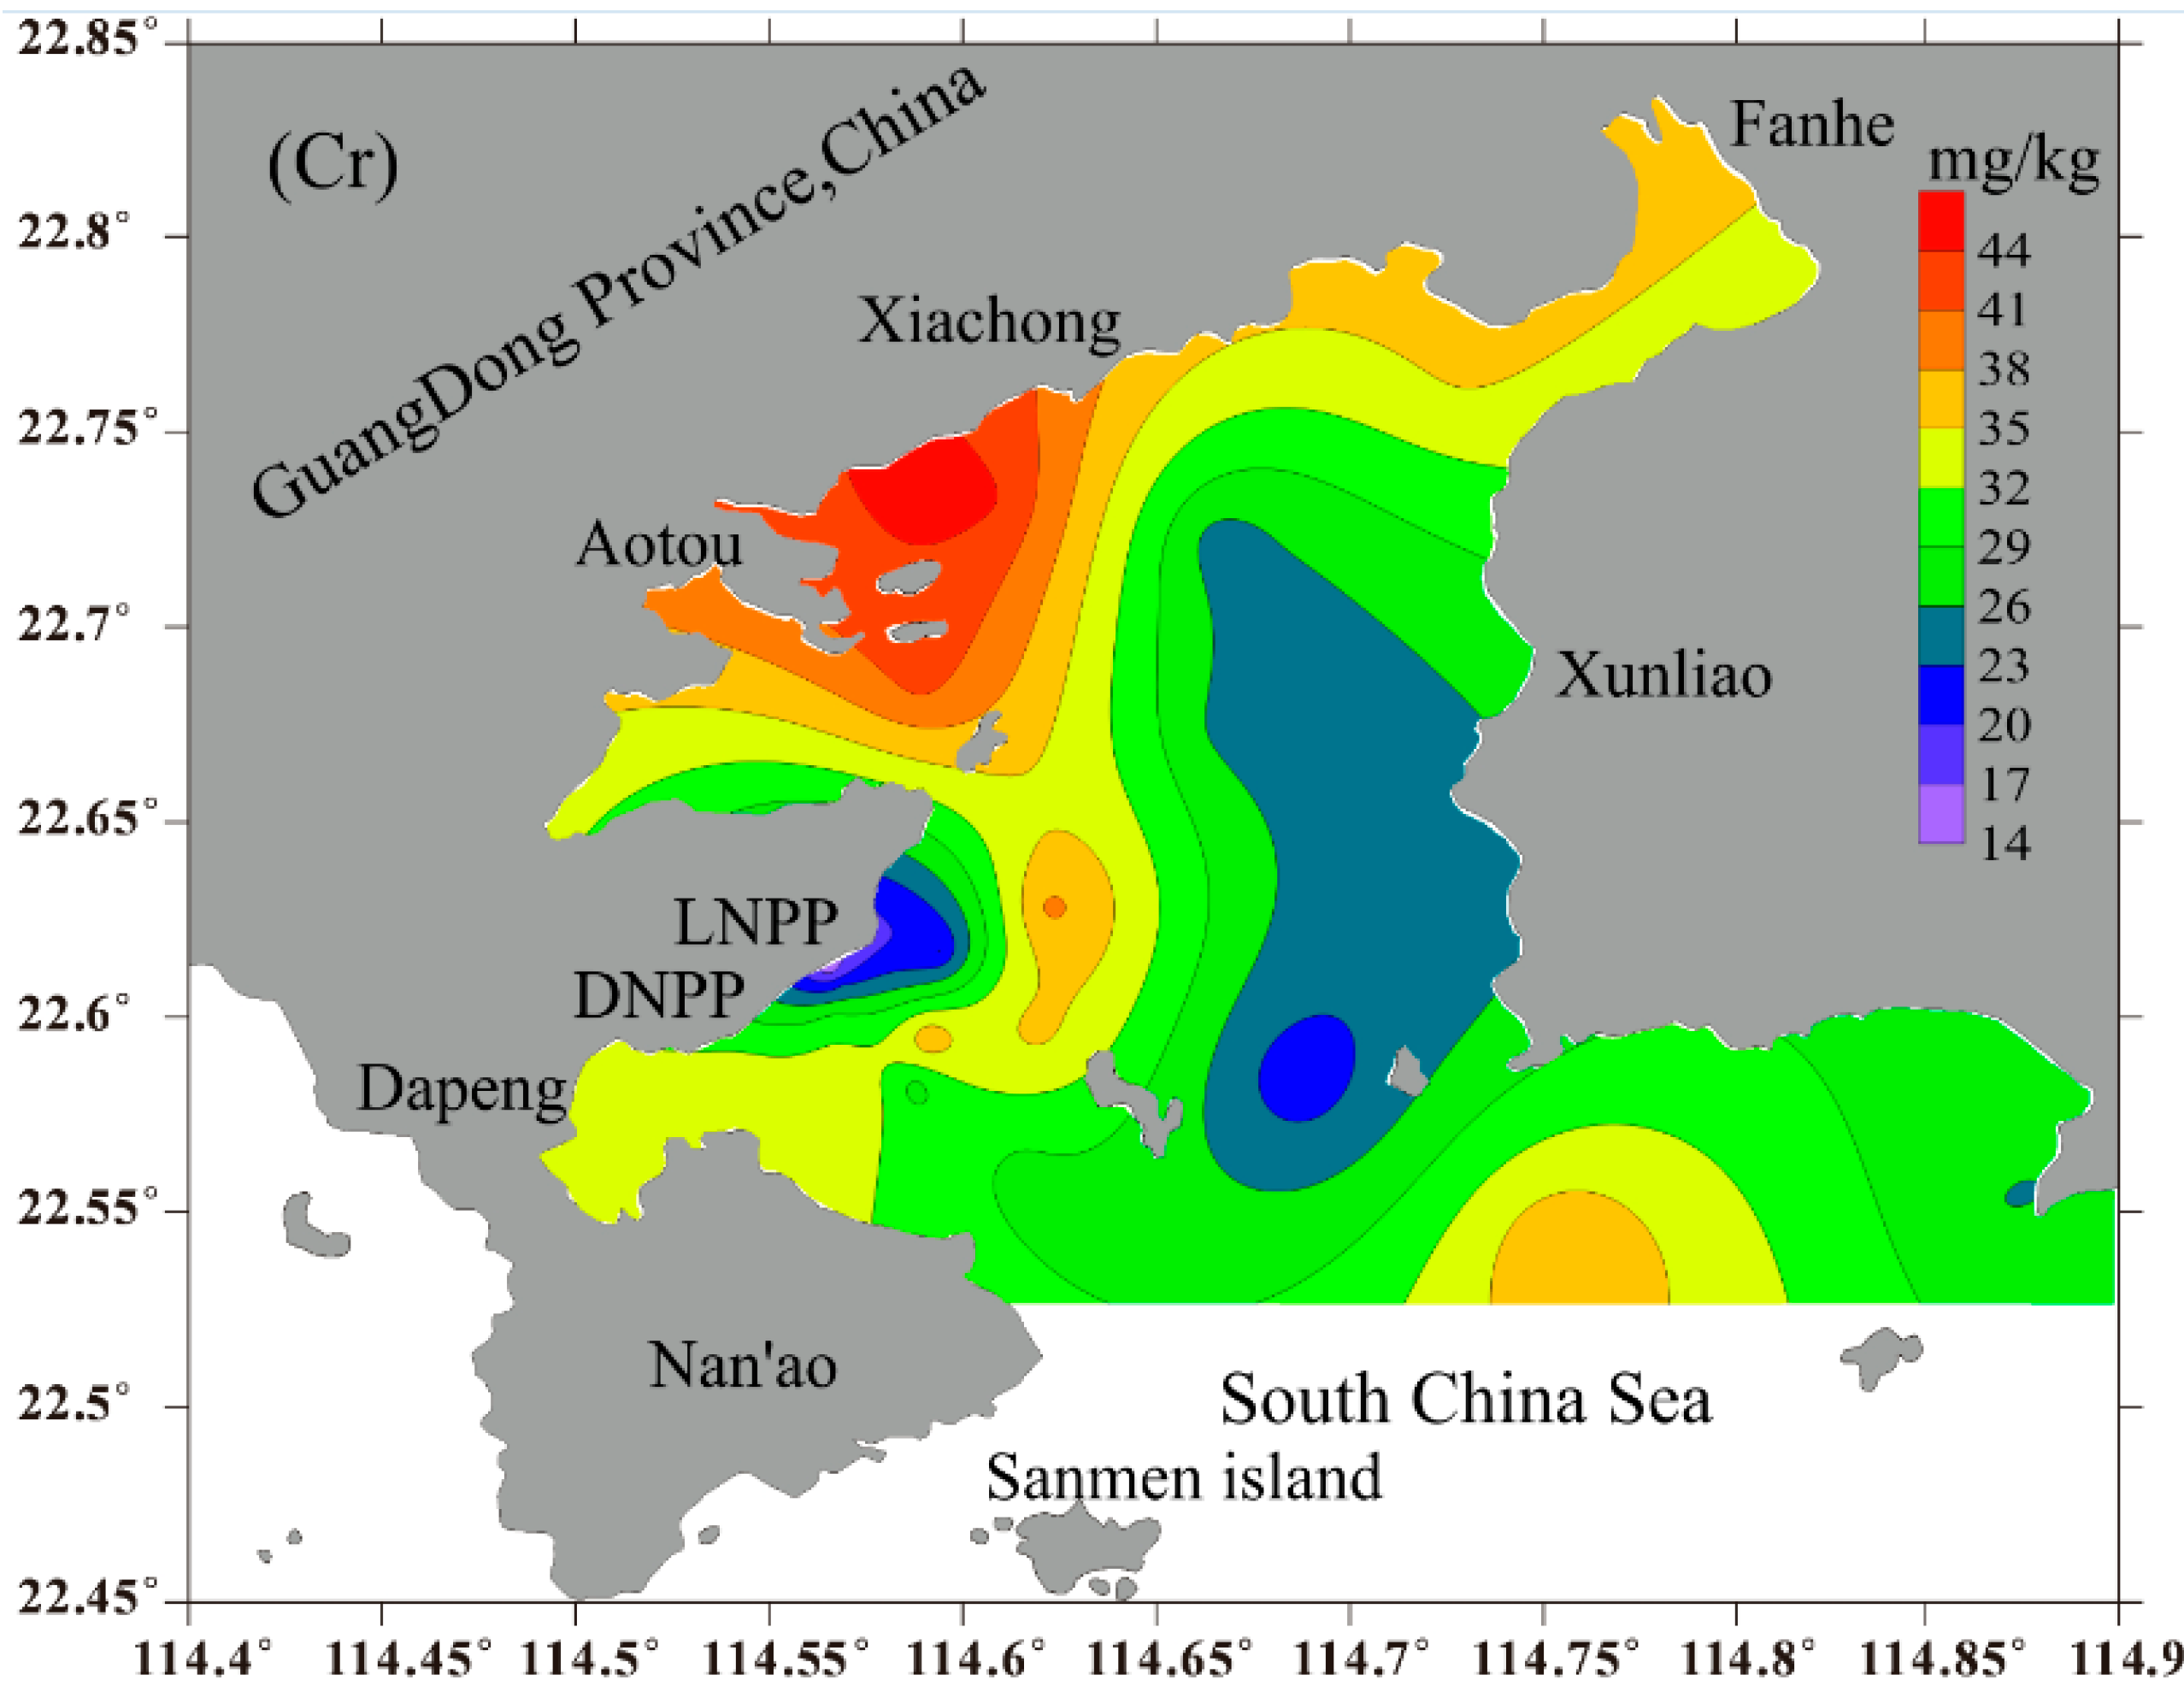
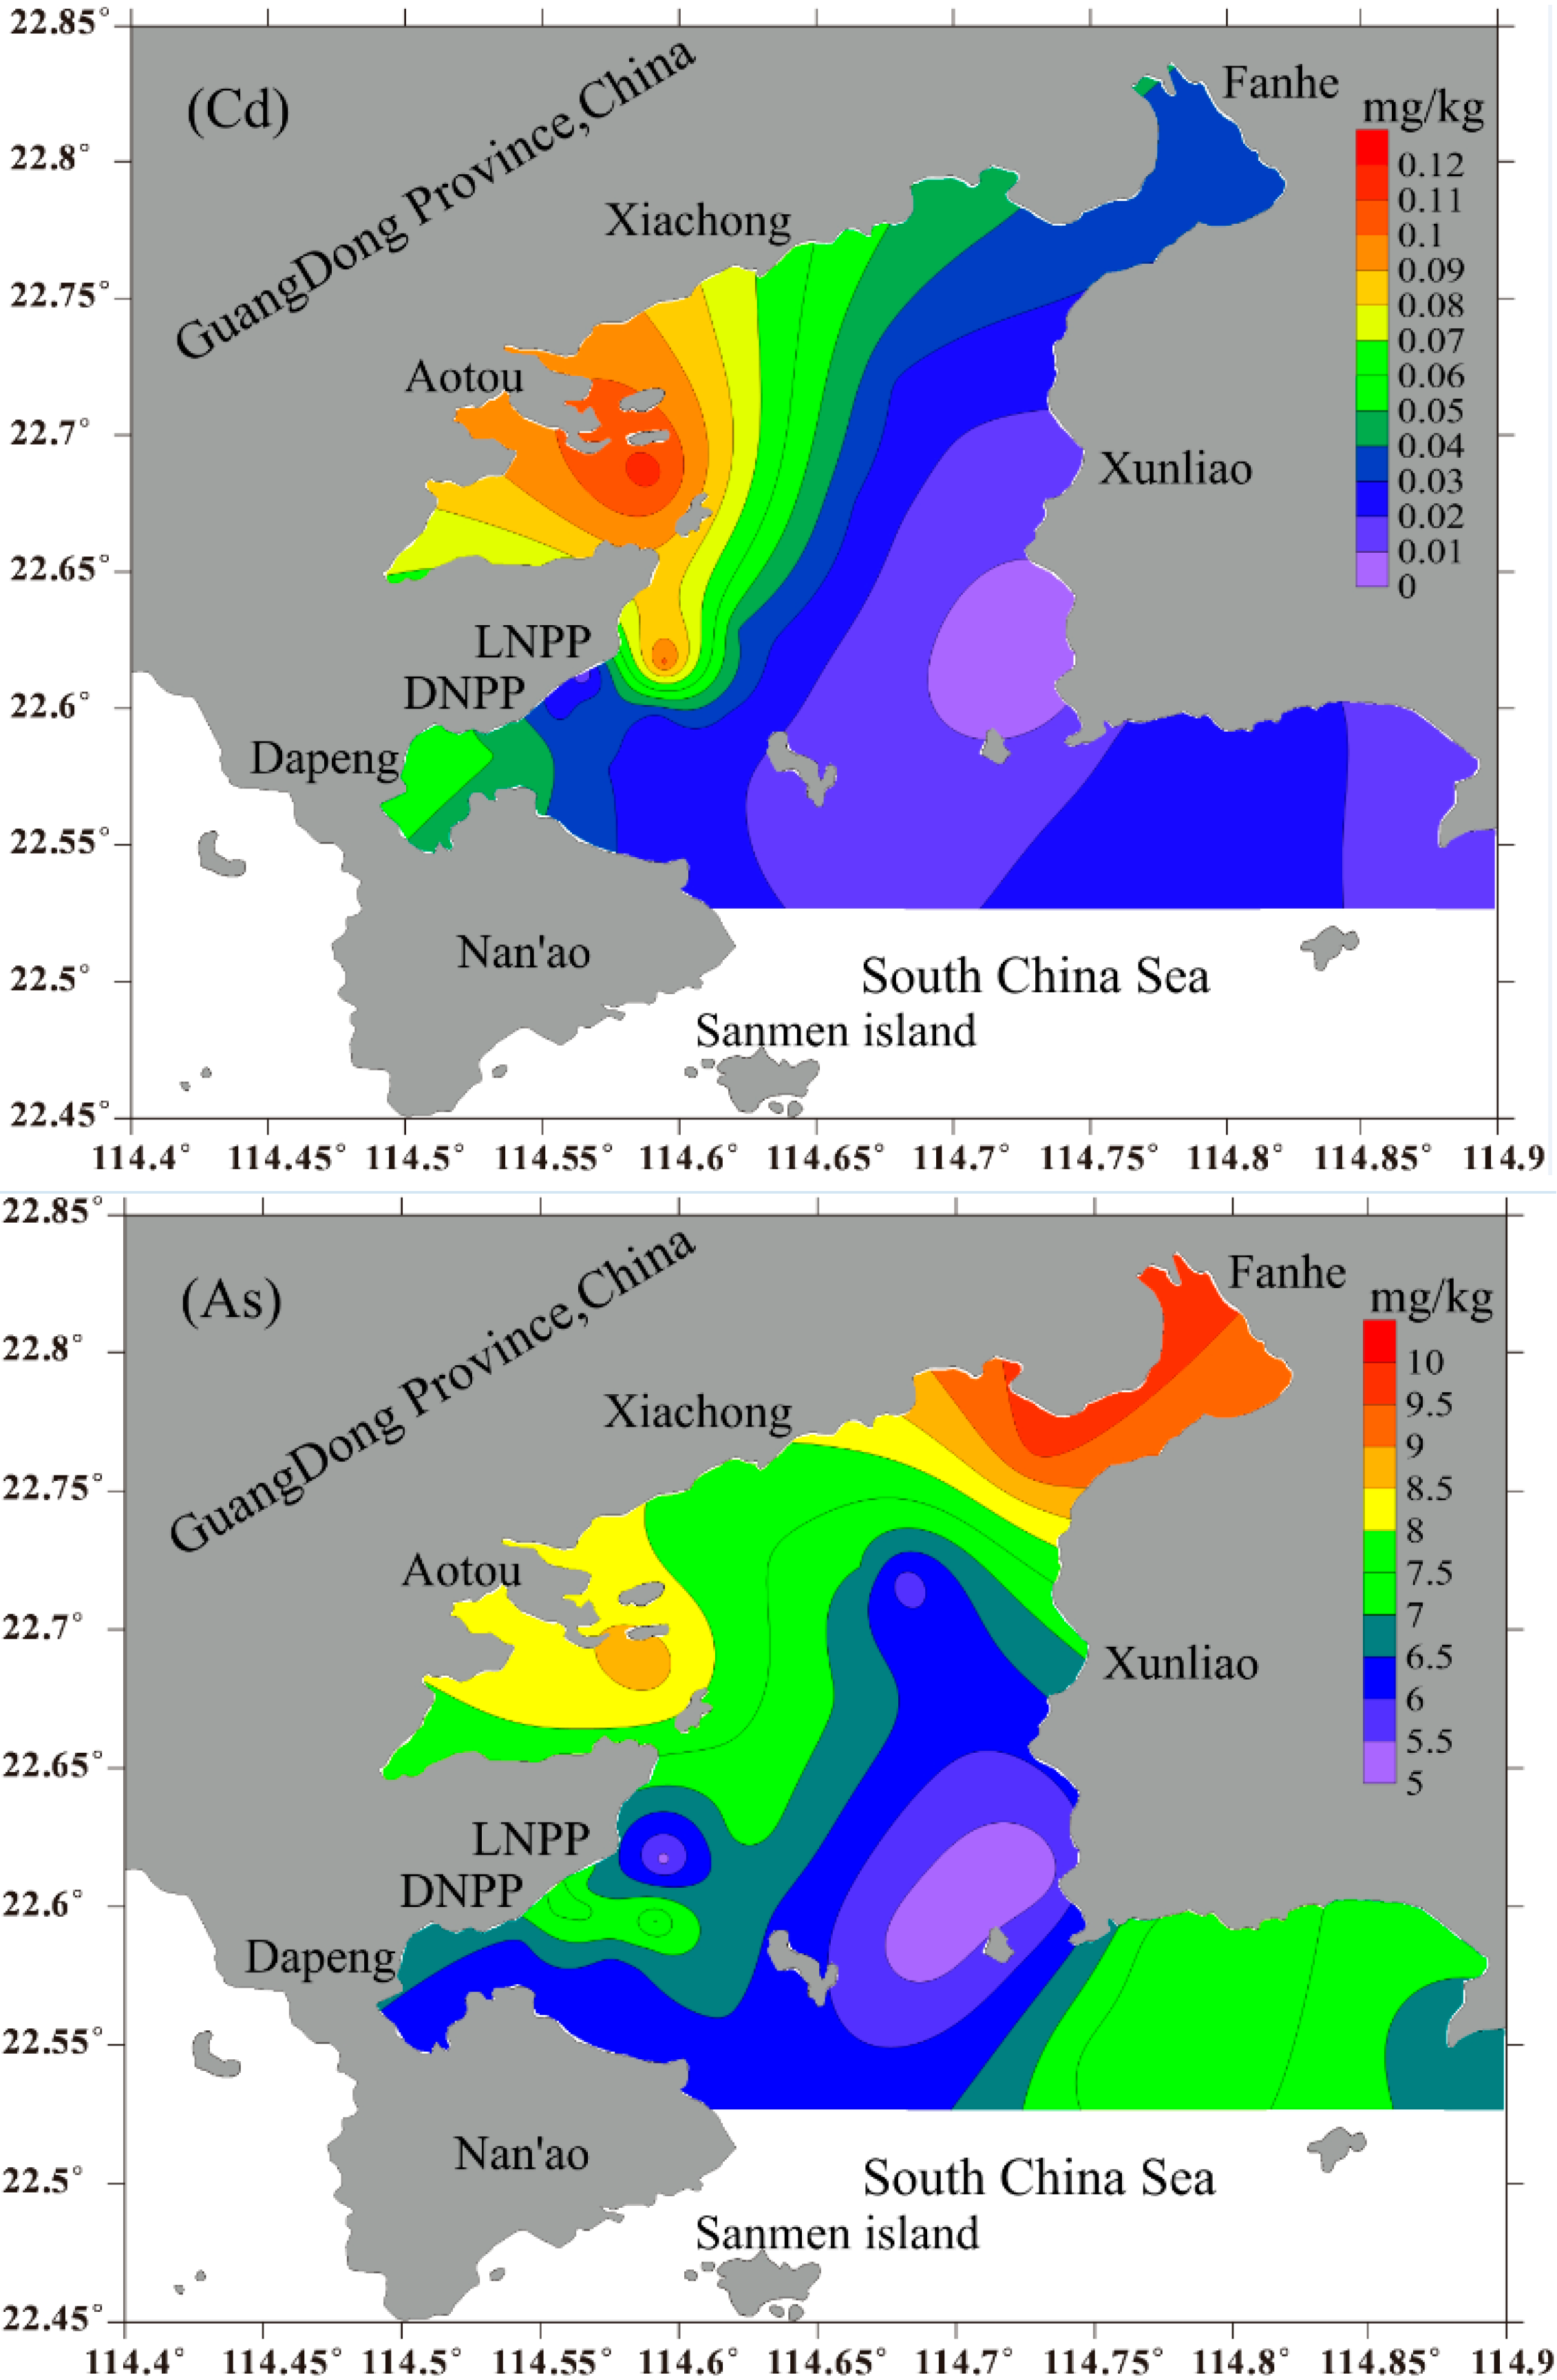
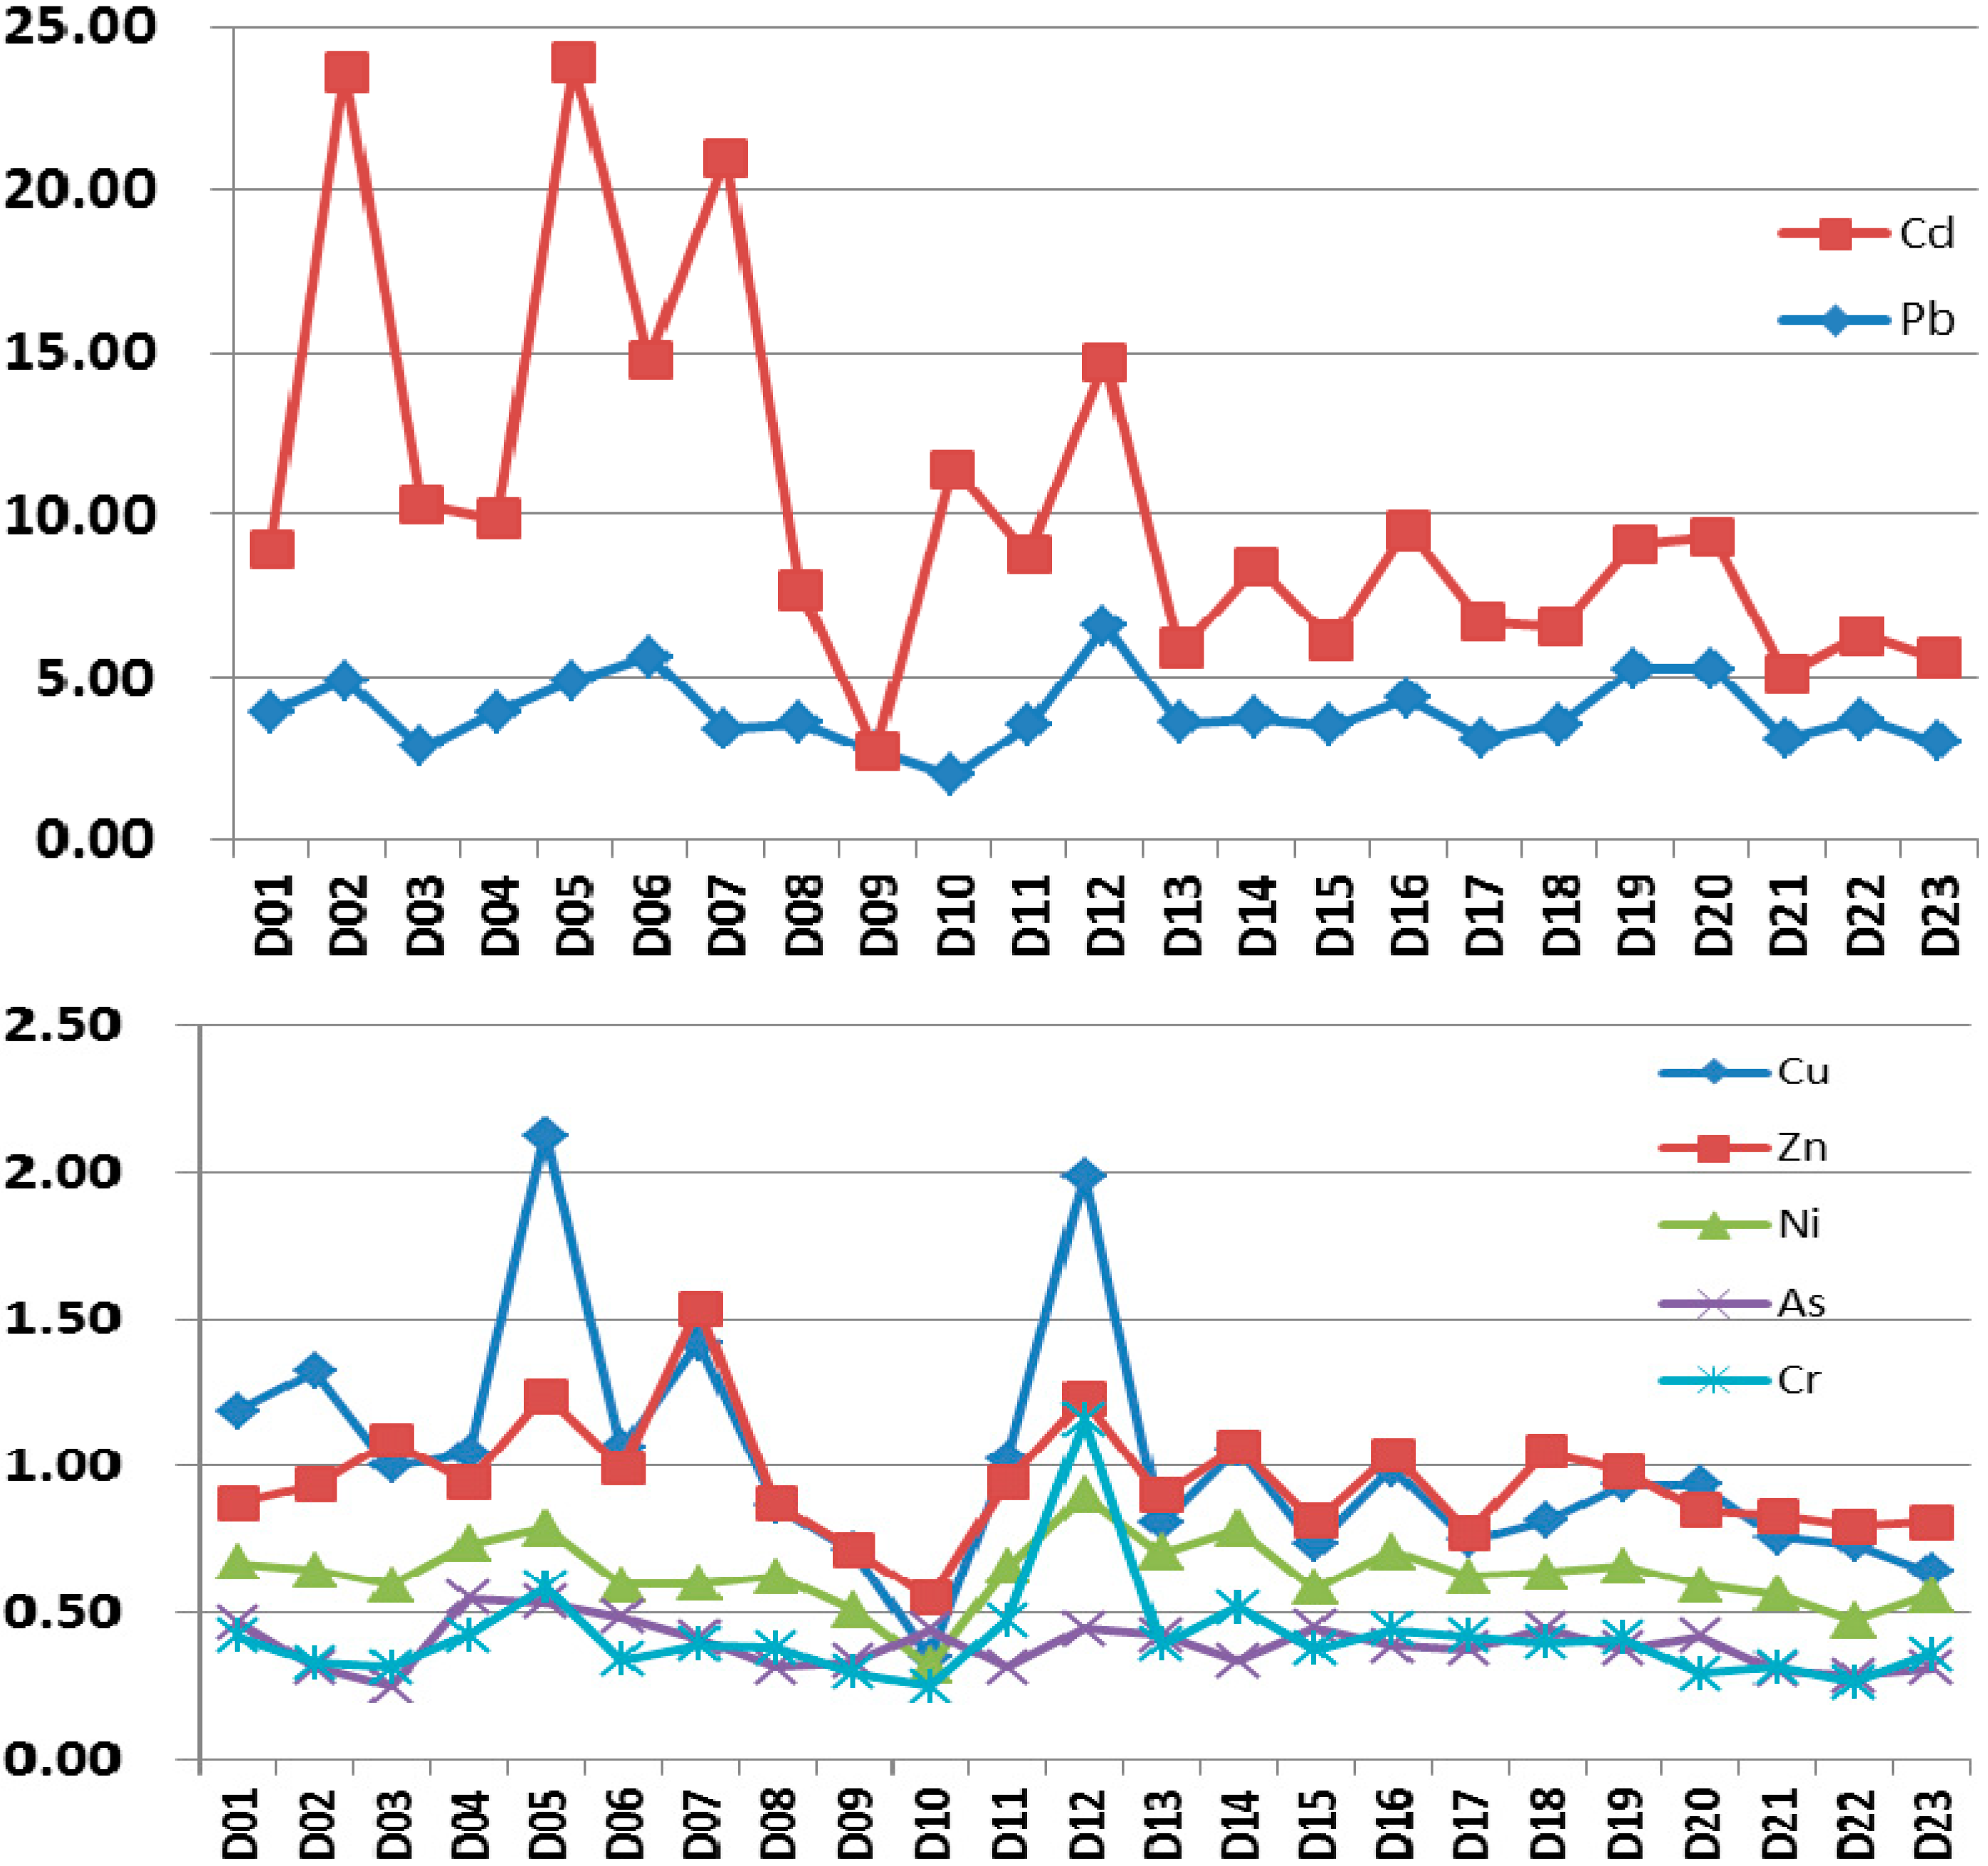
3.1. Distribution of Total Metals

According to Shepard’s sediment granularity classification, clay-like silt accounted for 71.2% of the surface sediments in DYB (which comprised 21.5% to 86.2%) and sandy silt accounted for 11.2% (which comprised 5.8%–15.4%). Out of all sampling stations, only D07 and D11 near Dapeng’ao were sandy silt, and D13 was medium sand. Overall, the granularity in DYB was more uniform in distribution. The TOC percent concentrations varied slightly and ranged from 0.58%–1.10%, with an average of 0.78%.
The spatial distribution variation of metals in surface sediments in DYB is widely distributed as seen in Figure 2, which shows a ring shape that descends in varying degrees from shore to bay. With the exception of Cr, relatively higher concentrations of metals occurred mostly in the nearby sub-basins of DYB, where the impact of human activities was most significant. High value areas for Cu, Pb, Zn, Ni and Cd were found near Dapeng’ao and Yaling Bay, and the maximum zone for As was in Fanhe Bay. This distribution pattern is consistent with an area, like the DYB, that has intensive human activities and a year-round clockwise circulation pattern.
Figure 2. Spatial distribution of metal concentrations.
Sustainability 06 09096 g002aSustainability 06 09096 g002bSustainability 06 09096 g002c
A dataset comparison showed that, with the exception of Pb, the mean concentration of metals decreased year-by-year in all study areas (Table 1). Average values of Cr, Ni, Cu, Zn and As decreased, respectively, 2.5-, 1.3-, 2.4-, 1.5- and 1.4-times over the past decade, and the highest value of Cr dropped significantly from 75.4 mg kg−1 to as low as 30.03 mg kg−1. Only Pb (44.18 mg kg−1) was noticeably higher than it was in the previous decade (23.00 mg kg−1). Among all of the coastal bays chosen for comparison (Table 1), the average content of Pb in DYB was higher than that in the Yangtze River Estuary, Sanya Bay and Bohai Bay [13,14], but much lower than levels in the Pearl River Estuary [15] and Quanzhou Bay [3]. The mean content of Cr, Ni and Cu was higher than in Sanya Bay, which is a famous tourist resort in China. For the other selected metals (Cr, Ni, Cu, Zn and As), the mean content in study areas was lower than that in all other domestic coastal bays, except Sanya Bay (See Table 1). In addition, levels of all selected metals in the study areas were significantly lower than those in other larger industrialized urban bays throughout the world, e.g., Masan Bay in South Korea [16] and Aliağa Bay in Turkey [17]. However, compared with the corresponding background values for the continental shelf of the South China Sea, the surface sediments collected were dramatically contaminated by the selected metals (Cu, Pb and Zn) in DYB.
Table 1. Metal concentration in surface sediments from the studied regions compared with the average metal concentration in sediments of other bays (mg/kg, dry wet).
Location CrNiCuPbZnCdAsReferencesAnthropogenic activities
Daya Bayrange14.82–44.696.62–26.154.27–23.5118.68–89.5822.34–87.250.002–0.1145.15–9.73this studyFish, tourism, industrial and transportation
average30.0318.9510.4044.1859.340.047.01
75.4025.6010.5032.7096.70NANA[6]
NANA25.0023.0089.000.039.60[5]
Pearl River Estuary 107.0037.1044.0054.70177.00NANA[6]Industrial and transportation
Yangtze River Estuary 86342927930.2310.1[15]Industrial and transportation
Sanya Bay, Hainan 12.4NA9.517.553.10.137.1[13]Tourism
Quanzhou bayaverage82.00NA71.4067.70179.600.6921.70[3]Fish and transportation
Bohai bay 101.0040.7038.5034.70131.000.22NA[14]Fish, industrial and transportation
Masan Bay, Korea 67.1028.8043.4044.00206.301.24NA[16]Industrial activities
Aliağa bay, turkey--111.0098.70321.00284.0086.401.47NA[17]Industrial activities
BMEC a--39.3022.107.4315.6054.400.189.71[9]
SQG of USEPA dERL b81.0020.9034.0047.00150.001.208.20[18]
ERM c370.0051.60270.00218.00410.009.6070.00--
Notes: NA: not available; a BMEC: background of marine sediments in the continental shelf of the South China Sea; b ERL: effects range-low; the threshold below which adverse effects on biota are rarely observed. c ERM: effects range-median; the threshold above which adverse effects on biota are frequently observed. d SQG of USEPA: the sediment quality guideline of United States Environmental Protection Agency.

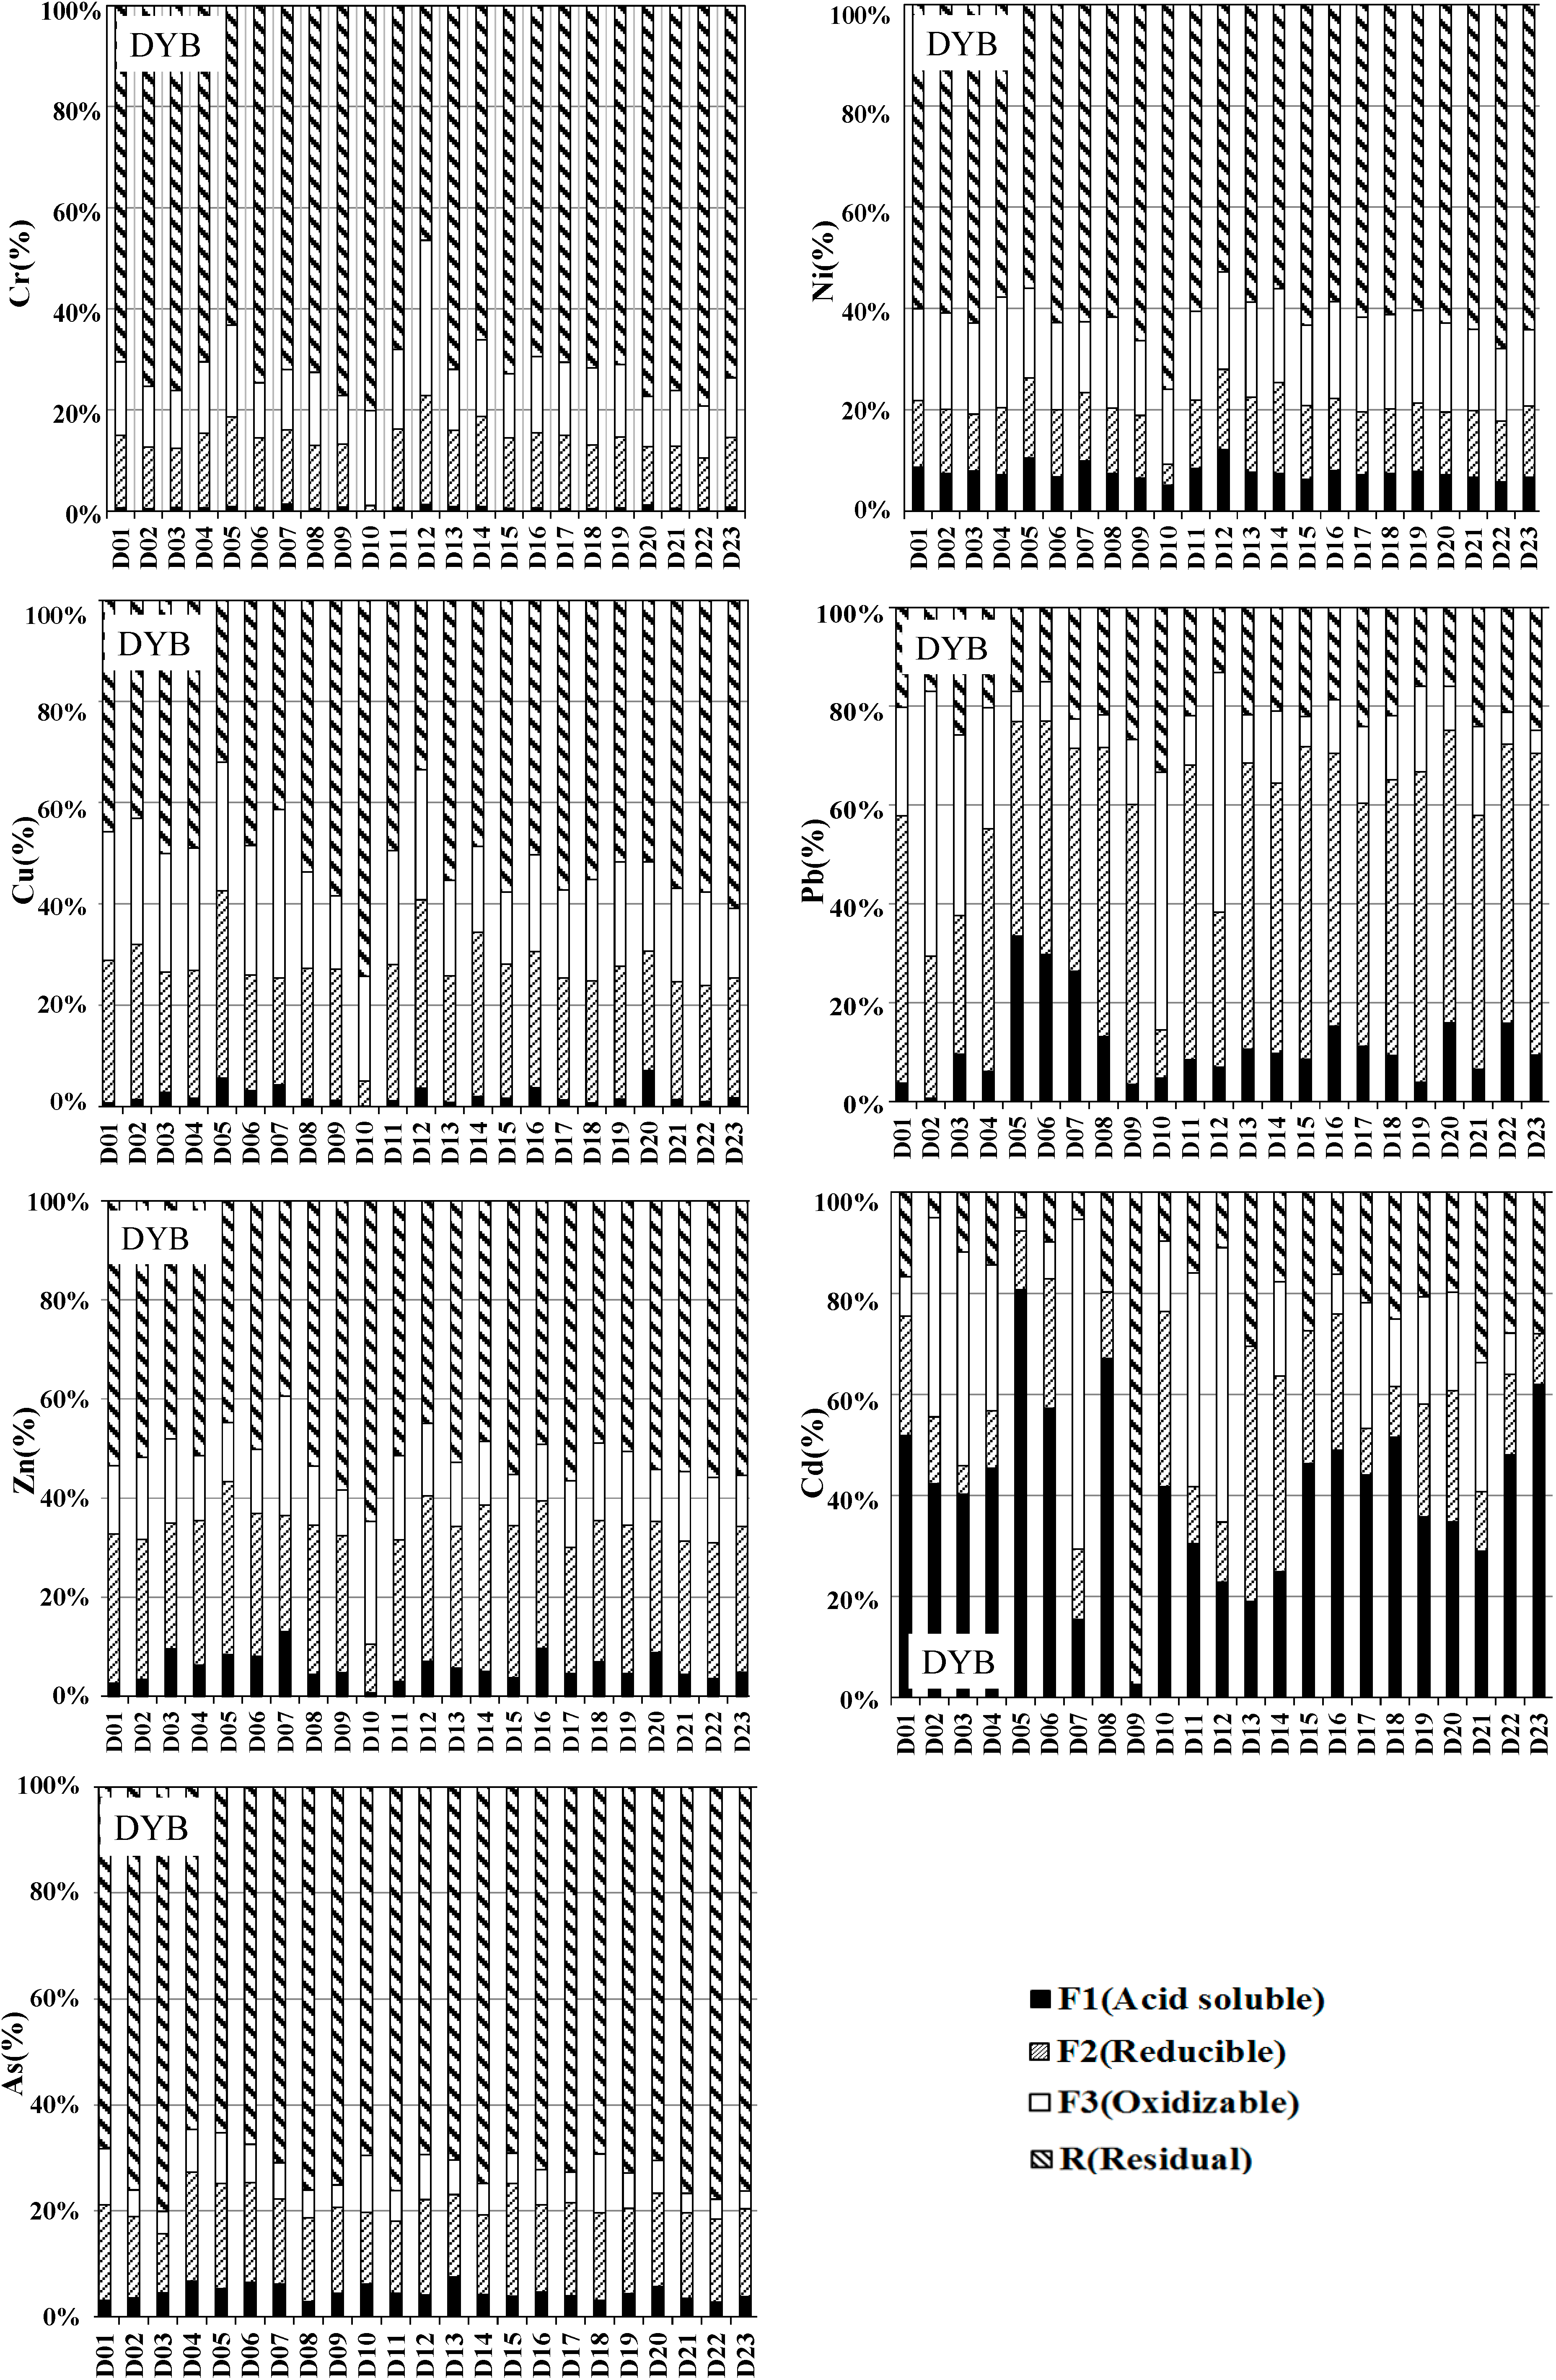
3.2. Metal Speciation

Following the sequential extraction procedure described above, the percentages of heavy metals associated with each fraction were calculated. The results are summarized in Figure 3. The heavy metals take on different speciation patterns, and some show significant spatial variation.
The first step of sequential extraction produces the acid-soluble fraction (F1) of metals that are weakly associated with carbonates. Heavy metals bound to acid-soluble fractions in F1 are water-soluble and in a carbonate binding state that is subject to ion exchange. The metals were absorbed in clay and humus, which is sensitive to environmental changes and allows for easier migration and transformation under acidic conditions [10]. The results of this investigation have shown that the order of association with F1 was observed for the selected metals: 50% > Cd > 25% > Pb > Ni > Zn > 5% > As > Cu > Cr, Cd and Pb were highly associated with the mobile fraction with 39% and 18%, respectively, which raises concerns, due to its well-known toxic effects on aquatic organisms. These results agree with previous studies that have highlighted the potential threats caused when Cd and Pb are highly associated with F1 [19].
The second fraction of reducible metals (F2) indicates the metals usually associated with Fe and Mn oxy/hydroxides that are difficult to release due to strong ionic wrapping. However, if oxidation-reduction potential (Eh) and oxygen levels in seawater decrease, these may deoxidize and cause secondary pollution, which can be seen in the environmental pollution associated with extensive human activities. It was observed that the order of association between F2 and the selected metals was 50% > Pb > Zn > Cu > 25% > Cd > As > 1 5% > Cr > Ni > 10%. Pb, Zn and Cu were mainly associated with the reducible fraction with an average of 39%, 31% and 26% of their total contents, respectively. A high % of associations of Pb and Cu to the reducible fraction in contaminated sediments of estuaries, bays and riverbeds has been reported in the literature [14]. The large number of metals associated with the reducible fraction raises concerns their potential mobility in the water phase and subsequent bioavailability during dredging/remediation. Despite their low percent association in F1, the risk of environmental and ecological damage from heavy metals cannot be ruled out.
The sequential fractionation is an oxidizable fraction (F3) that is bound to organic matter and sulfides. Under oxidizing conditions, organic matter degradation can lead to the release of the metals bound to this fraction. The organic fraction released during the extraction process is not bioavailable, since it exists in stable humic substances that release small amounts of metals slowly. Research results have shown a % of association as low as 6%, 12% and 14% for As, Cr and Zn, respectively. The low content of metals associated with F3 might be due to the small amount of organic matter.
The fourth step in the sequential extraction shows that a fraction of metals is associated with alumino-silicate minerals, the so-called residual fraction (R). The R behavior is the most stable, because it is bound primarily to the crystal lattices of silicate, and it can only be released over time as a function of the weathering process. It has no bioavailability, because its life is shorter than the period of time it takes for the natural weathering process to occur. Results show the average % association with the R fraction in the following decreasing order: As > Cr > Ni > Zn > Cu > 50% > 25% > Cd > Pb > 15%.
Figure 3. The distribution in different geochemical fractions of surface sediments.
Sustainability 06 09096 g003

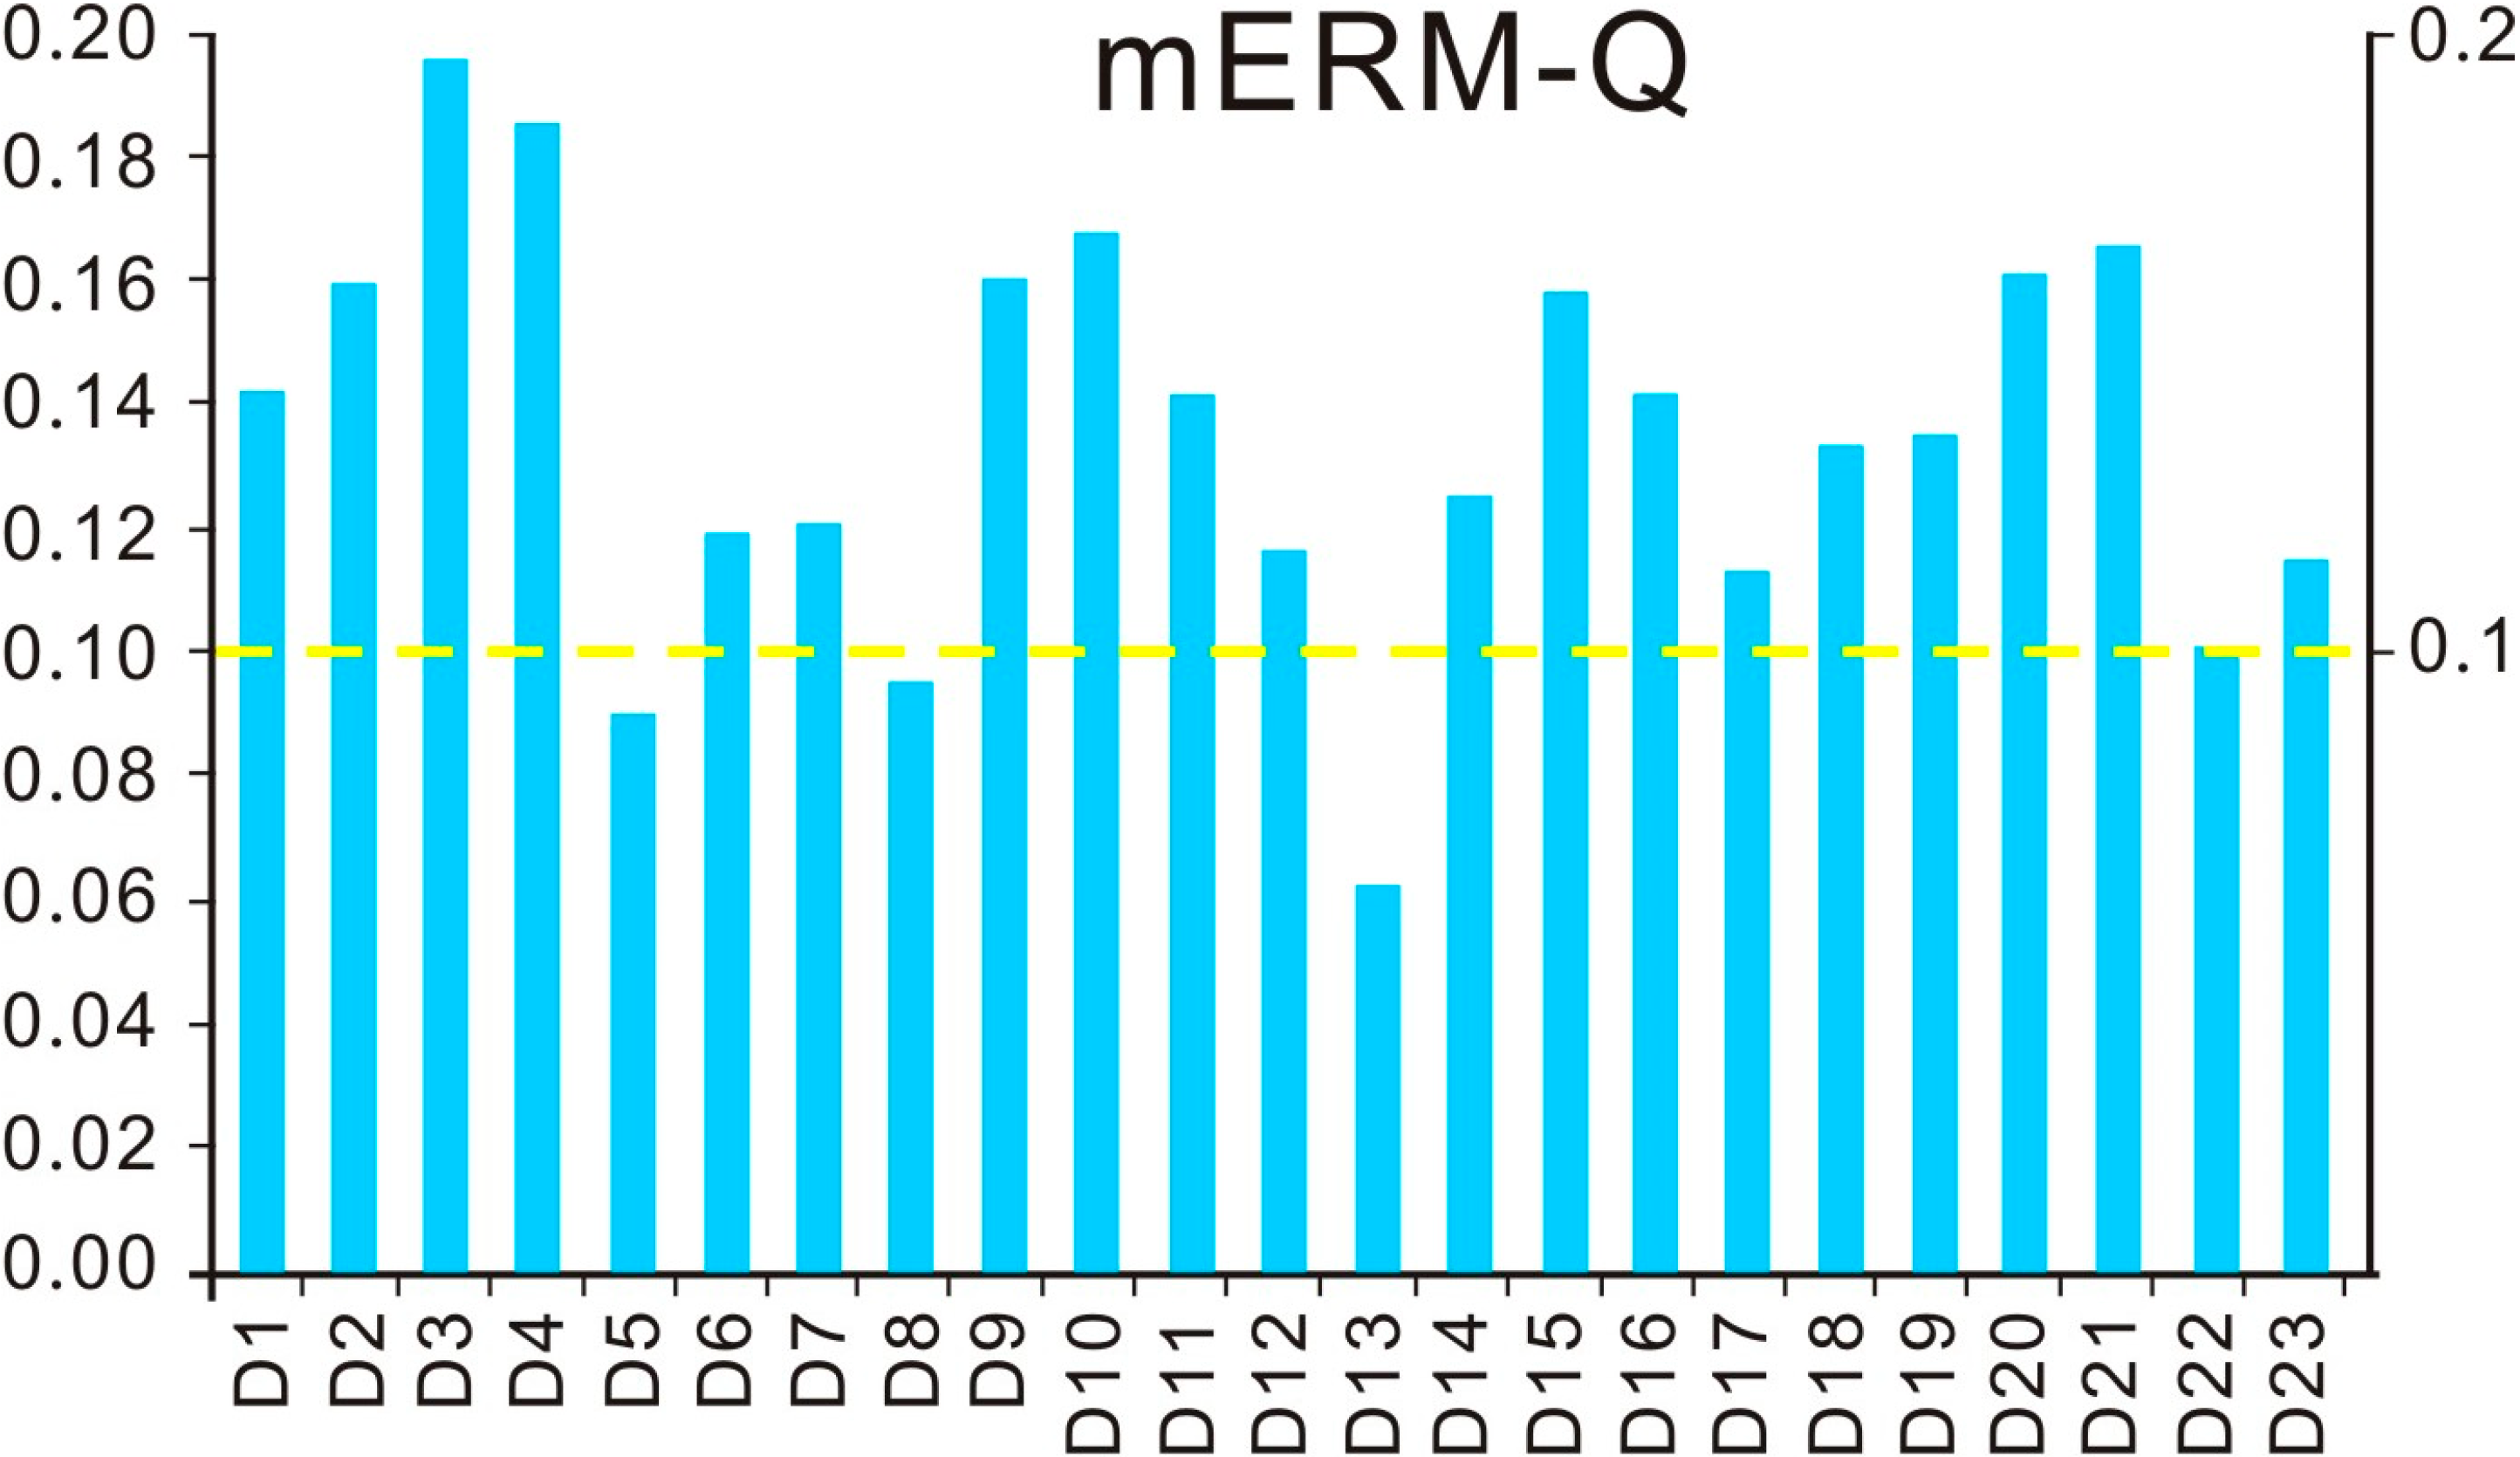
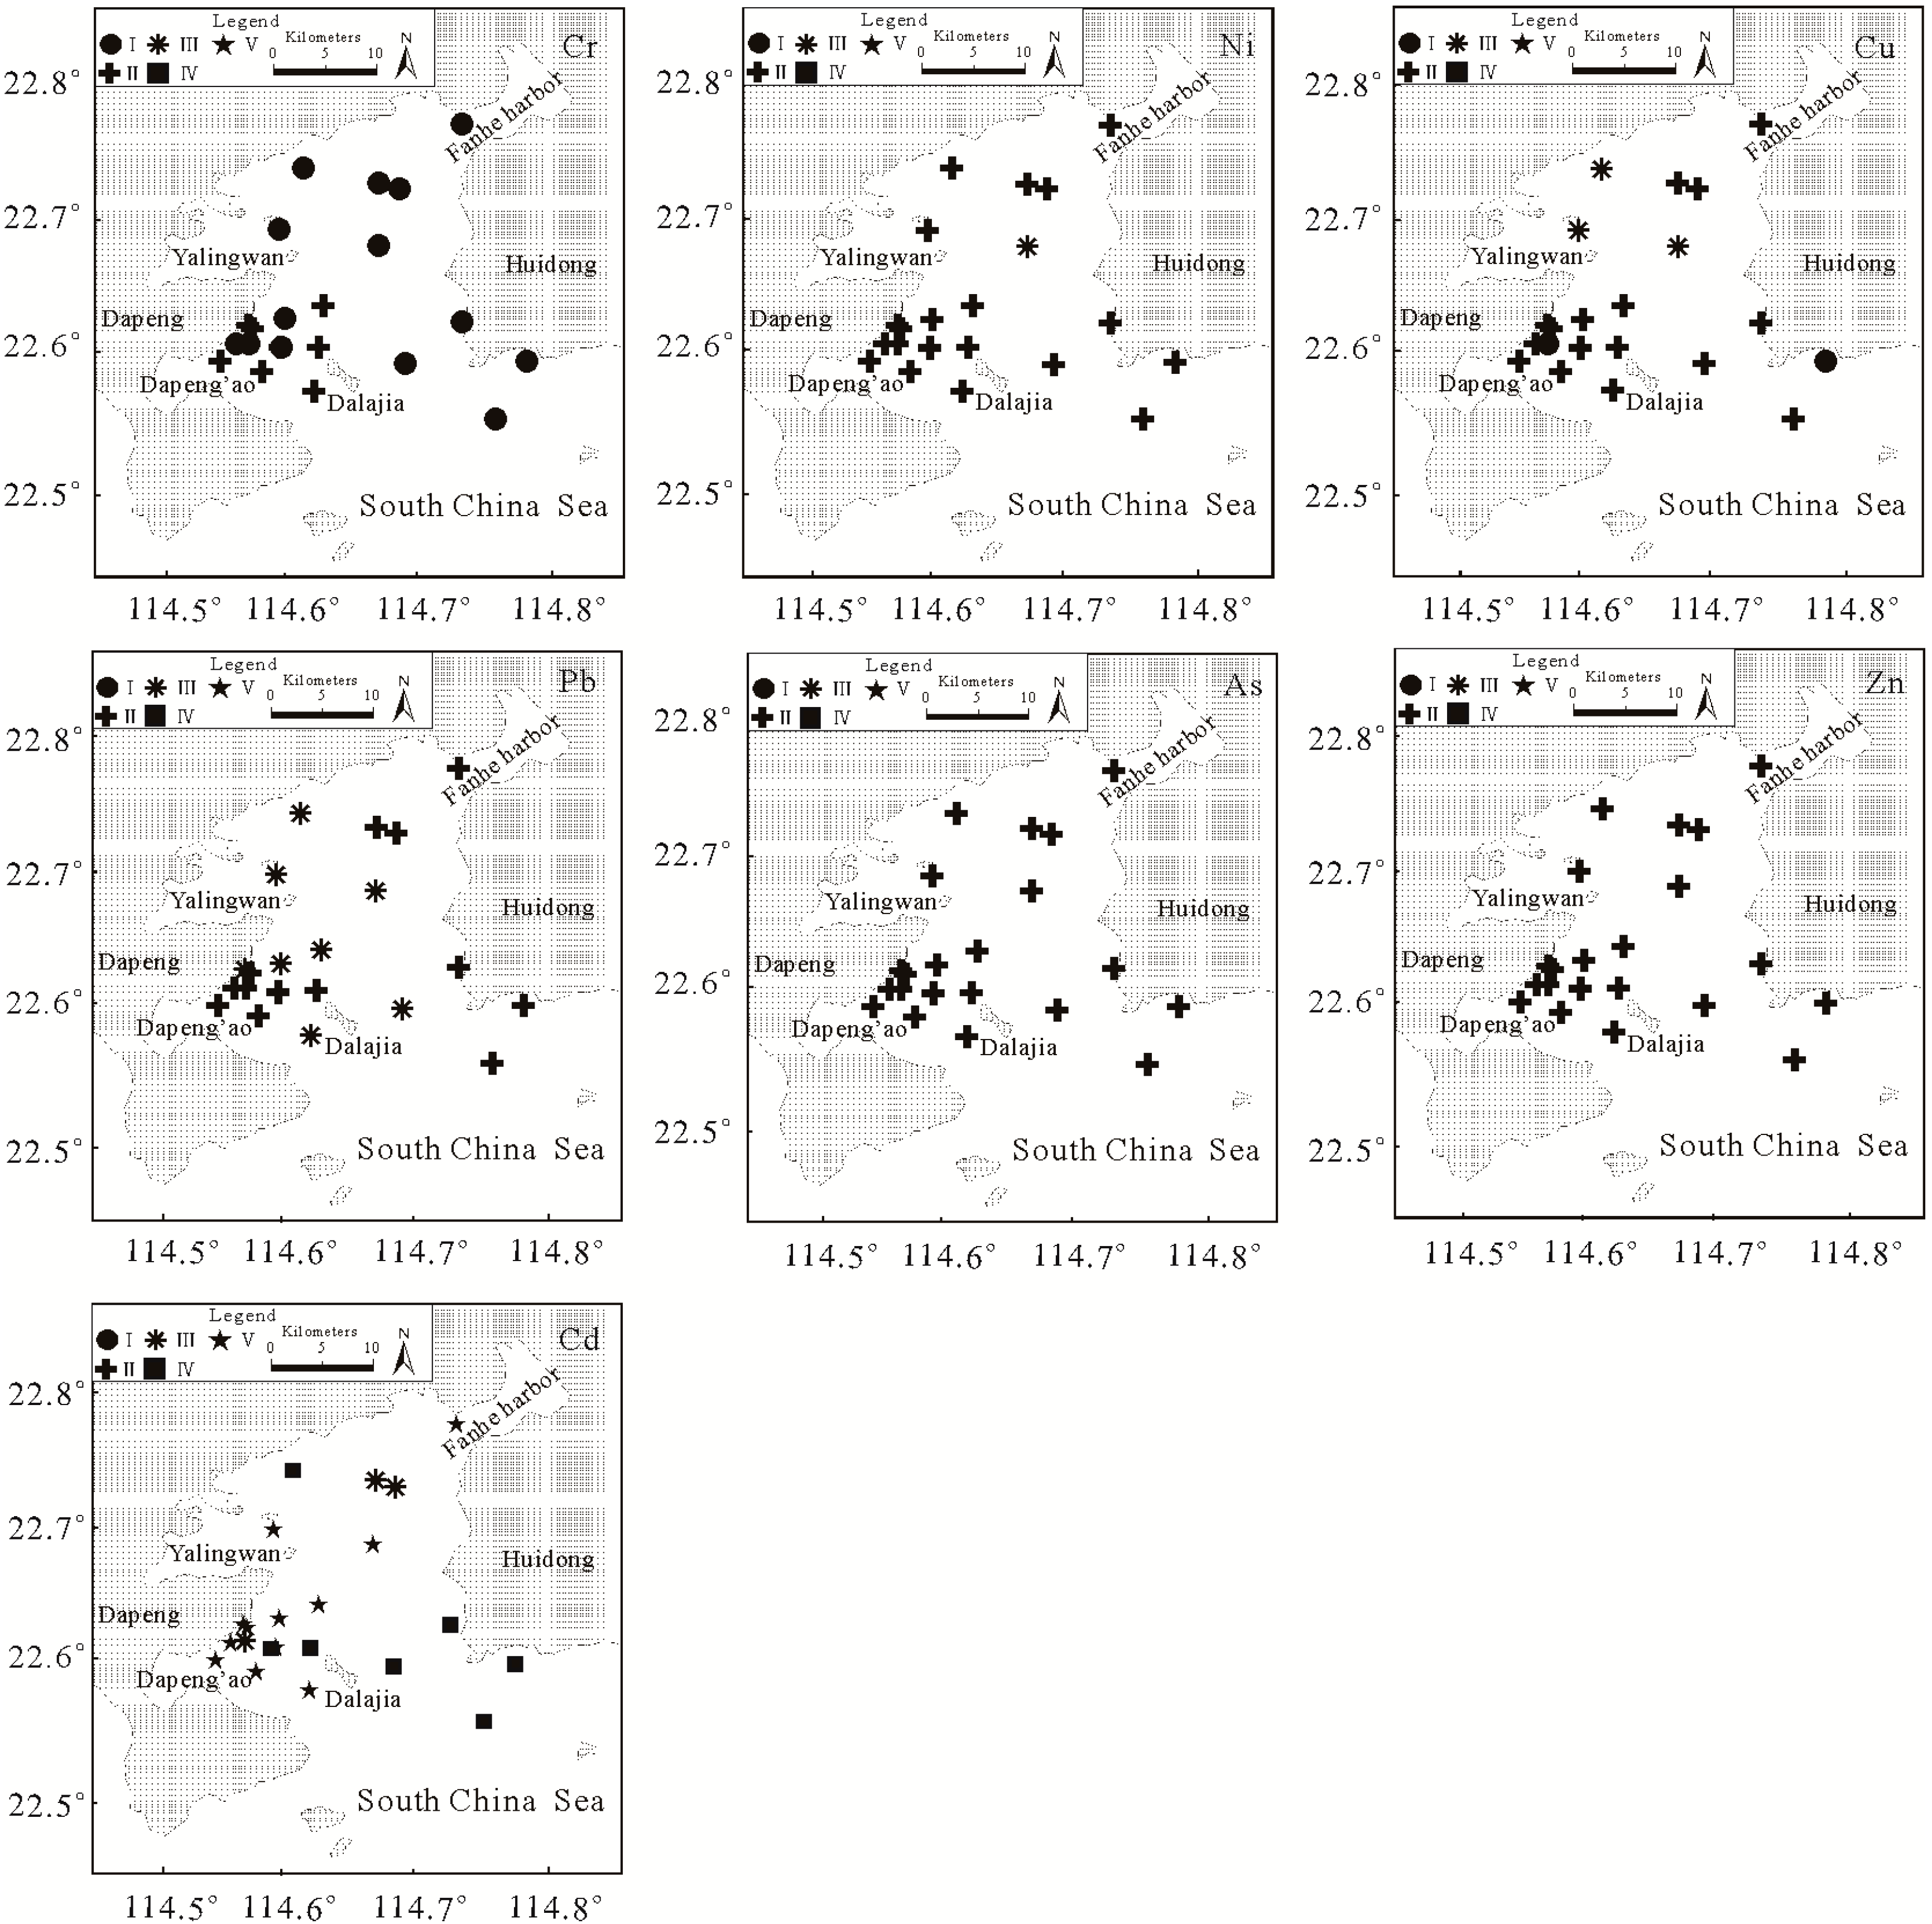
3.3. Risk Assessment

The ecological risks of the heavy metals in the sediments were assessed. Effects range-low (ERL) and effects range-median (ERM) were the main parameters used to estimate the adverse biological effects of metals in the marine sediments. These parameters were created for the U.S. National Oceanic and Atmospheric Administration (NOAA) using numerous types of modeling, laboratory and field studies performed on marine and estuarine sediments [18]. Metal concentrations in sediments can be classified into three levels: rarely (<ERL), occasionally (ERL-ERM) and frequently (≥ERM) associated with adverse biological effects. Our results (Table 1) show that ERM levels were never exceeded in the study areas, nor were ERL levels. This would not likely cause any adverse effects in the study areas.
All of the above indexes take into account each individual metal. Given the fact that metals in sediments always occur as complex mixtures, we used the mean ERM quotient method to determine the possible biological effects of the combined toxicant groups by computing the mean quotients for a large range of contaminants. The mean ERM quotient is calculated using the following formula:
mean-ERM quotient = ( C x / ER M x ) / n
where Cx is the measured concentration of the examined component(x) in the sediment, ERMx is the ERM for metal x and n is the number of metals. Mean-ERM quotients less than or equal to 0.1 (low priority site) have a 9% probability of being toxic; quotients of 0.11–0.5 (medium-low priority site) have a 21% probability; quotients of 0.51–1.5 (high-medium priority site) have a 49% probability; and quotients greater than 1.50 have a 76% probability [20]. Based on the mERM-Q data, the contour map of multi-metal ecological risk potential (See Figure 4) shows that mERM-Q < 0.5 varied within a range of 0.09–0.19 at all stations. In general, all sites, except D05, D08, D13 and D22, in DYB were medium-low priority sites, indicating that the combination of the seven studied metals has a 21% probability of being toxic. mERM-Q < 0.1 (low priority site) for D05, D08, D13 and D22 had a 9% probability of being toxic. This confirms that the highest potential ecological risk zone is located in the eastern sub-basins of DYB.
Figure 4. Mean ERM quotient (mERM-Q) variation characteristics in surface sediments of Daya Bay (DYB).
Sustainability 06 09096 g004
It is widely known that the higher percentage of non-residual (F1 + F2 + F3) fractions the sediments contain, the easier it is for metals to be released and the more bioavailable they are. In traditional geochemistry, the primary mineral in particles is called the primary phase and the weathering products as R. Secondary metabolites (e.g., F1, F2 and F3) are known as the secondary phase. Anthropogenic heavy metal pollution occurs during the secondary phase; therefore, the ratio of secondary to primary phases (KRSP) can show the degree of heavy metal pollution in sediments: the larger the value of KRSP is, the greater the level of pollution and the greater the potential risk. In DYB surface sediments, the KRSP of seven studied metals decreased in the sequence of Cd > 5 > Pb > 3 > Cu > 1 > Zn > Ni > Cr > As, the same as the order of heavy metal migration. According to Yu and Wang [6], if KRSP < l, this represents no pollution; 1 < KRSP < 2 is light pollution; 2 < KRSP < 3 is moderate pollution; and 3 < KRSP is heavy pollution. As shown in Figure 5, the KRSP average value of Cd is 9.34, and it is highest in the selected metals, indicating that the pollution degree of Cd is greatest; next is Pb, with an average KRSP value of 4.93, which suggests heavy pollution. The mean KRSP of Cu is 1.01; Zn is 0.95 and >1 at eight stations, indicating that Cu and Zn fall within the level of light pollution; the KRSP of Ni, Cr and As are less than one, which indicates that this area is basically unpolluted.
Figure 5. The variation characteristics of KRSP in surface sediments from DYB.
Sustainability 06 09096 g005
Metals in the acid-soluble fraction function as short-term ecological risk indicators, since they are the metals with the weakest bonds in sediments. During the aqueous phase, they become more easily bioavailable. We used risk assessment code (RAC) to assess the potential mobility and hazard of specific metals based on the percentages of exchangeable metals and bound-to-carbonate metals in the sediment [2]. The standards of RAC are listed in Table 2.
Table 2. Criteria of the risk assessment code (RAC) [21].
GradeExchangeable and bond to carbonate metal (%)Risk
< 1No risk
1–10Low risk
11–30Medium risk
31–50High risk
> 50Very high risk
See Figure 6 for the distribution of RAC. Cr falls in the low risk category in Dapeng’ao and in the no risk category at other stations. Ni falls mainly in the low risk category, and only at station D6 does it fall into the medium risk category. Cu and Pb are mainly in the low risk category, although some stations near Yaling Bay and Dapeng’ao fall into the medium risk category. Both As and Zn at all stations fall into the low risk category. Cd poses a high to very high risk and requires immediate attention.
The results of the assessments using RSP and RAC are relatively consistent. On the whole, the potential ecological risk of Cd is highest, and Pb and Cu have certain risks in sub-basins within Daya Bay and require close attention.
Figure 6. Distribution results of risk assessment code (RAC) in surface sediments in DYB.
Sustainability 06 09096 g006

3.4. Distribution Factors

The correlation matrix between geochemical phases and the total content of metals in the study areas is shown in Table 3. The results also show that, with the exception of Cr-F2, Pb-F1, Cd-R and As-F1, concentrations of all metals in the study area are positively and highly correlated with their metal speciation. This suggests that, to some extent, the total concentration of heavy metals can be used to help determine levels of pollution. To explore the correlations among variables, the Pearson’s correlation coefficient among heavy metals, TOC and grain sizes in the surface sediments are presented in Table 4. Significantly positive correlations were observed for the selected metals, except for Cd and As, indicating that these metals are associated with each other and may have common natural or anthropogenic sources [22]. The results suggested that these heavy metals were almost not associated with clay and sand, and TOC correlated to the most heavy metals positively, except for TOC-Cd.
Table 3. Correlation matrix between total concentration and its geochemical phases of the selected metals.
CrNiCuPbZnCdAs
F10.3340.815 **0.693 **0.3450.418*0.777 **0.131
F20.810 **0.927 **0.964 **0.657 **0.957 **0.686 **0.771 **
F30.678 **0.940 **0.910 **0.718 **0.710 **0.664 **0.566 **
R0.915 **0.975 **0.818 **0.775 **0.941 **0.1840.933 **
* Correlation is significant at the 0.05 level (two-tailed); ** correlation is significant at the 0.01 level (two-tailed).
Table 4. Pearson correlation coefficients between heavy metals in the studied region.
CrNiCuPbZnCdAsClaySandTOC
Cr1
Ni0.921 **1
Cu0.710 **0.724 **1
Pb0.651 **0.4580.731 **1
Zn0.934 **0.9680.839 **0.571 *1
Cd0.3330.2670.712 **0.569 *0.4401
As0.565 * 0.538 *0.628 *0.3980.541 *0.2081
Clay0.2420.864 *0.2380.569 *0.1920.464−0.3521
Sand0.3750.3690.1450.3270.360−0.016−0.1560.2041
TOC0.864 *0.871 *0.766 *0.569 *0.870 *0.2250.579 *0.1710.4641
* Coefficients at the 0.05 significance level, p < 0.05. ** Coefficients at the 0.01 significance level, p < 0.01. TOC: total organic carbon.
PCA was performed on the metal fractionation data, and the scores in the rotated principal component space are presented in Table 5. The results obtained from PCA were confirmed by the correlation analysis and were applied to the datasets (28 variables) to identify the sources of metals in the sediments, using varimax rotation with the Kaiser criterion.
Three components were extracted, which account for 82.52% of the total variance and the eigenvalues >1. The first component, PC1, accounted for 48.58% of the total variance and was characterized by high loadings of the residual fraction for almost all selected metals. The reducible fractions of Cr, Ni, Zn, Pb and As were much higher than those of the other factors and, thus, must play a decisive role in the composition and distribution of heavy metals in sediments. Metals that exist in the crystal lattice of minerals usually are in a relatively stable state. Natural weathering and erosion of rock are the main contributing factors to this relatively stable phase; the residual state and other unstable phase states are related to the weathering action of the surrounding rocks in PC1. The bedrock of the surrounding DYB coastline is mainly granite, which is consistent with the analysis results of phase behaviors. Therefore, the PC1 factor reflected the contributions of the metals’ natural geological sources (e.g., weathered bedrock and corrosion product) to coastal sediments.
Table 5. Loadings in fractions of metals on varimax-rotated factors of different datasets.
OrderMetalsPC1PC2PC3
1CrF1−0.020.640.66
2NiF10.690.490.45
3CuF10.030.900.25
4PbF10.060.90−0.07
5ZnF10.080.820.01
6CdF10.360.720.10
7AsF1−0.430.31−0.28
8CrF20.570.430.64
9NiF20.850.330.24
10CuF20.470.590.23
11PbF20.340.610.28
12ZnF20.830.420.32
13CdF2−0.070.420.03
14AsF20.620.210.10
15CrF30.360.280.81
16NiF30.870.170.23
17CuF30.300.610.45
18PbF3−0.10−0.150.85
19ZnF30.470.140.21
20CdF3−0.350.190.56
21AsF30.120.130.13
22CrR0.91−0.010.07
23NiR0.980.040.02
24CuR0.860.130.20
25PbR0.520.070.49
26ZnR0.970.040.13
27CdR0.560.010.06
28AsR0.59−0.250.07
29Percentage of total variance48.5822.5211.42
30Cumulative percentage variance48.5871.1082.52
PC2 accounted for 22.52% of the total variance and was strongly associated with F1 (Cr, Cu, Zn, Cd, Pb), F2 (Cu, Pb) and F3 (Cu). Research results show that industrial wastewater often contains large amounts of a variety of phase metal elements. DYB includes a large area of farmland. Cage culture activities there (feeding fodder) and pollution associated with fishing boats contribute to the high proportion of Pb in F1 and F2. PC2 represents the impacts of industrial wastewater and a quacultural activities.
The contribution ratio of PC3 is 11.42% of the total variance. It has high correlations with oxidizable Pb and Cd, as well as residual Cr. Living sewage often contains a large number of organic components, and even the heavy metals in it mostly appear in the form of an organic binding state (oxidation state). In addition to DPIK, more than 20 villages and towns around DYB directly discharge a large amount of sewage into Daya Bay on a daily basis. Therefore, PC3 can be considered to be the living sewage factor.

4. Conclusions

This study has shown that using a combination of sequential extraction data, multivariate statistical analyses and the ecological risk indexes, an effective assessment of environmental quality in the studied areas affected by several sources of anthropogenic pollution can be produced.
The results show that the content of selected metals was distributed as bends, with a high content in Dapeng’ao, Yaling and Fanhe Bay, descending from shore to bay by varying degrees. With the exception of Pb, the amounts of all metal contents in Daya Bay have decreased over the past decade, due to pollution control being enforced by the local government.
According to the results, which were based on speciation fraction, Cr, Ni, Cu, Zn and As exist mainly in the residual fraction and, thus, are of low bioavailability. Cd and Pb were found to be abundant in the non-residual fraction and, thus, of high potential mobility, which is an indication of significant anthropogenic sources.
The spatial distribution of heavy metals is positively and highly correlated with the total content distribution. This suggests that concentrations of metals can, to some degree, be used to determine levels of pollution. PCA and PC were conducted, and the results show that the primary source of contamination is the product created as a result of the natural weathering and erosion of rock. Secondary sources of contamination are mariculture and industrial wastewater. The third source of contamination is domestic sewage discharge.
Finally, the comprehensive assessment of the potential pollution risks of the metals by using the ratio of the mean effects range-median (mean-ERM quotient), the secondary phase to primary phase (RSP) and risk assessment code (RAC) were conducted, and the results show that the highest potential ecological risk zone was found in the eastern sub-basins of DYB. Furthermore, Cd has the highest risk of being present, while Pb and Cu have certain risks.
Our study suggests that it would be of considerable benefit to conduct further ecotoxicological studies in DYB in order to better understand and prevent pollution in this highly industrialized and populated area.

Acknowledgments

This work was supported by the Ocean Public Welfare Scientific Research Project, State Oceanic Administration People’s Republic of China (Grant No. 201105015-06) and the Young Scientist’s Fund of the State Oceanic Administration People’s Republic of China (Grant No. 2013308).

Author Contributions

Jianhua Wang and Chunlian Liu designed this research; Jie Yang and Linglong Cao collected the data and wrote the manuscript with significant contributions from other authors. The results’ interpretation and English editing were done by Chuguang Huang and Weixu Cai. Xiaojuan Peng provided support in performing the data analysis. All authors have read and approved the final manuscript. In addition, the authors appreciate Professor George Davidson for polishing the English writing of this article and for his valuable discussions in particular.

Conflicts of Interest

The authors declare no conflict of interest.

References

  1. Cao, L.L.; Huang, C.G.; Wang, J.H.; Xie, J. Pollution status of selected metals in surface sediments of the Pearl River Estuary and Daya Bay, South China Sea. J. Resid. Sci. Tech. 2014, 11, 119–130. [Google Scholar]
  2. Ghrefat, H.; Yusuf, N. Assessing Mn, Fe, Cu, Zn, and Cd pollution in bottom sediments of Wadi Al-Arab Dam, Jordan. Chemosphere 2006, 65, 2114–2121. [Google Scholar] [CrossRef] [PubMed]
  3. Yu, R.L.; Yuan, X.; Zhao, Y.H.; Hu, G.R.; Tu, X.L. Heavy metal pollution in intertidal sediments from Quanzhou Bay, China. J. Environ. Sci. 2008, 20, 664–669. [Google Scholar] [CrossRef]
  4. Gu, Y.G.; Lin, Q.; Jiang, S.J.; Wang, Z.H. Metal pollution status in Zhelin Bay surface sediments inferred from a sequential extraction technique, South China Sea. Mar. Pollut. Bull. 2014, 64, 712–720. [Google Scholar]
  5. Qiu, Y.; Wang, Z. An assessment of potential ecological risk of heavy metals in the Daya Bay region. Tropic Oceanol. 1997, 16, 49–53. [Google Scholar]
  6. Yu, X.J.; Yan, Y.; Wang, W.X. The distribution and speciation of trace metals in surface sediments from the Pearl River Estuary and the Daya Bay, Southern China. Mar. Pollut. Bull. 2010, 60, 1364–1371. [Google Scholar] [CrossRef] [PubMed]
  7. Gao, X.L.; Chen, C.A.; Wang, G.; Xue, Q.Z. Environmental status of Daya Bay surface sediments inferred from a sequential extraction technique. Estuar. Coast. Shelf Sci. 2010, 86, 369–378. [Google Scholar] [CrossRef]
  8. Qiao, Y.M.; Yang, Y.; Gu, J.G.; Zhao, J.G. Distribution and geochemical speciation of heavy metals in sediments from coastal area suffered rapid urbanization, a case study of Shantou Bay, China. Mar. Pollut. Bull. 2013, 68, 140–146. [Google Scholar] [CrossRef] [PubMed]
  9. Huang, L.L.; Pu, X.M.; Pan, J.F.; Wang, B. Heavy metal pollution status in surface sediments of Swan Lake lagoon and Rongcheng Bay in the northern Yellow Sea. Chemosphere 2013, 93, 1957–1964. [Google Scholar] [CrossRef] [PubMed]
  10. Lin, C.; Liu, Y.; Li, W.Q.; Sun, X.W.; Ji, W.D. Speciation, distribution, and potential ecological risk assessment of heavy metals in Xiamen Bay surface sediment. Acta Oceanol. Sin. 2014, 33, 13–21. [Google Scholar] [CrossRef]
  11. Passos, E.D.A. Assessment of trace metals contamination in estuarine sediments using a sequential extraction technique and principal component analysis. Microchem. J. 2010, 96, 50–57. [Google Scholar] [CrossRef]
  12. Rauret, G.; Lopez-Sanchez, J.F. Improvement of the BCR three step sequential extraction procedure prior to the certification of new sediment and soil reference materials. J. Environ. Monit. 1999, 1, 57–61. [Google Scholar] [CrossRef] [PubMed]
  13. Qiu, Y.W.; Yu, K.F. Accumulation of heavy metals in sediment of mangrove wetland from Hainan Island. J. Trop. Oceangraph. 2011, 30, 102–108. [Google Scholar]
  14. Gao, X.L.; Li, P.M. Concentration and fractionation of trace metals in surface sediments of intertidal Bohai Bay, China. Mar. Pollut. Bull 2012, 64, 1529–1536. [Google Scholar] [CrossRef] [PubMed]
  15. Zhang, W.G.; Feng, H.; Chang, J.N.; Qu, J.G. Heavy metal contamination in surface sediments of Yangtze River intertidal zone: An assessment from different indexes. Environ. Pollut. 2009, 157, 1533–1543. [Google Scholar] [CrossRef] [PubMed]
  16. Hyun, S.; Lee, C.H.; Lee, T.; Choi, J.W. Anthropogenic contributions to heavy metal distributions in the surface sediments of Masan Bay, Korea. Mar. Pollut. Bull. 2007, 54, 1059–1068. [Google Scholar] [CrossRef] [PubMed]
  17. Neser, G.; Kontas, A.; Ünsalan, D.; Uluturhan, E. Heavy metals contamination levels at the Coast of Aliaga (Turkey) ship recycling zone. Mar. Pollut. Bull. 2012, 64, 882–887. [Google Scholar] [CrossRef] [PubMed]
  18. Long, E.R.; Macdonald, D.D.; Smith, S.L.; Calder, F.D. Incidence of adverse biological effects within ranges of chemical concentrations in marine and estuarine sediments. Environ. Manag. 1995, 19, 81–97. [Google Scholar] [CrossRef]
  19. Cuong, D.T.; Obbard, J.P. Metal speciation in coastal marine sediments from Singapore using a modified BCR-sequential extraction procedure. Appl. Geochem. 2006, 21, 1335–1346. [Google Scholar] [CrossRef]
  20. Long, E.R.; MacDonald, D.D.; Severn, C.G.; Hong, C.B. Classifying the probabilities of acute toxicity in marine sediments with empirically-derived sediment quality guidelines. Environ. Toxicol. Chem. 2000, 19, 2598–2601. [Google Scholar] [CrossRef]
  21. Perin, G.; Craboledda, L.; Lucchese, M.; Cirillo, R.; Dotta, L.; Zanetta, M.L.; Oro, A.A. Heavy metal speciation in the sediments of northern Adriatic Sea. A new approach for environmental toxicity determination. In Heavy Metals in the Environment; CEP Consultants: Edinburgh, Scotland, 1985. [Google Scholar]
  22. Tam, N.F.Y.; Wong, Y.S. Spatial variation of heavy metals in surface sediments of Hong Kong mangrove swamps. Environ. Pollut. 2010, 110, 195–205. [Google Scholar] [CrossRef]

