Article

Assessing Regional Sustainability Using a Model of Coordinated Development Index: A Case Study of Mainland China

1
School of Management, Wuhan University of Technology, 205 Luoshi Road, Hongshan District, Wuhan 430070, China
2
Department of Built Environment, Eindhoven University of Technology, Den Dolech 2, VRT 8.08, Eindhoven 5612 AZ, The Netherlands
*
Author to whom correspondence should be addressed.
Sustainability 2014, 6(12), 9282-9304; https://0-doi-org.brum.beds.ac.uk/10.3390/su6129282
Submission received: 14 October 2014 / Revised: 9 December 2014 / Accepted: 9 December 2014 / Published: 15 December 2014

Abstract

:
From a holistic view, this paper addresses a perspective of coordinated development of economy, society, and environment for regional sustainability assessment. Firstly, a comprehensive indicator system for co-evaluating the level of economic, social, and environmental subsystems is presented based on a holistic understanding of regional sustainability. Then, a coordinated development index model focusing on the level of coordination among the subsystems as well as their comprehensive development level is established. Furthermore, an empirical study of all the provinces and municipalities is conducted by collecting the panel data from 2004 to 2010. The result shows that: (1) the coordinated developments of the most developed and the most underdeveloped regions stay stable while the regions with medium development level possess more fluctuant trends during the study years; (2) regional disparities are indicated according to the grading of CDI (the coordinated development index), which are further analyzed to be related to the local economic development patterns; (3) the conditions and causes of economic, social, and environmental development in real situations under different grades of CDI are discussed through detailed case studies of typical regions, which indicate specific suggestions of sustainable development for regions in the same pattern.

1. Introduction

In the traditional economic paradigm, rapid accumulation of physical, financial, and human capital is realized at the expense of excessive depletion and degradation of natural capital [1], especially in rapid-developing countries like China. At the end of 2013, eastern China was shrouded by intensive smog, caused by a severe bout of air pollution [2]. The social and environmental crises, such as polluted air, heavy metal waste, and huge income gaps, based on the consistent rapid economic growth over more than three decades can no longer be evaded. Sustainability-related issues, such as low-carbon, circular economy, and ecological civilization have been consistently addressed with increasing emphasis worldwide [1].
It is found that many regional unsustainable issues are caused by unequal development of the economy, society, and environment. For example, in metropoles like Beijing, the unsustainable issues of air-pollution and underdeveloped social security are caused by the unbalanced development of economic growths, social well-being, and environmental conservation; in the situation in many western regions in China is different, where the extensive economic development has destroyed the land resources and generated toxic pollutants, which have made the poor living conditions of local people even more difficult. Based on this, the term of coordinated development has been proposed for sustainability transition [3], i.e., that the economic, social, and environmental subsystems are organized in a synergistic way and that together they effectively develop and maximize the overall interests. Specifically, the aim of coordinated development is to realize the improvements of environmental quality and social well-being while on the economic side developing equitably, through practical measures of industrial restructuring, high-tech developing and industrializing, clean production, population control, resource use efficiency, and so on. Consequently, coordinated development and sustainability are related to each other as measures and desired goals. Unsustainable issues can be adjusted and controlled by coordinating the interactive subsystems.
The measurement of regional sustainability is always of great significance, since it is essential for governments to set targets and track progress. From the perspective of coordinated development, it is noted that the evaluation of regional sustainability should not only take in consideration the comprehensive levels of the subsystems, but also measure the coordination relationships of the subsystem developments. The sustainability assessment tools, such as sustainable development indicators and various composite indices, have been widely discussed. However, studies of sustainability assessment models that involve the interactions and relationships among the subsystems of sustainability are still in their primary stages.

2. Literature Review

The relationship between human society and the environment has been extensively studied since the early 1990s. Romer [4] and Lucas [5] introduced the factors of environment and pollution into the model of economic cycles in the endogenous theory, which discussed the conditions for coordinated development between the two systems. Norgaard [6] held the opinion that society and ecosystem could develop simultaneously through feedback and circulation based on his study of economic indicators of resource scarcity. To understand the dynamic complexity between economy and ecosystem, Grossman and Krueger [7] analyzed the panel data collected from many countries and then presented an evolution path which is known as Environmental Kuznets Curve. Holling [8], Rosser [9], and Costanza et al. [10] believed that the interactions between human activities and natural environment would be different at various evolutionary stages.
After 2000, various studies have focused on indicators and indices of sustainable development. International and regional organizations, such as the United Nations [11], the UN Habitat [12], the World Bank [13,14], and the European Commission on Science, Research, and Development [15], have composed a list of regional sustainability indicators, which have been used as references for many countries and communities to develop their own sustainable urbanization indicator systems. However, most of the sustainability indices, which are widely used in the sustainable development debate, only use the form of the arithmetic mean or geometric mean for the aggregation of sustainable development indicators, which mainly reflect the comprehensive levels of the subsystems but do not indicate the coordination relationship among them. In the field of the relationship between human society and the environment, numerous scholars [16,17,18] used the Environmental Kuznets Curve model to perform various empirical studies in different nations. Some scholars thought that the simple U-shaped type could not summarize the complex relationships between socioeconomic development and environment. It is necessary to find a more scientific method to perform such research [19].
A few researchers then developed coordination models to assess the reciprocal relationship between the economic or social subsystem and the environment. One of the early coordination models is the static and dynamic coupling coordination degree model, used to analyze the coupling status between two systems, for instance, urbanization and urban resource [20], urban population and environment [21], and so on. However, the calculation of the static and dynamic coordination degree is based on linear regression analysis between two subsystems, which is not consistent with the situation in the real world. The coupled human and natural systems (CHANS) has been found to feature several major characteristics, including reciprocal effects, nonlinearity, and legacy effects, in a research work about the complexity of coupled human and natural systems published in Science [22]. Another version of the coordination model is the coupling coordination model that borrows the concept of capacity coupling and the capacity coupling coefficient model from physics [23]. It has been widely used in studies of the non-linear relationship between the elements of two systems, for instance, urbanization and the environment [24,25]. However, based on the nature of capacity coupling, the means by which two oscillating electric circuits transfer energy [23], the coupling coordination model can only reflect to what extent one system influences another, but it cannot indicate whether the reciprocal effects are positive or negative, nor demonstrate the causality of the relationship. What is more, it is used to analyze the relationship between two systems, so there is a limit of the model to research the triangular framework of sustainability. Therefore, it is necessary to develop more in-depth studies of measuring regional sustainability from the perspective of coordination.
For that reason, the aim of this paper is to evaluate regional sustainability using a coordinated development index model that reflects the comprehensive situation of a region in both the coordination relationship among economic, social, environmental subsystems and the overall level of the subsystem developments. In addition, it is expected that the results obtained from the model evaluation will be consistent with real situations of regional sustainability and provide some useful suggestions. We take Mainland China as a case study because it is a large developing country, which faces extremely serious challenges of sustainability transition. The municipalities and provinces vary according to the natural conditions and socioeconomic development levels that are sufficient to verify the effectiveness of the evaluation model. In line with the study aim, several objectives are planned in this research work: (1) to establish the indicator system of coordinated development assessment model, using the panel data collected from 2004 to 2010 for municipalities and provinces of China; (2) to conduct an empirical study on the regional coordinated development in Mainland China and analyze the status and trends of coordinated development in different regions; and (3) to discuss the economic, social, and environmental conditions of different regions and their development patterns based on the evaluation results of coordinated development.

3. Material and Methods

For a complex system, the measurement should not only focus on the changes of each component separately, but also on the intensive interactions and correlations among them. Based on such theoretical interpretations, the appraisal index of coordinated development consists of two dimensions, coordination degree and development degree (Figure 1), which are generated by the three subsystems. At the bottom of the model, economic, societal, and environmental subsystems are measured by representative indicators (Figure 1).
Figure 1. The coordinated development model of regional sustainability assessment.
Sustainability 06 09282 g001

3.1. The Indicator System of Coordinated Development for Regional Sustainability in Mainland China

The indicator system of the coordinated development assessment model should cover the main interrelated economic, social, and environmental factors completely, and it should be able to be measured at the provincial level in Mainland China. Firstly, we conducted a preliminary determination of the framework of the indicator system that indicates the structure of each subsystem and the main interactions among them. The structure of the environmental subsystem is constructed in accordance with the conceptualization of Goodland [26], who asserts that environmental sustainability is related to human welfare by the two aspects of the sources of raw materials and the sinks for human wastes. The determination of the aspects and factors of social and economic subsystems depends on a comprehensive consideration of the sustainability references from international organizations and the Chinese government. The indicator systems of the United Nations [11], the World Bank [13], and so on provide principles and reference contents of the economic and social sustainability, while the China’s Sustainable Development Strategy Report [27] confines the crucial aspects that should be focused on currently according to the national conditions. The final indicator system framework for regional sustainability, as devised by the authors, is shown in Figure 2, which shows the measured attributes of each subsystem.
Based on the framework, we then inspected the China statistical Yearbook [28], the China Environment Yearbook [29], and the China Energy Yearbook [30] to select appropriate indicators for the measurement of each subsystem and to confirm the availability of provincial data. We also selected some relevant indicators from previously conducted studies. Then the selected indicators were further filtered through comparison of the correlation coefficients between any two indicators and significance levels. Finally, the indicators were selected such that they (1) were measurable, valid, and comparable, (2) stayed independent with each other, and (3) could be associated with practices and policies of sustainable development in China. The final indicator system is shown in Table 1.
Figure 2. The framework of the indicator system of regional sustainability in China.
Sustainability 06 09282 g002
Table 1. The indicator system of coordinated development for regional sustainability in Mainland China.
SubsystemAspectIndicatorUnits
EnvironmentSourcesx1. Per-capita water resourcem3
x2. Per-capita arable land areahm2
x3. Forest coverage %
Sinksx4. PM10mg/stere
x5. Proportion of sandy land to national total area%
x6. Ratio of industrial solid waste utilized %
x7. Waste gas removal rate%
x8. Proportion of industrial waste water meeting discharge standards in total volume%
SocietyDemographicsx9. Number of people per hectarepeople/hectare
x10. Ratio of urban population with access %
Quality of lifex11. Engel coefficient%
x12. Number of beds in health care institutions per 10,000 peoplebeds/10,000 people
x13. Number of public transportation vehicles per 10,000 capitavehicles/10,000 people
x14. People with college degrees per 10,000 inhabitantsper 10,000 people
x15. Ratio between the income of urban households and the income of rural housholds%
EconomyEconomic developmentx16. Gross domestic product (GDP) per capitaYuan
x17. Proportion of tertiary Industry in GDP%
x18. Urban unemployed rate%
x19. Proportion of Expenditure on R&D in GDP%
Green economyx20. Energy Consumption per 10,000 yuan of GDPtce/10,000 yuan
In the indicator system, x4-PM10 is the density of atmosphere particulate matter with diameter of 10 micrometers or less that is used to indicate the air quality of a city or a province in this study, the x6-Ratio of industrial solid waste utilized is the ratio between the industrial solid waste utilized and the industrial solid waste generated, the x7-Waste gas removal rate is the ratio between the removal waste gas and the industrial waste gas generated, the x8-Proportion of industrial waste water meeting discharge standards in total volume is the ratio between the volume of discharged waste water that meets the national standard of waste water ingredient and the volume of discharged waste water, the x11-Engel coefficient is the proportion of income spent on food.

3.2. Data Normalization

In this study, the panel data was normalized by a pair of piecewise linear functions as shown in Equations (1) and (2). Therefore, the raw data was normalized to be interval-scaled within [0.01, 1].
In the case that the highest score is the preferred score, the raw scores xij of indicator i for observation j, are normalized in the equation:
x i j ' = { x i j min { x i } x ¯ i min { x i } × 0.59 + 0.01 if   min { x i } x i j x ¯ i x i j x ¯ i max { x i } x ¯ i × 0.4 + 0.6 if   x ¯ i < x i j max { x i }
where xij′ is the normalized value of xij, i = 1,2,…, 20, j = 1, 2, …, v, v is the number of observations, x ¯ i is the national average value of indicator i of all years that is used to represent the moderate level of all the observations, max{xi} and min{xi} are the maximum and minimum values of indicator i among all observations.
In the case that the lowest score is the preferred score, the raw scores xij are normalized in the equation:
x i j ' = { x ¯ i x i j x ¯ i min { x i } × 0.4 + 0.6 i f   min { x i } < x i j x ¯ i max { x i } x i j max { x i } x ¯ i × 0.59 + 0.01 i f   x ¯ i x i j max { x i }

3.3. Evaluation of the Subsystems

Firstly, we analyzed the weight of each indicator using the entropy method [24], where we refer to Shannon’s entropy, namely a measure of uncertainty regarding the source of information. By calculating the information entropy and variations in the indicators, the entropy redundancy of each indicator was estimated. Then we obtained the indicator weights. The steps of calculating the subsystem scores are explained as follows (Equations (3)–(11)):
The proportion of indicator i for observation j:
y i j = x i j ' / j = 1 v x i j '
Information entropy of indicator i:
e i = 1 ln v j = 1 v y i j × ln y i j ( 0 e i 1 )
Entropy redundancy:
d i = 1 e i
Weight of indicator i in the subsystem—“environment”:
w i , 1 = d i / i = 1 8 d i
Weight of indicator i in the subsystem—“society”:
w i , 2 = d i / i = 9 15 d i
Weight of indicator i in the subsystem—“economy”:
w i , 3 = d i / i = 16 20 d i
Ebert and Welsch [31] derived feasible aggregation procedures for variables depending on the measurement scales. According to the research, for the interval-scaled variables aggregation based on an arithmetic mean, it is possible to achieve a continuous, strongly monotone, and separable index. For that reason, we chose the arithmetic mean for the aggregation of the indicators.
Comprehensive level of subsystem—“environment” is calculated by the Equation (9):
s 1 = i = 1 8 w i , 1 · x i j '
Comprehensive level of subsystem—“society” is calculated by the Equation (10):
s 2 = i = 9 15 w i , 2 · x i j '
Comprehensive level of subsystem—“economy” is calculated by the Equation (11):
s 3 = i = 16 20 w i , 3 · x i j '

3.4. The Coordination Development Index Model (CDI)

In this paper, we propose an adjusted model of the coupling coordination degree, where we developed a coordination degree to take the place of the coupling degree. The adjusted model is the coordinated development index as shown in Equations (12)–(18).

3.4.1. The Coordination Degree

In real situations, the uncoordinated development of economy, society, and environment is usually indicated by the inequality among the three subsystems’ developments. The performance of the inequality is revealed by various concurrent crises: air pollution, water-shortage, flood, social inequality, poverty, which are increasingly serious while the economics grows rapidly [1]. Therefore, the inequality is the crucial aspect that should be measured when we assess the coordination relationship among the developments of environment, society, and economy.
Based on this, the coordination degree measures the average difference between any two subsystems and considers the differences as a phenomenon of being discordant. The value 1 represents the state of being absolutely coordinated. Hence, the coordination degree is the difference between one and the extent of discordance.
r = 1 k , l = 1 m | s k s l | m × ( m 1 ) / 2
where r represents the coordination degree, sk and sl represent any two different subsystems, respectively, and k , l [ 1 , m ] , k l , m is the number of subsystems.

3.4.2. The Development Degree

The development degree is the aggregation of subsystems, which indicate the comprehensive development level. The weight of each subsystem is calculated as follows:
Weight of the indicator i in the whole system:
w i = d i / i = 1 20 d i
Weight of the subsystem—“environment”:
w s 1 = i = 1 8 w i
Weight of the subsystem—“society”:
w s 2 = i = 9 15 w i
Weight of the subsystem—“economy”:
w s 3 = i = 16 20 w i
Because the subsystem variables are also interval-scaled, the form of aggregation of the subsystems is the arithmetic mean, too. The development degree is calculated using the following equation:
D = w s 1 · s 1 + w s 2 · s 2 + w s 3 · s 3
where D represents the development degree which reflects the comprehensive level of economic, social, and environmental subsystems.
Based on the coordination degree and the development degree, we can calculate the coordinated development index [24].
Z = r · D
where Z is the coordinated development index.

4. Assessment of Regional Sustainability in Mainland China

In China, the municipalities and the provinces own equal administrative status. They are directly controlled by the central authority of the country, for which in the national statistical process, municipalities and provinces are investigated as observations at the same level. We collected the panel data from 2004 to 2010 for all the provincial regions in China, including four municipalities and 27 provinces. In other words, there are 217 observations in the quantitative analysis. Meanwhile, we also collected the data from 2004 to 2010 for the country as a whole and calculated the national average value of each indicator of the seven years, which represents a moderate level of the indicator for the overall regions of all years. Societal and economic data were obtained from the China Statistical Yearbook [28], Environment-related data were obtained from the China Environment Yearbook [29], Energy-related data were collected from the China Energy Yearbook [30].
Data normalization was performed using Equations (1) and (2). Then the scores of the subsystems of each region in each year were obtained using Equations (3)–(7). Based on these scores, we calculated the coordination degree and development degree for each region in each year. The weights of indicators and subsystems are shown in Table 2. By aggregating the coordination degree and the development degree, the value of coordinated development index of each region in each year was obtained. Then we calculated the average value of the coordinated development degree of each region from 2004 to 2010 for the analysis of spatial variation of sustainability in Mainland China. The weights of indicators and subsystems are shown in Table 2.
Table 2. The weights of the subsystems and the indicators of the indicator system.
SubsystemWeight of subsystemIndicatorWeight of Indicator
Environment0.435x1. Per-capita water resource0.309
x2. Per-capita arable land area0.123
x3. Forest coverage 0.196
x4. PM100.040
x5. Proportion of sandy land to national total area0.081
x6. Ratio of Industrial solid waste utilized 0.107
x7. Waste gas removal rate0.062
x8. Proportion of industrial waste water meeting discharge standards in total volume 0.082
Society0.248x9. Number of people per hectare0.101
x10. Ratio of urban population with access 0.122
x11. Engel coefficient0.122
x12. Number of beds in health care institutions per 10,000 people0.251
x13. Number of public transportation vehicles per 10,000 capita0.189
x14. People with college degrees per 10,000 inhabitants0.098
x15. Ratio between the income of urban households and the income of rural households0.117
Economy0.316x16. Gross domestic product (GDP) per capita0.186
x17. Proportion of tertiary Industry in GDP0.136
x18. Urban unemployed rate0.024
x19. Proportion of Expenditure on R&D in GDP0.604
x20. Energy Consumption per 10,000 yuan of GDP0.050

5. Results and Discussion

5.1. Results of the Coordinated Development Index from 2004 to 2010

Overall, the coordinated development levels and trends in Mainland China vary according to different provincial regions and years. We analyzed the values of the coordinated development index for the municipalities and provinces in the following three stages:
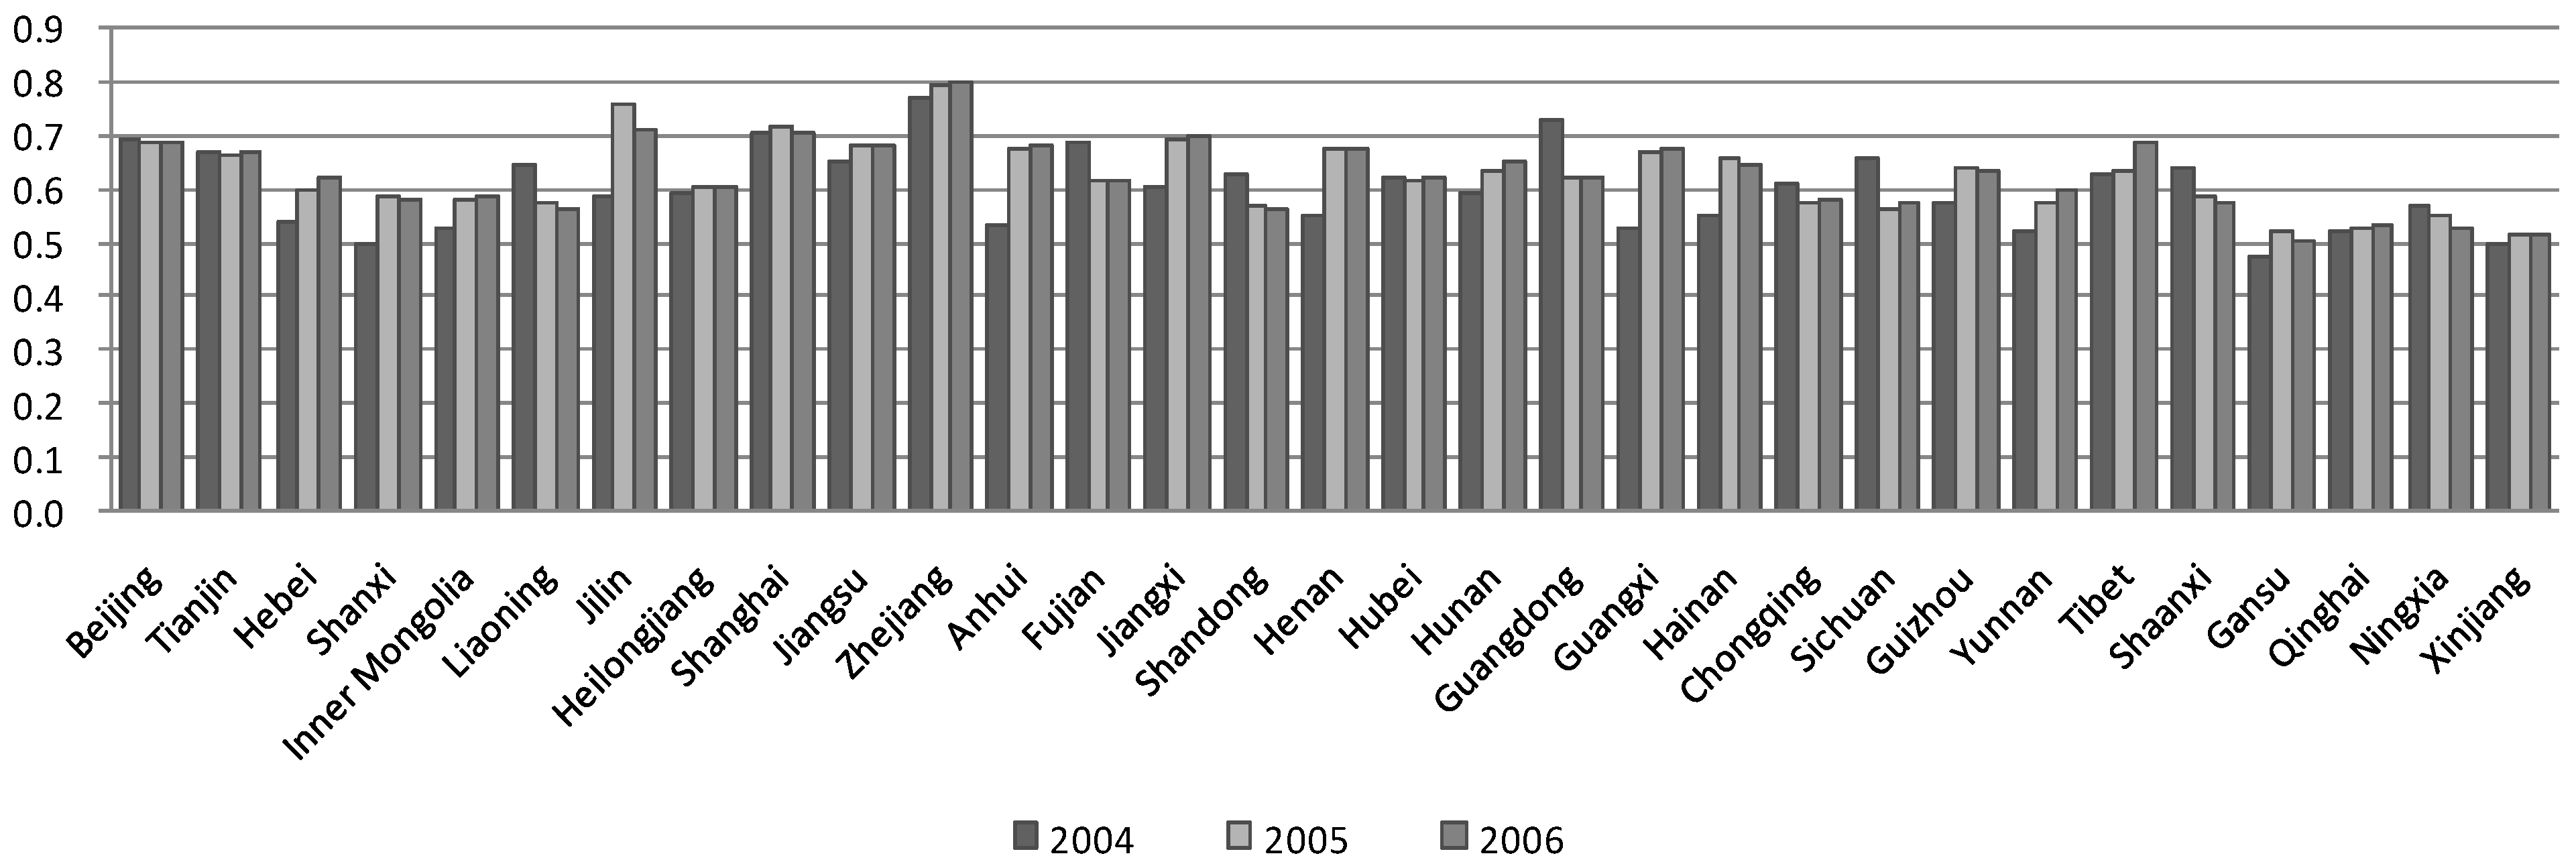
(1) 2004–2006: as shown in Figure 3, in general, the coordinated development of the relatively developed northern and eastern coastal regions from Beijing to Zhejiang and the underdeveloped western regions of Gansu, Qinghai, Ningxia, and Xinjiang were more stable than the coordinated development in the other areas of China. The coordinated development index increased in the southern regions of Yunnan, Guangxi, Hainan, however, there were also a few regions, such as Fujian, Guangdong, Sichuan, Ningxia, that regressed in the coordinated development.
Figure 3. The results of the coordinated development index from 2004 to 2006.
Sustainability 06 09282 g003
The regional disparities shown in the scores of coordinated development index are consistent with the development of those municipalities and provinces in the real world by and large, which mainly reflect the driving effects of economic growth. The coastal areas including the neighboring province in the Northeast developed more than other areas. In the early 1980s, Special Economic Zones covering the whole Chinese coast were created to attract overseas investment by exempting them from taxes and regulations. Since then, the coastal areas began to play a leading role in the country’s economic reform program, and the economic growth of these regions has been extremely rapid. During the period from 2004 to 2010, these coastal areas acquired more robust economics than other regions. In addition, they had better natural environments than most other areas in China. Therefore, the coordinated development of these regions has been ahead of the rest of the country.
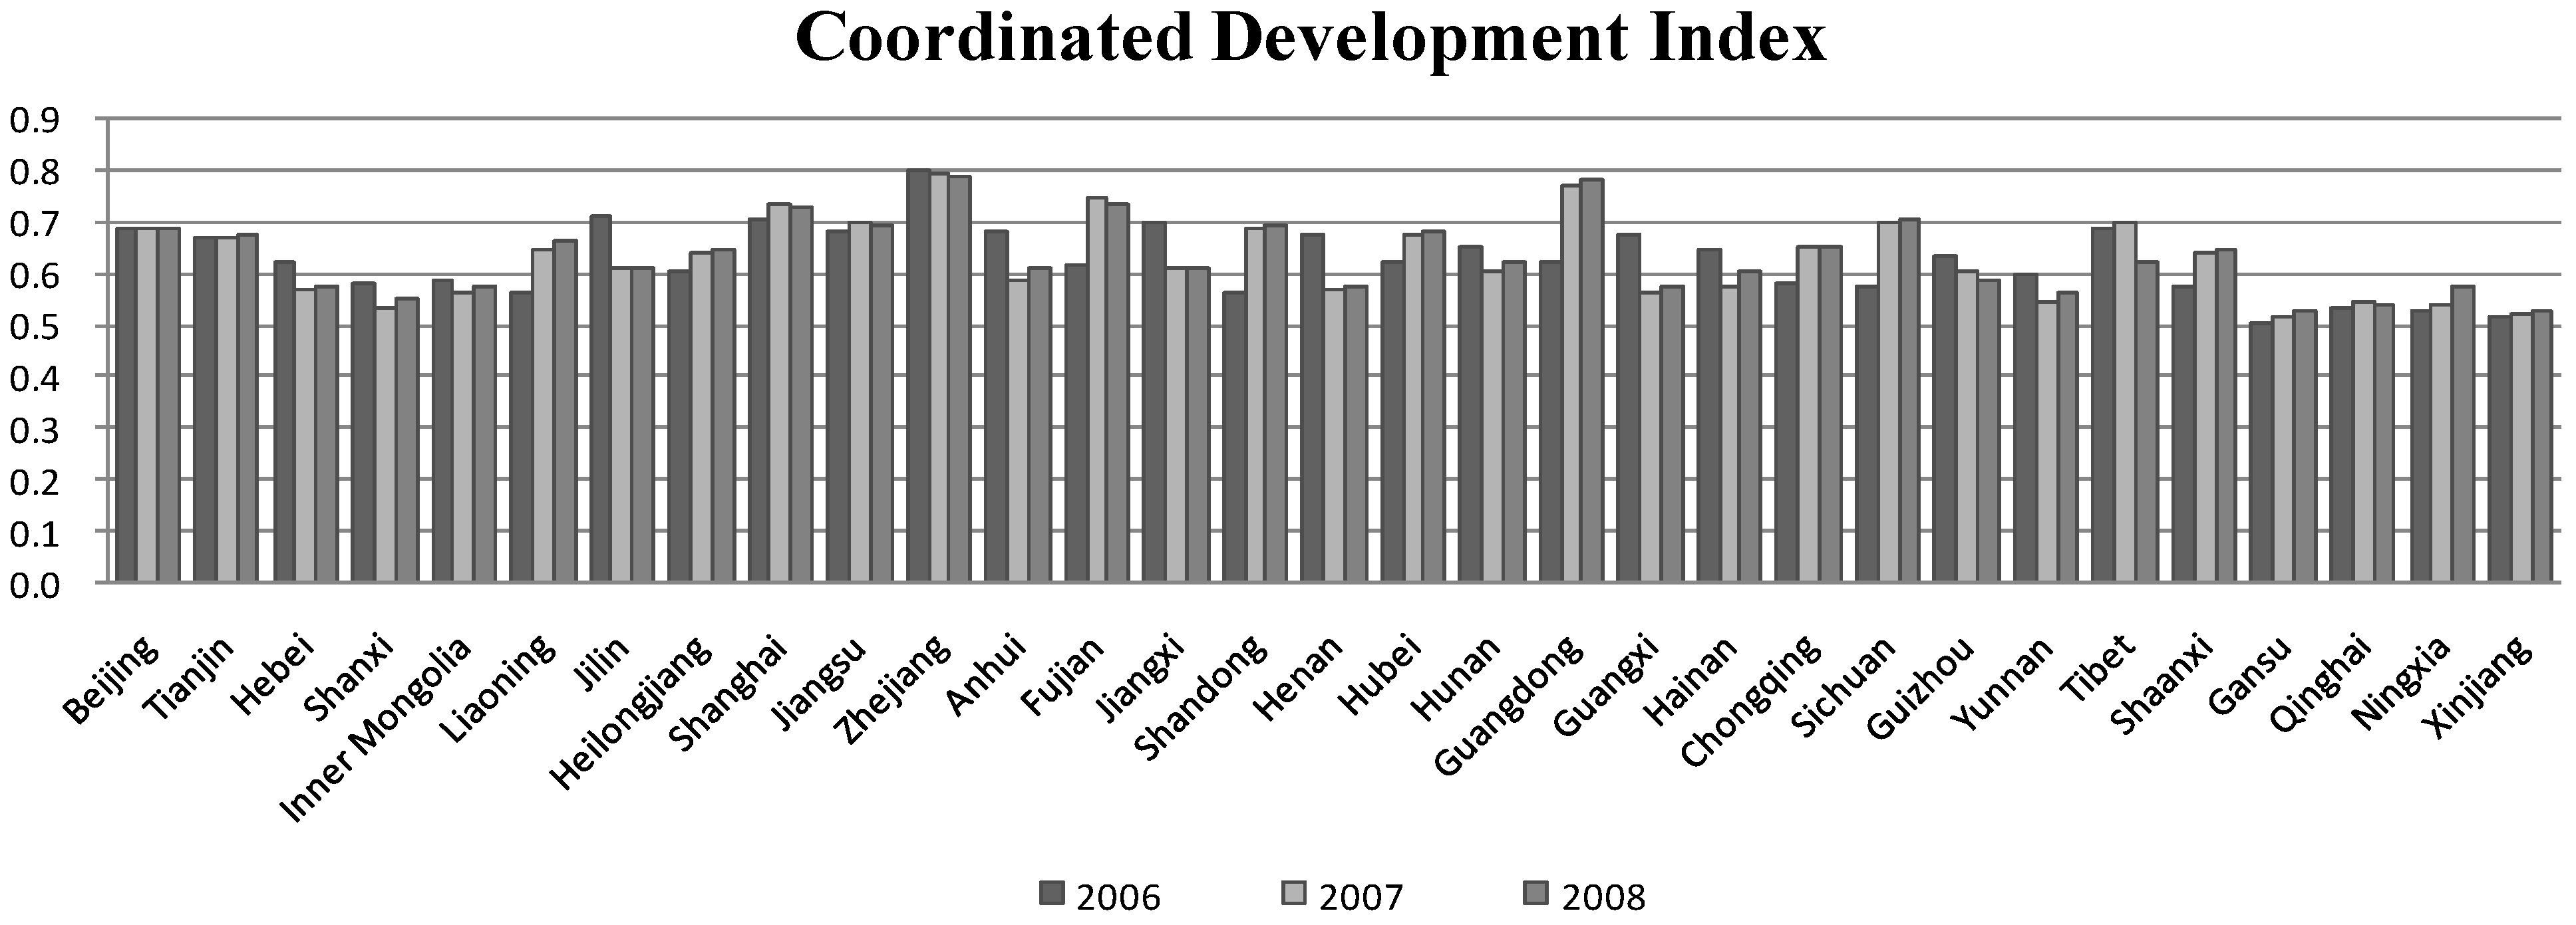
(2) 2006–2008 (Figure 4): the developed eastern regions of Beijing, Tianjin, Zhejiang and the underdeveloped western regions of Gansu, Qinghai, and Xinjiang still seemed to be stable in their coordinated development levels. However, the southern regions of Fujian, Guangdong, Sichuan, and Ningxia showed a growth of coordinated development. What is more, the coordinated development in regions such as Yunnan, Guangxi, and Hainan that had increased from 2004 to 2006 started to decrease. In general, from 2006–2008, there were a lot of regions such as Liaoning, Shanghai, Hubei, and Sichuan that showed a better performance than before.
Figure 4. The results of the coordinated development index from 2006 to 2008.
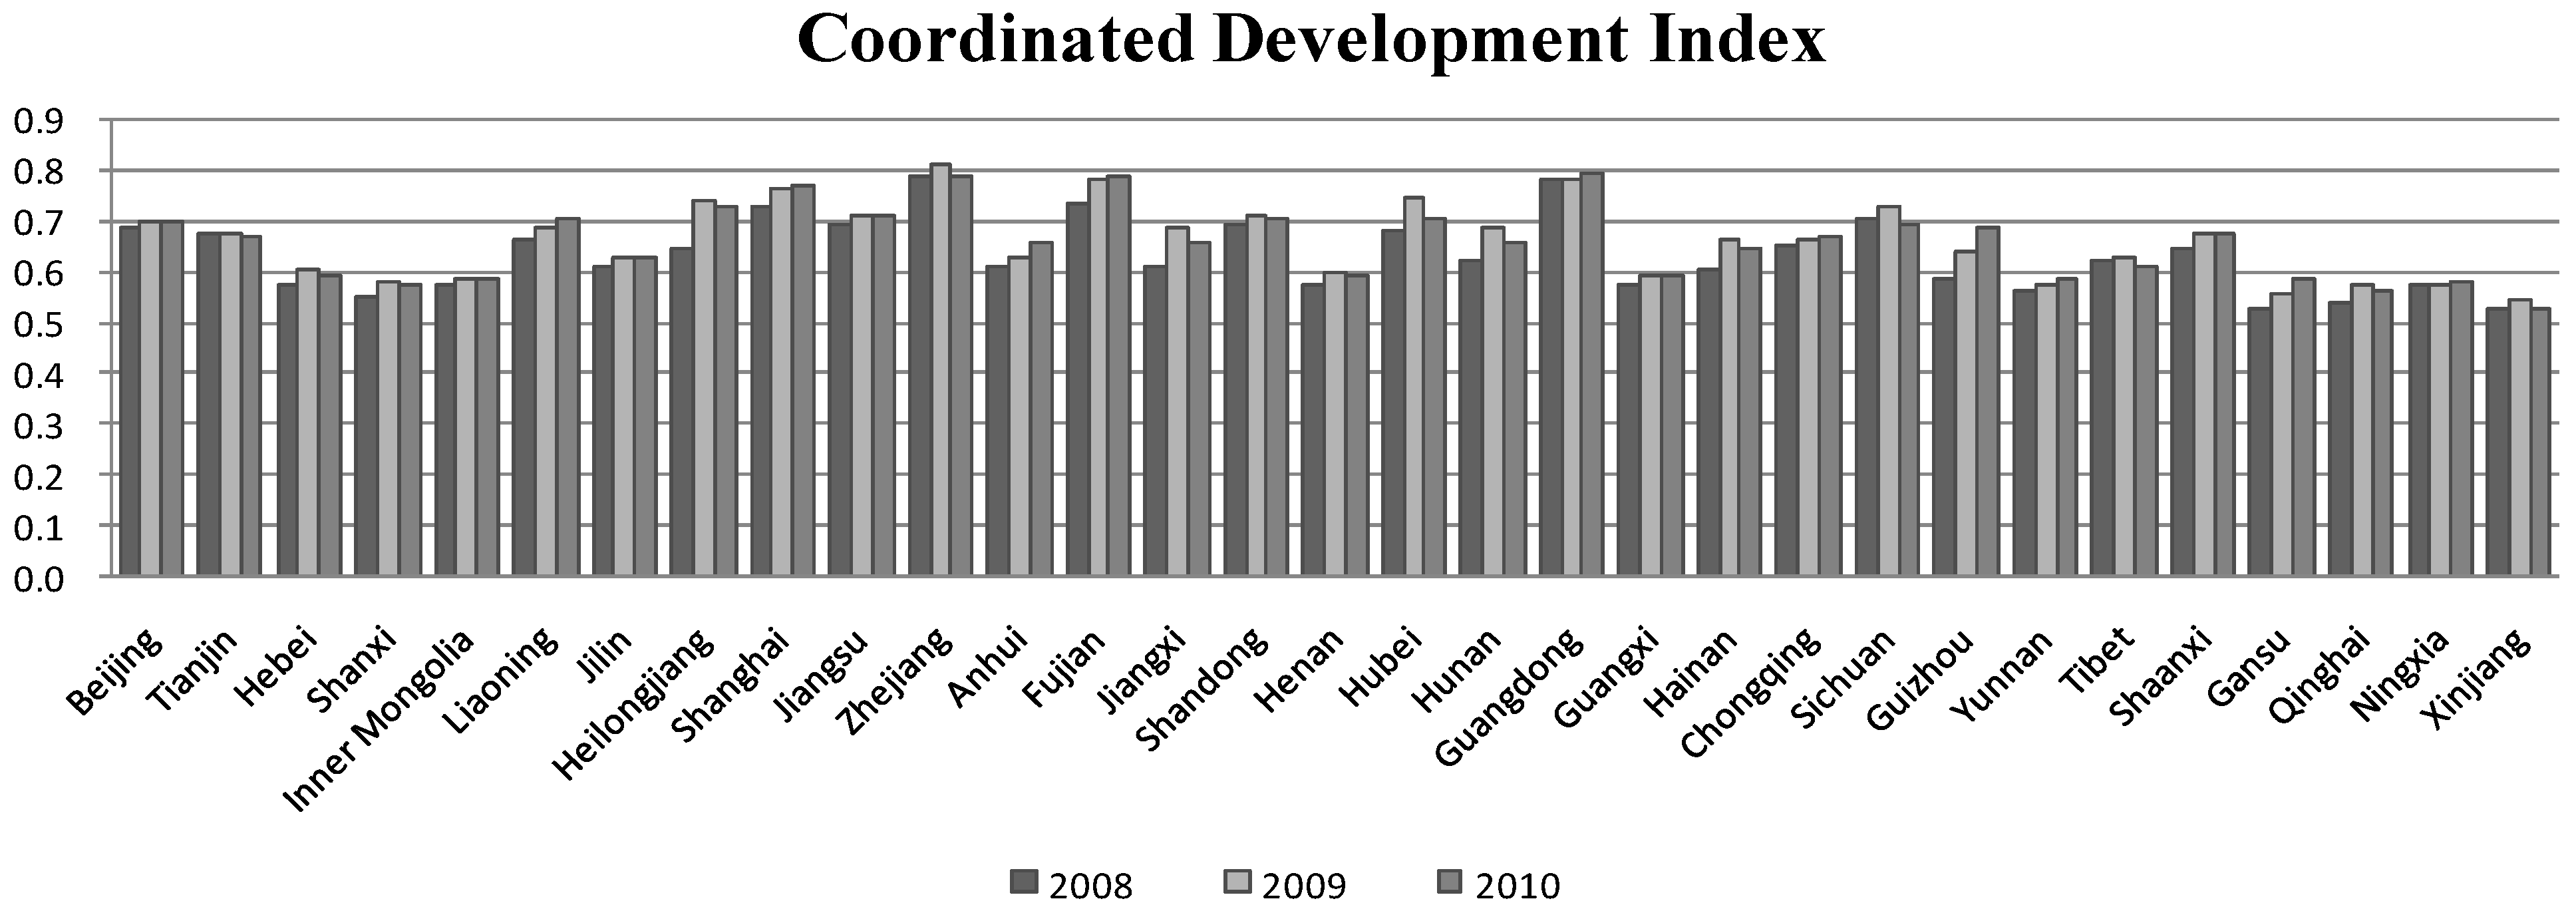
Sustainability 06 09282 g004
(3) 2008–2010 (Figure 5): the trends of the coordinated development are greatly improved compared to the other two stages. Only a few regions showed an obvious decrease in their coordinated development index, instead, most of them showed an increase or stayed stable at a certain level. In general, the northeast and the southeast coast of China including as Liaoning, Heilongjiang, Zhejiang, Fujian, and Guangdong were more developed in the coordinated development than Mainland China.
Figure 5. The results of the coordinated development index from 2009 to 2010.
Sustainability 06 09282 g005
In conclusion, the trends of coordinated development for provincial regions improved from 2004 to 2010. The North and the West of China were more stable in the development of economy, society, and environment, while other regions presented fluctuations, but finally came back to a positive trend of growth. This shows that the coordinated development levels in Mainland China vary according to the geographic characteristics. For that reason, in the next section, we continue to analyze the regional disparities of the coordinated development in Mainland China.

5.2. Regional Disparities of the Coordinated Development in Mainland China

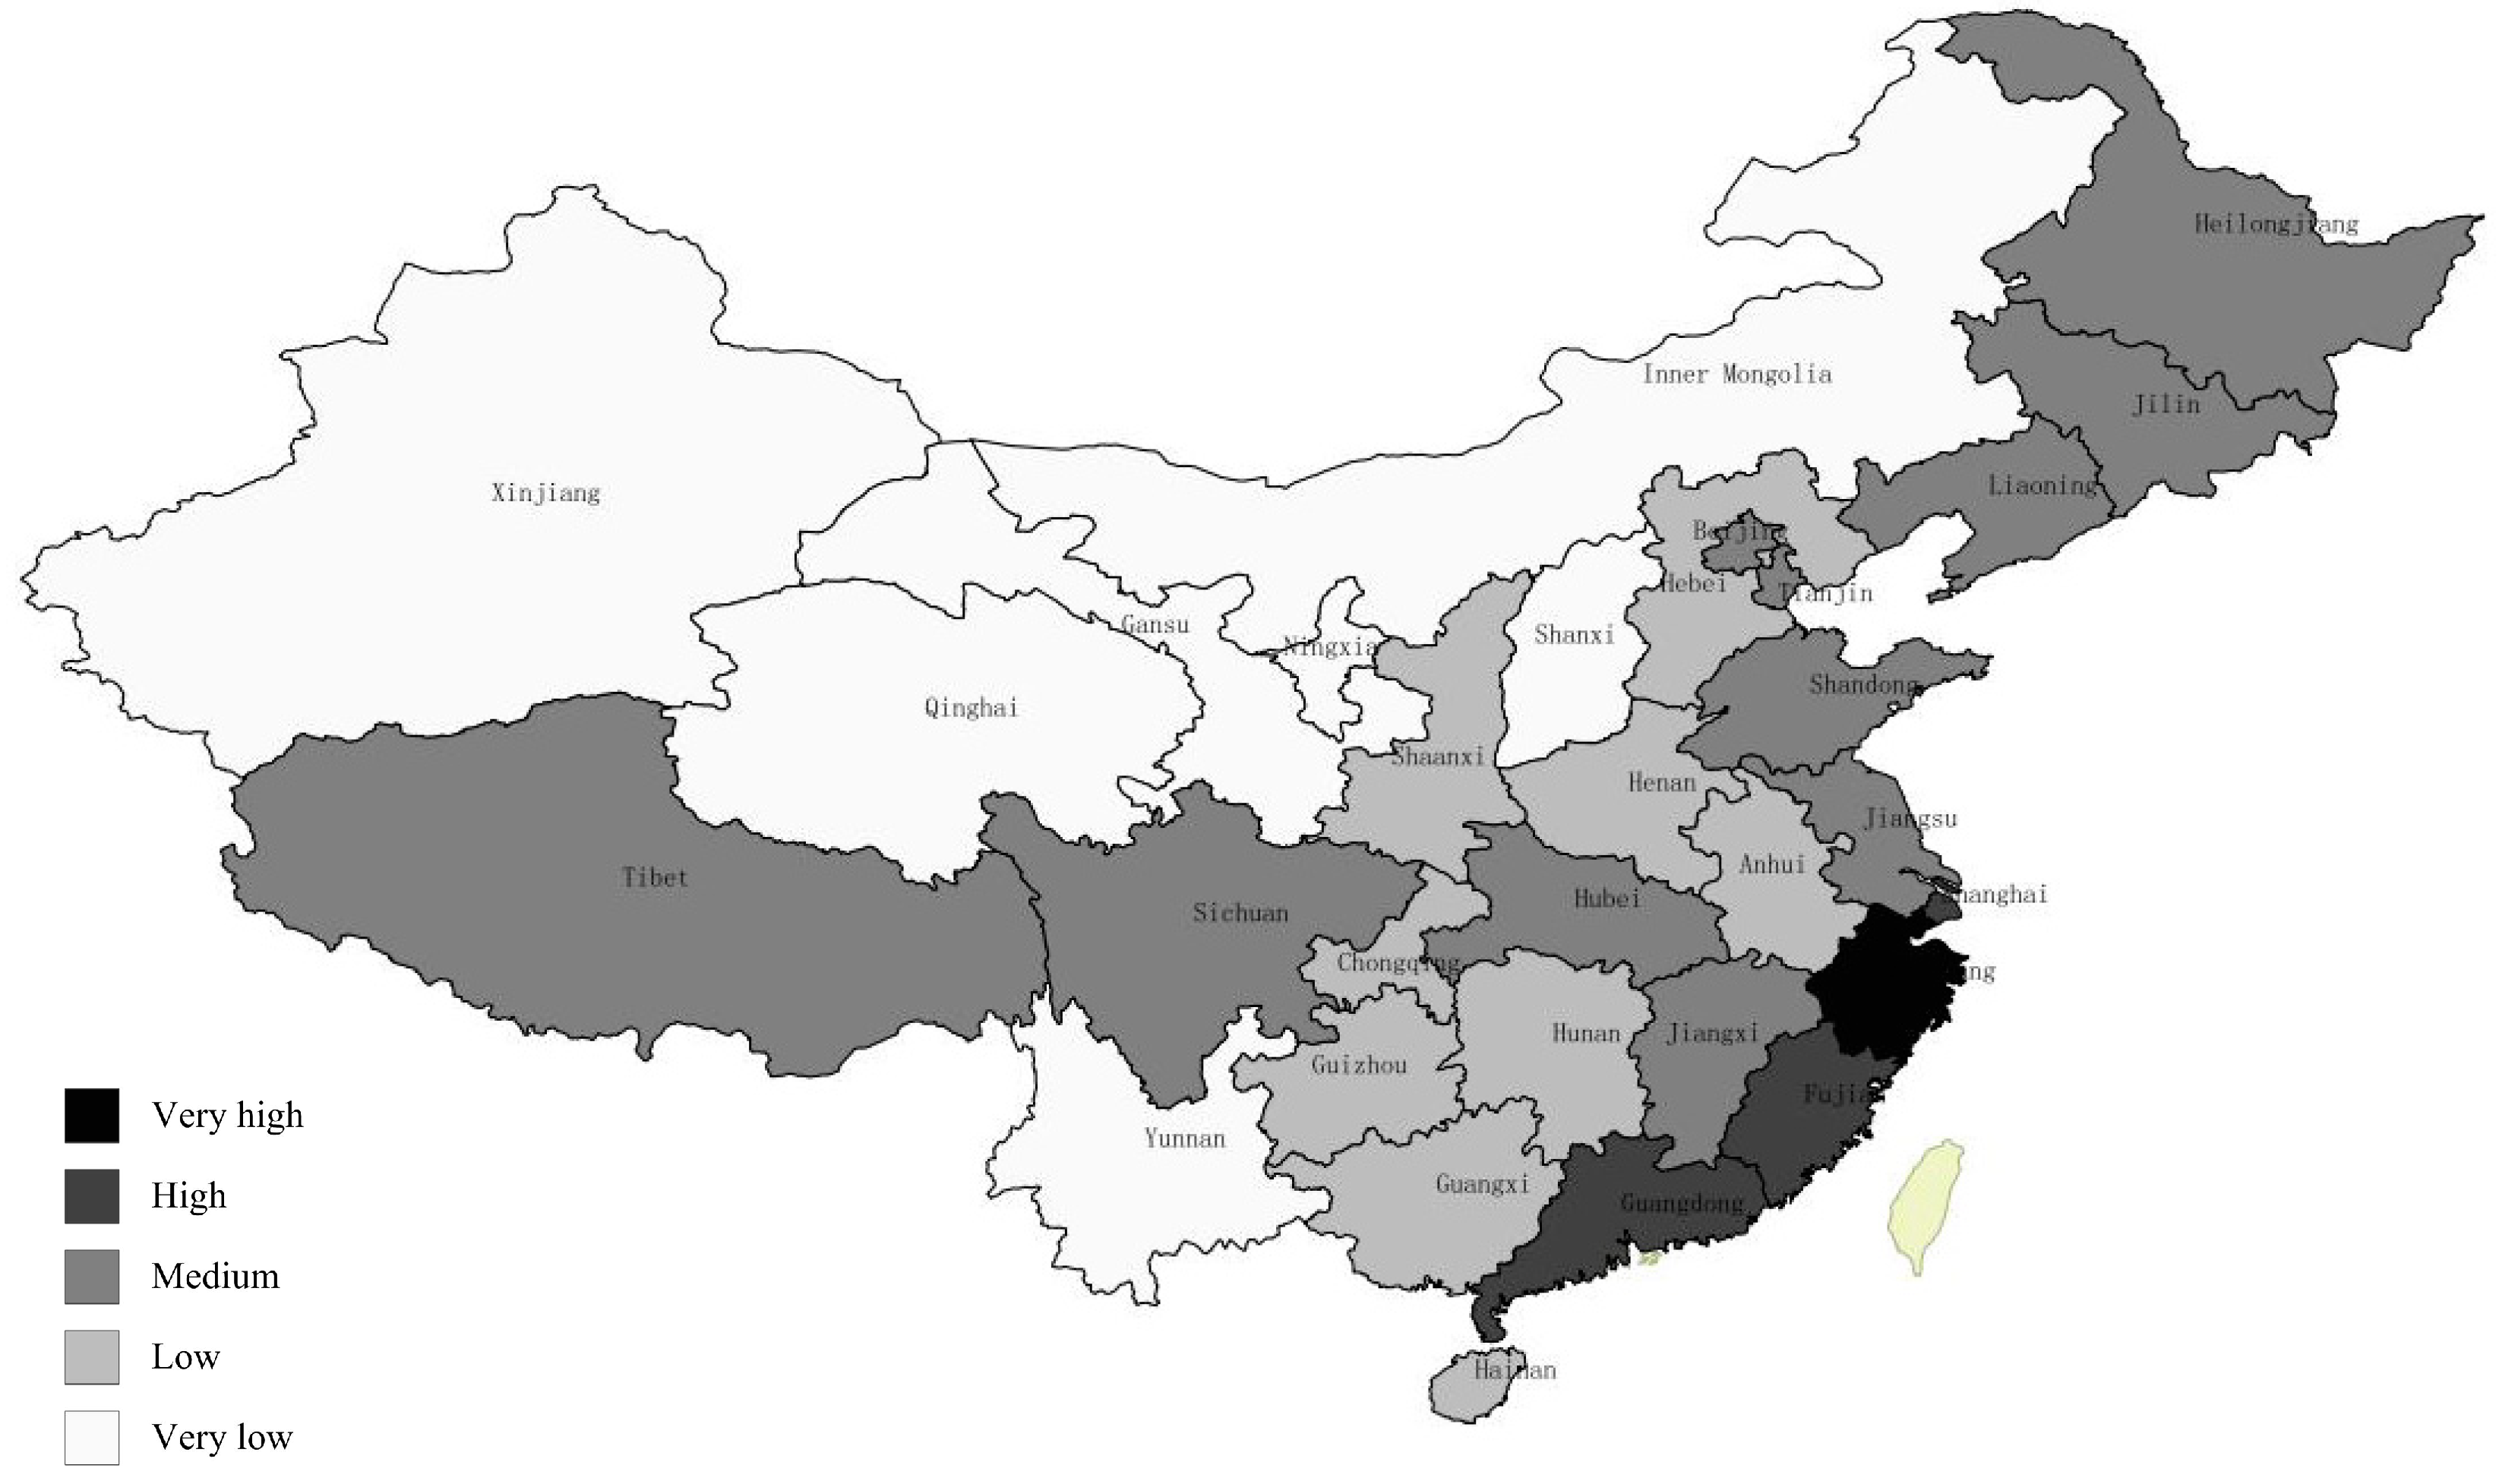
Figure 6 presents a map in which Mainland China has been classified into five zones according to the grading of CDI as “very high”, “high”, “medium”, “low”, and “very low”. The intervals of these grades are determined by equally dividing the gaps between the minimum and the maximum values of CDI among all the regions into five sections. Therefore, these grades indicate relative levels of the degrees, rather than absolute values. The maps are useful for identifying areas that have similar levels of these degrees.
As shown in the map, regions of “very high” and “high” grades of CDI are mostly located on the south coast, except for Beijing on the northern coast, according to the economic division of China. The economic growth in the coastal areas has been extremely rapid since special economic zones had been established across the whole coastal area of China in 1980 to attract overseas investment. Nowadays, economic growth based on the knowledge of economy and high technology industries has given these areas greater potential to become sustainable compared to other regions in China.
Regions of “Medium” CDI are mainly found from the north-eastern provinces to the northern coast of China and from the middle and lower reaches of the Yangtze River to the south-western provinces. In the study years from 2004 to 2010, the north-eastern coastal areas had a more robust economy than the south-eastern coastal areas of China. However, the resources of water, cultivated land, and forest on the northern coast were relatively scarce compared to the south-eastern coast for which the development degree of Jiangsu and Tianjin lagged behind and influenced the coordinated development levels. Besides, the provinces in northeast China, the middle reach of the Yangtze River, and south-western China had similar economic developmental patterns and small gaps among their economic development levels. The economic developments in those regions mainly depended on the stable investments in heavy industries from the central government according to the national development strategies. It was more like a planned economy for which the economic growths in these regions had been very slow. From the perspective of sustainability, another negative influence of such a economic pattern was that the profits was realized by depleting the nonrenewable resources such as mineral ore and fossil fuel, which was unsustainable and seriously contaminated the environment.
Figure 6. Assessment map of coordinated development index (CDI) in Mainland China.
Sustainability 06 09282 g006
Regions of “Low” and “Very low” CDI mostly occur in the north and the far west of China, such as Inner Mongolia, Gansu, Ningxia, Xinjiang, Yunnan, and so on. To discuss the development of these provinces during 2004 to 2010, these regions show a huge diversity of natural resources. The environmental scores for them were very high, however, compared with the poor economic and social scores. As a result, the values of coordination degree for these regions were very low, as were their values of the development degree. The industrialization and urbanization in these provinces were still at the primary stages.
In general, there are obvious impacts of the economic driving force on the coordinated development of regional sustainability. We can see that the characteristics of the economical development mode vary according to the CDI level.

5.3. Discussion about the Regional Sustainability in Mainland China Based on the Level of CDI

By calculating the values of CDI of different provincial regions in Mainland China, we have evaluated the coordinated development levels of different regions and primarily analyzed the regional disparities among them. The validity and rationality of the evaluation results of CDI should be further examined according to the real situations. Therefore, we wanted to understand the stories and reasons behind the evaluated results, for which a more detailed discussion should be initiated. In this section, we discuss the economic, social, and environmental development of the typical provincial regions of “high”, “medium”, and “low” grade of CDI, respectively, in order to analyze the existing different development scenarios of regional sustainability in Mainland China.

5.3.1. The Municipality of “High” Grade of CDI, Shanghai

The eastern coastal regions like Zhejiang, Jiangsu, and Shanghai performed very well in the assessment of regional sustainability by CDI. In the first discussion, we choose Shanghai, a famous metropolitan city of China to analyze the social and economic development, and the environment quality.
Shanghai (latitude 30°23′N–31°27′N and longitude 120°52′E–121°45′E) is one of the national central cities of China, located on the Yangtze River Delta in Eastern China and serving as one of the major trading ports and gateways to inland China. In the 1990s, the People’s Republic of China (PRC) government opened the Pudong New Area in Shanghai to overseas investment. Since then, Shanghai has begun to play a leading role in the nation’s reform and opening movement. From 1978–2000, Shanghai’s GDP achieved a 6.5 times increase with an annual growth rate of 9.5%. Nowadays, promoting the adjustment of industrial structure and the industrialization of new and high technologies has become the new engine driving Shanghai’s economic development (Table 3).
Table 3. Selected economic and societal indicators of Shanghai and the national average of 30 provincial regions, 2004–2010.
GDP per capitaProportion of gross output value of high-tech industry in GDP (%)Number of Collage Student in each 10,000 peopleDays of air quality up to the national standard of China in a whole year
ShanghaiNational AverageShanghaiNational AverageShanghaiNational Average ShanghaiNational Average
200455,3071407943.7511.5239112311294
200551,4741620342.6611.2249129322305
200657,6951866243.1511.6257142324307
200766,3672197346.2011.7261151328314
200873,1242578043.0810.9266160328318
200978,9892873736.9410.3272169334321
201076,0743342740.2010.7224170
Source: Collected and calculated by the authors based on the NBSC (2005–2011).
Highly developed economics have been supporting the rapid improvement of social well-being, especially for indicators such medical care and education that are steadily increasing. There is a wide range of medical supplies available locally. Meanwhile, Shanghai has one of the best education systems in China. It is a major center of higher education in China with over 30 universities and colleges.
Further, the environmental conditions in Shanghai are superior to those in other areas due to its developed tertiary industry. Air pollution in Shanghai is relatively low, compared with other Chinese cities, but influenced by other neighboring provinces it still shows insufficient environmental conservation. In 2013, affected by the eastern China smog, Shanghai suffered a dense wave of smog, and the levels of PM 2.5 particulate matter rose above 600 micrograms per cubic meter.
For those relatively developed regions of sustainability, although they have accumulated sufficient physical and human resources which are driving a rapid socioeconomic development, the further transition to a sustainable development requires a deep reform of the traditional economic pattern and the development of technologies that can coordinate the relationship between human activities and the ecological environment.

5.3.2. The municipality of “Medium” Grade of CDI, Beijing

It was found that a lot of developed regions in China only achieved relatively low values of coordination degree. The most typical one is Beijing, the capital city and one of the most industrialized regions of China.
Beijing (latitude 39°56′N and longitude 116°20′E), located at the northern tip of the roughly triangular North China Plain, is the capital of the country and a world-renowned city of history and culture. It is one of few cities in the world that have served as the political headquarters and cultural center of the country for much of the past eight centuries. After the establishment of the People’s Republic of China, the development of Beijing’s economy experienced a tough and transformative process from the economic strategy that mainly relies on heavy industries to the new industrial system of capital economy that depends on producer service industry, culture industry, high-tech industry, and modern manufacturing industry. Now, the scale of tertiary industry of Beijing ranks the first in mainland China. Beijing has completed its development process of industrialization and stepped into the post-industrial stage where the service sector has become the leading part in the economic paradigm and technical innovation serves as the main driver for its economic growth. From the perspective of quality of life, the income of citizens in Beijing has risen to a relatively high level and people begin to pursue life styles of high quality. The Engel's coefficient of Beijing’s urban residents reached 32.1% in 2010, declining by 5.1 percentage points compared to 2008 (Table 4).
Table 4. Economic and societal indicators of Beijing and the national average of 30 provincial regions, 2004–2010.
Engel’s coefficient of urban householdsProportion of tertiary industry in GDPAverage urban income per capita (RMB/capita)Proportion of gross output value of high-tech industry in GDP (%)
BeijingNational AverageBeijingNational AverageBeijingNational AverageBeijingNational Average
200432.1838.26037.517,116989735.9511.5
200531.8337.36940.419,53311,00430.9911.2
200630.7636.57140.022,41712,27333.8011.6
200732.1837.27239.824,57614,16834.0711.7
200833.7938.97339.027,67816,15128.1610.9
200933.1837.57641.630,67417,86422.6910.3
201032.0736.77540.433,36019,88821.2010.7
Source: Collected and calculated by the authors based on the NBSC (2005–2011).
However, Beijing is again a new focus of attention due to its terrible smog. The pollution blanketing northern China is an extraordinary and unnatural phenomenon, which is possibly caused by (1) industrial pollution (Table 5), a recent study on Beijing’s smog found that industrial pollution was the biggest source of the PM 2.5 problems. The heavily industrialized neighboring provinces also contributed to the air pollution in Beijing; (2) vehicle emissions, more than five million vehicles are currently registered in Beijing, and the number keeps climbing; (3) regional pollution, the Tianjin and Hebei provinces both have a large number of cement, steel, oil refining, and petrification industries and in fact when serious smog appears in Beijing, the nearby cities like Tianjin can also hardly escape from a heavy haze weather. It requires persistent efforts of all parties of the government, citizens, and neighboring provinces to combat air pollution.
The unbalanced situation usually occurs in the metropoles that have been on their way to industrialization for several decades when rapid accumulation of physical, financial, and human capital is acquired by excessive depletion and degradation of natural capital. The investments in the development of industries with low pollution and low energy density are very urgent.
Table 5. Beijing environmental indicators and industrial waste treatment and the ranking of 30 municipalities and provinces, 2004–2010.
Days of air quality up to the national standard of China in the whole year (days)Proportion of waste gas (SO2, Soot, Dust) removed in total waste generated (%)Proportion of Industrial waste water meeting discharge standards in total volume (%)Ratio of industrial solid waste utilized(%)
ValueRankingValueRankingValueRankingValueRanking
20042292793.63.098.61273.79
20052343196.11.099.43267.914
20062413094.51.099.29274.69
20072463197.01.097.42574.811
20082742897.21.098.26566.415
20092852896.61.098.41568.917
2010 96.72.098.76265.817
Source: Collected and calculated by the authors based on the NBSC (2005–2011).

5.3.3. The Municipality of “Very Low” Grade of CDI, Gansu

Gansu ranks among the bottom positions both in the ranking lists of the coordination degree and the development degree. It shows that the developments of environment, society, and economy are unbalanced and remain at poor levels.
Gansu is located in the upper reaches of the Yellow River, northwestern China. As the land possesses nearly 3000 deposits of 145 kinds of minerals, five of which are the largest reserves in China, and considerable reserves of coal, Gansu’s economy heavily relies on the energy sector with intensive exploration and exploitation of the natural resources, especially minerals and coal. Pillar industries of Gansu include non-ferrous metals, electricity power, and petrochemicals.
In 2000, the West China Development Program (WCDP) was launched to stimulate the economic growth in western areas. Gansu was involved because of the abundant reserves of coal. Before the WCDP, from 1996 to 1999, the region’s GDP per capita grew at a slow 8.6%. However, after the WCDP, the region’s GDP per capita grew at a rate of 13.87% from 2000 to 2006, higher than the national average. Accompanied with the booming of heavy industries, the environment deterioration has been put on the verge of a breakdown. Industrial waste is an important source for the pollution issues. In addition, the pollution brought by heavy metals of the non-ferrous metal industry in Gansu, such as cadmium in irrigation water, has resulted in poisoning of many acres of agricultural land. Meanwhile, the region has fallen behind other regions in waste treatment, indicated by the rate of industrial waste water meeting discharge standards, and sulfur dioxide removal rate (Table 6). In addition, Gansu is the major disaster area in China that has suffered serious droughts in recent years. Concerning its climate conditions, the annual amount of rainfall in Gansu changes dramatically, distributed unevenly among seasons. Meanwhile, the artificial factors such as groundwater overexploitation and arable land overcultivation that cause desertification, drought, and ecological deterioration can never be overlooked.
On behalf of Gansu, the west provinces have always shown to be relatively backward both in the coordination and development of the three subsystems, because the majority of their populations are poor and their livelihoods are mainly linked with exploiting fragile environments and ecosystems. The economic development in such regions must be extensive, socially inclusive, and pay more attention to reducing the environmental risks, because the life of local people is extremely vulnerable to the loss of natural capital.
Table 6. Gansu industrial waste treatment and the ranking of 30 provincial regions, 2004–2010.
Proportion of waste gas (SO2, Soot, Dust) removed in total waste generated (%)Proportion of Industrial waste water meeting discharge standards in total volume (%)Ratio of industrial solid waste utilized
ValueRankingValueRankingValueRanking
200482.62273.202632.626
200586.21973.232529.427
200684.82279.082427.130
200787.92380.962536.129
200890.42458.952934.129
200991.02481.072733.430
201091.32583.322646.329
Source: Collected and calculated by the authors based on the NBSC (2005–2011).

5.4. Discussion about the Coordinated Development Index and the Existing Model of Coupling Coordination Degree

The existing model: Coupling Coordination Degree Model (CCDM)

Coupling that firstly originated from physics is a phenomenon in which two or more systems influence each other through various interactions. The coupling coordination degree model proposed by Li et al. [24] was designed to reveal the dynamic trends in the development of the coupling of rapid urbanization and the environment.
C = { s 1 s 2 [ s 1 + s 2 2 ] 2 } K , T = α s 1 + β s 2 a n d Z = C T
where C represents the degree of coupling, K is the regulation factor (K ≥ 2), s1 and s2 are the subsystems, for example, urbanization subsystem and environment subsystem, T reflects the overall effect and level of subsystems and Z is the degree of coupling coordination, α and β represent the contribution of subsystems, respectively.
Since the evaluation models of coordinated development mainly differ in the methods of measuring the coordinative inter-relationships between two subsystems, it is essential to compare the coordination-related elements instead of the whole models. Therefore, we pick up the degree of coupling of CCDM and the coordination degree of CDI to apply in the simulation experiment. The steps of this experiment are shown in Figure 7. The simulation processeses were realized in Matlab R2012b.
Figure 7. The simulation process of the coupling degree and the coordination degree.
Sustainability 06 09282 g007
We set variables that represent the subsystems and the calculated result of the model, C—the coupling degree, and r—the coordination degree. The score of each subsystem starts from 0 and ends with 1. The program of simulation is set to traverse all combinations of the scores of different subsystems in repeated calculations of the degree of coupling and the coordination degree. After each calculation, there will be a dot in the coordinate system of the simulation graph. Finally, we get the distribution graph of the outcomes in a coordinate system for each model.
The simulation graphs of the two coordination evaluation methods are shown in Figure 8 and Figure 9.
In the simulation graph of the degree of coupling, we found that the calculation results distributed from 0 to 1, which appeared, however, uneven. As the values are too intensive within the higher range, the lower values of coordinated degree can hardly be acquired with the same possibility as higher values can. As a result, the shortage of the model inside will hinder it objectively reflecting the level of coordination between two subsystems. However, in the simulation graph of the coordination degree, the calculation results also fall in the interval of (0, 1), covering the whole area. The distribution of the outcomes of the coordination degree is more even and complete than the degree of coupling so as to provide more objective evaluation results for consultation in coordinated development among economy, society, and environment.
Figure 8. Simulation graph of the degree of coupling.
Sustainability 06 09282 g008
Figure 9. Simulation graph of the coordination degree.
Sustainability 06 09282 g009
Therefore, the model of coordinated development index constituted by coordination degree can perform better than the coupling coordination degree model in the evaluation of regional sustainability.

6. Conclusions

From a holistic view, this paper addressed a model of coordinated development index, modified from the coupling coordination degree for regional sustainability assessment in Mainland China. The model gives equal footing to the synergic relationships among the subsystems of economy, society, and environment with the comprehensive development level. It filled in the gap of a comprehensive measuring tool for regional sustainability that considered the reciprocal effects among the three subsystems environment, society, and environment.
The validity of the model was examined based on a case study of Mainland China. The results of the coordinated development assessment were discussed and explained with the economic, social, and environmental development of different regions in real situations. Although the specific indicators of different countries may need to be selected independently according to the data availability, the well-established indicator system framework and common indicators can be helpful for the regional sustainability assessment using CDI in other nations.
The comparative study between the degree of coupling of CCDM and the coordination degree of CDI has shown that the distribution of outcomes of the coordination degree calculated by all possible input values is more even than the one of the degree of coupling. The distribution of outcomes of the degree of coupling is much more intensive within the higher value range. For that reason, we believe that the value of CDI can indicate the level of coordinated development in a wider range, while the CCDM tends to represent output high values.
Using the panel data from 2004 to 2010 in Mainland China, this paper has shown that the regions of “very high” grade of CDI, located in the eastern coastal provinces, have finished the industrial upgrading and have absorbed a huge amount of investment that has brought them great potentials for the sustainability transition; the regions of “medium” grade of CDI have the problem that the rapid industrialization has been realized at the cost of excessive depletion and degradation of natural capital, while the industrialization and urbanization has produced serious pollution to the urban environment, so more investments in industries with low pollution and low energy density are required for the sustainability transition in future; the regions that are classified in the “very low” grade of CDI, show very poor living conditions and the livelihoods are mainly linked with exploiting fragile environments and ecosystems, for which they need a more socially inclusive economy to improve their life and reduce the environmental risks.
Based on the results and discussion in this study, we highlight policies that stimulate public and private investment in development of low-carbon, resource efficient, socially inclusive innovation and technologies to drive sustainability. The pathway of coordinated development will vary considerably among nations, as it depends on the specifics of each region’s natural and human capital and on its relative level of development. However, first of all, for all of them, enabling conditions including policies and incentives will be required. Any strategy to increase economic growth should consider the impact on the environment. It is believed that government policies play a critical role within economics to encourage innovation in clean and energy-efficient technologies, which is a very important drive for sustainable development. In addition, the public policies concerning the livelihoods of the rural poor are also significant for a harmonious status of human community.
Although we used the composite index to evaluate the performance of coordinated development, there were still some crucial characteristics we did not include in the evaluation process. For example, there are feedback loops in the driving effects of economic development. We cannot expect the social and environmental subsystems to improve as soon as the green economy starts growing. Hence, there is a delay for the coordinated development index to reflect the progress in sustainable development. Another limitation is regarding the coordination mechanism. From a perspective of system coordination, if we want to further assess the efficiency of coordination among the economy, society, and environment, a system approach, for example system dynamics, should be considered. For further research, we plan to analyze the mechanism of interactions among the subsystems and the measures to optimize the performance of coordinated development. Usually, the target can only be achieved by a set of policies; in that case, we will have to find out how they are linked with one another, which we plan to achieve with simulation studies.

Acknowledgments

This work was supported in part by the NSFC under Grant No. 91024020 and by the Humanities and Social Science Research Fund of Ministry of Education of P.R. China under Grant No. 11YJC840038, and under Grant No. 14YJA840010.

Author Contributions

The first author, Qing Yang, proposed the original method of the coordinated development index model and designed the main steps of the research. The second author (corresponding author), Yang Ding, designed the indicator system and conducted the empirical analysis of Mainland China by collecting the panel data, and wrote the paper. The third and the fourth authors, Bauke de Vries and Qi Han, supervised the whole process of writing the paper and helped the writer refine the research results and discussions. The fifth author, Huimin Ma, designed the comparative study between the existing model and the new model and supervised the writer to conduct the simulation.

Conflicts of Interest

The authors declare no conflict of interest.

References

  1. United Nations Environment Programme (UNEP). Towards a Green Economy: Pathways to Sustainability Development and Poverty Eradication; UNEP: Nairobi, Kenya, 2011. [Google Scholar]
  2. Liu, C. Smog levels in china reach record levels since the end of 2013; surrounding areas severely polluted. China News Agency, 4 December 2013. (In Chinese) [Google Scholar]
  3. Zeng, Z. The analysis of coordination and sus tainable development. Syst. Eng. Theory Pract. 2001, 3, 18–21. (In Chinese) [Google Scholar]
  4. Romer, P.M. Endogenous technological change. J. Polit. Econ. 1990, 98, S71–S102. [Google Scholar] [CrossRef]
  5. Robert, E.; Lucas, J. On the mechanics of economic development. J. Monet. Econ. 1988, 22, 3–42. [Google Scholar]
  6. Norgaard, R.B. Economic indicators of resource scarcity: A critical essay. J. Environ. Econ. Manag. 1990, 19, 19–25. [Google Scholar] [CrossRef]
  7. Grossman, G.M.; Krueger, A.B. Economic growth and the environment. Q. J. Econ. 1995, 110, 353–377. [Google Scholar] [CrossRef]
  8. Holling, C.S. Cross-scale morphology, geometry, and dynamics of ecosystems. Ecol. Soc. Am. 1992, 62, 447–502. [Google Scholar]
  9. Barkley, J.; Rosser, J. Systemic crises in hierarchical ecological economies. Land Econ. 1995, 71, 163–172. [Google Scholar]
  10. Costanza, R.; Wainger, L.; Folke, C.; Mäler, K.-G. Modeling complex ecological economic systems. Am. Instit. Biol. Sci. 1993, 43, 545–555. [Google Scholar]
  11. United Nations. Indicators of Sustainable Development: Guidelines and Methodologies; United Nations: New York, NY, USA, 2007. [Google Scholar]
  12. Unitied Nations. Urban Indicator Guidelines; United Nations: New York, NY, USA, 2004. [Google Scholar]
  13. The World Bank. World Development Indicators 2013; The World Bank: Washington, DC, USA, 2013. [Google Scholar]
  14. The World Bank. World Development Indicators 2014; The World Bank: Washington, DC, USA, 2014. [Google Scholar]
  15. European Commission. European Common Indicators-Towards a Local Sustainability Profile; European Commission: Milano, Italy, 2003. [Google Scholar]
  16. Copeland, B.R.; Taylor, M.S. Trade, growth, and the environment. J. Econ. Lit. 2004, 42, 7–71. [Google Scholar] [CrossRef]
  17. Dinda, S. Environmental kuznets curve hypothesis: A survey. Ecol. Econ. 2004, 49, 431–455. [Google Scholar] [CrossRef] [Green Version]
  18. Li, Y.; Xu, Z.; Wang, Y. Study on environmental kuznets curve. China Popul. Resour. Environ. 2005, 15, 7–14. (In Chinese) [Google Scholar]
  19. Xue, B.; Zhang, Z.L.; Guo, X.J.; Chen, X.P.; Gen, Y. A study on the coupling relationships between regional economic growth and environmental pressure: Case of ningxia autonomous region. Ecol. Environ. Sci. 2010, 19, 1125–1131. [Google Scholar]
  20. Wang, Z.; Shi, C.; Li, Q.; Wang, G. Coupling trending analysis about urbanization and urban resource in Beijing. Energy Procedia 2011, 5, 1589–1596. [Google Scholar]
  21. Zhang, P.; Su, F.; Li, H.; Sang, Q. Coordination degree of urban population, economy, space, and environment in Shenyang since 1990. China Popul. Resour. Environ. 2008, 18, 115–119. [Google Scholar]
  22. Liu, J.; Dietz, T.; Carpenter, S.R.; Alberti, M.; Folke, C.; Moran, E.; Pell, A.N.; Deadman, P.; Kratz, T.; et al. Complexity of coupled human and natural systems. Science 2007, 317, 1513–1516. [Google Scholar]
  23. Cullerne, J.P. The Penguin Dictionary of Physics Illingworth, 5th ed.; Penguin Books: London, UK, 2001. [Google Scholar]
  24. Li, Y.; Li, Y.; Zhou, Y.; Shi, Y.; Zhu, X. Investigation of a coupling model of coordination between urbanization and the environment. J. Environ. Manag. 2012, 98, 127–133. [Google Scholar]
  25. Wu, W.; Niu, S. Evolutional analysis of coupling between population and resource-environment in china. Procedia Environ. Sci. 2012, 12, 793–801. [Google Scholar] [CrossRef]
  26. Goodland, R. The concept of environmental sustainability. Ann. Rev. Ecol. Syst. 1995, 26, 1–24. [Google Scholar] [CrossRef]
  27. Sustainable Development Strategy Study Group Chinese Academy of Sciences. China Sustainable Development Strategy Report 2012; Science Press: Beijing, China, 2012. (In Chinese) [Google Scholar]
  28. Department of Comprehensive Statistics of National Bureau of Statistics of China. China Statistical Yearbook 2005–2011; China Statistics Press: Beijing, China, 2005–2011. [Google Scholar]
  29. China Environment Yearbook Editorial Board. China Environment Yearbook 2005–2011; China Statistics Press: Beijing, China, 2005–2011. [Google Scholar]
  30. China Energy Yearbook Editorial Board. China Energy Yearbook 2005–2011; Science Press: Beijing, China, 2005–2011. [Google Scholar]
  31. Ebert, U.; Welsch, H. Meaningful environmental indices: A social choice approach. J. Environ. Econ. Manag. 2004, 47, 270–283. [Google Scholar] [CrossRef]

