Article

Seasonal Imbalances in Natural Gas Imports in Major Northeast Asian Countries: Variations, Reasons, Outlooks and Countermeasures

1
School of Business Administration, China University of Petroleum (Beijing), Beijing 102249, China
2
School of Management, Yangtze University, Jingzhou 434023, China
*
Author to whom correspondence should be addressed.
Sustainability 2015, 7(2), 1690-1711; https://0-doi-org.brum.beds.ac.uk/10.3390/su7021690
Submission received: 22 October 2014 / Revised: 26 January 2015 / Accepted: 2 February 2015 / Published: 5 February 2015

Abstract

:
The seasonal imbalances and price premiums of natural gas imports (NGIs) seriously affect the sustainability of these imports in major Northeast Asian countries, namely, China, Japan, and South Korea. Research on NGI seasonality might provide new insights that may help solve these issues. Unfortunately, little research has been conducted on this topic. Therefore, this paper examined the seasonalities of Chinese, Japanese, and South Korean NGIs using the X-12-ARIMA model to analyze monthly and quarterly data. The results suggest that Chinese NGIs lacks identifiable monthly or quarterly seasonality, while South Korea and Japan exhibit clearly identifiable seasonality. In Japan, NGIs exceed their average levels in January, February, July, August, September, and December; that is, Japan imports more natural gas during the winter and summer. In South Korea, NGIs exceed their average levels in January, February, March and December. In other words, South Korea typically imports more natural gas during the winter. The seasonal differences in NGIs among these countries might be explained by differences in natural gas consumption characteristics, domestic natural gas production capacity, NGI capacity, price sensitivity, and means of transportation. Based on seasonal differences and their probable causes, some suggestions are provided to promote the sustainable development of NGI.

1. Introduction

Demand for natural gas has increased significantly in Northeast Asia as a replacement for less environmentally friendly and less efficient fuels [1,2]. Due to the region’s limited production capacity, however, increasing amounts of natural gas have been imported from counties such as Qatar, Indonesia, Malaysia, Russia, and Australia. The major natural gas importers in Northeast Asia are China, Japan, and South Korea. Over the period 2008 to 2013, the NGIs (natural gas imports) of these three countries increased by 66.9 percent, 5.5 percent, and 8.8 percent annually, respectively, and reaching 51.9 billion cubic meters (bcm), 119 bcm, and 54.2 bcm, respectively. Together, these countries account for approximately 89 percent of total gas imports in Northeast Asia [3]. Japan and South Korea are reliant on LNG (liquefied natural gas) imports to meet their natural gas demand and are consequently the largest and second largest LNG importers in the world. China became the third largest LNG importer after surpassing Spain in 2013.
As NGIs have increased, these countries have encountered two problems. The first is seasonal imbalances in NGIs. There is a large gap in NGI demand depending on the season, leading to either a shortage (in which demand exceeds supply) or an excess supply of gas. The second is a high premium on LNG prices. Because the international LNG market is regionally fragmented, significant price differences exist among the major basins. As depicted in Figure 1, prices in Northeast Asia have been considerably higher than those in North America or Europe have been since 2010 [4]. The reason why the Chinese, Japanese, South Korean, English and German LNG prices went up after 2010 is that Japan had to increase LNG import after the Fukushima incident to substitute the decreased electricity supply after shutting down all its nuclear power plants in 2011, which led to tight natural gas supply in the international market. However, the American and Canadian LNG prices continued to decrease, which is caused by the US shale gas revolution.
Figure 1. Liquefied natural gas (LNG) prices in seven countries [3,5,6].
Sustainability 07 01690 g001
Seasonality reflects the monthly or quarterly environmental differences in a variable due to factors, such as climate variations, agricultural arrangements, or social traditions [7]. Seasonality is predictable due to its recurring one-year pattern; therefore, it is possible for importers to manage the effects of NGI seasonality. Based on seasonal characteristics, importers can respond flexibly, create reasonable policies, and cooperate to obtain optimal NGI regulations, which would lower costs and ensure continuity.
To date, little attention has been paid to energy seasonality. Sailor and Munoz [8] assessed the sensitivity of electricity and natural gas consumption to climate at regional scales in the USA. Mitchell et al. [9] analyzed the seasonalties of Australian petrol price behavior and the relationship between petrol prices and holidays, mood of consumers, and weather conditions. Wang and Wu [10] used X-12-ARIMA method to analyze seasonal fluctuation of Brent crude oil price and its movement discipline, in order to provide decision support for China’s oil import. Wang et al. [11] conducted a likely research on seasonal fluctuation of Dubai crude oil price and its movement discipline. Both found that seasonal factors have a significant impact on crude oil price. Filippin and Larsen [12] proved the existence of seasonality of residential natural gas consumption in Argentina, with a maximum value in the cold period July to August. Zhou and Dong [7] examined the potential seasonality of China’s monthly and quarterly crude oil import respectively based on X-12-ARIMA, finding that the seasonal factors tend to be positive in spring and summer quarters while negative in fall and winter quarters. Obviously, the above literature on seasonality has concentrated on the oil sector, including the seasonality of oil prices and oil imports. The seasonality of NGIs has received less academic attention and existing research is marked by a lack of systematic analysis. To the best of our knowledge, no study has yet examined on NGI seasonality in China, Japan, and South Korea. Thus, we analyze the seasonal characteristics of NGI in China, Japan, and South Korea using the X-12-ARIMA model, which is among the most widely used methods of seasonal adjustment.
The seasonality of NGI mainly stems from the seasonality of natural gas consumption, which results from climate factors and energy use policy, as reported elsewhere (e.g., Zhou and Dong [7], Moosa [13], Sailor and Muioz [8], Wang and Wu [10], Wang et al. [11], Filippín and Larsen [12]). The seasonality of NGI is also affected by domestic natural gas production capacity, NGI capacity, price sensitivity, and means of transportation. As the temperature drops in winter, the demand for natural gas for heating increases in China, Japan, and South Korea; In China, natural gas is not used to supplement the peak power demand in summer and winter; In Japan, natural gas power supplements the peak load during both summer and winter, and the government supports the installation of gas air conditioning systems especially in summer; In South Korea, natural gas power is mainly used to supplement the peak power demand in winter. In general, in China and South Korea, natural gas used in winter may be higher than other seasons, and in Japan, natural gas consumption in both winter and summer is much higher. However, unlike Japan and South Korea, China has much higher domestic natural gas production capacity, lower NGI capacity, lower price sensitivity, and more imports by pipeline, which makes the NGI seasonality unclear in China. Therefore, the hypothesis of this paper is “seasonality sustains in the Japanese and Korean NGI markets, but doesn’t sustain in Chinese NGI markets”.
The remainder of this paper proceeds as follows. Section 2 introduces the X-12-ARIMR model, and describes and pre-processes the data. Section 3 analyses the variations and reasons of NGI seasonality. Section 4 raises some discussions and Section 5 concludes the paper.

2. Methodology

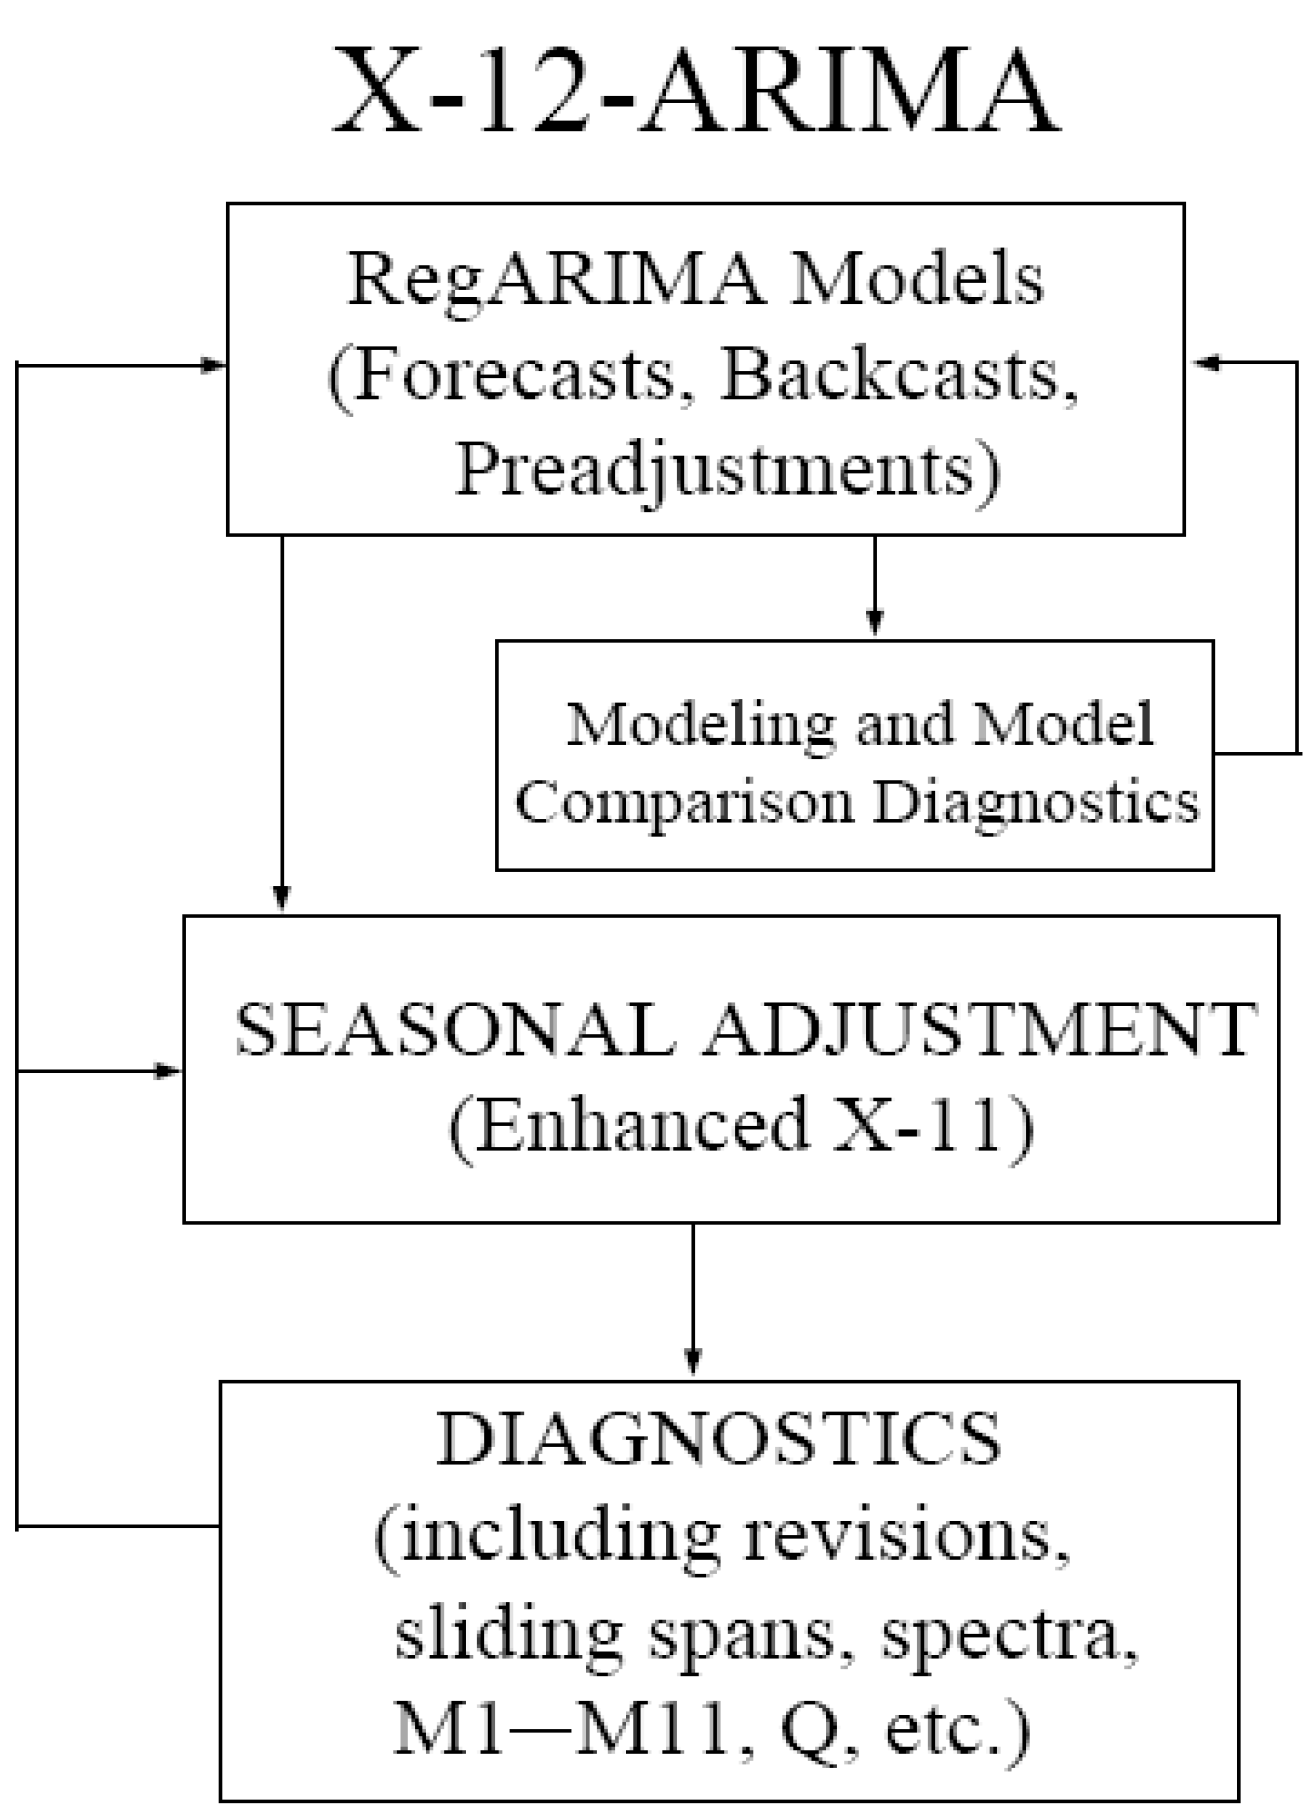
2.1. The X-12-ARIMA Method

In this paper, the X-12-ARIMA method was used for testing the existence of seasonality for the Japanese, Korean, and Chinese NGI markets. Currently, the main seasonal adjustment methods used for estimating the seasonal component are X-12-ARIMA and TRAMO-SEATS. X-12-ARIMA belongs to the nonparametric seasonal adjustment methods. It allows the identification of the different components of the initial series (trend-cycle, seasonality, irregular) by applying linear filters, often called X-11-type filters, which cancels or preserves a well-defined component (tendency-cycle or seasonal variation). The irregular one is represented thereafter by the residual of the decomposition. It contains the regARIMA module, which allows dectecting and removing any undesirable effect of the series (outliers, calendar effects, etc.).
TRAMO-SEATS program belongs to the parametric seasonal adjustment methods based on the signal extraction. It is composed of two independent subroutines: TRAMO program (Time series Regression with ARIMA noise, Missing observations and Outliers) and SEATS program (Signal Extraction ARIMA Time Series). The principle of TRAMO program is in fact to model the initial series using the univariate approach of Box and Jenkins via ARIMA or seasonal ARIMA models, while detecting, estimating and correcting as a preliminary the outliers, the missing values, the calendar effects as well as structural changes, likely to disturb the estimation of the model coefficients. SEATS program uses signal extraction with filters derived from an ARIMA-type time series model that describes the behavior of the series.
When the data generating process (DGP) is not equivalent to the Airline model, X-12-ARIMA may produce better seasonal estimates for such series than TRAMO-SEATS, due to X-12-ARIMA’s nonparametric nature and its tendency to match the seasonal filter of any DGP to the order of the moving averages of SI differences or ratios [14]. Besides, X-12-ARIMA provides procedures to examine the time series’ trading day effects, holiday effects and some other calendar effects [15]. Therefore, we chose the X-12-ARIMA method.
Figure 2. Flow diagram for seasonal adjustment with X-12-ARIMA [7].
Sustainability 07 01690 g002
The X-12-ARIMA seasonal adjustment model is an enhanced version of the X-11 model. The enhancements of the model include a clearer and more typical user interface and a variety of new diagnostic features to help users detect and correct deficiencies that appear in seasonal and calendar effects adjustments [15]. The model also includes a variety of new tools to overcome adaptation problems in order to expand the time series to be adjusted [16]. As presented in Figure 2, a complete X-12-ARIMA programme process is divided into three stages.

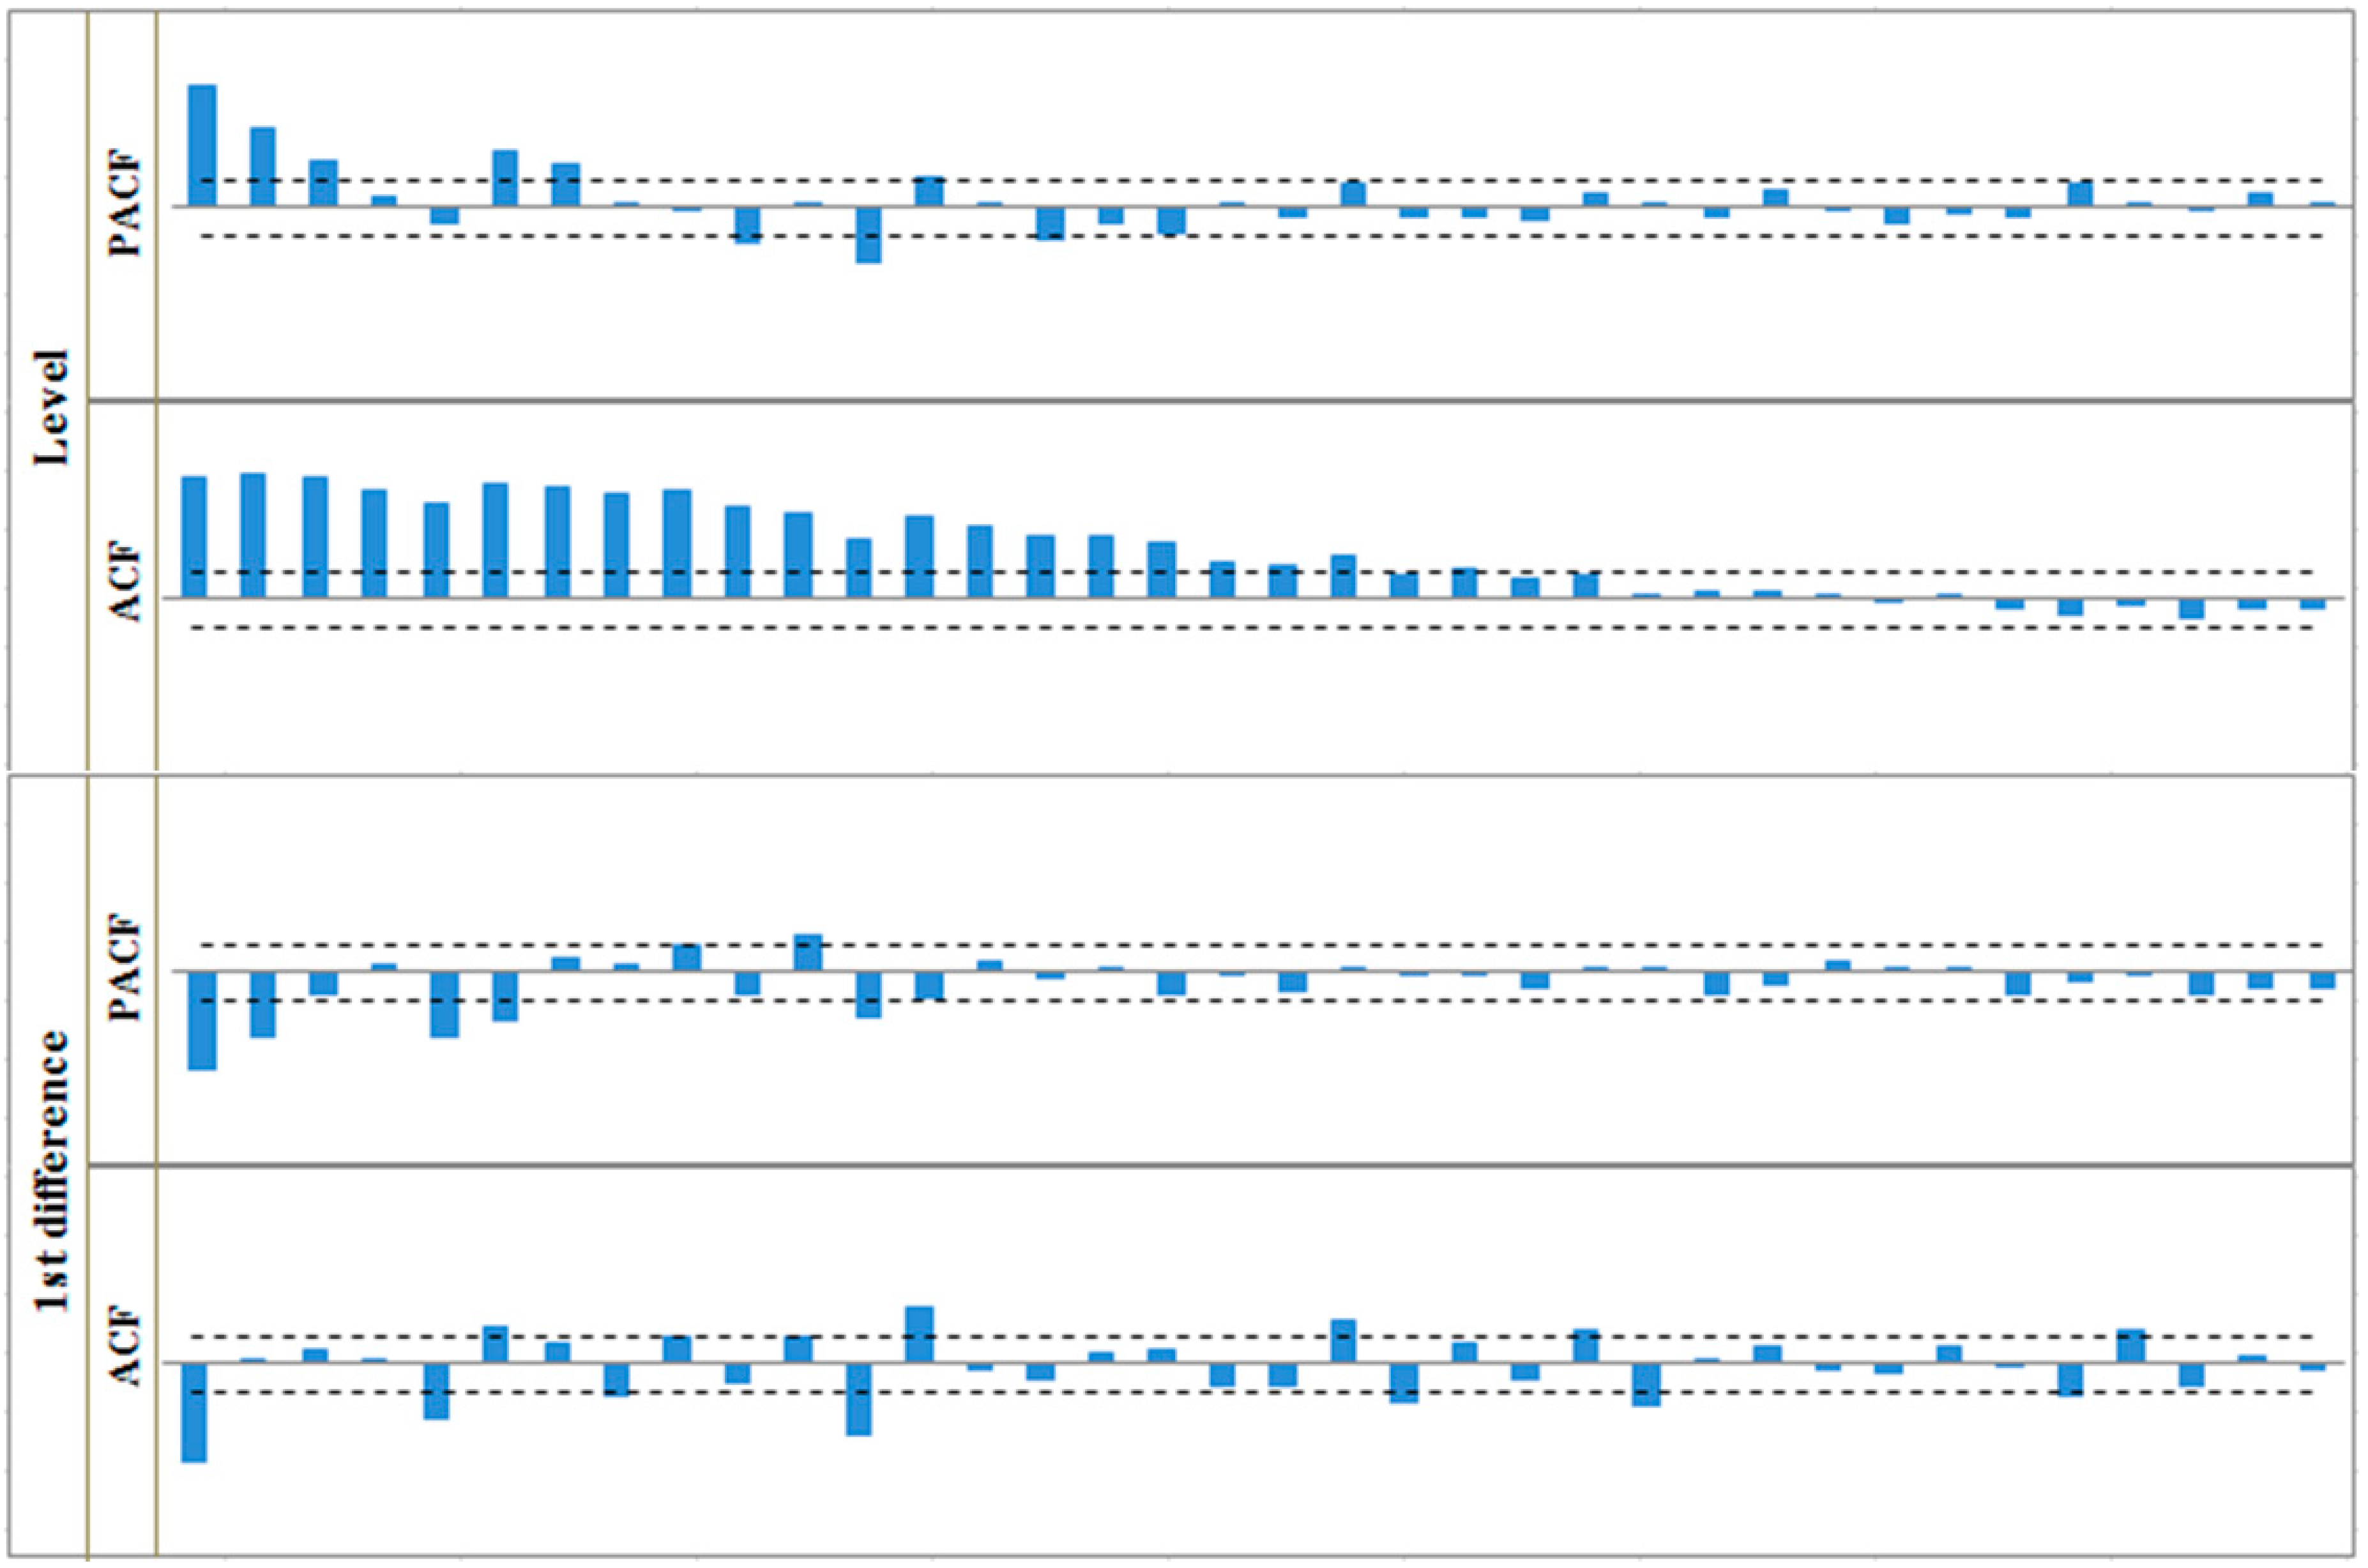
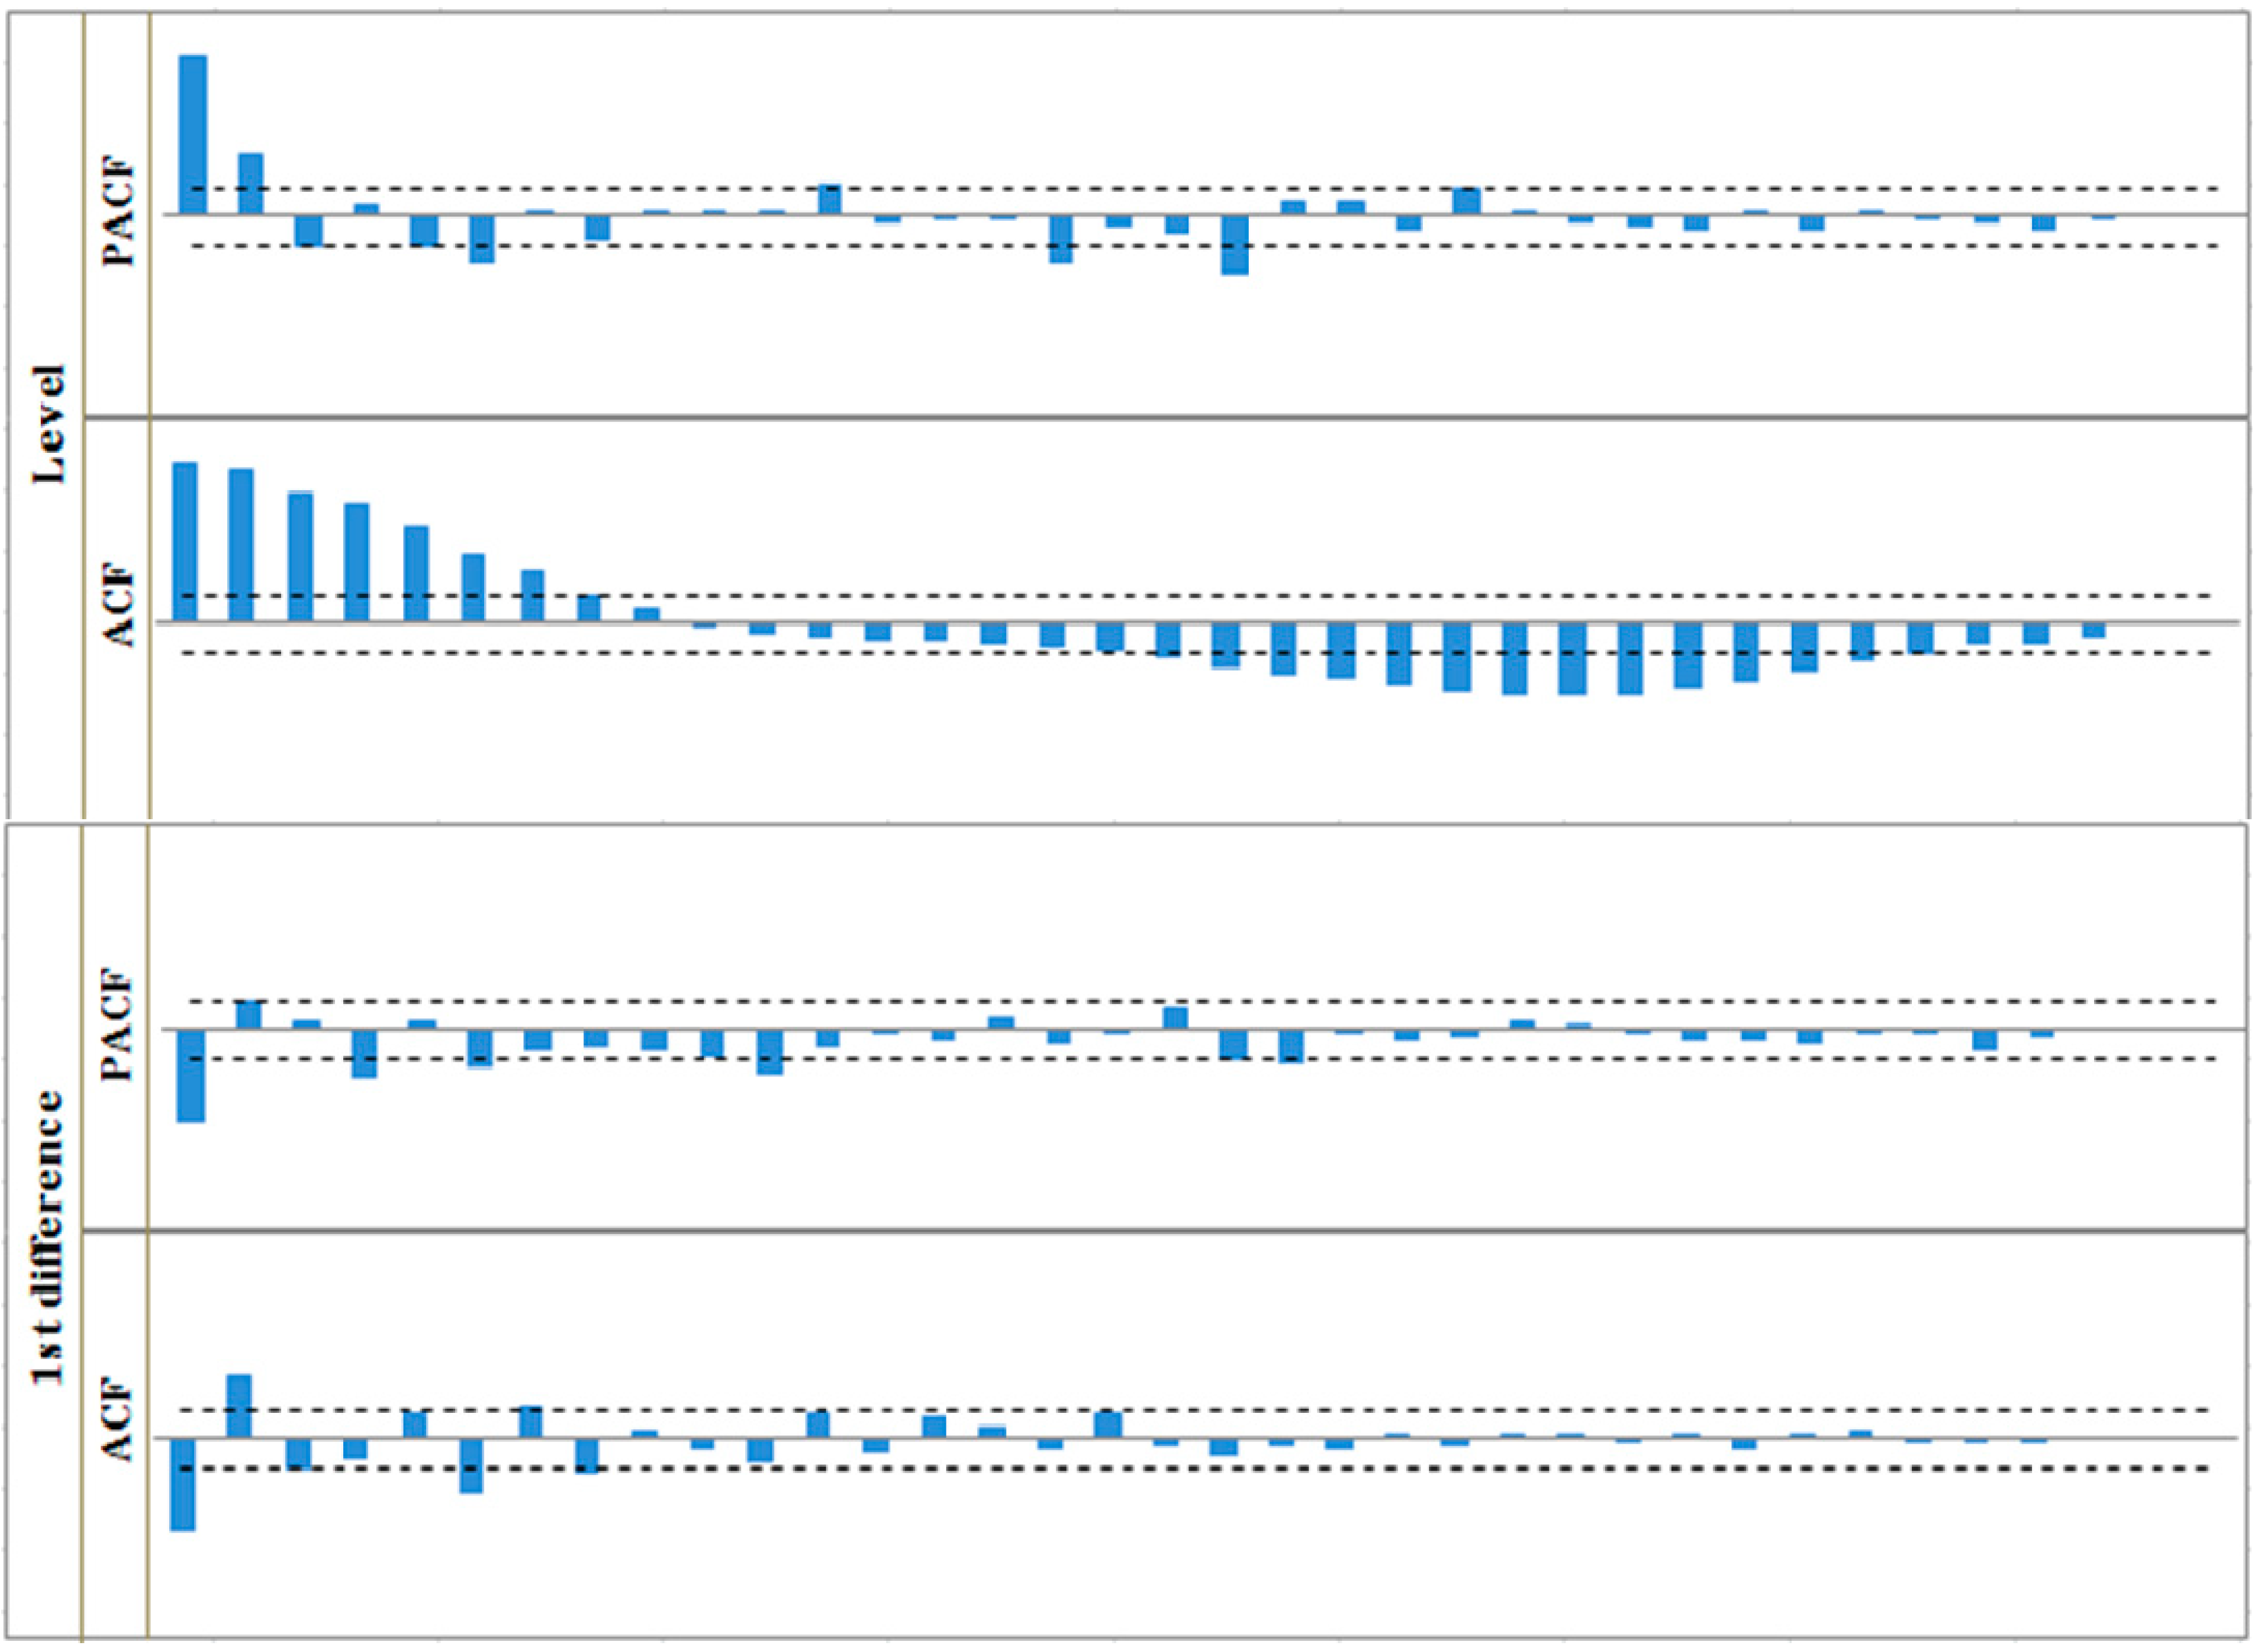
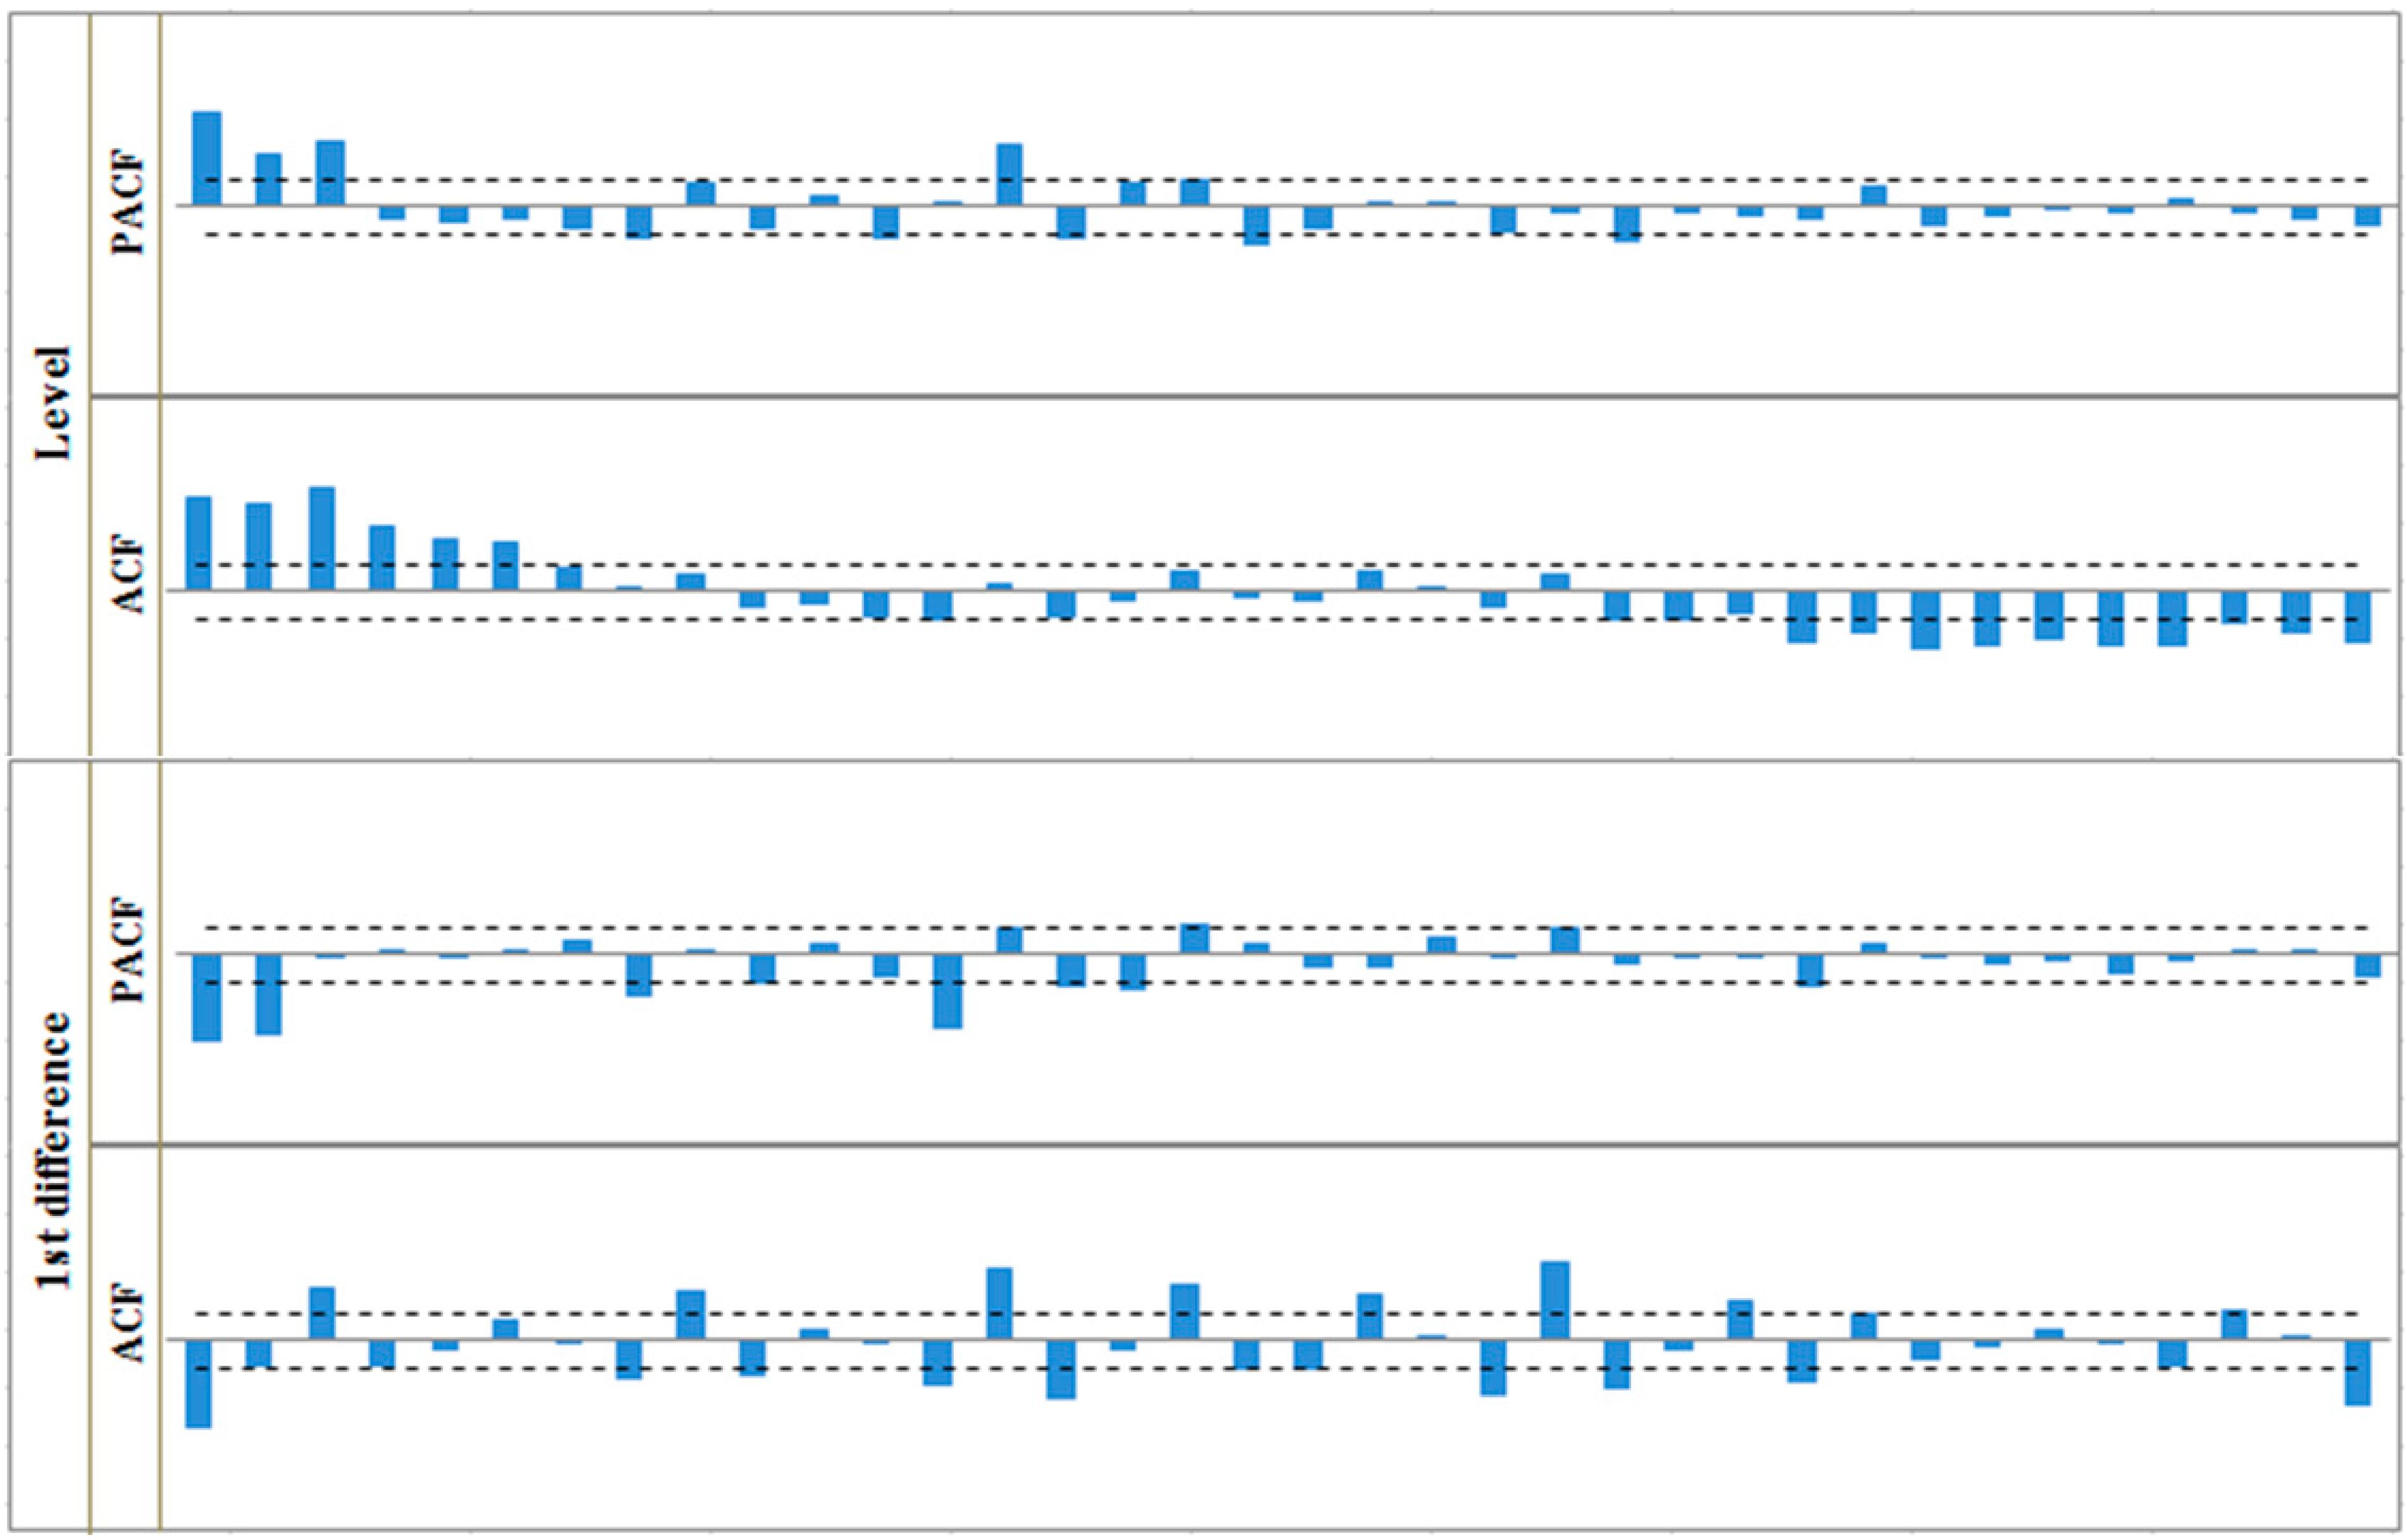
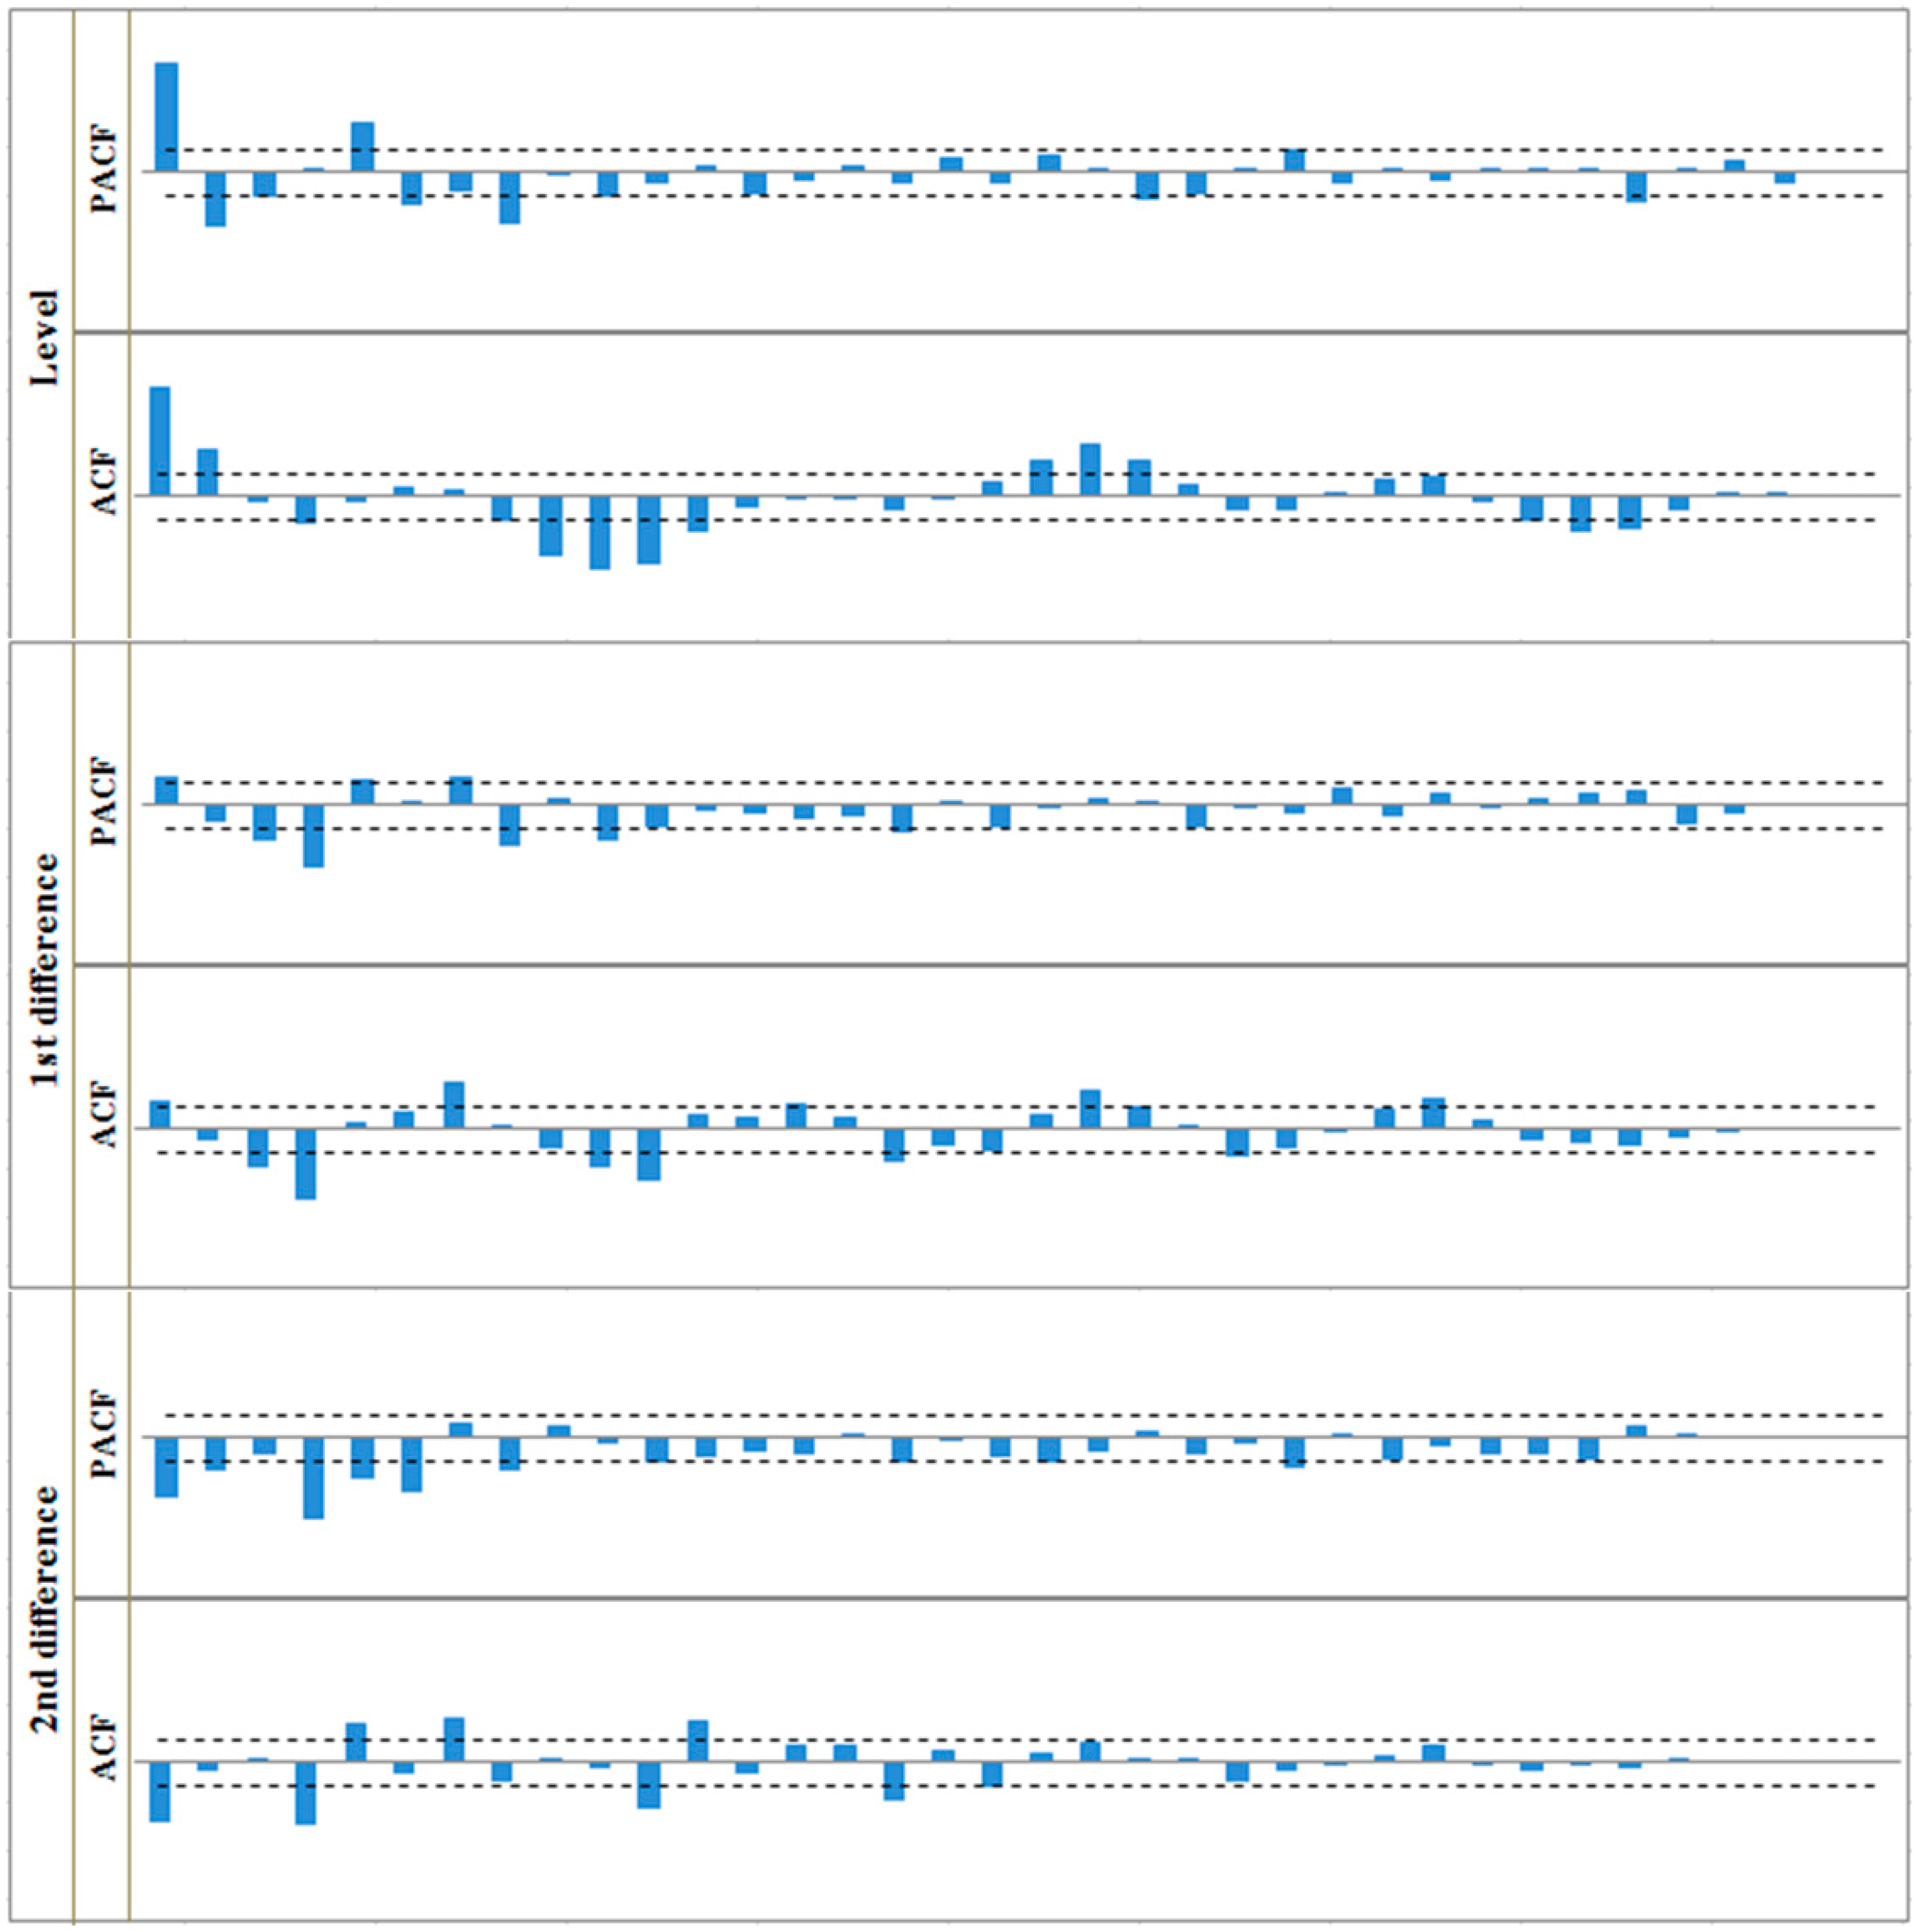
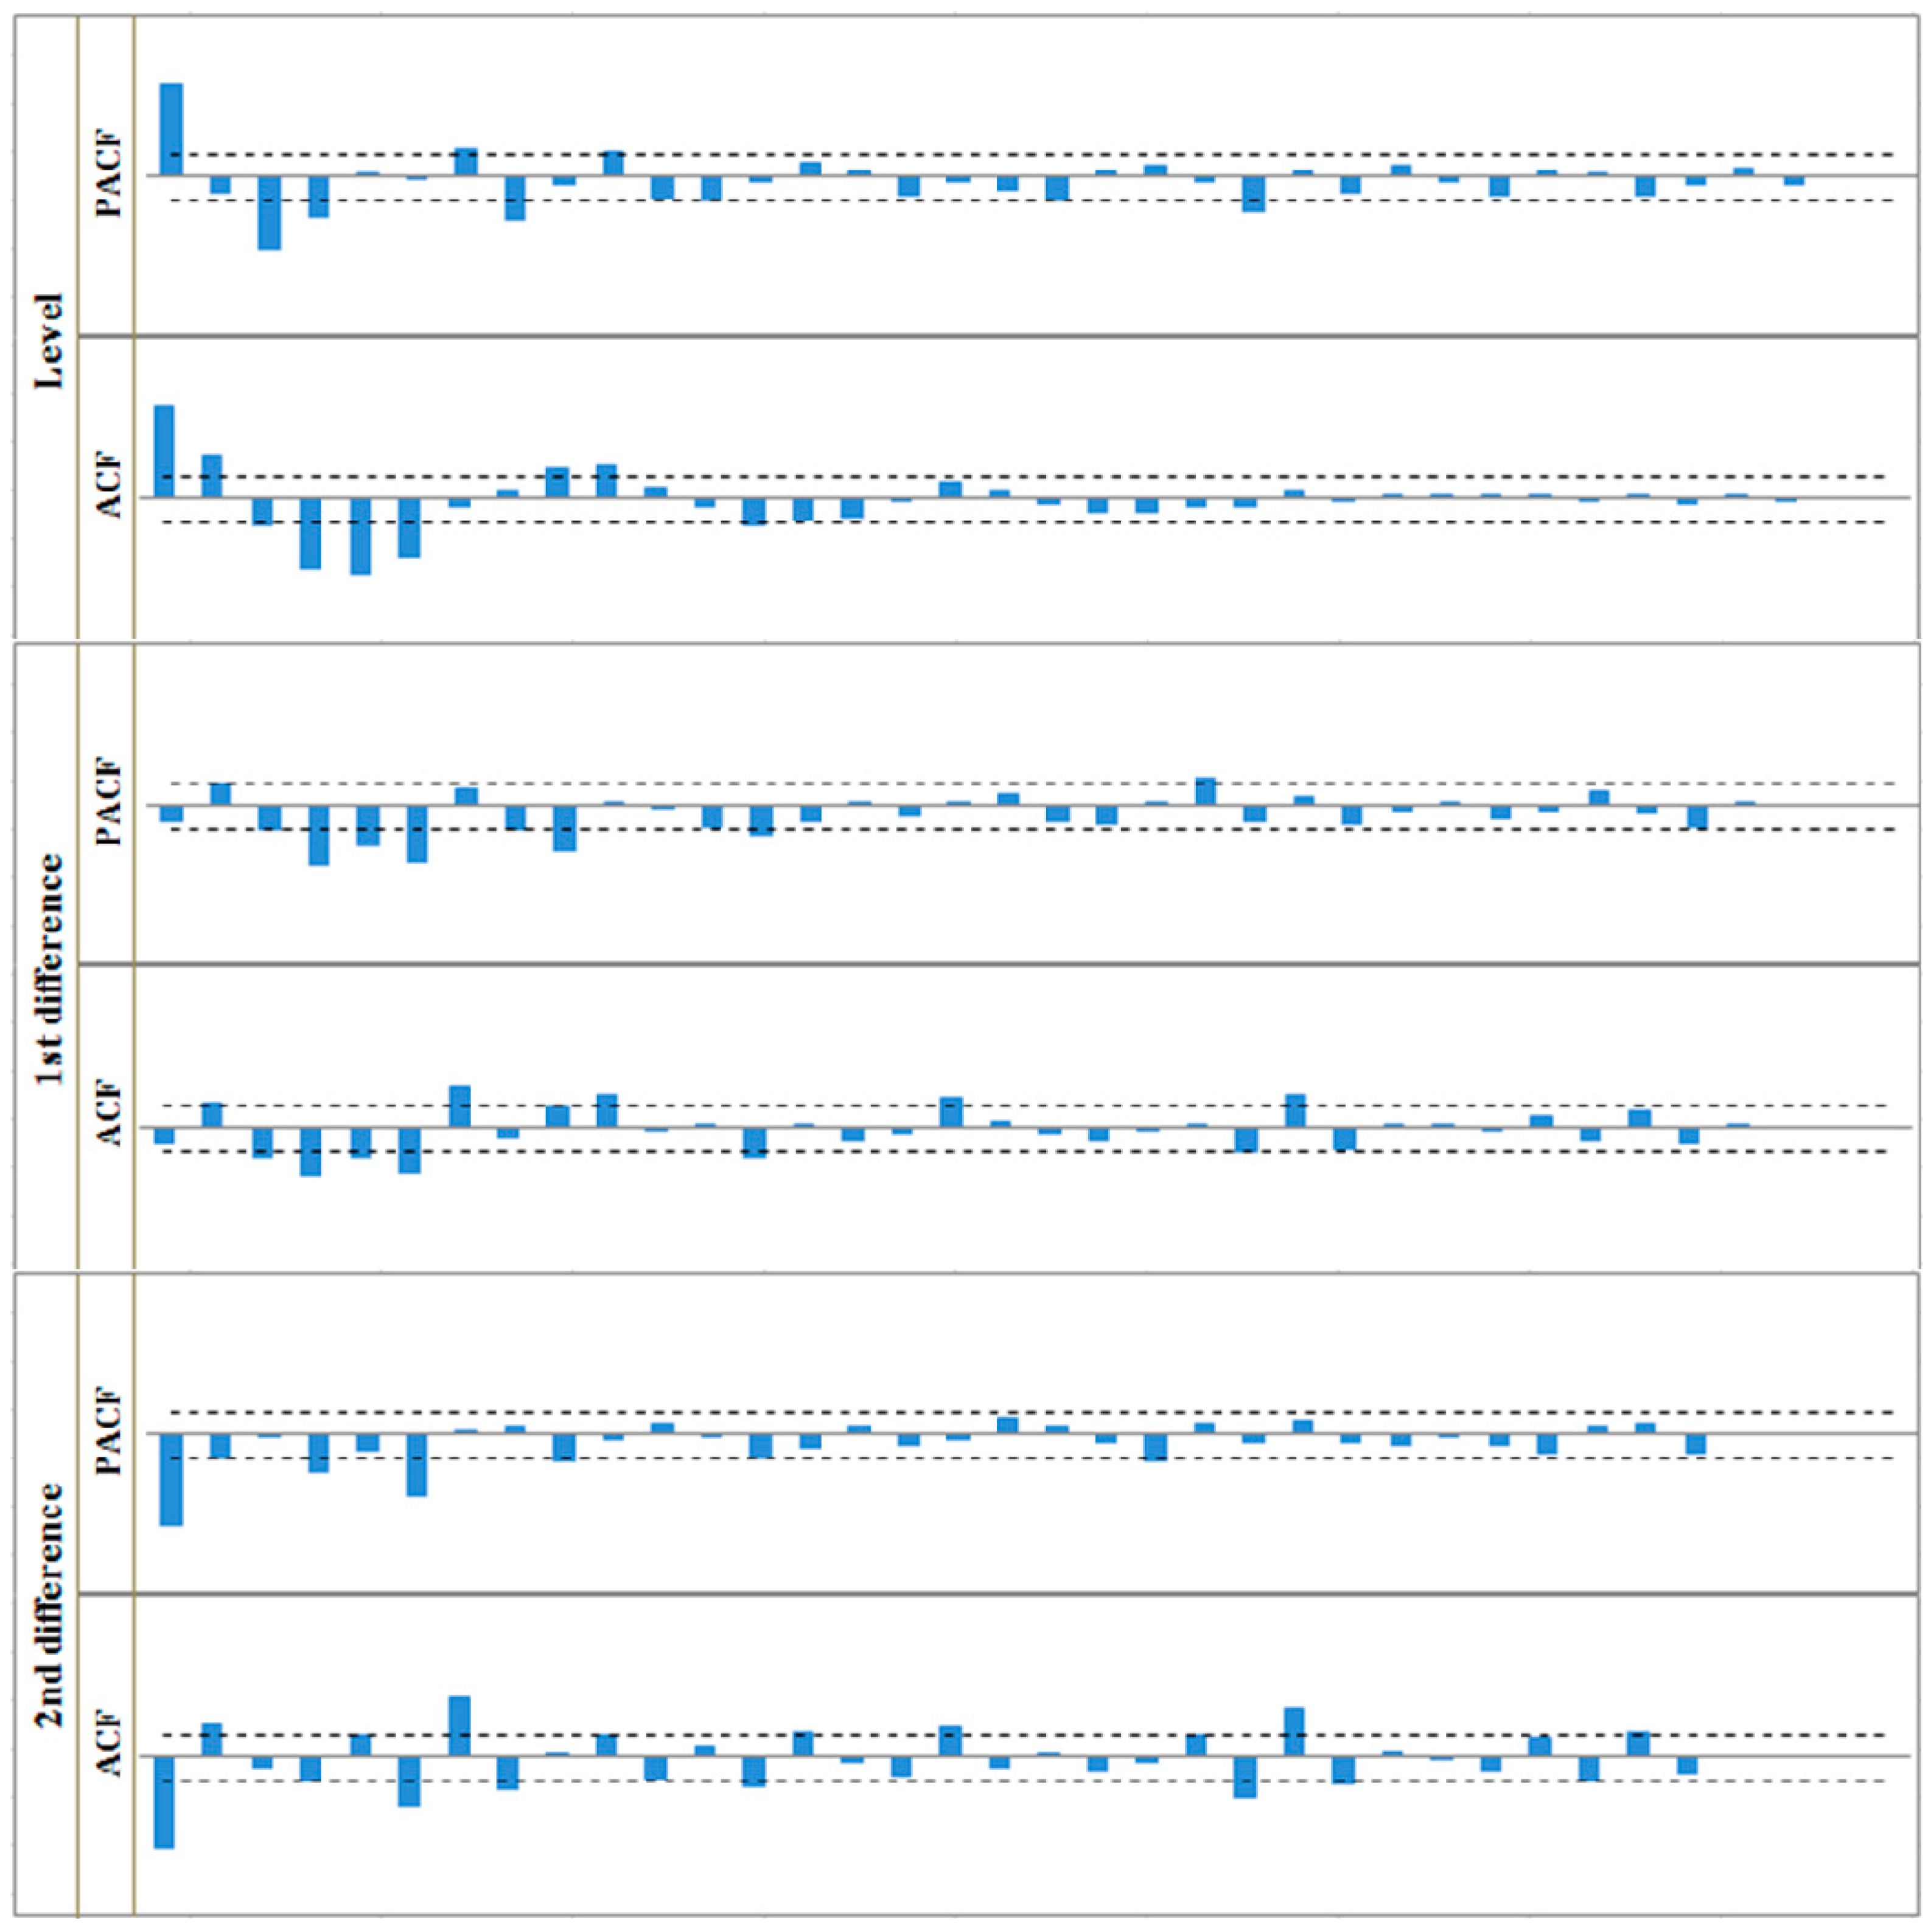
2.2. Series Stationarity

The raw monthly data on Chinese net natural gas imports from January 2003 to December 2013 were collected from China Petroleum and Chemical Industry Association. Data for July and August 2003 were missing and therefore replaced with the average for that year. Monthly Japanese and South Korean NGI data for the same period were collected from International Energy Agency (IEA). All quarterly series were derived from monthly data. As illustrated in Figure 3 and Figure 4, NGIs in China, Japan, and South Korea display a trend of increasing volatility. South Korea, in particular, exhibits a marked seasonal pattern in which NGIs peaks during the winter and bottom out during the summer.
Figure 3. Net monthly natural gas imports (NGIs) by country (January 2003–December 2012).
Sustainability 07 01690 g003
Figure 4. Net quarterly natural gas imports (NGIs) by country (Spring 2003–Winter 2012).
Sustainability 07 01690 g004
To statistically evaluate the stationarity of these series, the Augmented Dickey–Fuller (ADF) unit root test with intercept is used to test a null hypothesis that an observable time series is not stationary. The null hypotheses of non-stationarity are not rejected with the ADF test for the levels of the series (Table 1), indicating that the series are not stationary.
Table 1. Augmented Dickey–Fuller (ADF) test for the stationarity.
VariableLog levelFirst seasonal difference of log levelSecond seasonal difference of log level
Critical valueADF valueCritical valueADF valueCritical valueADF value
ChinaMonthly−2.8842.897−2.886 **−12.672−2.889 **−4.799
Quarterly−2.943−0.054−2.9640.732−2.964 **−3.370
JapanMonthly−2.8860.112−2.889 **−4.364−2.889 **−7.946
Quarterly−2.943−0.507−2.948 **−3.015−2.960 **−5.093
KoreaMonthly−2.8860.470−2.888 **−11.738−2.889 **−9.831
Quarterly−2.9460.601−2.954 **−3.930−2.968 **−4.010
** Denotes significance at 5% level.
The original series are non-stationary and will therefore be transformed into stationary series by differencing processes prior to seasonal adjustment. Then, a (p, d, q) × (P, D, Q)s process for the original series is executed through the X-12-ARIMA’s regression function, where, p and P signify the order of the non-seasonal process and seasonal autocorrelation, respectively; q and Q signify the order of the non-seasonal and seasonal moving averages, respectively; and d and D signify the order of the non-seasonal and seasonal differences, respectively. The subscript “s” indicates the seasonal periodicity (i.e., for monthly data, s = 12 and for quarterly data s = 4). The method for determining P (p) and Q (q) was drawn from Box and Jenkins’ Time series analysis: forecast and control (Revised edition, Chapter 6, pp. 173–186) [17].
The null hypothesis of non-stationarity is not rejected with the ADF test for the first difference of China’s quarterly series, but it is rejected for the second difference of the series (Table 1). However, the null hypotheses of non-stationarity are rejected for the first differences of other series. Therefore, the D value is 2 for China’s quarterly series, and 1 for other series.
The autocorrelation function (ACF) and partial autocorrelation function (PACF) of the original series are presented in Figure A1, Figure A2, Figure A3, Figure A4, Figure A5 and Figure A6. The ACF and PACF of the first monthly differenced series for China, Japan, and South Korea resemble the (2, d, 0), (2, d, 0), and (2, d, 0) case non-seasonally and the (1, d, 0), (2, d, 0) and (1, d, 0) case seasonally, respectively. The ACF and PACF of the first quarterly differenced series for China resembles the (0, d, 1) case non-seasonally and the (1, d, 1) case seasonally. The ACF and PACF of the second quarterly differenced series for Japan and South Korea resemble the (1, d, 1) and (1, d, 1) case non-seasonally and the (2, d, 0) and (2, d, 0) case seasonally, respectively.
The correlograms of the monthly series suggest that (p, d, q) × (P, D, Q)s equals (2, 1, 0) × (1, 1, 0)12 for China, (2, 1, 0) × (2, 1, 0)12 for Japan, and (2, 1, 0) × (1, 1, 0)12 for South Korea. The correlograms of the quarterly series suggest that (p, d, q) × (P, D, Q)s equals (0, 1,1) × (2, 2, 0)4 for China, (1, 2, 1) × (2, 1, 0)4 for Japan, and (1, 2, 1) × (2, 1, 0)4 for South Korea. These orders are also supported by the Akaike Information Criterion test.

2.3. Model Specification

Because negative values were observed in both the monthly and quarterly Chinese series, only the “additive X-11” decomposition model is valid. The seasonal ingredients’ rangeabilities of the series of Japan and South Korea are not showing a significant positive correlation with the changes of the overall trends, which does not meet the basic assumptions of the multiplicative model, and thus the additive model was also selected for them. The ARIMA procedures for the monthly Chinese, Japanese, and South Korean series are (2, 1, 0) × (1, 1, 0)12, (2, 1, 0) × (2, 1, 0)12, and (2, 1, 0) × (1, 1, 0)12, respectively, while those for the quarterly series of are, (0, 1, 1) × (2, 2, 0)4, (1, 2, 1) × (2, 1, 0)4, and (1, 2, 1) × (2, 1, 0)4, respectively. Diagnostic tests include F-tests for seasonality and M and Q statistics for adjustment quality.
At the end of a time series, seasonal adjustment leads to information loss for which an out-of-sample forecast in ARIMA model is usually employed [18]. To test the performance of the forecasts, the actual values were used as benchmarks and compared to the forecasted values. For China and Japan, the monthly forecasts outperform the quarterly forecasts in terms of the error ratio, whereas the opposite is true for South Korea (Table 2). The reason may be that the fluctuations of irregulars in China and Japan’s monthly series are smaller than that in their quarterly series, while the opposite is true for South Korea.
Table 2. 2013 forecasted net natural gas import (NGI) by country.
ChinaJapanSouth Korea
ForecastActualErrorForecastActualErrorForecastActualError
Monthly
January366938705.2%11,59311,5210.62%4824588618.04%
February404939003.82%10,79410,5342.47%4345553721.52%
March4120365012.86%11,36110,8364.85%493653567.84%
April435343700.4%10,34198694.78%3150464132.12%
May4515388016.36%10,274898914.3%3021373919.21%
June4647382021.65%960790186.53%2549382833.41%
July4805372029.17%10,84510,3804.48%303231283.08%
August459947202.56%11,03710,1488.76%2835413131.36%
September459945600.86%10,774921716.89%330635476.81%
October4787423013.17%10,19010,5523.43%368138825.17%
November5083408024.58%10,07510,1050.3%3188448328.88%
December572953906.28%11,54611,2742.41%5006560210.64%
Total54,95350,1909.49%128,436122,4434.89%43,87353,76018.39%
Quarterly
Spring13,44511,90012.98%32,00729,6947.79%13,31513,7363.06%
Summer16,16212,26031.83%32,99729,54611.68%10,83511,0872.28%
Fall17,50912,87036.05%32,37229,8748.36%13,86511,91216.4%
Winter19,658————36,123————18,109————

3. Empirical Results and Analysis

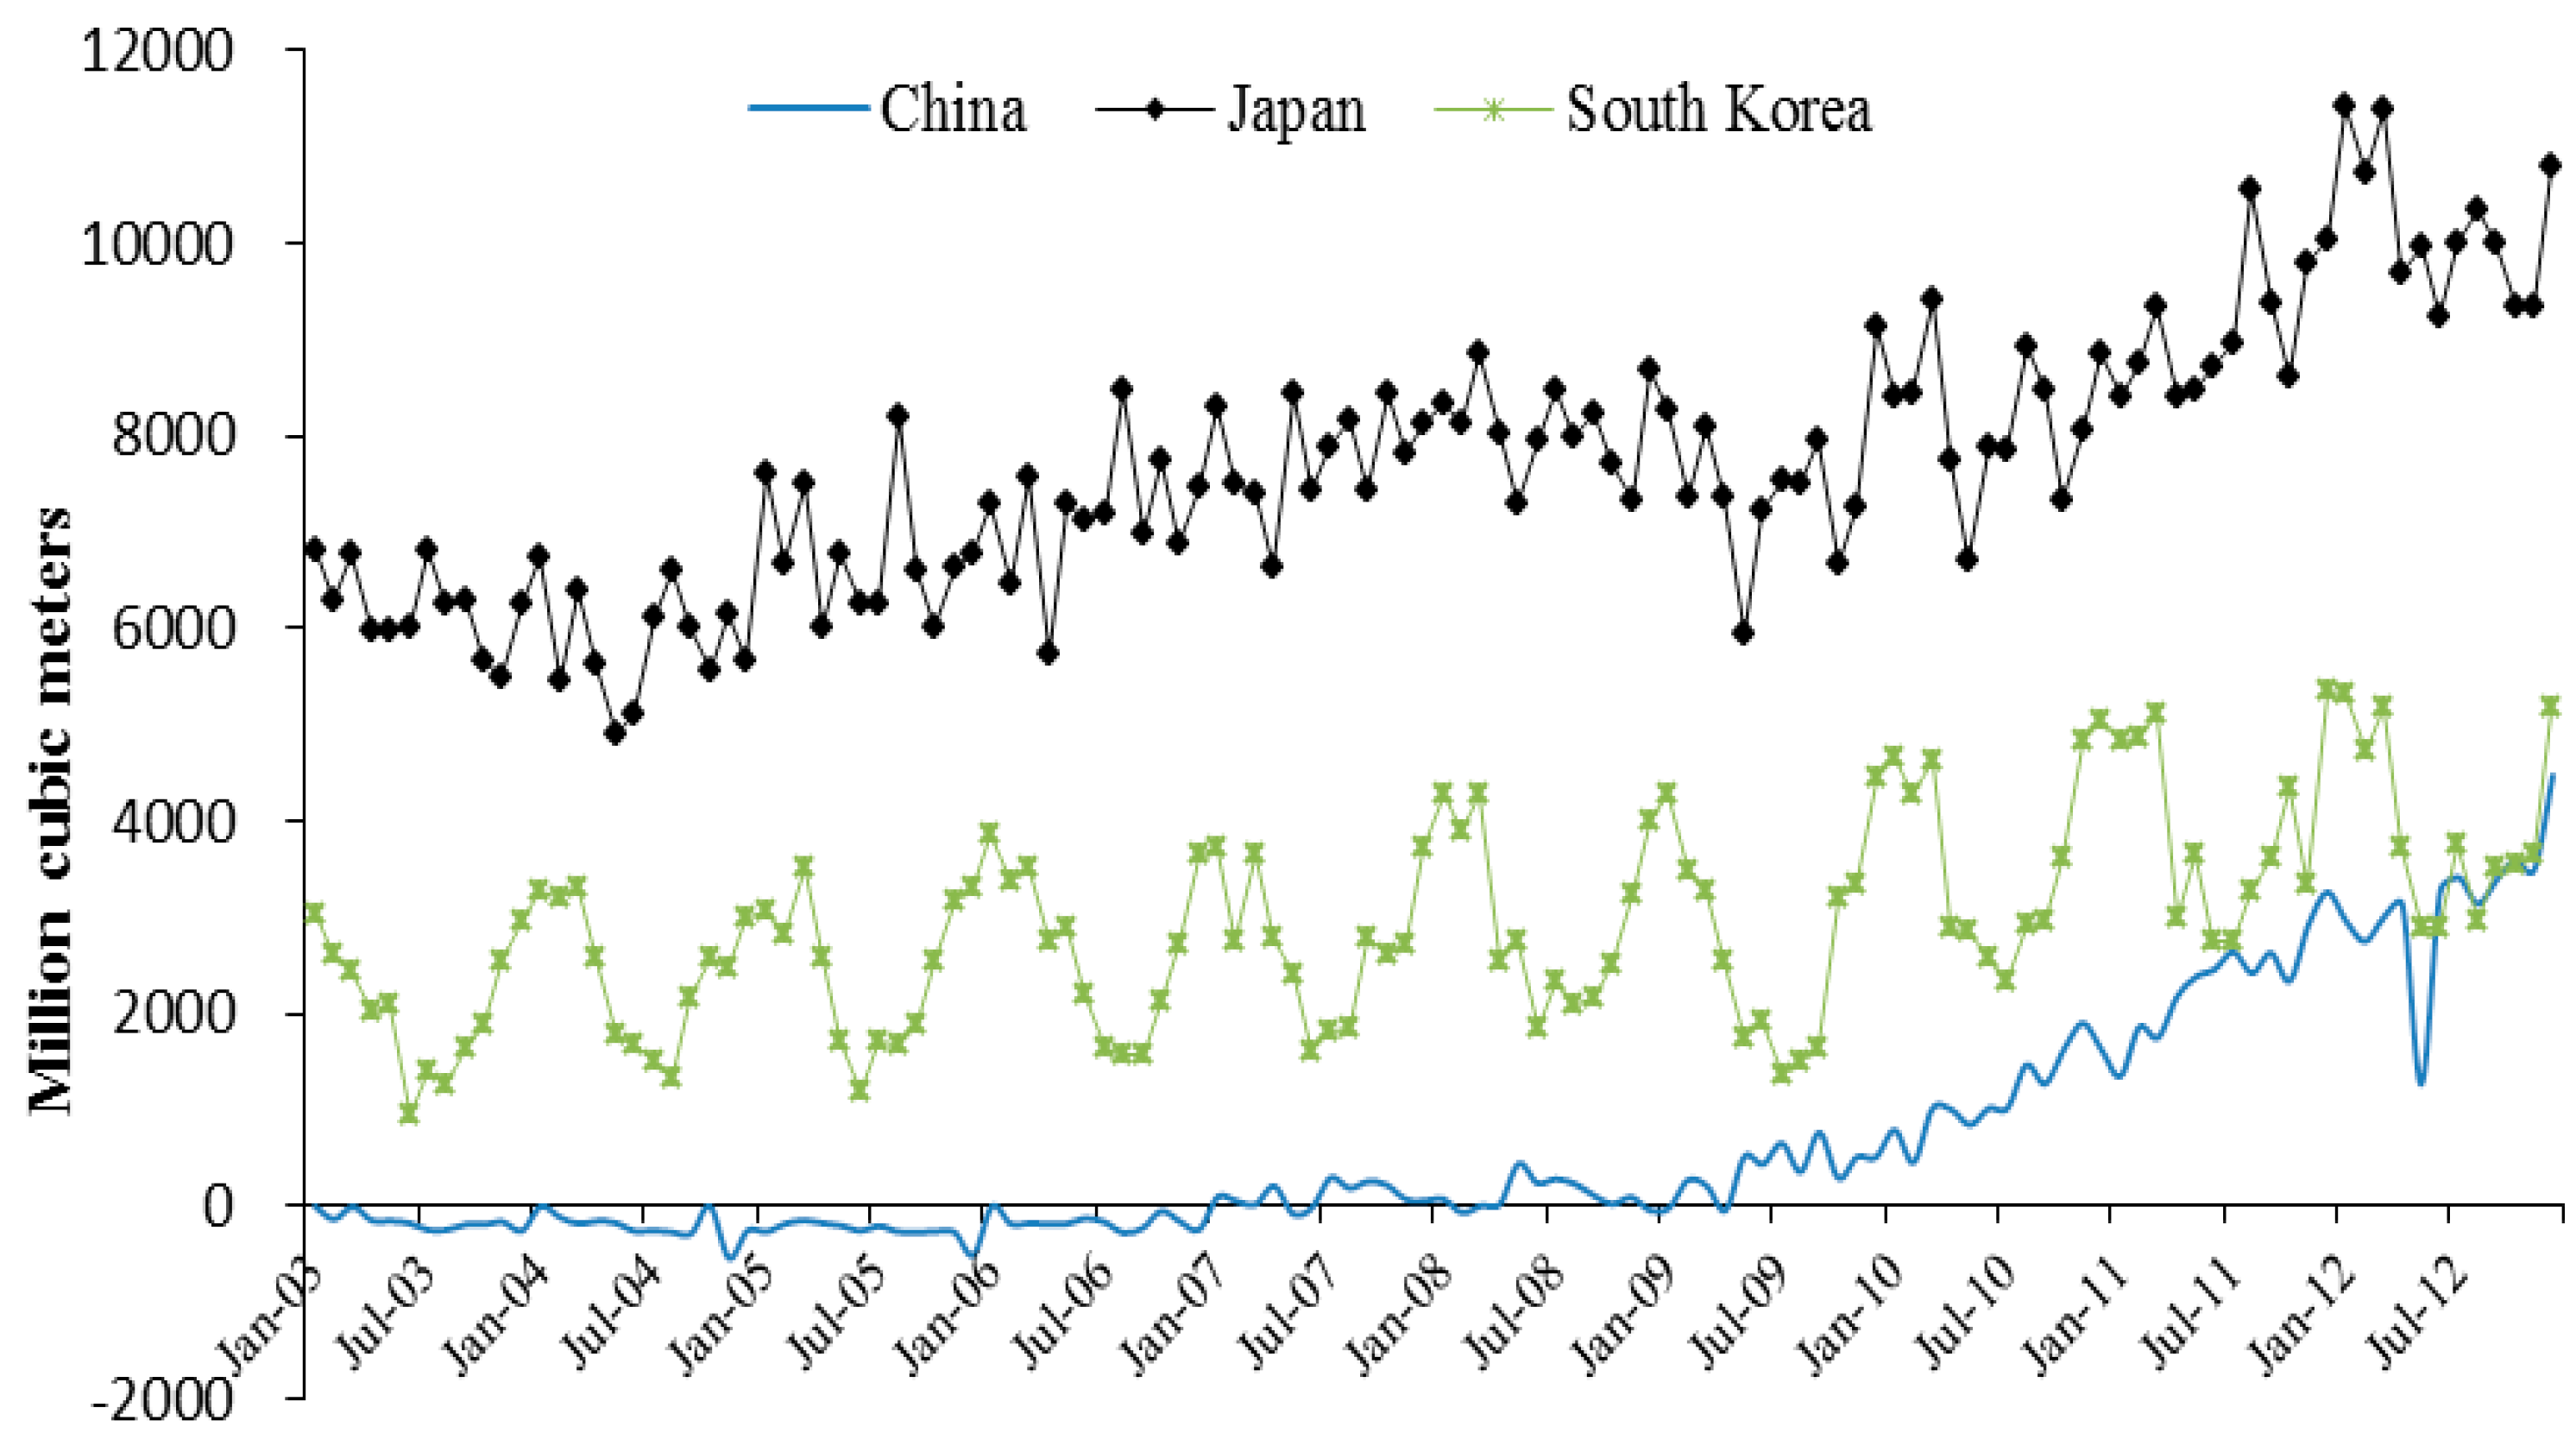
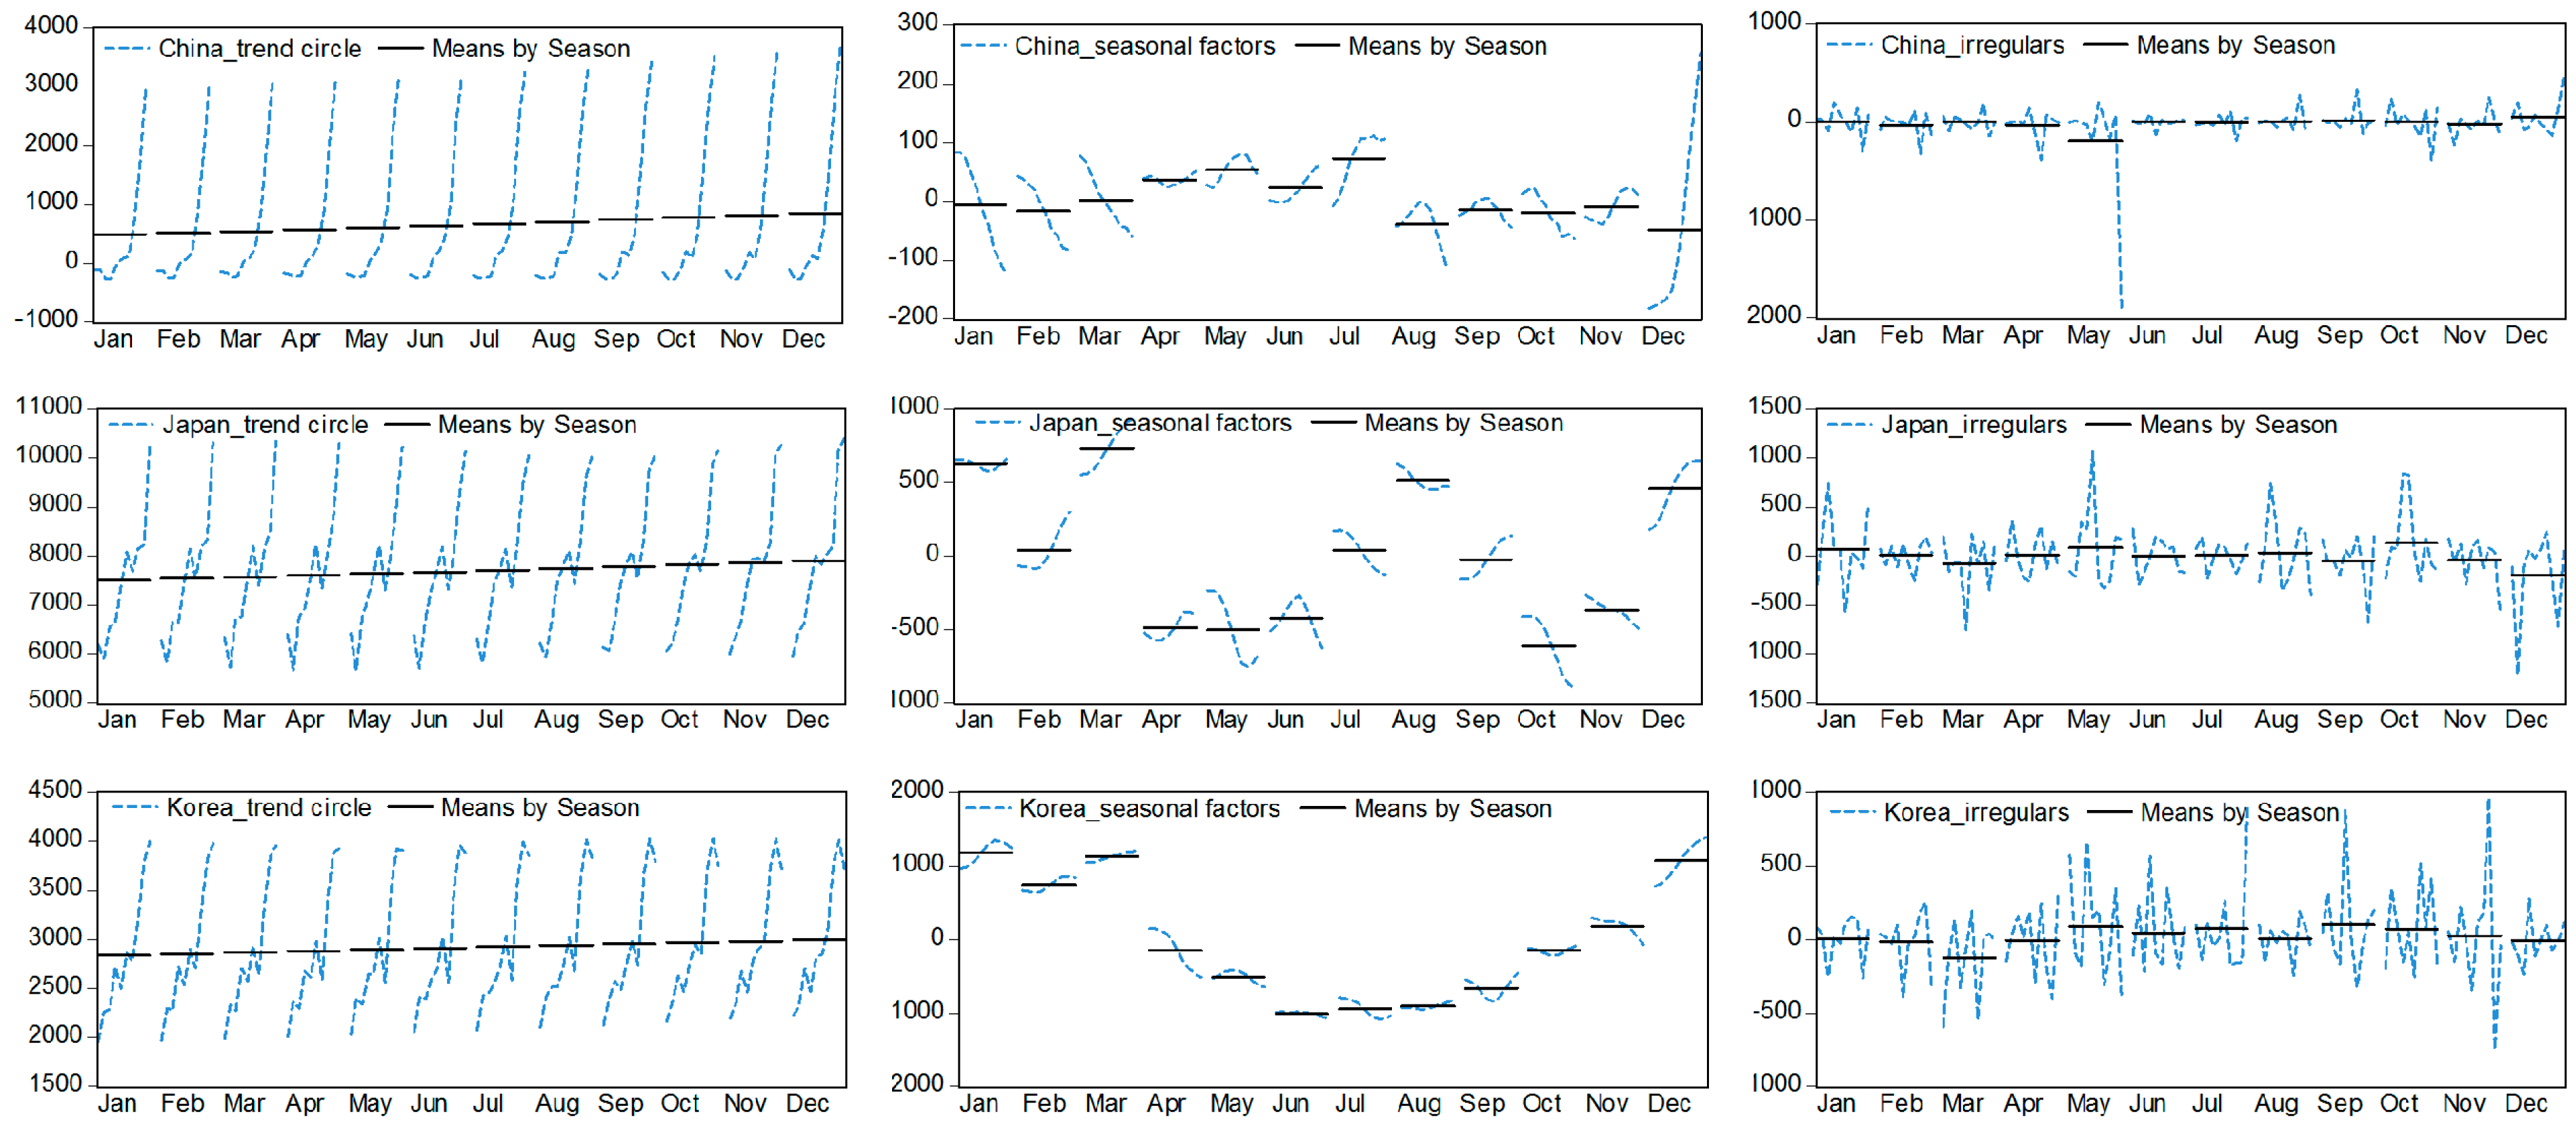
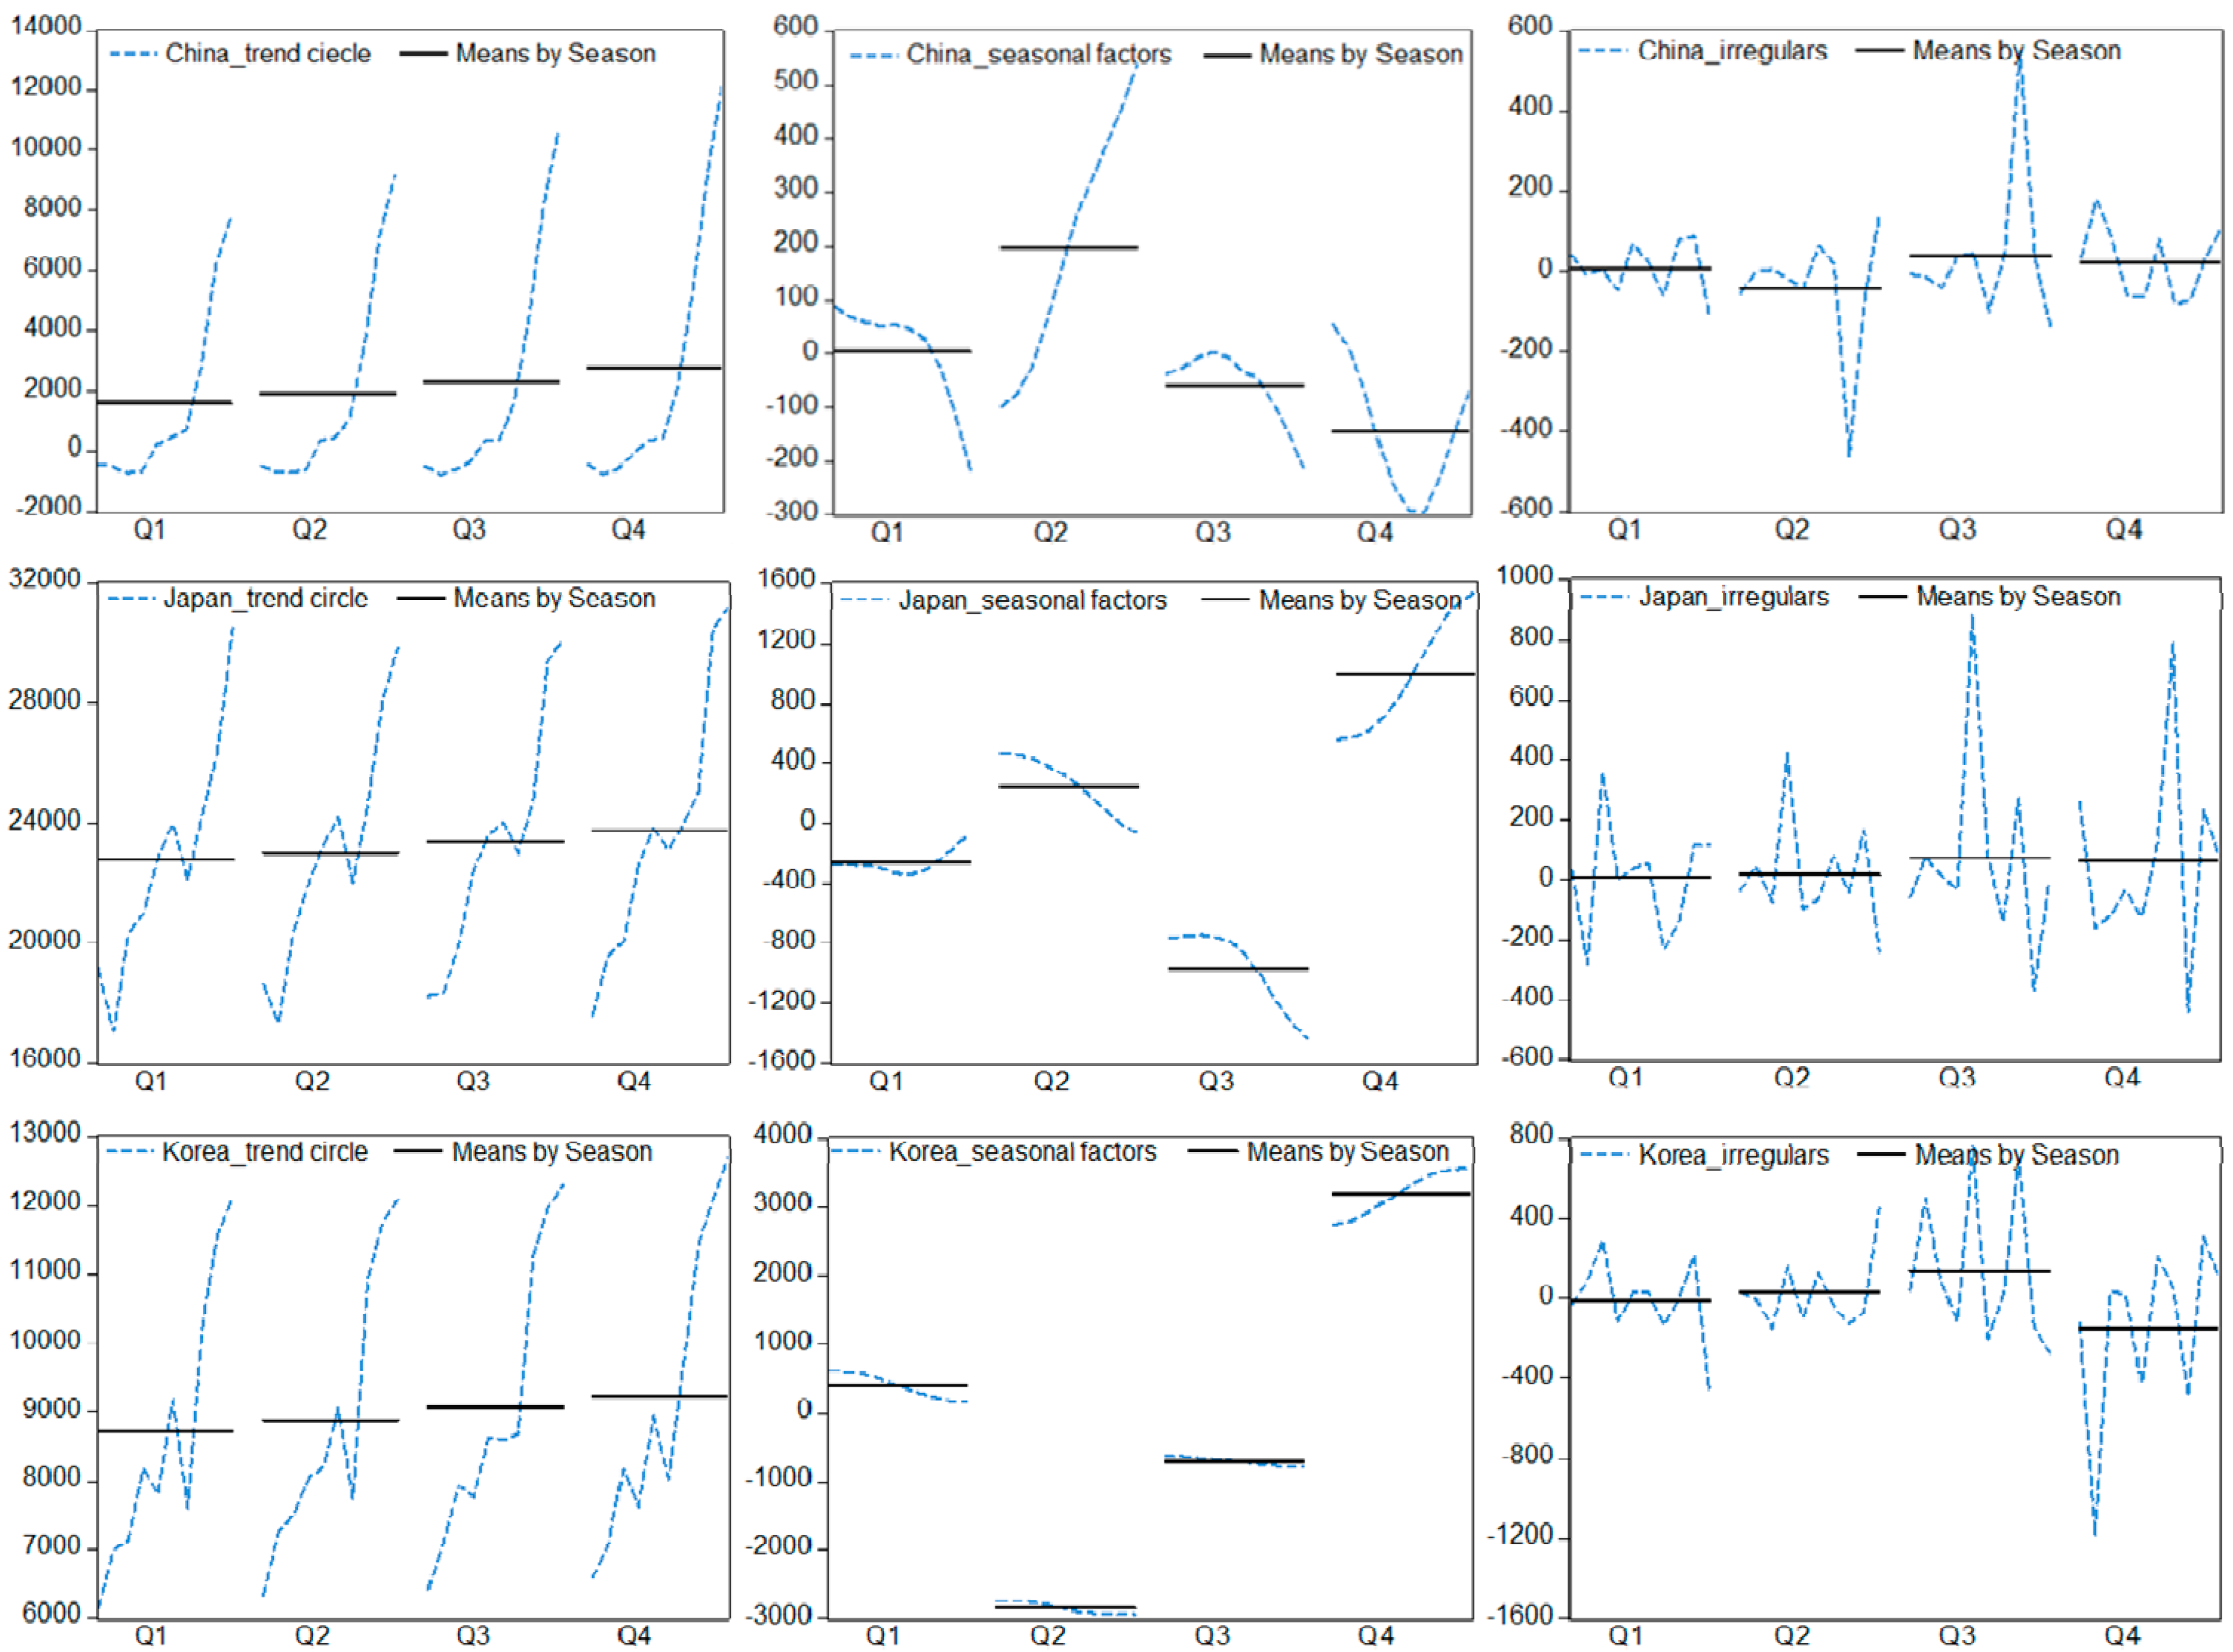
3.1. The Variations of NGI Seasonality

In the X-11 procedure, an input series is decomposed into three components, namely, the trend-circle, seasonal factors and irregulars. The decompositions are plotted in Figure 5 and Figure 6.
Figure 5. Additive components of the monthly series by country.
Sustainability 07 01690 g005
Figure 6. Additive components of the quarterly series of China, Japan, and South Korea.
Sustainability 07 01690 g006
These figures clearly indicate that all three countries’ monthly and quarterly series exhibit a steep upward trend in terms of the trend-circle components, and their irregular factors fluctuate strongly; however, obvious differences also exist among the three sets.
The seasonal factors of Chinese NGIs are less regular than those of Japan and South Korea. When graphed by month, China’s NGIs fluctuate especially irregularly; however, when graphed by quarter, the trend peaks during the summer.
Japan’s monthly NGI series is characterized by a w-shape whose central peak occurs in August. When graphed by quarter, the Japanese NGI curve approximates a “~”.
The Korean monthly and quarterly NGI series are both U-shaped, but the quarterly series exhibits a sharper trough.
For China, the seasonality tests (Table 3) indicate that stable seasonality is not present in the monthly NGI series, although moving seasonality is present. Moving seasonality, which represents a more obscure, fluctuating cycle, suggests that Chinese seasonality is less stable and identifiable. In addition, the adjustment quality test (Table 4) rejects monthly seasonality within China’s monthly NGI series (Q value = 1.82, critical value = 1). For China’s quarterly NGI series, the Q-statistic support stable seasonality, but the combined seasonality test rejects stable seasonality. Therefore, quarterly seasonality is rejected for Chinese NGIs.
For Japan, the combined seasonality tests indicate that seasonality is identifiable for both the monthly and quarterly series and that the adjustment quality is even better; that is, synthetically, both monthly and quarterly seasonality are accepted. The monthly seasonality and quarterly seasonality of the South Korean NGI series are also accepted by the seasonality and adjustment quality tests.
Table 3. Seasonality tests.
F-test for stable seasonalityF-test for moving seasonalityKruskal–Wallis StatisticCombined seasonality test
ChinaMonthlyNone at 1%present at 5%None at 5%No
QuarterlyNone at 1%None at 5%None at 5%No
JapanMonthlypresent at 1%None at 5%present at 1%identifiable
Quarterlypresent at 1%None at 5%present at 1%identifiable
KoreaMonthlypresent at 1%present at 5%present at 1%identifiable
Quarterlypresent at 1%None at 5%present at 1%identifiable
Table 4. Adjustments quality tests.
M1M2M3M4M5M6M7M8M9M10M11QDecision
ChinaMonthly3.000.300.640.530.490.663.002.331.812.882.831.62rejected
Quarterly0.440.020.000.840.200.661.362.661.852.271.860.96accepted
JapanMonthly0.620.640.960.110.860.190.620.840.641.141.090.66accepted
Quarterly0.410.170.130.540.200.400.390.940.881.421.400.49accepted
KoreaMonthly0.470.491.910.313.000.290.360.500.340.630.600.85accepted
Quarterly0.100.100.700.690.790.280.130.210.210.270.270.34accepted

3.2. The Reasons of NGI Seasonality

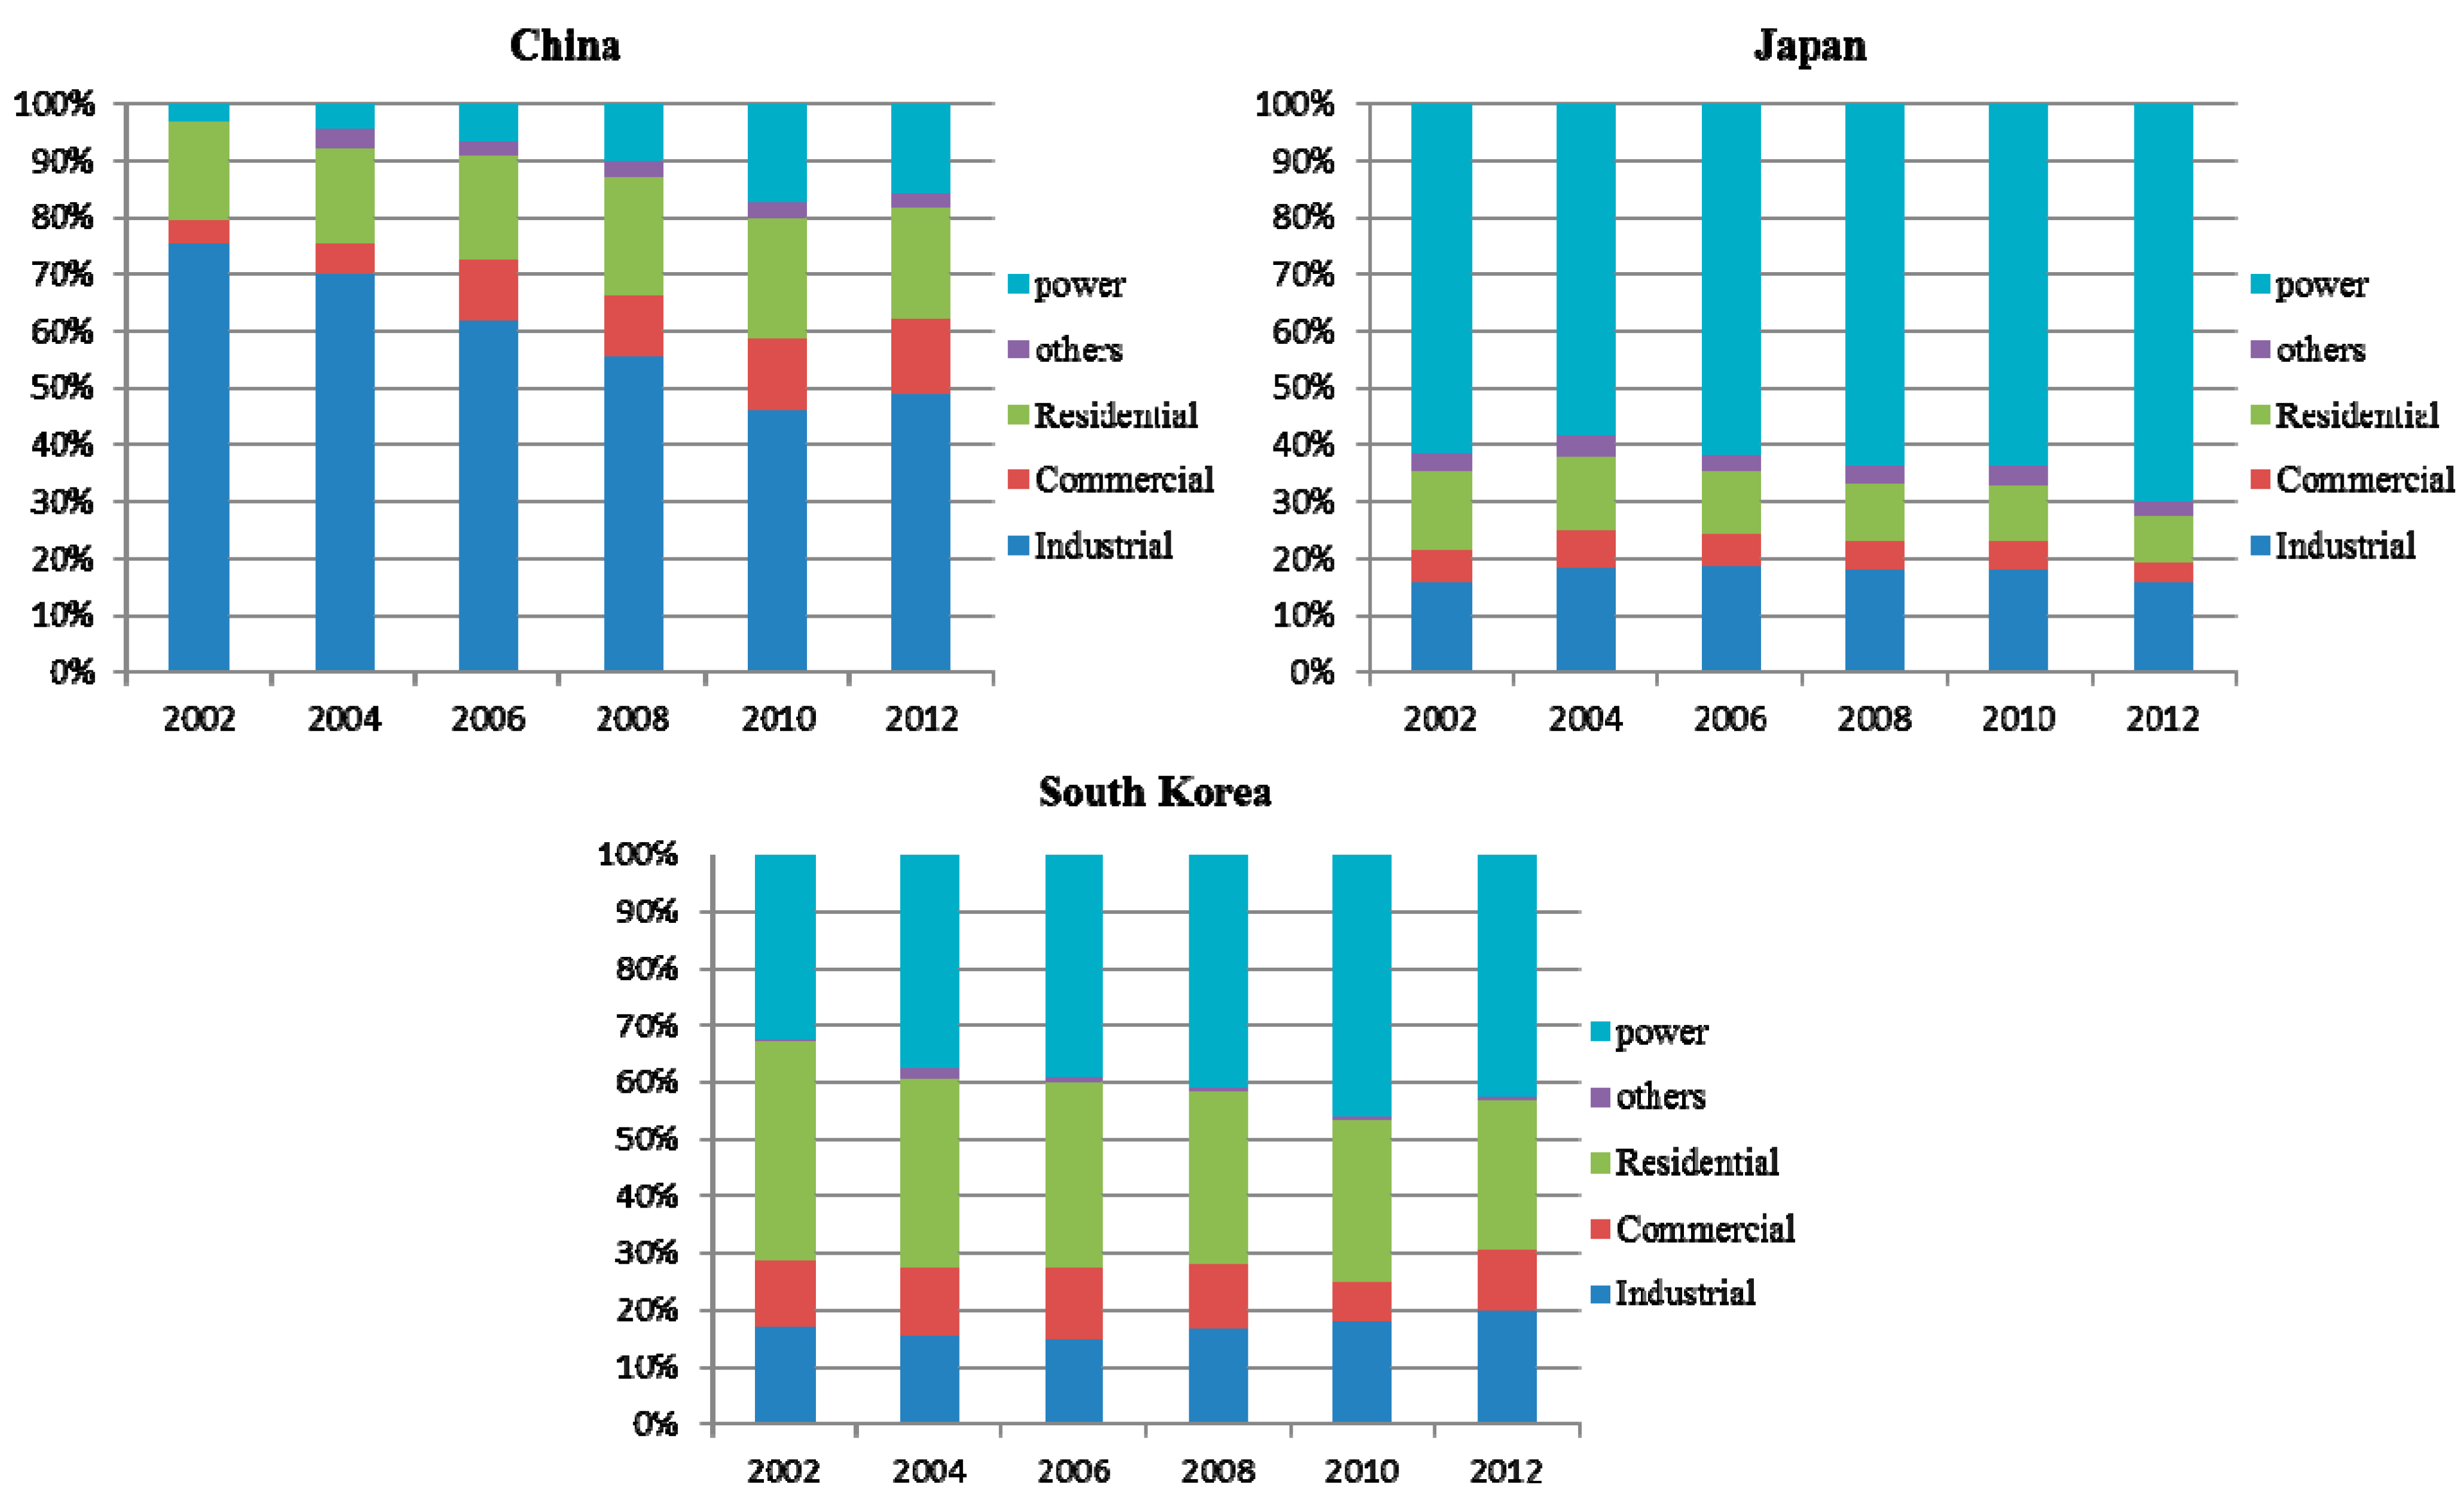
3.2.1. Differences in Seasonal Natural Gas Consumption

NGI seasonality stems predominantly from seasonality in natural gas consumption. The customer base is divided into four categories: residential, commercial, industrial, and power generation [19]. Industrial customers tend to be less sensitive to temperature and display insignificant seasonal characteristics [19]. The proportion of commercial natural gas consumption is relatively low in China, Japan, and South Korea (Figure 7). Thus, in this article, the seasonal characteristics of natural gas consumption are attributed to residential consumption, power generation and air conditioning.
Figure 7. Natural gas consumption by sector in China, Japan, and South Korea [5,14,20].
Sustainability 07 01690 g007
Residential consumption: Customers use natural gas for space heating, which is known as the heating load. Consumers also use natural gas for water heating, drying, cooking, baking, etc., which is termed the base load. The heating load is weather dependent (especially on temperature), while the base load is not weather dependent and thus tends to be constant [19]. As temperatures drop during the winter, demand for natural gas for residential heating increases. In China, Japan, and South Korea, residential consumption is the main source of increased winter natural gas consumption.
Power generation: Peaks in electricity demand usually occur during the winter and summer [21,22,23]. China’s electric power load is still largely reliant on coal and hydropower, while gas electricity accounts for a minimal proportion, approximately 1.8 percent, of the total power generated [24]. In other words, natural gas is not used as a power load resource in China, which implies that the seasonality of power generation is not a factor in Chinese NGIs. In Japan and South Korea, however, imported natural gas is predominantly utilized in power plants (Figure 7). In Japan, natural gas power supplements the peak load during both summer and winter [25]. In South Korea, natural gas power is mainly used to supplement the peak power demand in winter, as indicated in Figure 8 below.
Air conditioning: In Japan, gas air conditioning systems are increasingly favored due to benefits such as economic and energy efficiency, space conservation, and system operation, with the result that more natural gas is consumed during summer and winter. To mitigate the stress produced by peak electricity demand, the Japanese government supports the installation of gas air conditioning systems in office buildings, shopping centers, schools and hospitals, especially during the summer [14]; however, gas air conditioning is in its initial stages in China and South Korea.
Figure 8. Monthly natural gas consumption for power generation in South Korea [5].
Sustainability 07 01690 g008

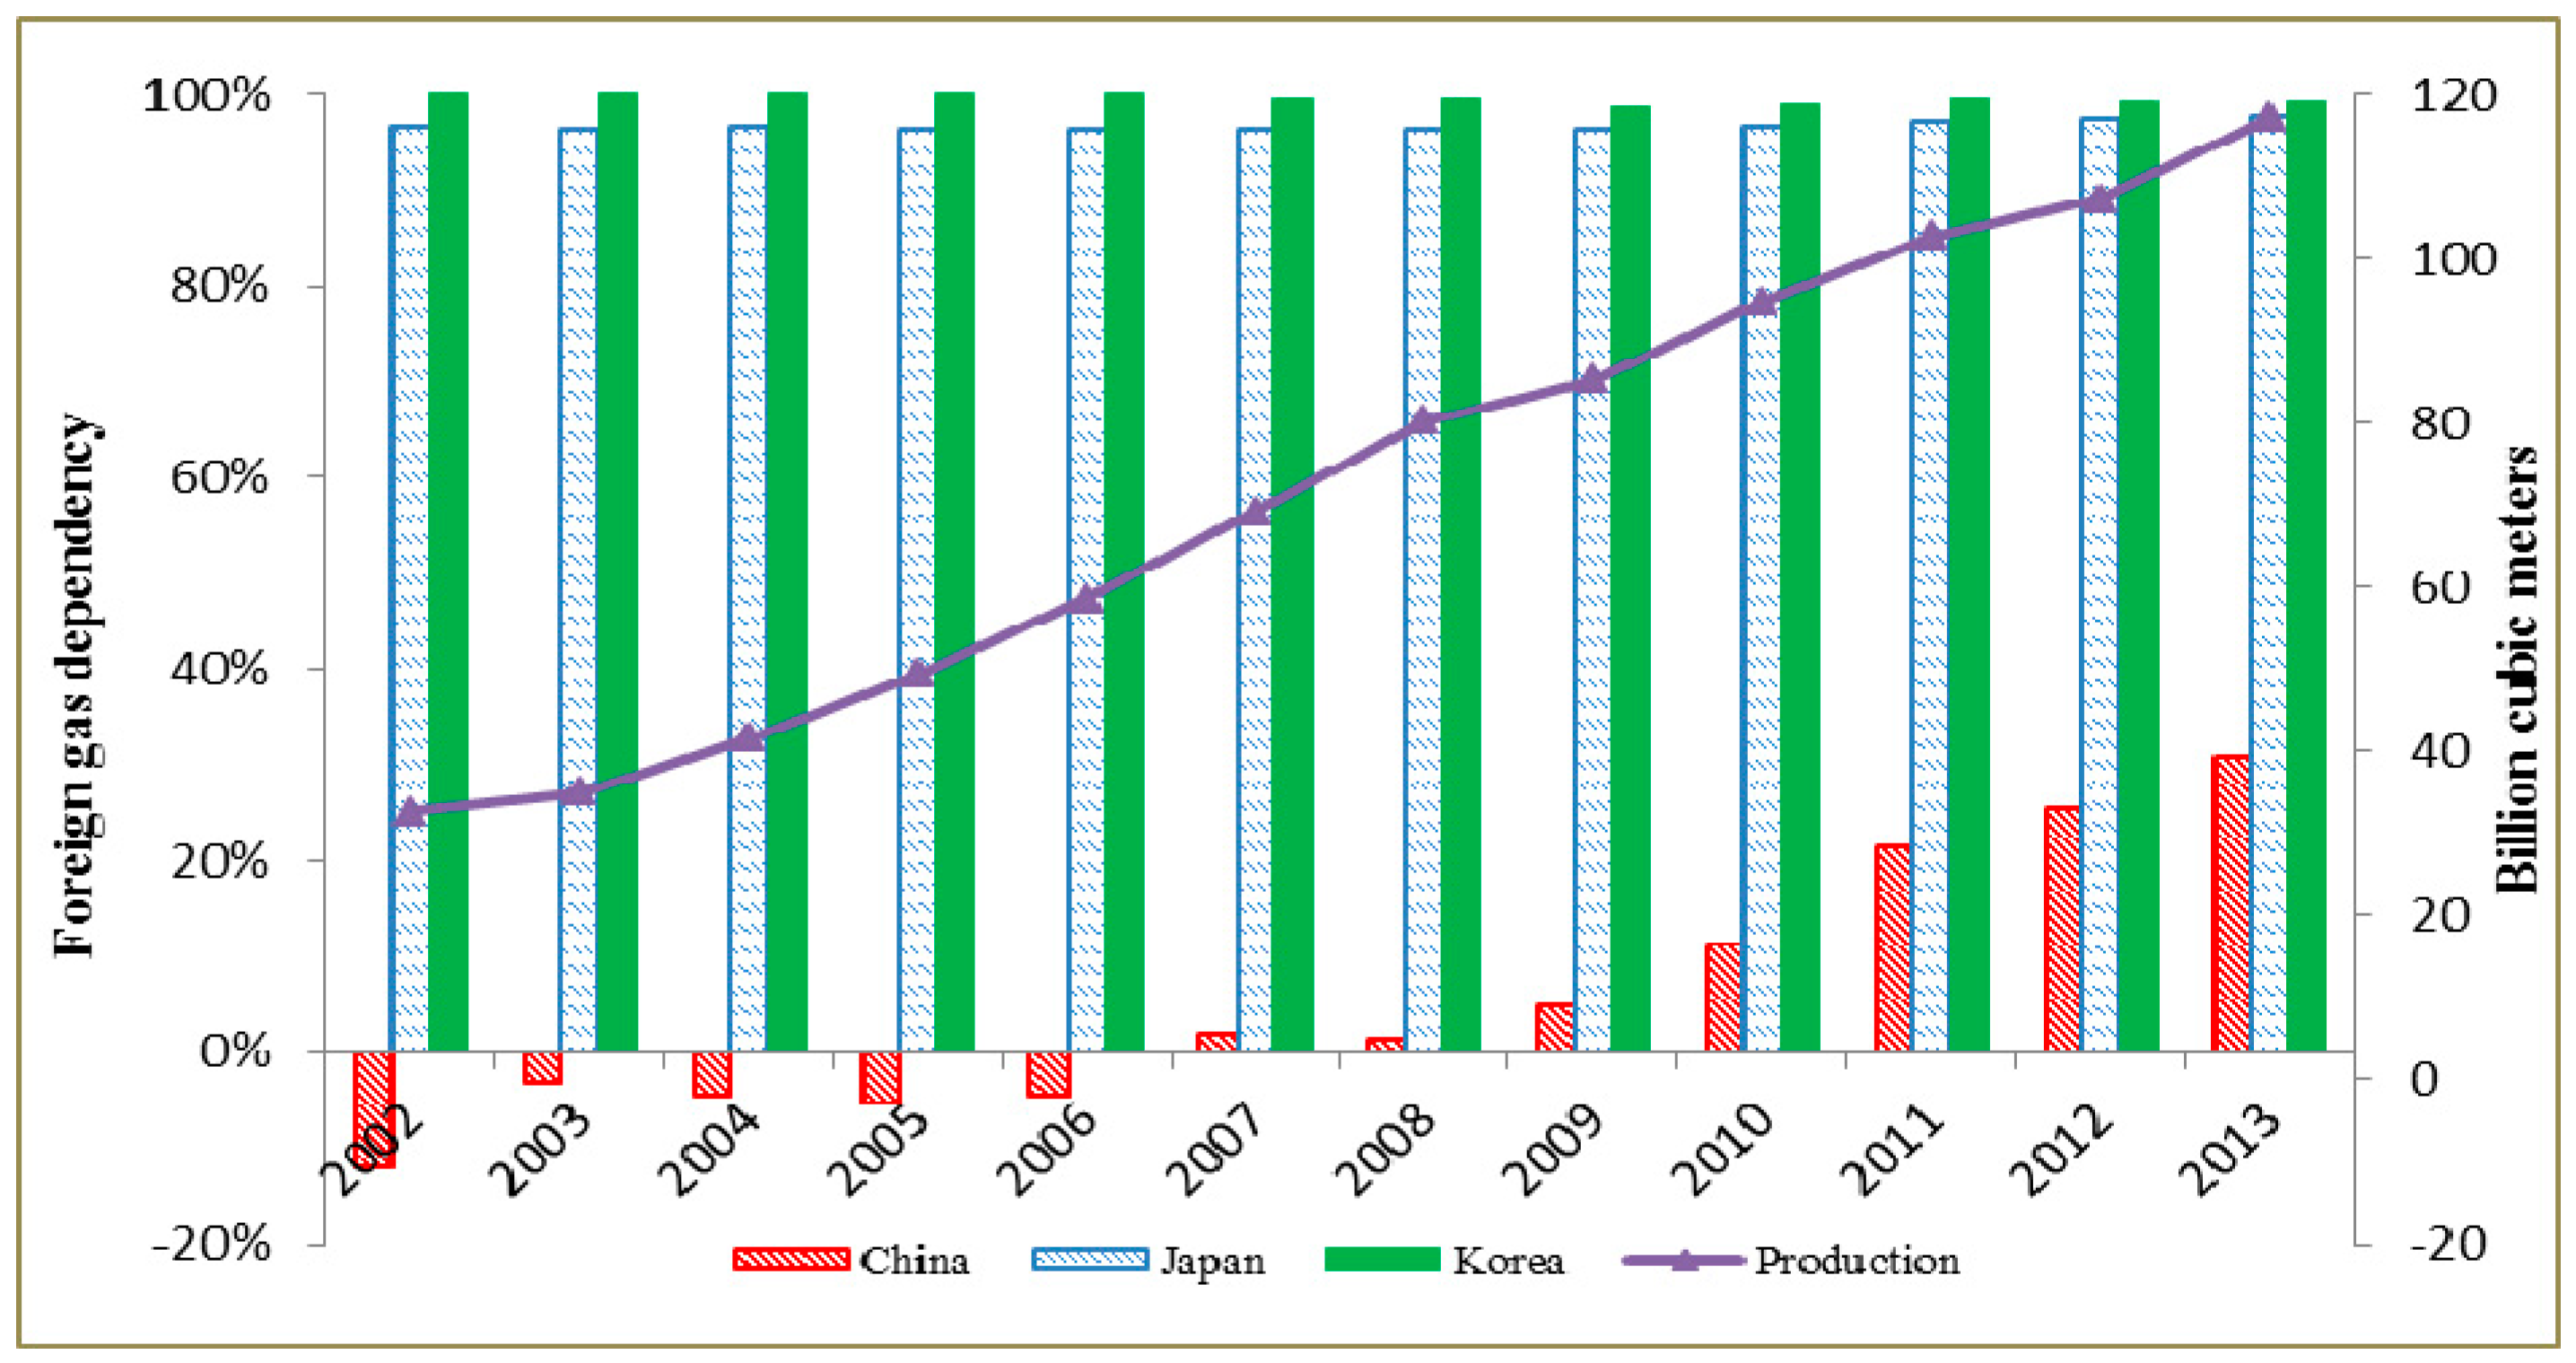
3.2.2. Differences in Domestic Natural Gas Production Capacity

China’s natural gas production has risen substantially over the past decade, more than tripling between 2002 and 2013 to 117.1 bcm [26]. China relies on domestic production to meet natural gas consumption, and Chinese foreign gas dependency is relatively low (Figure 9). China was a net gas exporter until 2007, and seasonal fluctuations in natural gas consumption are therefore met by adjusting domestic production. Japanese natural gas production, however, has been low and constant for over a decade due to declining reserves. In 2012, production was 3.3 bcm, which represents a decline from an average of 5.2 bcm over the past 10 years [27]. Japan is dependent on foreign sources for over 95 percent of its natural gas consumption. Thus, in cases of limited natural gas storage, seasonal fluctuations in consumption will inevitably lead to significant seasonal fluctuations in NGIs. Like Japan, South Korea must import natural gas to meet its consumption, which has nearly doubled over the previous decade [28].
Figure 9. Foreign gas dependency in China, Japan, and South Korea, plus China’s gas production [3,29].
Sustainability 07 01690 g009

3.2.3. Differences in the NGI Capacity

China has a brief NGI history, and its import facilities are flawed. In 2006, China built its first LNG receiving station, Dapeng LNG. With limited import capacity and rapid growth in demand, China’s natural gas pipelines and LNG facilities operate at full capacity [30]. When demand increases, imports cannot adjust due to limited import capacity. Therefore, the seasonality of Chinese NGIs is unclear. Japan and South Korea have longer histories of NGI and superior infrastructure. Japan began importing LNG from Alaska in 1969. Japan possesses 30 operating LNG import terminals with a total gas send-out capacity of 242.4 bcm/y, which exceeds demand [27]. South Korea began importing LNG in 1986 and possessed 197 LNG carriers with over 10000 m3 of cargo capacity per vessel in 2012. As indicated in Table 5, Japanese and South Korean LNG import capacities exceed that of China, and these countries therefore reflect seasonal changes in gas demand by adjusting their NGIs.
Table 5. Liquefied natural gas (LNG) import facilities in China Japan and South Korea in 2012 [31,32].
LNG carrierReceiving stationContainerStorage capacity (104 m3)
China6612209.5
Japan96301751532.4
Korea197460848.5

3.2.4. Differences in Natural Gas Price Sensitivity

Price sensitivity is mainly affected by the natural gas pricing mechanism. For a long time, China’s natural gas prices were determined by the government, which produced higher imported gas prices than domestic market prices. NGI companies are experiencing considerable losses due to relatively low terminal NGI prices [33,34,35]. Therefore, companies lack incentives to adjust NGIs for seasonality. However, the natural gas pricing mechanisms are relatively reasonable in Japan and South Korea. The Japanese government adheres to the cost, corporate compensation, and fairness principles [36]. In addition, the specific pricing formula and method are proposed by the Tokyo Gas Company, which possesses some autonomy. In South Korea, wholesale and retail natural gas prices are adjusted with changes in the price of LNG. Wholesale natural gas prices are adjusted monthly to reflect fluctuations in the import price and exchange rate. Retail natural gas prices can be adjusted on a quarterly basis when exchange rate and LNG price changes exceed plus or minus three percent of the overall price [37].

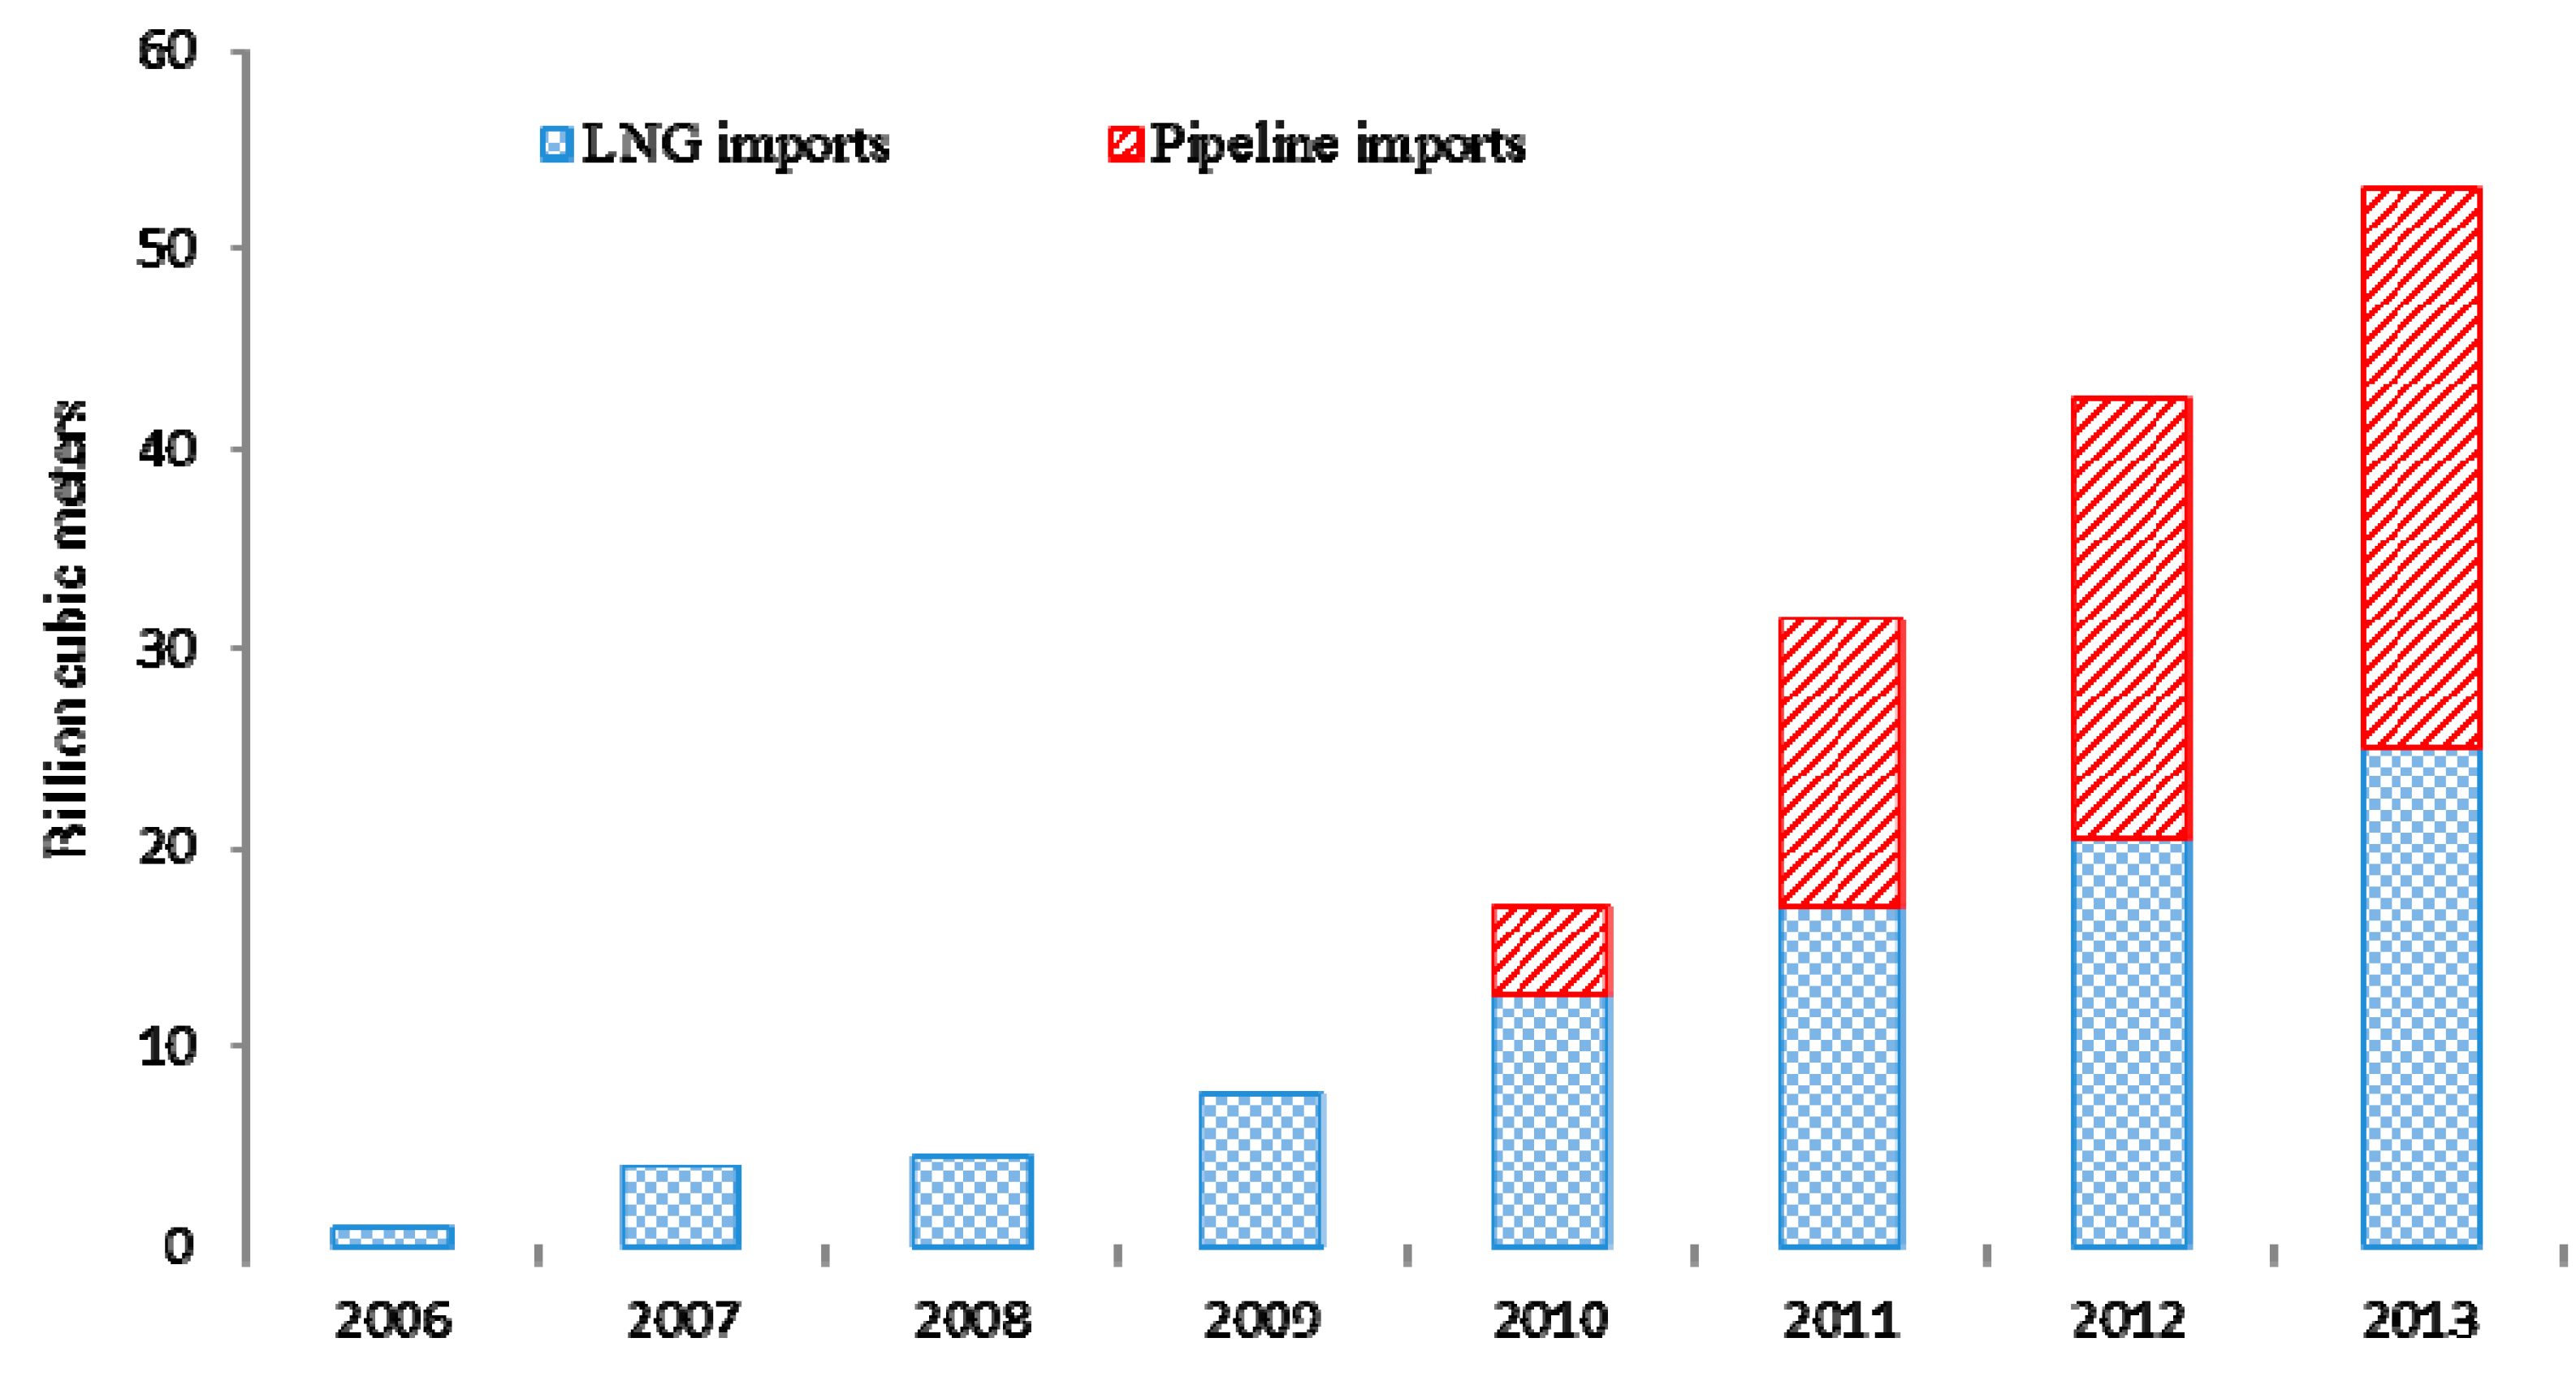
3.2.5. Differences in the Means of Transportation

The primary means of transportation for natural gas, it is thru the pipelines and LNG tankers. NGI by pipelines is less flexible than that by LNG tankers, which could meet the seasonal variations in NGI better. Over the past four years, China has ramped up imports of natural gas via pipelines as shown in Figure 10 [38]. The pipeline's first and second phases of China’s first international natural gas pipeline connection, the Central Asian Gas Pipeline began operations in 2010 and link to the second West-East pipeline at the Sino-Kazak border. In September 2013, China began importing gas from Myanmar when the China-Myanmar gas pipeline became operational. However, Japan and South Korea do not have any international gas pipeline connections, and must therefore import all gas via LNG tankers.
Figure 10. LNG imports and pipeline imports in China.
Sustainability 07 01690 g010

4. Discussion

4.1. Outlook on NGI Seasonality

The results for NGI seasonality presented here cannot simply be extrapolated into the future. Although climate factors will remain stable, policies will change and produce changes in seasonality.
(1) China: clear NGI seasonality might emerge
As China’s natural gas market matures, seasonal consumption characteristics will become clearer. Currently, natural gas consumption is concentrated in urban areas; however, with improving gas pipelines and other infrastructure and increasing rural incomes, the countryside might become one of China’s main natural gas consumer markets. In addition, due to the energy shortage in the 1950s, the Chinese government drew a boundary at the Qinling mountains-Huaihe River to limit central heating, which was only permitted north of the boundary [39]. Today, the continued use of the so-called north-south heating line, a product of the planned economy era when energy was a scarce resource, to determine the use of central heating is unreasonable. In recent years, many southern cities have experienced between 90 and 100 days of winter temperatures averaging below 6 °C [39]. Therefore, demand for heating in the southern cities has become more urgent. As gas heating in the countryside and South China gradually expands, wintertime natural gas consumption will increase further. To optimize the structure of natural gas consumption, in 2012, the Chinese government introduced a new natural gas use policy under which gas air conditioning was defined as a priority [40]. This policy could significantly increase both summer and winter demand for natural gas but especially summer demand.
Since the 1990s, the Chinese government has implemented several natural gas price reforms. The pricing method for natural gas has evolved from government pricing to a two-track implementation to prices set with government guidance and finally to the current market net back value method [35]. During the process of price reforms, pricing mechanisms have gradually improved, and China’s natural gas will realize market-oriented pricing in the near future. The rationalization of natural gas prices will gradually improve the enthusiasm of enterprises to import natural gas, which will promote the development and construction of import facilities.
In addition, China’s dependence on foreign natural gas is rising (Figure 10) and, according to the BP Energy Outlook 2030, will reach over 40 percent by 2030 [41]. Based on these predictions, we boldly infer that Chinese NGIs will display significant seasonal trends in the future.
(2) Japan: relatively stable seasonal NGI characteristics
Natural gas represented over 27 percent of electric generation in 2010 before the Fukushima nuclear disaster. Post-Fukushima, the majority of lost nuclear generation has been replaced with natural gas power plants. The government currently plans to construct additional gas powered generators, and three gas power plants with a capacity of 3.4 GW are scheduled to come online by 2016 [27]. Consequently, we anticipate that natural gas will continue to play a significant role in guaranteeing the supply of peak demand for electricity, especially during the summer. Additionally, because gas air conditioning has played an important role in mitigating peak electricity demand during the summer, the government will continue to support its development. Stable natural gas use policy will produce stable seasonal natural gas consumption characteristics, and accordingly, NGI seasonality will remain unchanged.
(3) South Korea: summer NGIs might increase
To narrow the gaps in the seasonal gas demand attributable to higher winter demand, the government has increased efforts to control demand while ensuring a stable supply. The Korean Ministry of Knowledge Economy released its tenth long-term plan to balance the supply and demand for gas over the period 2010–2024 on December 31, 2010 [42]. The plan calls for expanding the seasonal gas tariff to decrease winter demand and increase summer demand. The plan also proposes the introduction of gas air conditioning systems to increase summertime demand for gas. Summer NGIs will increase as summer demand increases.
Based on existing policies and climate factors, we anticipate that the seasonal characteristics of NGIs in China, Japan, and South Korea might converge in the future such that all three countries’ winter and summer NGIs would exceed spring and autumn imports.
(4) Effects of some important events on NGI seasonality
Over the long term, international gas market has certain uncertainty. On one hand, after the Fukushima incident, Japan increased its demand for fossil fuels, primarily natural gas. However, the effects of the accident on energy security were not restricted to Japan; the accident itself resulted in the loss of public acceptability of nuclear power and led countries, such as Germany and Italy, to immediately shut down some of the nuclear reactors or abandon plans to build new ones [43]. On the other hand, because of the shale gas revolution, the US natural gas market would be more self-sufficient and independent of the major exporters. If America exports natural gas to more countries, it will alleviate the natural gas tight supply situation. Due to the above reasons, it’s difficult to judge the gas price trend. If the gas price increases, importers will face more severe energy security risk and economic risk, they would be likely to take positive measures to balance seasonal imports, so the seasonality of NGI may become no significant. On the contrary, if the gas price decreases, less attention will be paid by importers on tackling the seasonal imbalances of NGI, which may lead to more obvious NGI seasonality.

4.2. Measures to Protect the Sustainability of NGI

Based on the seasonal differences among China, Japan, and South Korea and the reasons for those differences, some suggestions are provided to promote the sustainable development of NGI.
(1) Construction of import facilities
Due to its limited import capability, China’s NGIs did not exhibit seasonal fluctuations consistent with consumption. During the peak demand season (winter), imports did not increase, which produced gas shortages. Thus, to meet demand fluctuations, China should accelerate the construction of import infrastructure, including natural gas pipelines, LNG tankers, and LNG receiving terminals. Compared to China, Japan and South Korea possess stronger import capabilities but remain constrained in terms of how much LNG each can receive based on berthing, ship size, and other infrastructure limitations [27]. Thus, their import capabilities should be adjusted accordingly.
(2) Expansion of inter-season swaps
Inter-season swaps are executed by multiple natural gas buyers facing different demand patterns to reduce seasonal supply and demand gaps [44]. Such swaps primarily benefit buyers and can manage seasonal imbalances in NGIs, reduce storage costs, and improve the utilization efficiency of existing take-or-pay cargoes. South Korea currently engages in frequent swap transactions due to its tighter natural gas demand-supply balance during the winter. China and Japan should also seek inter-season swaps with other countries to meet their own seasonal demand.
(3) Construction of natural gas storage
Importing countries with significant seasonality should establish natural gas storage for utilization during peak demand. Gas storage capacity should be determined by both the extent of seasonal differences in import demand and elasticity of import capabilities. Larger gaps in seasonal import demand and inelastic import capacities imply the need for more peak gas storage, and vice versa. Optimized natural gas storage would greatly reduce the seasonal variations in NGIs and improve stability.
(4) Interoperation of remaining import facilities
Seasonal differences can cause import facilities to operate under conditions of shortage or oversupply. Importers should cooperate to obtain corresponding use rights. An importer with facilities in shortage countries could pay equipment fees to an importer in an oversupply country to not only meet their demand for NGIs but also improve the utilization efficiency of facilities on the supply side.
(5) Development of short-term spot trading
International trade in natural gas has been dominated by long-term contracts, in which buyers are obliged to import a fixed quantity of natural gas over a 15–25 year period regardless of supply or demand fluctuations [4]. Most long-term natural gas contracts include destination clauses that restrict buyers from reselling cargo to third parties. These clauses pose barriers to buyer profit maximization through resale. However, spot purchases could increase importer choices, inject liquidity into markets, and allow buyers to hedge their financial and physical risks. Currently, the NGIs in China, Japan, and South Korea are dominated by long-term contracts [4], so it is advisable for them to exploit spot purchases to cope with the demand fluctuations that long-term contracts cannot handle.
(6) Establishment of a natural gas futures market
It would benefit countries with significant demand to establish a natural gas futures market, especially countries that experience seasonal fluctuations in demand for NGIs and for which price risk is an important factor. By establishing a pre-determined price, these countries avoid paying peak prices during peak import times. In addition, the first countries to establish a futures market could negotiate favorable futures contracts according to their import seasonality, form their trade benchmark prices, improve their bargaining power, and enhance their discourse in the international gas market.

5. Conclusions

The purpose of this study was to detect, illustrate and compare NGI seasonality in three major Northeast Asian countries, namely, China, Japan, and South Korea. The X-12-ARIMA model is used to analyze monthly and quarterly data. The following results are observed:
(1)
NGIs in China do not exhibit identifiable monthly or quarterly seasonality, while NGIs in South Korea and Japan are clearly seasonal.
(2)
In Japan, NGIs exceed average levels in January, February, July, August, September, and December; that is, Japan usually imports more natural gas during the winter and summer.
(3)
In South Korea, NGIs exceed average levels in January, February, March and December. In other words, South Korea typically imports more natural gas during the winter.
From the above results, we could found (i) the seasonality of NGI mainly stems from the seasonality of natural gas consumption; (ii) domestic natural gas production capacity, NGI capacity, price sensitivity, and means of transportation could have some effect on NGI seasonality, for example, the factors make NGI seasonality unclear in China; and (iii) the seasonality of NGI might change due to policy factors, for example, Japanese NGIs during summer are much higher, due to the policy about gas air conditioning systems.
The above results are also useful for designing energy policies to promote healthy and sustainable NGI development. In brief, a deeper understanding of the seasonal variations of NGI, gained by analyzing the seasonal patterns over the year, may help national governments to prevent natural gas shortages and decrease the cost of NGI by designing suitable NGI policies that take into account the seasonal patterns found in the countries. For example, China and Japan could seek inter-season swaps with other countries to meet their own seasonal demand.
We must emphasize that importers should note that the long-term seasonality of NGIs might change due to policy factors. For example, the South Korean government proposed the expansion of seasonal tariffs, which might increase summer NGI. Beside, over the long term, global warming caused by greenhouse gas emissions is also likely to dramatically alter people’s natural gas consumption habits. For example, “warmer winters” might significantly reduce natural gas consumption for heating during winter, and NGIs will decrease accordingly. Of course, this is beyond the scope of this paper, and we propose this conjecture to provoke thought.

Acknowledgments

This work is supported by the Natural Science Foundation of China (No. 71273277) and Philosophy and Social Sciences Major Research Project of Ministry of Education (No. 11JZD048), which are gratefully acknowledged.

Author Contributions

All the authors have co-operated for the preparation of this work. Zhaoyang Kong and Zhongbing Zhou drafted the main part of the paper. Final review, including final manuscript rectifications, was done by Xiucheng Dong. All authors have read and approved the final manuscript.

Appendix

Figure A1. The correlogram of China’s monthly NGI series.
Sustainability 07 01690 g011
Figure A2. The correlogram of China’s quarterly NGI series.
Sustainability 07 01690 g012
Figure A3. The correlogram of Japan’s monthly NGI series.
Sustainability 07 01690 g013
Figure A4. The correlogram of Japan’s quarterly NGI series.
Sustainability 07 01690 g014
Figure A5. The correlogram of South Korea’s monthly NGI series.
Sustainability 07 01690 g015
Figure A6. The correlogram of South Korea’s quarterly NGI series.
Sustainability 07 01690 g016

Conflicts of Interest

The authors declare no conflict of interest.

References

  1. Cabalu, H. Indicators of security of natural gas supply in Asia. Energy Policy 2010, 38, 218–225. [Google Scholar]
  2. Ma, Y.; Li, Y. Analysis of the supply-demand status of China’s natural gas to 2020. Pet. Sci. 2010, 7, 132–135. [Google Scholar] [CrossRef]
  3. BP. Statistical Review of World Energy. Available online: http://www.bp.com/content/dam/bp/pdf/statistical-review/statistical_review_of_world_energy_2013.pdf (accessed on 2 February 2015).
  4. Vivoda, V. Natural gas in Asia: Trade, markets and regional institutions. Energy Policy 2014, 74, 80–90. [Google Scholar] [CrossRef]
  5. Korea Energy Economics Institute. Energy Statistics. Available online: http://www.keei.re.kr/main.nsf/index_en.html (accessed on 25 May 2014).
  6. Duan, Z.F.; Zhang, J.M. The picture of China’s LNG import. Marit. China 2014, 7, 34–36. (In Chinese) [Google Scholar]
  7. Zhou, Z.-B.; Dong, X.-C. Analysis about the seasonality of China’s crude oil import based on X-12-ARIMA. Energy 2012, 42, 281–288. [Google Scholar] [CrossRef]
  8. Sailor, D.J.; Muñoz, J.R. Sensitivity of electricity and natural gas consumption to climate in the U.S.A.—Methodology and results for eight states. Energy 1997, 22, 987–998. [Google Scholar] [CrossRef]
  9. Mitchell, J.D.; Li, L.O.; Izan, H.Y. Idiosyncrasies in Australian petrol price behaviour: Evidence of seasonalities. Energy Policy 2000, 28, 243–258. [Google Scholar] [CrossRef]
  10. Wang, S.P.; Wu, Z.X. Analysis about Seasonal Fluctuation of Brent Crude Oil Price. Chin. J. Manag. Sci. 2008, 16, 48–52. (In Chinese) [Google Scholar]
  11. Wang, S.P.; Zheng, W.; Wu, Z.X.; Ou-Yang, Z.H. Analysis about seasonal fluctuation of Dubai crude oil price based on X-12-ARIMA method. Math. Pract. Theory 2009, 39, 44–51. (In Chinese) [Google Scholar]
  12. Filippín, C.; Larsen, S.F. Analysis of energy consumption patterns in multi-family housing in a moderate cold climate. Energy Policy 2009, 37, 3489–3501. [Google Scholar] [CrossRef]
  13. Moosa, I.A. Modeling Japanese oil imports: A seasonal cointegration approach. Jpn. World Econ. 1996, 8, 279–290. [Google Scholar] [CrossRef]
  14. The Japan Gas Association. Gas facts in Japan 2013. Available online: http://www.gas.or.jp/gasfacts_e/#page_num=3 (accessed on 10 May 2014).
  15. X-12-ARIMA Reference Manual, Version 0.3. Available online: http://www.doc88.com/p-0012079023702.html (accessed on 8 September 2013).
  16. Zheng, W. Analysis about the economic effects of holidays based on X-12-ARIMA. Master’s Thesis, North China University of Technology, Beijing, China, 2010. [Google Scholar]
  17. Box, G.E.; Jenkins, G.M. Time Series Analysis: Forecasting and Control; Holden-Day: San Francisco, CA, USA, 1976. [Google Scholar]
  18. Manna, M.; Peronaci, R. Seasonal Adjustment. Available online: https://www.ecb.europa.eu/pub/pdf/other/statseasonaladjustmenten.pdf (accessed on 18 October 2013).
  19. Vitullo, S.R.; Brown, R.H.; Corliss, G.F.; Marx, B.M. Mathematical models for natural gas forecasting. Can. Appl. Math. Q. 2009, 17, 807–827. [Google Scholar]
  20. National Bureau of Statistics of China. China Energy Statistical Yearbook 2004–2013; China Statistics Press: Beijing, China, 2004–2013. [Google Scholar]
  21. Kanagawa, M.; Nakata, T. Analysis of the impact of electricity grid interconnection between Korea and Japan—Feasibility study for energy network in Northeast Asia. Energy Policy 2006, 34, 1015–1025. [Google Scholar] [CrossRef]
  22. Jin, J.P.; Len, C.Z.; Jiang, Y.J. Tiered Pricing for Household Electricity in US, Japan and Korea and Useful Insights for China. Prices Mon. 2012, 11, 23–28. (In Chinese) [Google Scholar]
  23. Yun, W.C.; Zhang, Z.X. Electric power grid interconnection in Northeast Asia. Energy Policy 2006, 34, 2298–2309. [Google Scholar] [CrossRef]
  24. Lang, J.L.; Cheng, S.Y.; Zhou, Y.; Zhao, B.B.; Wang, H.Y.; Zhang, S.J. Energy and Environmental Implications of Hybrid and Electric Vehicles in China. Energies 2013, 6, 2663–2685. [Google Scholar] [CrossRef]
  25. Du, D.Y.; Huang, H. Experience and Enlightenment of Gas Generation Abroad. Shanghai Gas 2013, 2, 23–26. (In Chinese) [Google Scholar]
  26. U.S. Energy Information Administration (EIA). Energy analysis for China. Available online: http://www.eia.gov/countries/cab.cfm?fips=CH (accessed on 8 September 2014).
  27. U.S. Energy Information Administration (EIA). Energy analysis for Japan. Available online: http://www.eia.gov/countries/country-data.cfm?fips=JA (accessed on 8 September 2014).
  28. U.S. Energy Information Administration (EIA). Energy analysis for South Korea. Available online: http://www.eia.gov/countries/country-data.cfm?fips=KS (accessed on 8 September 2014).
  29. International Energy Agency. Natural gas statistics. Available online: http://www.iea.org/statistics/topics/naturalgas/ (accessed on 8 May 2014).
  30. Dong, X.C.; Li, J.C. Origins and countermeasures for “gas famine” in China. Nat. Gas Ind. 2010, 30, 116–118. (In Chinese) [Google Scholar]
  31. Lu, P. LNG shipping safety evaluation in China. Master’s Thesis, Dalian Maritime University, Dalian, China, 2013. [Google Scholar]
  32. Qian, X.K. The development report of oil and gas industry at home and abroad in 2012. Available online: http://www.amazon.cn/gp/switch-language/product/B00DKKKTYE/ref=topnav_switchLang?ie=UTF8&language=en_CN (accessed on 3 February 2015). (In Chinese)
  33. Yang, J.J. Study on China Natural Gas Pricing Mechanism. Master’s Thesis, East China Normal University, Shanghai, China, 2012. [Google Scholar]
  34. Liu, Y.J. An analysis of “gas famine” in China from the perspective of natural gas industrial chain. Nat. Gas Ind. 2010, 30, 119–122. (In Chinese) [Google Scholar]
  35. Yin, J.P. Analysis of China’s reform and improvement on natural gas price. Price Theory Pract. 2014, 3, 13–16. (In Chinese) [Google Scholar]
  36. Peng, W.Y.; Zhang, Y.Y. Japan’s natural gas price adjustment mechanism research and experience for reference. Price Theory Pract. 2011, 10, 43–44. (In Chinese) [Google Scholar]
  37. Chen, M.S. The enlightenment of foreign management experience in natural gas prices to Fujian. Dev. Res. 2006, 4, 56–58. (In Chinese) [Google Scholar]
  38. Qian, X.K. The development report of oil and gas industry at home and abroad in 2013. Available online: http://item.jd.com/1108811118.html (accessed on 3 February 2015). (In Chinese)
  39. Li, D.; Zhang, H.L. The Demand Status and Technology Analysis of Southern Heating. Refrig. Cond. 2013, 27, 621–625. (In Chinese) [Google Scholar]
  40. Hu, A.L. An interpretation of the new-version natural gas utilization policies. Nat. Gas Ind. 2013, 33, 110–114. (In Chinese) [Google Scholar]
  41. BP. BP Energy Outlook 2030. Available online: http://www.bp.com/content/dam/bp/pdf/Energy-economics/Energy-Outlook/BP_Energy_Outlook_Booklet_2013.pdf (accessed on 2 February 2015).
  42. Moonjong, Y. South Korea’s 10th long-term natural gas supply and demand plan (summary). Available online: https://eneken.ieej.or.jp/data/3822.pdf (accessed on 23 January 2014).
  43. Hayashi, M.; Hughes, L. The Fukushima nuclear accident and its effect on global energy security. Energy Policy 2013, 59, 102–111. [Google Scholar] [CrossRef]
  44. Koyama, K. Prospect of Natural Gas Market in East Asia. Available online: http://eneken.ieej.or.jp/en/data/pdf/284.pdf (accessed on 27 June 2014).

