Article

Quantitative Evaluation of Settlement Sustainability Policy (QESSP); Forward Planning for 26 Irish Settlements

by
Brian G. Fitzgerald
1,*,
Travis O'Doherty
2,
Richard Moles
3 and
Bernadette O'Regan
3
1
Environment Department, Limerick City and County Council, County Hall, Dooradoyle, Limerick, Ireland
2
South West Regional Planning Authority, Innishmore, Ballincollig, Co. Cork, Ireland
3
Department of Chemical and Environmental Science, Centre for Environmental Research, University of Limerick, Limerick, Ireland
*
Author to whom correspondence should be addressed.
Sustainability 2015, 7(2), 1819-1839; https://0-doi-org.brum.beds.ac.uk/10.3390/su7021819
Submission received: 10 November 2014 / Accepted: 5 February 2015 / Published: 10 February 2015

Abstract

:
Urban areas are increasingly associated with negative environmental impacts due to concentrated resource consumption; however urban areas also offer economies of scale in terms of service provision. There is no accepted mechanism to aid decision-makers in policy selection to determine where to promote population growth or how to select settlement specific policies to improve sustainability of urban areas. There is strong political desire for methods assessing policy implementation impact on overall sustainability targets, but this has proved challenging, as views on the meaning of sustainability vary, and methods developed satisfying scientists’ needs for rigor are deemed too complex and inadequately transparent by decision-makers. Sustainability measurement is vital to check whether a new policy, decision or technical innovation is helpful in enhancing sustainability. By 2055 estimates indicate that 75 percent of the world population will live in urban areas, highlighting the importance of promoting low cost policy decisions providing greatest environmental benefit, with short implementation timescale. This paper describes an evidence-based method developed and piloted to address these drivers and provide a decision support system for planners and policy-makers developed for Irish settlements with population range 500–20,000, which may have application elsewhere.

1. Introduction

Sustainability has become a politically correct, all-encompassing term. For the purposes of this research the following definition of sustainability is used; doing more with less to improve livability within urban settlements and reduce associated environmental impact [1]. A major challenge facing the world is the need to enhance sustainability urgently as we face the inter-related challenges of climate change, dependence on fossil fuels, meeting our energy needs, food shortages and growing population [2].
Public interest in sustainability was increasing and consumer attitudes were often positive until the 2008 global financial crisis. However, Ashford, et al. (2012) reports that since the global financial crisis there is a preoccupation with economic growth and finance, and it is still unknown what effect this will have on the environment and attitudes towards the environment. Declining purchasing power and earning capacity may limit wasteful consumption, however behavior is not always consistent with attitudes [3,4]. Consumption patterns in developed countries are unsustainable [5]. Consumers continue to engage in energy intensive lifestyles. Policies are urgently required to decouple economic growth from environmental degradation [6,7]. While technological development is crucial, significant gains are available by wider adoption of existing proven technologies through better planning and behavior change, on the basis that if such technologies were used to their full extent there would be a large reduction in human impact on the environment and dependency on fossil fuels [8,9]. Changing behaviors requires innovative policies and interventions across a broad range of sectors and there is widespread acknowledgment of the need to tackle unsustainable environmental behaviors at all levels in a holistic manner [10,11,12].
Policy-makers are encouraged to learn from what has worked to apply best practice across all sectors [13,14]. Robust evidence is required and linkages between researchers and policy-makers need to be further strengthened [15,16]. There is a recognized need for more empirical studies on policy appraisal [17,18]. Evidence based policy-making has been adopted to facilitate a more rational and systematic process, representing a departure from ideological opinion based policy-making [19,20]. The primary goal of evidence based policy-making is to improve reliability of advice to policy-makers, based on the assumption that knowledge of what works reduces risk associated with innovative policy-making [21,22]. While there is a general consensus that robust evidence is strongly beneficial to the policy making process, putting the concept into practice is proving difficult in many countries and methods are still evolving [16,23]. There is strong political desire for comprehensive assessment of changes in economic, environmental, and social conditions, but this has proved challenging because of competing sustainability conceptualizations [24,25]. It is vital that we are able to measure sustainability, to evaluate effects of new policy, decision or technical innovation [26,27]. Planning for sustainability and promotion of policy which addresses climate change is required at regional, city and neighborhood level [28]. Given recent confirmation by the Intergovernmental Panel on Climate Change (IPCC) that “human interference with the climate system is occurring, and climate change poses risks for human and natural systems” and that mitigation measures are required to prevent dangerous anthropogenic interference with the climate system [29,30]; the need for evidence based environmental sustainability policy evaluation methods for planners and policy-makers promoting rational, economic, accelerated decision-making is now more urgent than ever.
The need to reduce environmental impact of urban areas is unquestionable; what is in question, however, is exactly how environmental policy evaluation methods can assess sustainability of urban development policy [31]. To promote rational, economic, accelerated decision-making in urban areas, prioritisation of policies must direct efforts efficiently towards relevant sectors [32]. Decision-makers recognise the enormous task but are restricted in making better decisions by lack of evidence base and “first jumper” risk [12,33]. Promotion of sustainability requires re-examination of development plan policies and practices [34]. In order to realize sustainable urban development, it is required that sustainability must become a decision-making stratagem rather than merely a discussion [35]. This paper describes a method to improve decision-making developed in an Irish context, and which may have application elsewhere.
Policy-making to promote sustainable development is a complex task and it has proved exceedingly difficult to implement a feasible set of targets, actions and measures which result in greater urban sustainability [36,37]. A lack of coordinated decision-making for transport, land use and environmental policy has resulted in a compartmentalized approach to policy-making, leading to inefficiencies [38,39,40,41]. Although availability of sustainability assessment tools is rapidly growing, little information is available on actual tool choice [42]. Different methods, instruments and techniques for quantifying settlement sustainability have been developed [43]. However, a literature review identified no universally accepted method for evaluating settlement sustainability policy, rather it identified that methods for quantifying settlement sustainability are usually piecemeal and often based on single issue criteria [44]. Additionally, available literature did not identify an existing settlement sustainability policy evaluation method designed for Irish application. It was therefore decided to develop a novel policy evaluation method; Quantitative Evaluation of Settlement Sustainability Policy (QESSP) (Figure 1), which could function as a decision support system to direct application of indicators, metrics and testing within policy evaluation. The development of QESSP is part of a longer term project to evaluate settlement sustainability policy [9,45,46,47,48,49]. Datasets from previous projects are available on the Irish Environmental Protection Agency (EPA) website (erc.epa.ie/safer/). The challenge of the Irish case study presented here was to develop an affordable and accessible method of evaluating sustainability policy which would be accepted and used by local authorities with little history of quantitative sustainability analysis, who in recent years have received reduced central government funding and have been forced to pursue austerity policies.
Figure 1. Steps in application of Quantitative Evaluation of Settlement Sustainability Policy (QESSP).
Sustainability 07 01819 g001

2. Methods

2.1. Case Study Description

Thirty one local authorities administer local government in Ireland. One of the functions of these local authorities is to act as a planning authority for its geographical area. QESSP was piloted from 2012–2013 in Cork County Council; the largest local authority area in Ireland; approximate population 400,000, divided between a metropolitan area, 26 towns and rural surroundings. The 26 settlements were selected for study as these comprised the total towns within the Cork County Council administrative area and were varied in type and characteristics providing differing options for policy implementation. Results from QESSP piloting are informing the current Cork County Development Plan review, a strategic legal document outlining county planning policy [50]. QESSP is a flexible decision support system for planners and policy-makers. For the purposes of this research a policy is defined as a course or principle of action which could lead to improvement in a facet of urban sustainability. There is always a bias in developing policy evaluation models as the user’s values and priorities influence understanding of the study area, which influences choice of methods and indicator set selection, which in turn affects outputs. The research driver for the pilot study was to determine which of the 26 settlements could accommodate further population, which settlements should be restricted from further growth and which sustainability policies were most applicable in each settlement. Each of the 26 settlements have the same planning backgrounds/strategies in that they are managed by a pauperized local authority with little history of planning for sustainability, seeking to promote austerity based policy. The method determines sustainability of settlements by population distributional equity and environmental limitations based upon maximization and constraint indicators developed. Since carrying out this research, Mori and Yamashita have published literature supporting this approach to sustainability quantification [51].

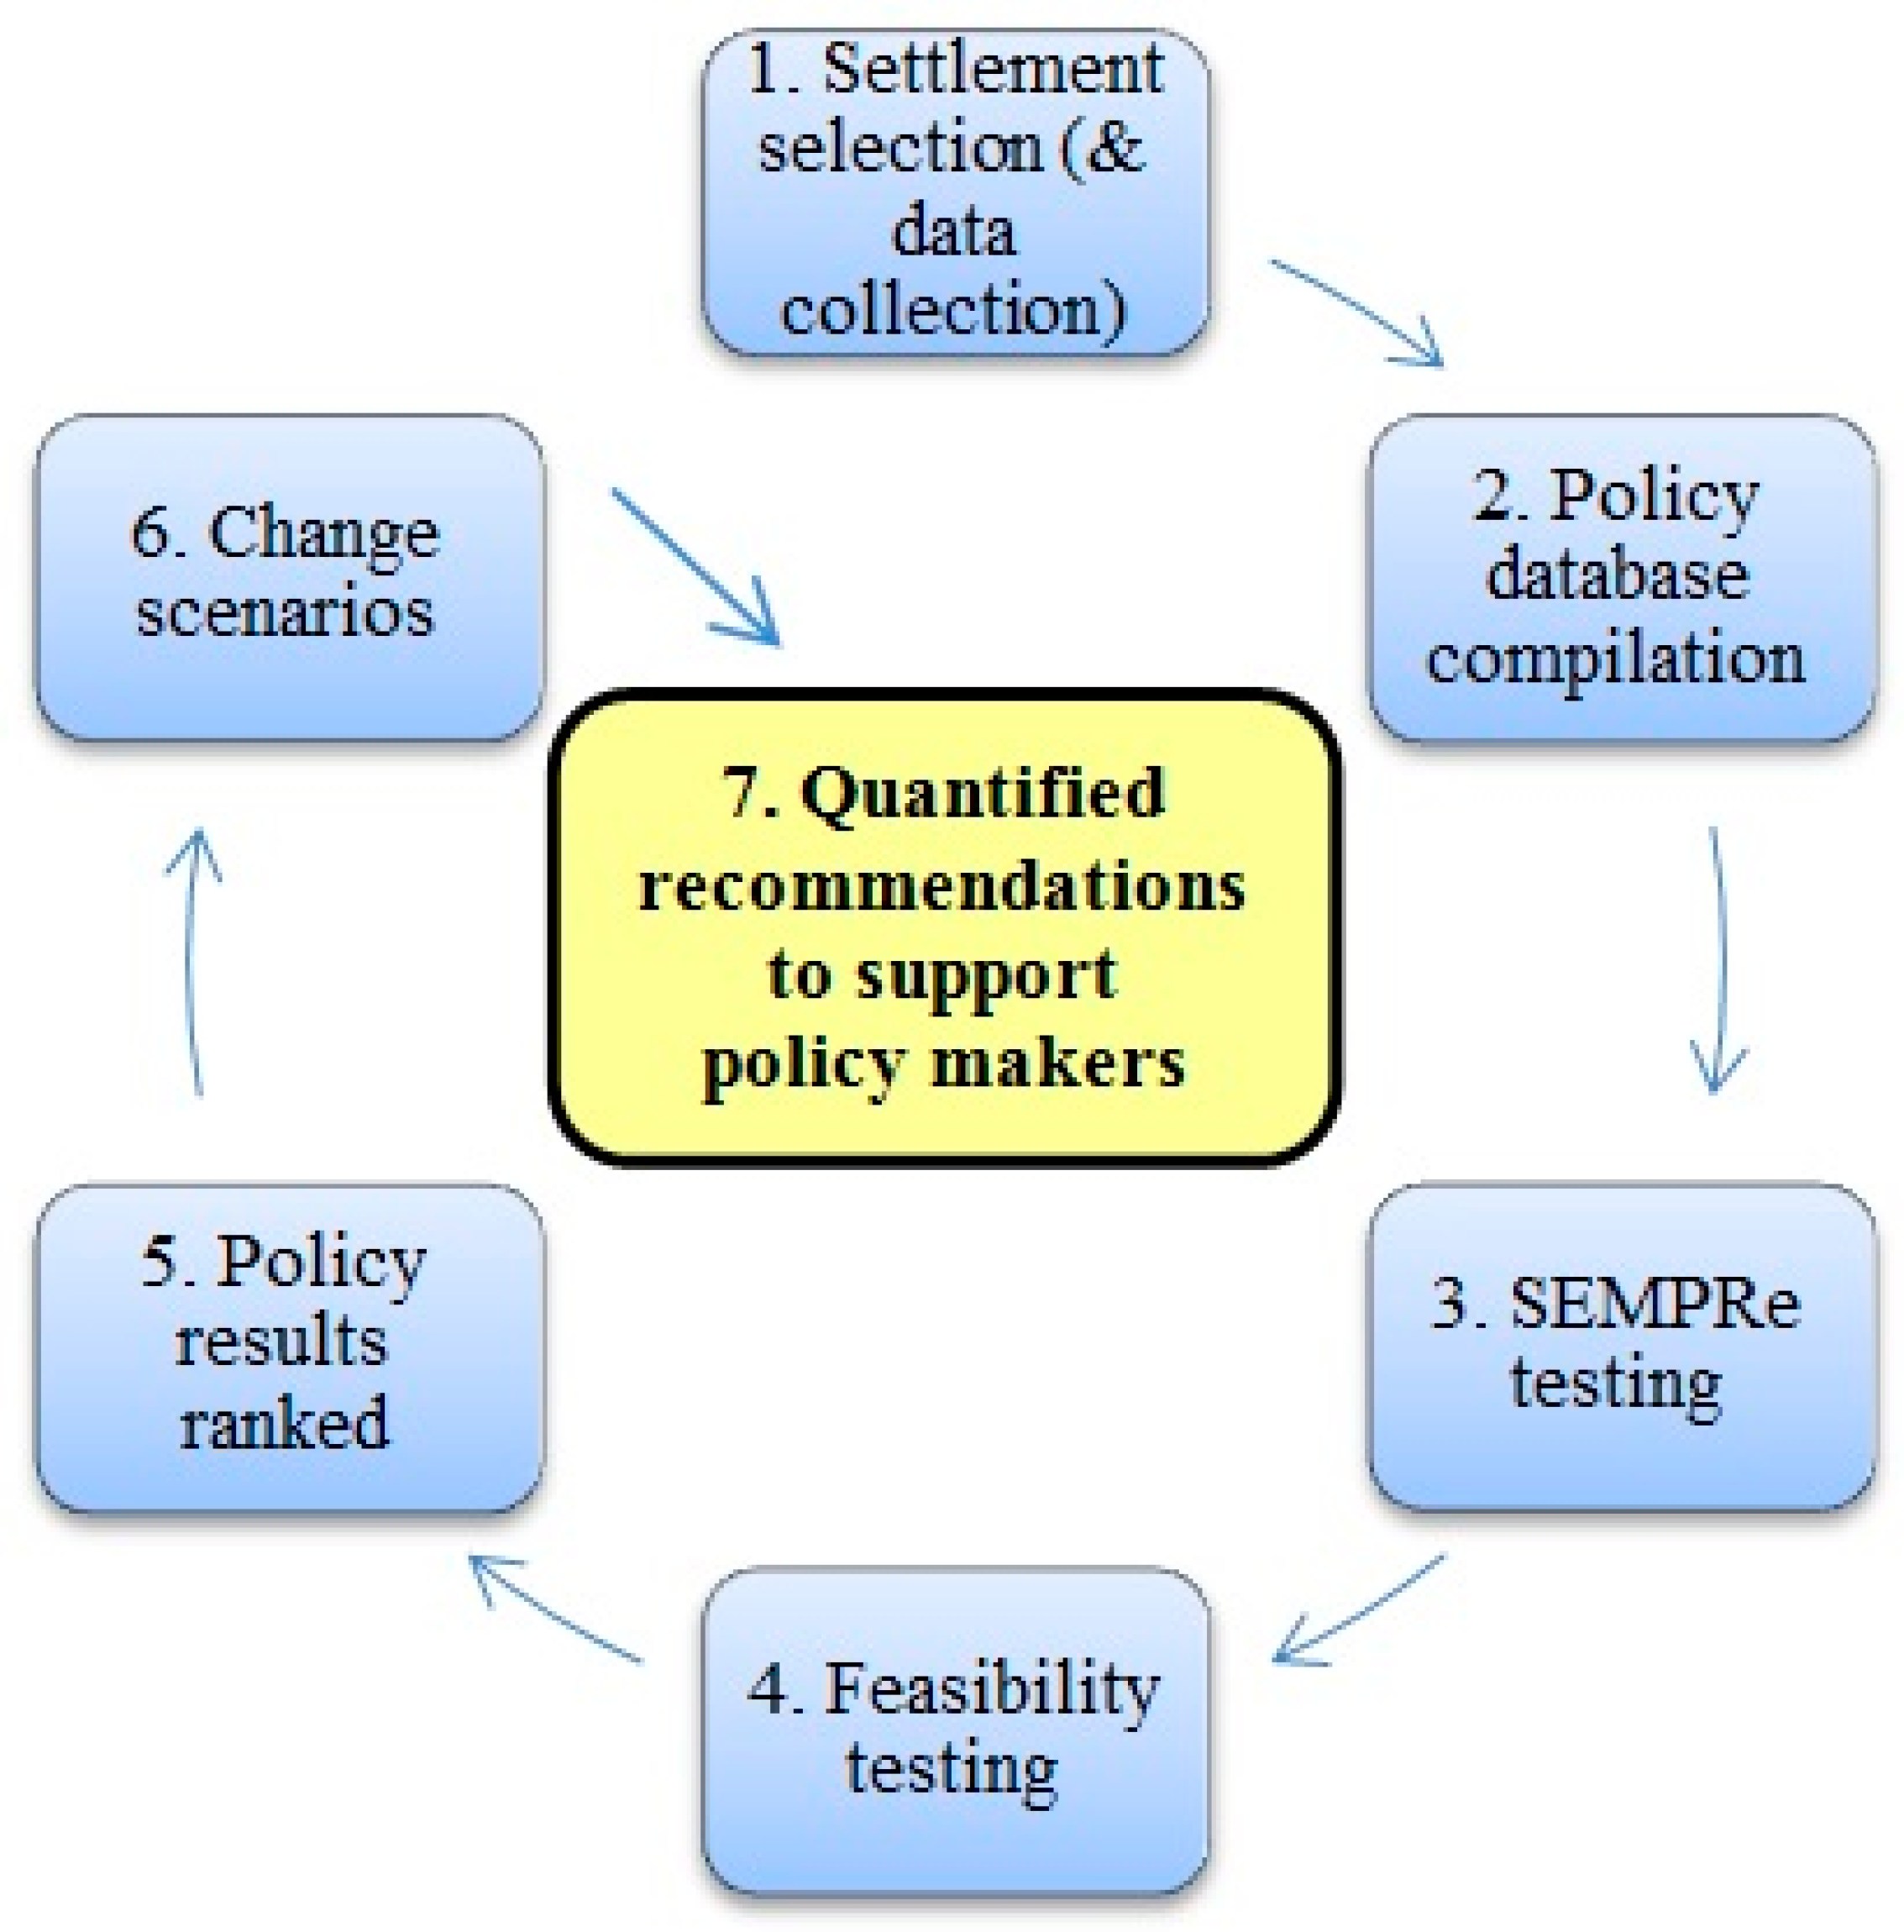
2.2. QESSP Methodology

QESSP outlines a broad approach to settlement sustainability policy evaluation. Each component can be used in isolation as required; their development and added knowledge contribution to the area of policy evaluation is discussed in seven steps. Although QESSP is a flexible method with wide applicability, the seven steps described here relate to the piloting study. Given the priorities of the pilot study (determining appropriate population densities and policies for implementation in individual settlements) and given that indicators and sustainability arenas were chosen based upon end-user requirements and availability of quantifiable data, the choices made are not presented as a definitive approach to sustainability assessment but rather as a responsible, transparent, comprehensive and evidence based approach to forward planning by a pauperized local authority with little history of planning for sustainability. End-user requirements may vary; in the case of the piloting study, the end-user (Cork County Council Planning Department) requirements were that the data was readily available, did not require specialized expertise for interpretation, and dealt with sustainability issues within their control.
(1)
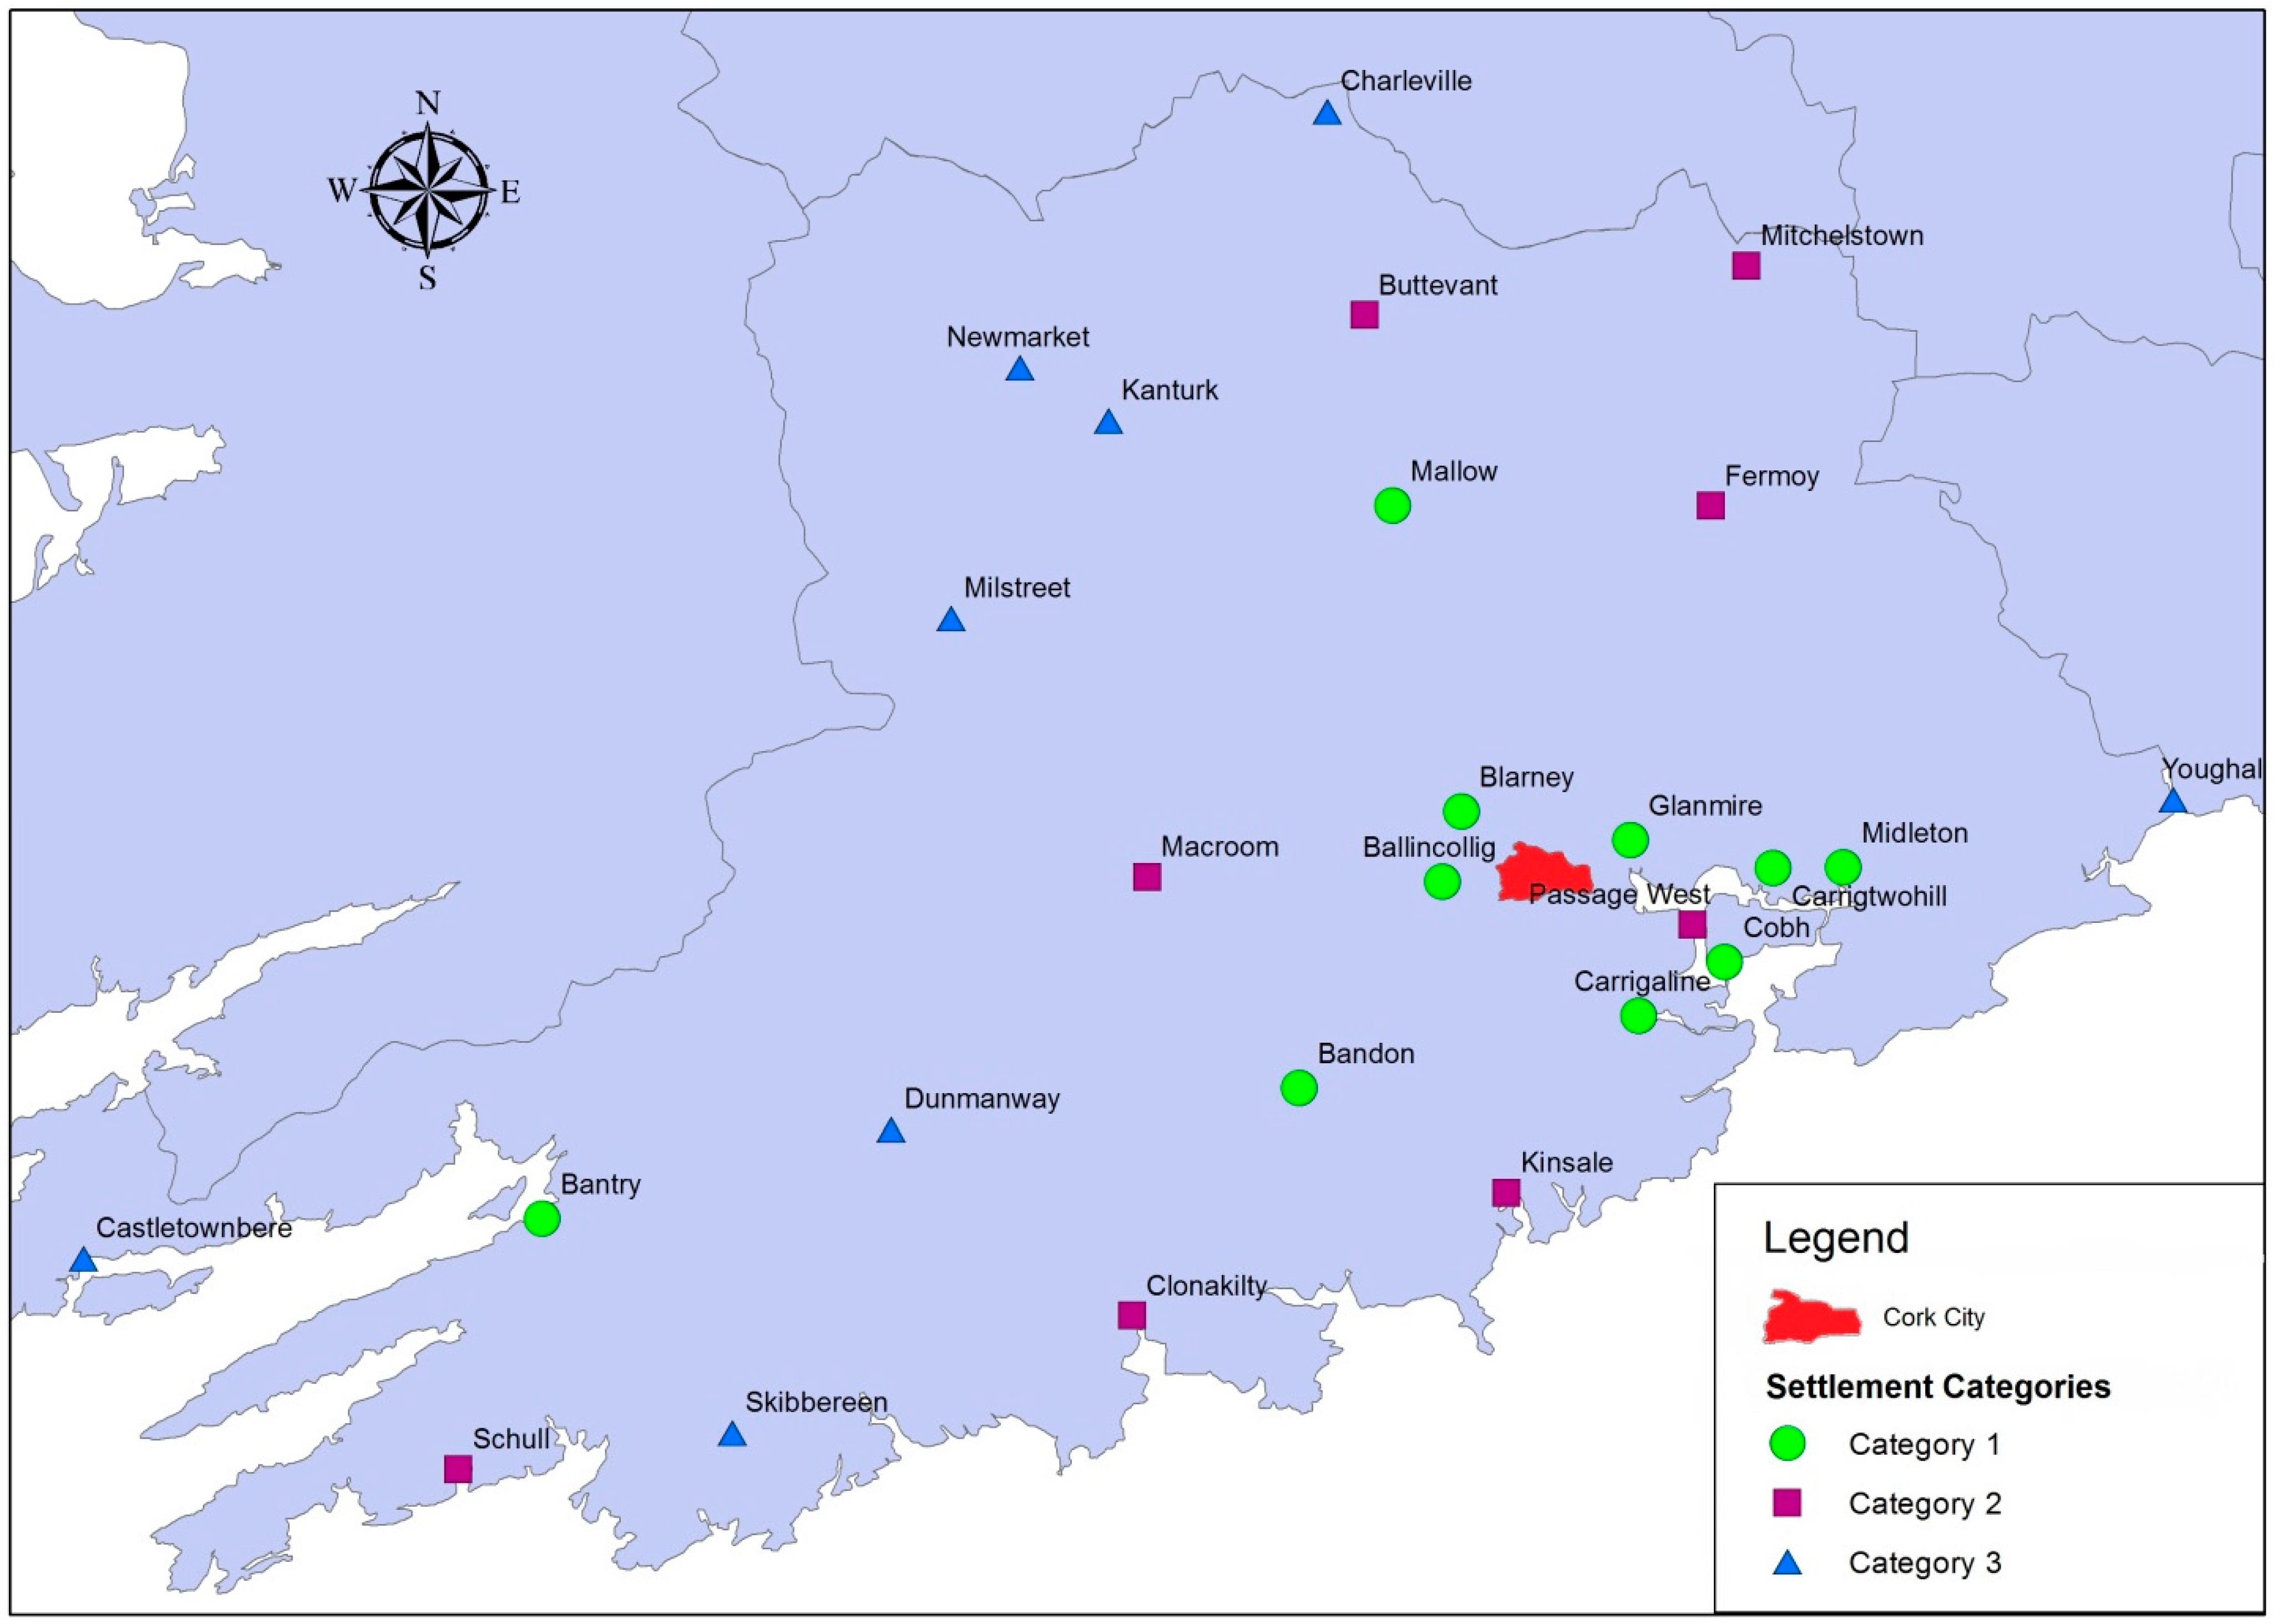
Settlement selection (and data collection): Settlement evaluation determines which environmental policies could most improve sustainability. The pilot study examined 26 settlements. See Table 1 for chosen settlements (Section 3 discusses SEMPRe (Sustainability Evaluation Metric for Policy Recommendation) score and sustainability grouping referred to in Table 1).
Table 1. Settlement rankings, groupings and population in pilot study.
SettlementSEMPRe ScoreSustainability GroupingPopulation
Ballincollig62.8117,368
Blarney61.512437
Carrigaline57.2114,775
Carrigtwohill56.814551
Midleton54.9112,001
Cobh54.8112,347
Bandon54.516640
Mallow53.6111,605
Glanmire53.518924
Bantry53.113348
Clonakilty50.324721
Kinsale50.324893
Fermoy49.626489
Passage West48.625709
Macroom46.723879
Buttevant46.12945
Schull43.82658
Mitchelstown42.823677
Charleville41.133672
Newmarket41.03988
Skibbereen39.232670
Youghal38.237794
Dunmanaway37.831585
Castletownbere37.73912
Millstreet36.731574
Kanturk35.332263
Data collection (discussed in Section 3) creates a baseline database providing an information base for selected environmental and socio-economic indicators (listed in Table 2). In the pilot study 25 indicators were chosen in five sustainability arenas (infrastructure and location, water and wastewater, population and urban form, transport and energy, livability) to provide an overview of urban sustainability as it relates to a local authority determining sustainable population and urban density for forward planning purposes. Arenas were chosen based upon recurring themes returned in the literature review. Chosen indicators and sustainability arenas reflect availability of data [52] with input from the Steering Committee comprising senior local authority planners and senior policy advisors within the EPA and Irish National Spatial Strategy (NSS) Planning Unit and do not represent a definitive view of urban sustainability (see Table 2 for a list of indicators and arenas).
Table 2. List of indicators and arenas used in pilot study.
Infrastructure and location
  • Infrastructural capacity for settlement expansion *
  • Connected to gas distribution network
  • Index of recycling facilities
  • Proportion of households with broadband internet
  • Presence of farmers markets
Water and wastewater
6.
Water quality of water bodies
7.
Wastewater treatment spare capacity
8.
Unaccounted for water
9.
Populated area at risk of flooding *
10.
Urban wastewater treatment status
Population and urban form
11.
Planned urban density *
12.
Proportion of population unemployed
13.
Proportion of population with 3rd level education
14.
Housing vacancy rate
15.
Distance to nearest largest retail center
Transport and energy
16.
Average transport CO2
17.
Settlement walkability
18.
Number of public transport services/1000 population *
19.
Average household heating CO2
20.
Proportion of population travelling to work by private car
Livability
21.
Distance to nearest acute hospital*
22.
Tidy towns points score
23.
Special area of conservation, heritage or protection within 5 km of settlements
24.
Distance to nearest park, nature reserve or wildlife park
25.
Presence of 24 hour police station
* Key performance indicator (explained in Step 3).
(2)
Policy database compilation: For each arena, an extensive review identified settlement sustainability literature which was current, comprehensive in range and aimed to provide a full account of the study area. These searches identified cases where: (a) a relevant policy is in use; and (b) peer-reviewed publications are available of at least one quantified evaluation of policy impact. Selected policies were: (a) recurring throughout the literature; (b) quantitatively evaluated more than once in existing peer-reviewed papers; (c) relevant to arenas of urban sustainability as defined here; and (d) feasible in relation to data availability. Policy selection was limited to 40 due to resource constraints (see Table 3). Sustainability policies chosen are wide in scope. All are not directly related to land use (smart growth program: mixed use development, reduced sprawl, promoting public transport, communal allotments, etc.); however, all are intended to tackle different aspects of sustainability such as reduction in transport and energy CO2 emissions (support for public transport, low rolling resistance tyres, etc.) and relieving stress on infrastructure (low water use toilets and taps, water harvesting, bicycle sharing system, etc.). The aim of this paper is to describe a method to quantitatively evaluate policy; this paper does not review individual policies.
(3)
SEMPRe testing: Policies are tested through the metric; Sustainability Evaluation Metric for Policy Recommendation (SEMPRe). SEMPRe normalises each of the 40 baseline sustainability indicators and a policy is modelled by applying expected policy improvement to relevant indicators. Indicator levels following expected improvement are also normalised. Normalised indicators before and after policy modelling aggregated into Sustainable Development Indices (SDI) provide a settlement sustainability score. The percentage change in SDI before and after policy modelling indicates the level of success or failure of a policy enabling ranking of relative policy impact. A weighting system is available within SEMPRe and the metric can rank relative settlement sustainability. For further information on methods adopted see Fitzgerald, et al. [9]. The pilot study identified and weighted key performance indicators which measured significant aspects of settlement sustainability (Table 2 lists key performance indicators). In order to facilitate low cost distribution and easy access to the method SEMPRe runs on a Microsoft Excel 2010 platform.
Table 3. Policies selected for modelling in pilot study.
Policy No.Policy Name
1Driver training in economical driving techniques
2Strict speed limit enforcement and speed limit reduction
3National road pricing scheme
4Support for public transport
5Low rolling resistance tires
6Bicycle sharing system
7Charging points for electric vehicles
8Short term car rental scheme
9Congestion charge for travel in urban centers
10Provision of bicycle lanes
11Payment for cycling to work
12Parking and showering facilities for cyclists
13Integrated public transport fare system
14Safe school routes
15Commuter workplace travel plans
16Parking cash out
17Communal allotments
18Farmers markets
19Smart growth program: mixed use development, reduced sprawl, promoting public transport
20Passively heated buildings
21Teleworking from home
22Higher urban density
23Green mortgages
24Green roofs
25Education campaign to reduce standby power use
26Use of sort rotation coppice willow and Miscanthus as home heating fuels
27Wind energy
28Smart electricity meters
29Improved billing feedback
30Prepaid electricity meters
31Demand side management program
32Mandatory home energy audits
33Solar water heating
34Energy recovery from waste; methane production via digestion of organic waste
35Use of metallic foils as radiation barriers to reduce heat losses from buildings
36Waste prevention campaign
37Regulating for reduced packaging
38Low water use toilets and taps
39Water harvesting
40Constructed wetlands for tertiary wastewater treatment
(4)
Feasibility testing: Policies found to have positive sustainability impacts when modelled through SEMPRe are feasibility tested, based on criteria adapted from Ledbury, et al. [53]. Estimates on the basis of experience elsewhere provided information on policy cost effectiveness, implementation timescale, uptake rates and local applicability. The feasibility testing produces numerical results enabling policy ranking. Due to the policy selection method, the policies examined here are heterogeneous in nature. To facilitate appropriate matching of policies to individual settlements, within the method policies are divided into different categories based on: (a) applicability to small settlements (500–5000 population) and medium settlements (5001–20,000 population); (b) implementation timescale: <1 year, 1–2 years, 2–3 years, 3–4 years, >5 years; and (c) cost of implementation: low, medium and high (see Table 4). For further information on feasibility testing adopted see O’Doherty, et al. [49].
Table 4. General policy categorization.
Policy No.Settlement ApplicabilityImplementation TimescaleCost of Implementation
1Small/medium<1 yearLow
2Small/medium1–2 yearsMedium
3Not applicable *2–3 yearsHigh
4Medium<1 yearMedium
5Small/medium<1 yearLow
6Not applicable *2–3 yearsMedium
7Small/medium2–3 yearsMedium
8Small/medium1–2 yearsMedium
9Not applicable *3–4 yearsHigh
10Not applicable *2–3 yearsMedium
11Small/medium<1 yearMedium
12Medium<1 yearMedium
13Small/medium1–2 yearsMedium
14Small/medium2–3 yearsMedium
15Medium3–4 yearsMedium
16Medium1–2 yearsMedium
17Small/medium3–4 yearsLow
18Small/medium<1 yearLow
19Small/medium>5 yearsHigh
20Small/medium3–4 yearsMedium
21Small/medium1–2 yearsLow
22Medium>5 yearsHigh
23Small/medium>5 yearsMedium
24Small/medium3–4 yearsMedium
25Small/medium<1 yearLow
26Small/medium1–2 yearsMedium
27Small/medium3–4 yearsHigh
28Small/medium1–2 yearsMedium
29Small/medium1–2 yearsMedium
30Small/medium1–2 yearsMedium
31Small/medium1–2 yearsMedium
32Small/medium1–2 yearsMedium
33Small/medium<1 yearLow
34Small/medium3–4 yearsHigh
35Small/medium<1 yearLow
36Small/medium<1 yearLow
37Small/medium>5 yearsLow
38Small/medium1–2 yearsLow
39Small/medium3–4 yearsMedium
40Small/medium3–4 yearsMedium
* Not applicable indicates literature suggests these policies are more appropriate in larger settlements.
(5)
Policy results ranked: In ranking policies, priority is given to feasibility testing score (which include policy effectiveness measured through SEMPRe), and where feasibility test scores are equal, higher ranking is given to the policy with higher SEMPRe score.
(6)
Change Scenarios: Evaluation of individual policies found that implementation of no single policy resulted in a major improvement in settlement SEMPRe score (that is, >10%). Grouping of individual policies into bundles identified policy options with greater overall impact. Three bundles were assembled, each representing a policy intervention scenario (here called a “change scenario”), ranging from conservative to ambitious.
(7)
Quantified recommendations to support policy-makers: The various change scenarios together with supporting evidence such as policy cost, implementation timescale, expected environmental impact, champions, feasibility, provide an evidence base for decision-making. Quantified recommendations provide projected changes that each change scenario is estimated to have based upon existing published data for the effects these policies had when implemented in other similar urban settlements. Section 3.3 provides an example of quantitative improvement associated with a change scenario.

3. Results and Discussion

QESSP analyzed baseline data and proposed tailored change scenarios for the 26 settlements within the region. Settlement population analyses provided classification of type; small (500–5000) and medium (5001–20,000). The pilot study consisted of study visits to the 26 settlements, compilation of an 1100 piece dataset, meeting local stakeholders and undertaking in-depth analysis using QESSP. Each of the seven steps within QESSP provided information for use independently or as part of an overarching pandect. There were three main outputs from the pilot study:
(1)
Quantification and ranking of settlements in terms of existing sustainability.
(2)
Identification of appropriate policies to improve sustainability of each settlement.
(3)
General findings about sustainability policy evaluation methods for small to medium sized Irish settlements.
Settlement rankings were in terms of existing sustainability based upon SEMPRe score; a quantum of sustainability based upon aggregated levels of sustainability in each of the 25 chosen sustainability indicators, with weightings included for key performance indicators. The SEMPRe output is a unitless score out of a possible maximum of 100, calculated for each settlement as outlined in Step 3 of QESSP (see Table 1). In order to facilitate analysis, grouping separated the 26 settlements into three categories using natural breaks in the ranking of SEMPRe scores (Jenks classification system [54]). Category 1 grouped most sustainable settlements, Category 2 grouped moderately sustainable settlements and Category 3 grouped least sustainable settlements (see Figure 2).
Figure 2. Categories of settlement by SEMPRe ranking results.
Sustainability 07 01819 g002

3.1. Existing Settlement Sustainability

Grouping of the settlements into categories by sustainability supported policy making at regional level for the future development of the area by identifying which settlements were more sustainable and which settlements were less sustainable. More sustainable settlements are generally larger in population and grouped in close proximity around the main metropolitan area of Cork City reflecting a polycentric settlement distribution. The exception to this is the settlements of Mallow and Bantry which have regional importance due to population size and location of important services such as hospitals. The least sustainable settlements are generally smaller in population and distal to the main metropolitan area. Providing planners with information regarding sustainability in each settlement was useful in determining which settlements could accommodate further population and which could not without investment.

3.2. Appropriate Settlement Sustainability Policy

Results from the study also identified appropriate policies to improve sustainability of each settlement. Policies which this study identified as generally applicable to enhance small and medium Irish settlement sustainability, in a low cost and timely manner are:
-
Eco-driver training provision,
-
Reduction in standby energy use,
-
Enhanced solar water heating technology uptake,
-
Waste prevention campaign organization,
-
Higher rates of low water use fixtures.
Detailed examination indicates differences in policies applicable to small and medium sized settlements. Analysis has identified seven policies common to change scenarios for small settlements studied, see Table 5.
Table 5. Policies identified as common to small sized settlements (in order of policy No.).
Policy No.Policy Name
1Eco-driver training
11Financial cycling incentive
25Reduction in standby energy use
26Salix and Miscanthus as home heating fuels
33Solar water heating
36Waste prevention campaign
38Low water use fixtures
Investigation of these policies points to the need to make small settlements self-sufficient in terms of energy and improve efficiencies in resource usage (policy Nos. 25, 26, 33, 36, 38) and also to reduce transport energy usage (policy Nos. 1, 11). There is a need to generally reduce transport energy usage in Ireland, through changing modal split such as incentivizing cycling, or by raising efficiencies such as promotion of eco-driver training. This need to reduce transport energy usage in Ireland is widely supported, for example by O’Mahony, et al. [55].
Analysis has identified nine policies common to change scenarios for medium settlements studied, see Table 6.
Investigation of these nine policies identifies five policies also identified as generally applicable in small settlements (policy Nos. 1, 25, 33, 36, 38). The reason that these policies score highly in improving sustainability in small sized settlements is the same reason that they score highly in improving sustainability in medium sized settlements (impact on reducing transport and energy CO2 emissions). With respect to the other policies (policy Nos. 5, 12, 15, 18), it can be seen that generally these policies require larger populations and employment bases to sustain them, in particular policy no. 12 Cycling facilities, policy No. 15 Commuter workplace travel plans and policy No. 18 Farmers markets. With regard to policy No. 5 Low rolling resistance tires, this is a policy which has application in all settlements but is higher ranked in medium settlements than in smaller settlements as other policies within smaller settlements create greater impact, such as policies which promote making smaller settlements energy self-sufficient, for example, policy No. 26 Salix and Miscanthus as home heating fuels. All of the policies identified as common to medium sized settlement change scenarios are applicable in larger settlements, pointing to the finding that medium sized settlements can become more sustainable by emulating larger more sustainable settlements on a pro-rata basis.
Table 6. Policies identified as common to medium sized settlements (in order of policy No.).
Policy No.Policy Name
1Eco-driver training
5Low rolling resistance tyres
12Cycling facilities
15Commuter workplace travel plans
18Farmers markets
25Reduction in standby energy use
33Solar water heating
36Waste prevention campaign
38Low water use fixtures
Table 7 lists general pilot study results.
Table 7. General pilot study results.
FindingDescription
1To achieve substantial settlement sustainability, improvement must occur in all sustainability arenas, but initially greatest enhancement occurs through identification and targeting of weak attributes for policy implementation.
2Some policies may be generally applicable within all settlements, but to achieve extensive sustainability enhancement, implementation of additional policies tailored to specific settlement attributes is required.
3Medium sized settlements may improve sustainability by emulating policies implemented successfully in larger settlements on a smaller scale.
4Small settlements may improve sustainability by becoming self-sufficient in energy and improving public transport links to larger nearby more sustainable settlements.
5Small and medium settlements appear to have differing characteristics upon initial examination, however, some of the underlying problems of sustainability (such as the need to reduce transport and energy CO2 emissions and improve resource management) are common to settlements with low sustainability, and may respond similarly to the same policies.
6Change scenarios for each settlement identified a policy mix championed locally and nationally. Priorities of local stakeholders and national policy-makers may differ [56]. Development of a unified approach which is acceptable to national policy-makers and local stakeholders is important.
7There is inherent danger in standardization of methods possibly resulting in removal of novelty, originality and innovation in policy-making. Champion’s actions are often critical and may be restricted through rigid implementation of standardized method.
8Standardization of methods to evaluate sustainability policy is most useful when addressing a specific level (settlement, regional, national, global) or target, and the user is aware of the advantages and disadvantages of the standard method applied.
9New research, such as QESSP, may improve environmental governance and evidence based decision-making by examining alternatives and consequences of decisions, generating new knowledge and reframing policy problems.

3.3. Example of a Change Scenario and Associated Quantitative Improvements

In addition to the general results listed in Table 5, Table 6 and Table 7, three change scenarios (here described as primary, significant and extensive) for each of the 26 settlements are informing the current Cork County Development Plan review. An example of a primary change scenario for Castletownbere is shown in Table 8 and the quantitative improvements associated with this change scenario are shown in Table 9.
Table 8. Example of a primary change scenario for Castletownbere.
Policy No.Policy NameSustainability Improvement % (SEMPRe)
1Eco-driver training4.91
36Waste prevention campaign4.37
21Teleworking from home9.31
18Farmers markets2.90
33Solar water heating2.78
Total 24.27
Table 9. Example of Castletownbere quantitative improvement due to primary change scenario implementation.
Policy No.Quantified ImprovementIndicator No. Impacted
361.82% increase in regular recycling3
3655.4 kg reduction in volume of waste/person/annum3
1, 18, 33152 kg reduction in CO2 emissions/person/annum16, 19
210.41% decrease in relative car use17, 20
Evaluation of 40 policies in 26 settlements showed that no single policy had a significant impact upon sustainability. In order to provide policy makers with recommendations which could significantly enhance settlement sustainability it was decided to bundle policies together into change scenarios. The logic underlying this decision is that multiple policies acting together can impact simultaneously on different aspects of settlement sustainability in order to provide a cumulative sustainability gain within a settlement. Policies are assigned to settlement change scenarios based upon ranking of impact within the QESSP method. Each policy within a change scenario has an associated quantitative impact based upon the published literature.
The potential issue of double counting may occur where sustainability policy impacts are quantified separately and results aggregated into a change scenario, or where a policy (for example, Eco-driver training, Farmers markets and Solar water heating) is valued independently [57]. There have been a number of recent studies which acknowledge the significance of double counting [58,59,60,61,62] but literature searches failed to identify a method to address double counting of policy impacts. On modelling the change scenarios, when mutually exclusive policies which impact on different sustainability indicators were modelled and then aggregated, sustainability impact results from policy bundles were as expected. However, when large numbers of policies which act on the same indicators were modelled and the quantitative results aggregated into a change scenario, the collective impacts were larger than expected based on literature review. This resulted from double counting of multiple policy impacts on single indicators, leading to higher than expected quantified sustainability impacts for change scenarios with large numbers of policies.
In order to address double counting of policy impacts, quantified improvements from change scenarios are compiled by aggregating the impacts of policies in order of rank. The method is based on the assumption that the introduction of a policy to enhance an indicator will make it more difficult for a further policy to enhance this indicator. Within the primary change scenario, the quantified improvements due to the first ranking policy are given full weighting, and improvements for subsequent policies are added on a sliding scale. For subsequent policy impacts, if an indicator is acted upon for the first time by a policy, 100% of the calculated change is counted, if the indicator is acted upon a second time by a policy, 50% of that calculated change is counted, if acted upon by a policy for a third time 25% of that calculated change is counted, and so on, on a sliding scale diminishing the counted impact of lower ranking policies on the indicator by one half at each step. The same procedure is applied for additional policy impacts in the significant and extensive change scenarios. However if an indicator has been acted upon within the primary change scenario, one half of the calculated change due to the first ranked additional policy in the significant or extensive change scenario is counted, and the sliding scale for impacts continues from there. For additional policy impacts in the extensive change scenario, if an indicator has been acted upon within the primary change scenario and additional policies in the significant change scenario, one quarter of the calculated change due to the first ranked additional policy in the extensive change scenario is counted, and the sliding scale of impacts continues from there.
Reducing the anticipated sustainability gain on an indicator each time a policy was applied which was intended to impact on that indicator, on the grounds that an initial policy will enhance sustainability so that subsequent policies might be expected to be less effective, thereby reducing the potential for double counting and thus over-inflated estimations of enhanced sustainability is a useful innovation in the method, leading to more conservative but also more realistic outputs. Smaller settlements such as Castletownbere required fewer policies than medium settlements to satisfy change scenarios (Table 8), however, when quantified improvements were summed to take account of double counting (Table 9), the low numbers of policies in small settlement change scenarios resulted in smaller collective impacts than the greater numbers of policy impacts summed for medium settlements. This points to the considerable unsustainability of small, isolated settlements with low density housing, such as Castletownbere and identifies the need for considerable change to enable such settlements to become more sustainable. As small settlements with low populations may not support large bundles of policies, and as low quantified improvement is noted for chosen smaller policy bundles, the issue of how to improve the sustainability of small settlements remains challenging.
For further information see Draft Cork County Development Plan 2013, Volume Three: Environment and Natura Impact Reports, Chapter 5 Alternative Scenarios available at www.corkcocodevplan.com [63].

4. Conclusions

University based researchers working with a Steering Committee and subsequently with the Planning Department in Cork County Council developed QESSP and it is currently in use by Cork County Council. Conclusions of this research were identified by researchers during method development and following interviews with stakeholders in the Steering Committee and Cork County Council Planning Department.
At a global scale there are over 500 published sustainability indicator efforts [24,64]. It is evident that there are multiple sustainability indicator methods in use to support sustainable development policy making. This diversity is itself a reason why policy makers find it hard to use these metrics in policy prioritization. Previous approaches to sustainability measurement have focused on ranking entities such as states and settlements in terms of their sustainability. These approaches are useful in monitoring sustainability of a settlement or region over time or to compare sustainability between different settlements or regions. However, they cannot evaluate sustainability policy outcomes. There are a number of existing methods for the evaluation of sustainability policy, such as Environmental Impact Assessment (EIA), Strategic Environmental Assessment (SEA) and Sustainability Impact Assessment (SIA). These methods are either project based (EIA) or evaluate broad policy impacts (SEA and SIA) without reference to single settlement scale [39].
Adoption of QESSP resulted in enhancement of evidence based decision making by examining alternatives and consequences of decisions, generating new knowledge and re-framing policy problems. In order to gain traction with decision makers, method development involved close collaboration with as many decision makers as was manageable. Tension generally exists between the requirement for scientific rigor in methods for quantifying sustainability, and the need for relative simplicity and accessibility for often non-technical local politicians. In order to address this, here the scope and ambition of the initial indicator set reflect a level that planners found accessible and useable as a decision support tool, as implemented by Cork County Council and which could be implemented in future by other planning authorities. Developing novel methods with major data requirements and complex calculations are useful research exercises, but appear unlikely to be widely adopted by decision makers. The method described here does not claim to embrace all possible indicators for sustainability. However, the method is in use at local, EPA and NSS levels, and for Ireland a crucial first step was to embed the concept of sustainability into spatial planning processes. Feedback from the Cork County Council Planning Department indicated that perception of the relative sustainability of settlements changed significantly after using QESSP: the method was effective as an awareness raising tool. Multiple change scenarios were proposed to increase sustainability in each of the 26 settlements. However, even our most ambitious policy scenario is unlikely to bring settlements to a level which would support the European Union greenhouse gas emission reduction targets (at least 40% domestic reduction by 2030 over 1990 levels [65]). This underlines the need for continuous improvement in urban sustainability: initial policies are only meaningful in the longer term if they prepare the ground for additional, more rigorous policies. By ranking settlements in terms of sustainability and by identifying which policies could be best applied in individual settlements to improve sustainability, linkages can be created between existing levels of settlement sustainability, settlement population and required investment to increase settlement sustainability. This information provides an evidence base to planners and policy-makers in deciding which settlements can accommodate further population, which should be restricted from further growth and which should be invested in to improve sustainability. As decisions regarding which settlements to increase in population and which to restrict are a legally reserved function of the Planning Authority, this research does not make specific recommendations in this regard, as often these decisions are political and are subject to considerations beyond the scope of sustainability research. It is believed however that provision of scientifically underpinned evidence can help policy-makers make better decisions.
The method has implications for policy evaluation in Ireland and other countries with similar attributes (size, population, prosperity, state of development, similar level of existing sustainability planning, similar settlement networks and attributes), and was developed in the context of wider austerity-based policy. However, the QESSP framework and its components presented within this study may not be applicable in countries with more advanced planning methods, a longer history of engagement in planning for sustainability, and larger budgets for more expensive policies. A limitation of this study to date is that there has not been time for a more complete study of policy uptake and user behavior. QESSP has received positive feedback from Irish local authorities, EPA and NSS Planning Unit, which suggests the method has top-down support, but to be fully effective local level decision maker behavior must change. One local authority demonstrated this as part of the pilot study, namely Cork.
Our work suggests that policy evaluation may be more complicated than is often acknowledged. We have demonstrated that “one size fits all” policy development is unlikely to be effective in meeting desirable urban sustainability targets. It shows that such targets are unlikely satisfied through implementation of stand-alone policies: a better approach is the implementation of bundles of policies addressing sustainability pillars, with bundles tailored to the attributes of individual settlements. However, implementation of one policy is likely to affect the efficacy of other policies: rebound and back-fire effects are to be expected and need to be addressed in policy selection and in the estimation of policy effectiveness (as was undertaken in this study, but not described here). Our method is an example of an approach taken in order to increase the chances of influencing decision making, but precise replication of steps taken here is not required in other jurisdictions. Indeed, a negative effect of methodological standardization at national level is to limit novelty and innovation in policy making, as “standardized” is often confused with “optimal”. However the method described here does not impose a rigid framework as indicator selection can reflect the priorities of stakeholders, modulated by data availability and policy feasibility testing. There is a growing body of literature which reports on quantitative evaluation of the impacts of policy implementation which will, act to improve the accuracy of prediction of policy implementation outcomes, and such sources can reflect changing economic and social circumstances. QESSP provides a mechanism for the incorporation into decision making of such international experience.

Acknowledgments

This research is funded as part of the Science, Technology, Research and Innovation for the Environment (STRIVE) Programme. The programme is financed by the Irish Government under the National Development Plan. It is administered on behalf of the Department of the Environment, Heritage and Local Government by the Environmental Protection Agency which has the statutory function of coordinating and promoting environmental research.

Author Contributions

The research was designed by Brian G. Fitzgerald, Travis O’Doherty, Bernadette O’Regan and Richard Moles. Brian G. Fitzgerald and Travis O’Doherty performed the research and analyzed the data. Brian G. Fitzgerald wrote the paper with input from Travis O’Doherty, Richard Moles and Bernadette O’Regan. All authors read and approved the final manuscript.

Conflicts of Interest

The authors declare no conflict of interest.

References

  1. Fitzgerald, B.G. Sustainability: Sustain the future by doing more with less. Nature 2013. [Google Scholar] [CrossRef]
  2. Harvey, M.; Pilgrim, S. The new competition for land: Food, energy, and climate change. Food Policy 2011, 36, S40–S51. [Google Scholar] [CrossRef]
  3. Ashford, N.A.; Hall, R.P.; Ashford, R.H. The crisis in employment and consumer demand: Reconciliation with environmental sustainability. Environ. Innov. Soc. Transit. 2012, 2, 1–22. [Google Scholar] [CrossRef]
  4. Vermeir, I.; Verbeke, W. Sustainable Food Consumption: Exploring the Consumer “Attitude–Behavioral Intention” Gap. J. Agric. Environ. Ethics 2006, 19, 169–194. [Google Scholar] [CrossRef]
  5. Druckman, A.; Jackson, T. The bare necessities: How much household carbon do we really need? Ecol. Econ. 2010, 69, 1794–1804. [Google Scholar] [CrossRef] [Green Version]
  6. Tukker, A.; Eder, P.; Suh, S. Environmental Impacts of Products: Policy Relevant Information and Data Challenges. J. Ind. Ecol. 2006, 10, 183–198. [Google Scholar] [CrossRef]
  7. Wursthorn, S.; Poganietz, W.-R.; Schebek, L. Economic–environmental monitoring indicators for European countries: A disaggregated sector-based approach for monitoring eco-efficiency. Ecol. Econ. 2011, 70, 487–496. [Google Scholar] [CrossRef]
  8. Environmental Protection Agency (EPA). Investigation into Why Existing Environmental Technologies Are Underused, 2005-ET-DS-19-M3; EPA: Wexford, Ireland, 2007; pp. 1–46. [Google Scholar]
  9. Fitzgerald, B.G.; O’Doherty, T.; Moles, R.; O’Regan, B. A quantitative method for the evaluation of policies to enhance urban sustainability. Ecol. Indic. 2012, 18, 371–378. [Google Scholar] [CrossRef]
  10. Boyko, C.T.; Gaterell, M.R.; Barber, A.R.G.; Brown, J.; Bryson, J.R.; Butler, D.; Caputo, S.; Caserio, M.; Coles, R.; Cooper, R.; et al. Benchmarking sustainability in cities: The role of indicators and future scenarios. Glob. Environ. Change 2012, 22, 245–254. [Google Scholar] [CrossRef]
  11. Jackson, T. Motivating Sustainable Consumption a Review of Evidence on Consumer Behaviour and Behavioural Change; Sustainable Development Research Network: Guildford, UK, 2005. [Google Scholar]
  12. Lucas, K.; Brooks, M.; Darnton, A.; Jones, J.E. Promoting pro-environmental behaviour: Existing evidence and policy implications. Environ. Sci. Policy 2008, 11, 456–466. [Google Scholar] [CrossRef]
  13. Hertin, J.; Turnpenny, J.; Jordan, A.; Nilsson, M.; Russel, D.; Nykvist, B. Rationalising the policy mess? Ex ante policy assessment and the utilisation of knowledge in the policy process. Environ. Plan. A 2009, 41, 1185–1200. [Google Scholar] [CrossRef]
  14. Huang, I.B.; Keisler, J.; Linkov, I. Multi-criteria decision analysis in environmental sciences: Ten years of applications and trends. Sci. Total Environ. 2011, 409, 3578–3594. [Google Scholar] [CrossRef] [PubMed]
  15. Kastenhofer, K.; Bechtold, U.; Wilfing, H. Sustaining sustainability science: The role of established inter-disciplines. Ecol. Econ. 2011, 70, 835–843. [Google Scholar] [CrossRef]
  16. Wilson, J.; Tyedmers, P.; Pelot, R. Contrasting and comparing sustainable development indicator metrics. Ecol. Indic. 2007, 7, 299–314. [Google Scholar] [CrossRef]
  17. Russel, D.; Jordan, A. Joining up or pulling apart? The use of appraisal to coordinate policy making for sustainable development. Environ. Plan. A 2009, 41, 1201–1216. [Google Scholar] [CrossRef]
  18. Shiroyama, H.; Yarime, M.; Matsuo, M.; Schroeder, H.; Scholz, R.; Ulrich, A. Governance for sustainability: Knowledge integration and multi-actor dimensions in risk management. Sustain. Sci. 2012, 7, 45–55. [Google Scholar] [CrossRef]
  19. Sutcliffe, S.; Court, J. Evidence-Based Policymaking: What Is It? How Does It Work? What Relevance for Developing Countries; Overseas Development Institute: London, UK, 2005. [Google Scholar]
  20. Head, B.W. Reconsidering evidence-based policy: Key issues and challenges. Policy Soc. 2010, 29, 77–94. [Google Scholar] [CrossRef]
  21. Bullock, H.; Mountford, J.; Stanley, R. Better Policy-Making; Cabinet Office: London, UK, 2001. [Google Scholar]
  22. Davies, P. The State of Evidence-Based Policy Evaluation and its Role in Policy Formation. Natl. Instit. Econ. Rev. 2012, 219, R41–R52. [Google Scholar] [CrossRef]
  23. Carpenter, S.R.; Folke, C.; Norström, A.; Olsson, O.; Schultz, L.; Agarwal, B.; Balvanera, P.; Campbell, B.; Castilla, J.C.; Cramer, W.; et al. Program on ecosystem change and society: An international research strategy for integrated social–ecological systems. Curr. Opin. Environ. Sustain. 2012, 4, 134–138. [Google Scholar] [CrossRef]
  24. Böhringer, C.; Jochem, P.E.P. Measuring the immeasurable—A survey of sustainability indices. Ecol. Econ. 2007, 63, 1–8. [Google Scholar] [CrossRef]
  25. Wiek, A.; Ness, B.; Schweizer-Ries, P.; Brand, F.; Farioli, F. From complex systems analysis to transformational change: A comparative appraisal of sustainability science projects. Sustain. Sci. 2012, 7, 5–24. [Google Scholar] [CrossRef]
  26. Darton, R.C. Scenarios and Metrics as Guides to a Sustainable Future: The Case of Energy Supply. Process Saf. Environ. Prot. 2003, 81, 295–302. [Google Scholar] [CrossRef]
  27. Pintér, L.; Hardi, P.; Martinuzzi, A.; Hall, J. Bellagio STAMP: Principles for sustainability assessment and measurement. Ecol. Indic. 2012, 17, 20–28. [Google Scholar] [CrossRef]
  28. Scott, M. Planning in the Face of Crisis. Plan. Theory Pract. 2012, 13, 3–6. [Google Scholar] [CrossRef]
  29. IPCC. Climate Change 2014: Impacts, Adaption and Vulnerability; Cambridge University Press: Cambridge, UK, 2014. [Google Scholar]
  30. IPCC. Climate Change 2014: Mitigation of Climate Change; Cambridge University Press: Cambridge, UK, 2014. [Google Scholar]
  31. Deakin, M.; Reid, A. Sustainable urban development: Use of the environmental assessment methods. Sustain. Cities Soc. 2014, 10, 39–48. [Google Scholar] [CrossRef]
  32. Khalil, H. Enhancing quality of life through strategic urban planning. Sustain. Cities Soc. 2012, 5, 77–86. [Google Scholar] [CrossRef]
  33. Gebauer, H.; Worch, H.; Truffer, B. Absorptive capacity, learning processes and combinative capabilities as determinants of strategic innovation. Eur. Manag. J. 2012, 30, 57–73. [Google Scholar] [CrossRef]
  34. Lein, J.K. Toward a remote sensing solution for regional sustainability assessment and monitoring. Sustainability 2014, 6, 2067–2086. [Google Scholar] [CrossRef]
  35. Waas, T.; Hugé, J.; Block, T.; Wright, T.; Benitez-Capistros, F.; Verbruggen, A. Sustainability assessment and indicators: Tools in a decision-making strategy for sustainable development. Sustainability 2014, 6, 5512–5534. [Google Scholar] [CrossRef] [Green Version]
  36. Anderson, S.; Allen, J.; Browne, M. Urban logistics––How can it meet policy makers’ sustainability objectives? J. Transp. Geogr. 2005, 13, 71–81. [Google Scholar] [CrossRef]
  37. Wiek, A.; Farioli, F.; Fukushi, K.; Yarime, M. Sustainability science: Bridging the gap between science and society. Sustain. Sci. 2012, 7, 1–4. [Google Scholar] [CrossRef]
  38. Geerlings, H.; Stead, D. The integration of land use planning, transport and environment in European policy and research. Transp. Policy 2003, 10, 187–196. [Google Scholar] [CrossRef]
  39. Morrissey, J.; Iyer-Raniga, U.; McLaughlin, P.; Mills, A.A. Strategic Project Appraisal framework for ecologically sustainable urban infrastructure. Environ. Impact Assess. Rev. 2012, 33, 55–65. [Google Scholar] [CrossRef]
  40. Ludlow, D. Urban Sprawl. In Sustainable Urban Development Volume 4: Changing Professional Practice; Cooper, I., Symes, M., Eds.; Routledge: Abingdon, UK, 2009; pp. 45–75. [Google Scholar]
  41. Nilsson, M.; Persson, Å. Can Earth system interactions be governed? Governance functions for linking climate change mitigation with land use, freshwater and biodiversity protection. Ecol. Econ. 2012, 75, 61–71. [Google Scholar] [CrossRef]
  42. Marchand, F.; Debruyne, L.; Triste, L.; Gerrard, C.; Padel, S.; Lauwers, L. Key characteristics for tool choice in indicator-based sustainability assessment at farm level. Ecol. Soc. 2014, 19. Article 46. [Google Scholar] [Green Version]
  43. Rosales, N. Towards the Modelling of Sustainability into Urban Planning: Using Indicators to Build Sustainable Cities. Proced. Eng. 2011, 21, 641–647. [Google Scholar] [CrossRef]
  44. Bodini, A. Building a systemic environmental monitoring and indicators for sustainability: What has the ecological network approach to offer? Ecol. Indic. 2012, 15, 140–148. [Google Scholar] [CrossRef]
  45. Moles, R.; Kelly, R.; O’Regan, B. Methodologies for the Estimation of Sustainable Settlement Size (2000-LS-4.3-M1) Final Report; Environmental Protection Agency: Wexford, Ireland, 2002. [Google Scholar]
  46. Moles, R.; Foley, W.; Morrissey, J.; O’Regan, B. Practical appraisal of sustainable development—Methodologies for sustainability measurement at settlement level. Environ. Impact Assess. Rev. 2008, 28, 144–165. [Google Scholar] [CrossRef]
  47. O’Regan, B.; Moles, R.; Kelly, R.; Ravetz, J.; McEvoy, D. Developing indicators for the estimation of sustainable settlement size in Ireland. Environ. Manag. Health 2002, 13, 450–466. [Google Scholar] [CrossRef]
  48. O’Regan, B.; Morrissey, J.; Foley, W.; Moles, R. The relationship between settlement population size and sustainable development measured by two sustainability metrics. Environ. Impact Assess. Rev. 2009, 29, 169–178. [Google Scholar] [CrossRef]
  49. O’Doherty, T.; Fitzgerald, B.G.; Moles, R.; O’Regan, B. A novel method for feasibility testing urban sustainable development policies. Spatium 2013, 30, 1–6. [Google Scholar] [CrossRef]
  50. Draft Cork County Development Plan 2013 Volume Three: Environment and Natura Impact Reports. Available online: www.corkcocodevplan.com (accessed on 29 September 2014).
  51. Mori, K.; Yamshita, T. Methodological framework of sustainability assessment in City Sustainability Index (CSI): A concept of constraint and maximization indicators. Habitat Int. 2015, 45, 10–14. [Google Scholar] [CrossRef]
  52. Tanguay, G.A.; Rajaonson, J.; Lefebvre, J.-F.; Lanoie, P. Measuring the sustainability of cities: An analysis of the use of local indicators. Ecol. Indic. 2010, 10, 407–418. [Google Scholar] [CrossRef]
  53. Ledbury, M.; Miller, N.; Lee, A.; Fairman, T.; Clifton, C. Understanding Policy Options, Home Office Online Report 06/06. 2006. Available online: http://tna.europarchive.org/20071206133532/homeoffice.gov.uk/rds/pdfs06/rdsolr0606.pdf (accessed on 19 October 2014).
  54. Jiang, B. Head/Tail Breaks: A new classification scheme for data with a heavy-tailed distribution. Prof. Geogr. 2012, 65, 482–494. [Google Scholar] [CrossRef]
  55. O’Mahony, T.; Zhou, P.; Sweeney, J. The driving forces of change in energy-related CO2 emissions in Ireland: A multi-sectoral decomposition from 1990 to 2007. Energy Policy 2012, 44, 256–267. [Google Scholar] [CrossRef]
  56. Doody, D.G.; Kearney, P.; Barry, J.; Moles, R.; O’Regan, B. Evaluation of the Q-method as a method of public participation in the selection of sustainable development indicators. Ecol. Indic. 2009, 9, 1129–1137. [Google Scholar] [CrossRef]
  57. Luisetti, T.; Turner, R.K.; Bateman, I.J.; Morse-Jones, S.; Adams, C.; Fonseca, L. Coastal and marine ecosystem services valuation for policy and management: Managed realignment case studies in England. Ocean Coast. Manag. 2011, 54, 212–224. [Google Scholar] [CrossRef]
  58. Boarnet, M.G. Planning, climate change, and transportation: Thoughts on policy analysis. Transp. Res. Part A 2010, 44, 587–595. [Google Scholar]
  59. Brand, C.; Tran, M.; Anable, J. The UK transport carbon model: An integrated life cycle approach to explore low carbon futures. Energy Policy 2012, 41, 107–124. [Google Scholar] [CrossRef]
  60. Giljum, S.; Burger, E.; Hinterberger, F.; Lutter, S.; Bruckner, M. A comprehensive set of resource use indicators from the micro to the macro level. Resour. Conserv. Recycl. 2011, 55, 300–308. [Google Scholar] [CrossRef]
  61. May, A.D.; Kelly, C.; Shepherd, S.; Jopson, A. An option generation tool for potential urban transport policy packages. Transp. Policy 2012, 20, 162–173. [Google Scholar] [CrossRef]
  62. Santos, G.; Behrendt, H.; Teytelboym, A. Part II: Policy instruments for sustainable road transport. Res. Transp. Econ. 2010, 28, 46–91. [Google Scholar] [CrossRef]
  63. O’Doherty, T.; Fitzgerald, B.G.; Moles, R.; O’Regan, B. Chapter 5 Alternative Scenarios. In Draft Cork County Development Plan 2013 Volume Three: Environment and Natura Impact Reports; Cork County Council: Cork, Ireland, 2013; Volume 3, pp. 121–140. [Google Scholar]
  64. Parris, T.M.; Kates, R.W. Characterising and measuring sustainable development. Annu. Rev. Environ. Resour. 2003, 28, 559–586. [Google Scholar] [CrossRef]
  65. European Council. European Council (23 and 24 October 2014) Conclusions. Available online: http://www.consilium.europa.eu/uedocs/cms_data/docs/pressdata/en/ec/145397.pdf (accessed on 1 November 2014).

