1. Introduction
The multifaceted economy-environment interactions observed in dynamic socio-ecological systems contribute to triggering social problems and increase the vulnerability of places and people [
1]. Urban growth is one of the most relevant factors determining irreversible landscape changes, affecting ecosystem health and human well-being for generations to come [
2]. Urbanization stimulates land use changes, determining the contraction of agricultural land, the consolidation of forests and other natural land and the expansion of urban land [
3]. While society benefits from economic development and conservation of natural areas, this trend has a number of adverse implications, related to expanding unsustainable use of land, rural-urban migration, abandonment of cropland, land marginalization, inadequate social security and health provision and decreasing food and environmental security at the regional scale [
4]. Secure tenure is essential for both effective and sustainable land use, including adequate levels of investment in enhancing land productivity and allocating land to the most efficient user(s) [
5]. As the key to meeting commitments for both national and international policy targets (e.g., Agenda 21), the sustainable management and use of land resources is essential for urban sustainability [
6,
7,
8].
It was demonstrated that the conversion of productive farmland with fertile soil into urbanized areas, especially with sprawling, low-density settlements, may lead to inefficient land allocation [
9]. A sprawling urban expansion can have on-site and off-site negative impacts [
10], e.g., fragmenting the agro-forest landscape and reducing the environmental quality of entire regions [
11]. These issues are clearly linked and inherently complex [
12,
13], since sprawl determinants are many and well differentiated (tourism growth, second-home expansion, decentralization of business activities, internal and foreign migration, change in lifestyles and consumption patterns, among others [
10]).
Efficiency in the use of land is a representative concept adhering to the sustainable development paradigm. Following Jaeger
et al. [
14], we associate this concept with a pattern of land use assuring spatial, long-term sustainability from both the ecological and the socioeconomic points of view. With the understanding that sprawl has been loosely defined as dispersed and possibly inefficient urban growth, several indicators that examine the critical impact of urbanization on land resources have been developed [
15]. Land use efficiency in urban areas (LUE) is operatively linked to the ratio of developed land to resident inhabitants. Despite new and more complex indexes having been recently introduced [
11,
12], the LUE indicator has been demonstrated to be particularly suited to regional- and local-scale diachronic studies grounded in official statistics.
In Europe, although reusing peri-urban brownfields or simply abandoned areas, together with a better use of infrastructures are considered ‘retro-fitting’ measures to control sprawl, promoting self-contained urban expansion within a sustainable land management framework is a challenging policy target [
16,
17]. The consideration of the impact of European Union policy and instruments on land development strategies is not straightforward. While approaching these issues from the point of view of interventions in the processes of land development, the EU has influenced (but has limited direct competence) in this area [
10]. A thorough analysis of land use efficiency should thus focus on the regional (e.g., administrative regions, provinces, prefectures, economic districts) and local scales (e.g., municipalities, rural communities), since these collectives have the authority to allocate land to the most efficient uses, possibly screening alternative choices for long-term environmental sustainability and residents’ well-being [
18,
19,
20].
How urban growth paths shape, both in the medium term and in the long term, the allocation of land to more (or less) efficient uses at the local scale is poorly addressed in the recent literature. This issue represents indeed a challenge for urban studies with implications on regional planning and urban sustainability, and thus, it deserves further investigation. The present study hypothesized that the efficiency in the use of land varies along different phases of urban expansion following changes in a multifaceted set of socioeconomic and territorial drivers. The stratification of distinct growth waves and the uneven complexity in urban structures and socioeconomic local contexts make European Mediterranean cities intriguing cases for assessing the relation between urban growth and land use efficiency. As a matter of fact, southern European urban regions often developed through paths distinct from either those observed in Western Europe and those found in non-European Mediterranean countries [
21,
22,
23,
24]. Sprawl-driven settlement scattering and polycentric development constitute the most recent expansion phase, altering the typical mono-centric spatial organization with negative implications for land use efficiency [
25,
26].
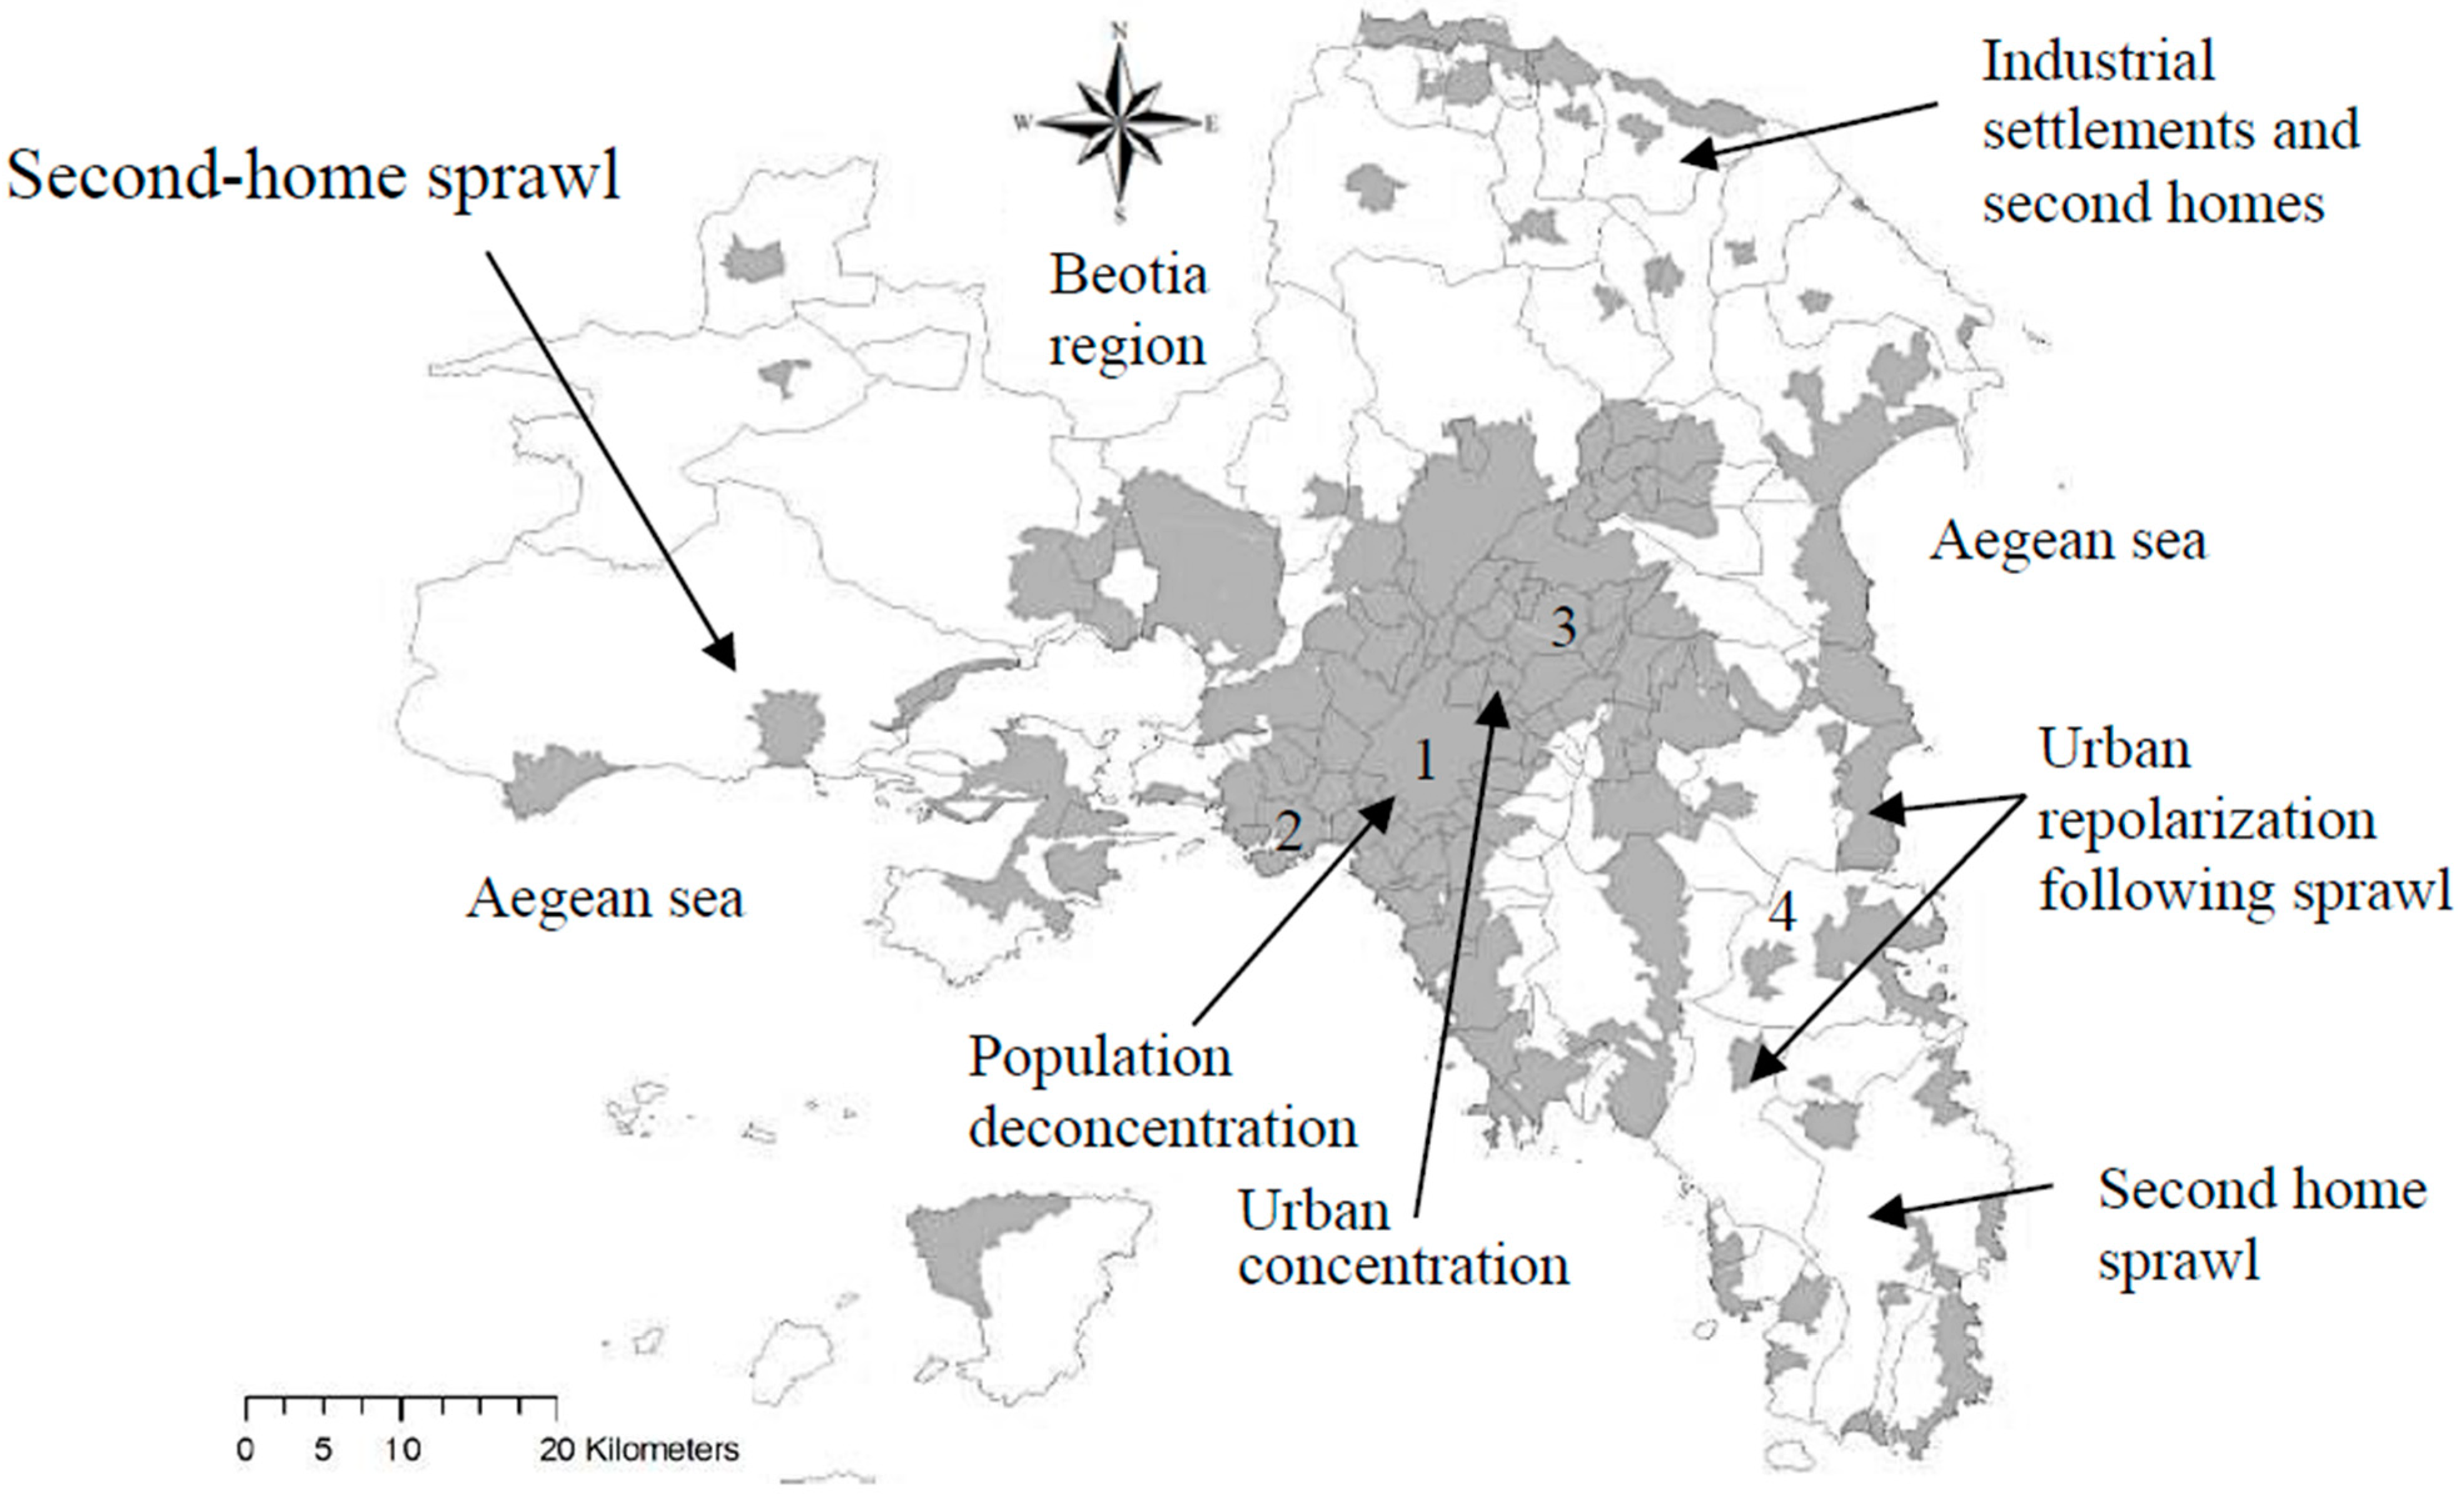
Based on these premises, the present study proposes an exploratory data analysis of urban land use efficiency over different waves of urban expansion in a southern European region (Attica, Greece). In this ambit, Athens can be considered an exemplificative case of expanding Mediterranean urban areas with an intricate relationship between morphology and economic functions. By applying a multi-step statistical strategy incorporating descriptive statistics, correlation and regression analysis and multivariate techniques to a wide set of morphological and functional indicators between 1960 and 2010, our analysis aims at investigating the socioeconomic context most associated with low land use efficiency at the local scale, identifying also the main factors contributing to containing urban expansion at the regional scale. In detail, urban growth is related to changes in land use efficiency using a multi-step empirical analysis. A basic analysis of the spatio-temporal distribution of land use efficiency between 1960 and 2010 was initially developed. Spatial convergence (or divergence) in land use efficiency was subsequently investigated over time along the urban-rural gradient with the aim of identifying the efficiency of different land use regimes. The relation between land use efficiency and socioeconomic variables was also investigated diachronically, and a summary analysis of long-term urban growth paths and changes in land use efficiency was finally developed using multivariate strategies. The multidimensional approach proposed in this study is regarded as an original contribution to the analysis of complexity in urban patterns and processes over time and space.
3. Results and Discussion
3.1. Descriptive Analysis of Land Use Efficiency in Attica
Selected statistics describing the temporal evolution of per-capita built-up area in Attica are reported in
Table 2 by decade and computed using municipalities as the elementary spatial domain. Statistics indicate a progressive decrease in developed land per inhabitant between 1960 and 2010, but with distinct trends between decades. Median per-capita built-up area decreased by 73 m
2 from 429 m
2 in 1960 to 356 m
2 in 2010, with a non-linear trend showing a moderate increase in 1960–1980 up to a peak of 452 m
2 per inhabitant. This preceded a considerable decrease (1980–2000), in turn followed by a moderate increase in the last decade. Taken together, this pattern highlights the complex urban path observed in the last 50 years in Attica, with distinct expansion waves, alternating settlement densification, sprawl and urban re-polarization. The arithmetic mean of per-capita built-up area at the municipal scale was systematically higher than the median value with an increasing median-to-mean ratio (from 0.44 in 1960 to 0.59 in 2010).
Table 2.
Descriptive statistics on per-capita built-up area (m2) in mainland Attica by year.
Table 2.
Descriptive statistics on per-capita built-up area (m2) in mainland Attica by year.
| Statistic | 1960 | 1970 | 1980 | 1990 | 2000 | 2010 |
|---|
| Median | 429 | 435 | 452 | 280 | 249 | 356 |
| Arithmetic mean | 965 | 1013 | 936 | 475 | 394 | 604 |
| Median/mean | 0.44 | 0.43 | 0.48 | 0.59 | 0.63 | 0.59 |
| Coefficient of variation | 1.85 | 1.57 | 1.41 | 1.36 | 1.18 | 1.02 |
| Geometric mean | 424 | 434 | 395 | 258 | 236 | 322 |
This evidence highlights a deviation from normality in the statistical distribution of per-capita built-up area in Attica and reflects the polarization into distinct urban and rural regions, especially in the earliest decades studied. The coefficient of variation of per-capita built-up area decreased continuously from 1.85 in 1960 to 1.02 in 2010. This indicates the increased homogeneity and spatial balancing of human settlements promoted by the recent urban expansion.
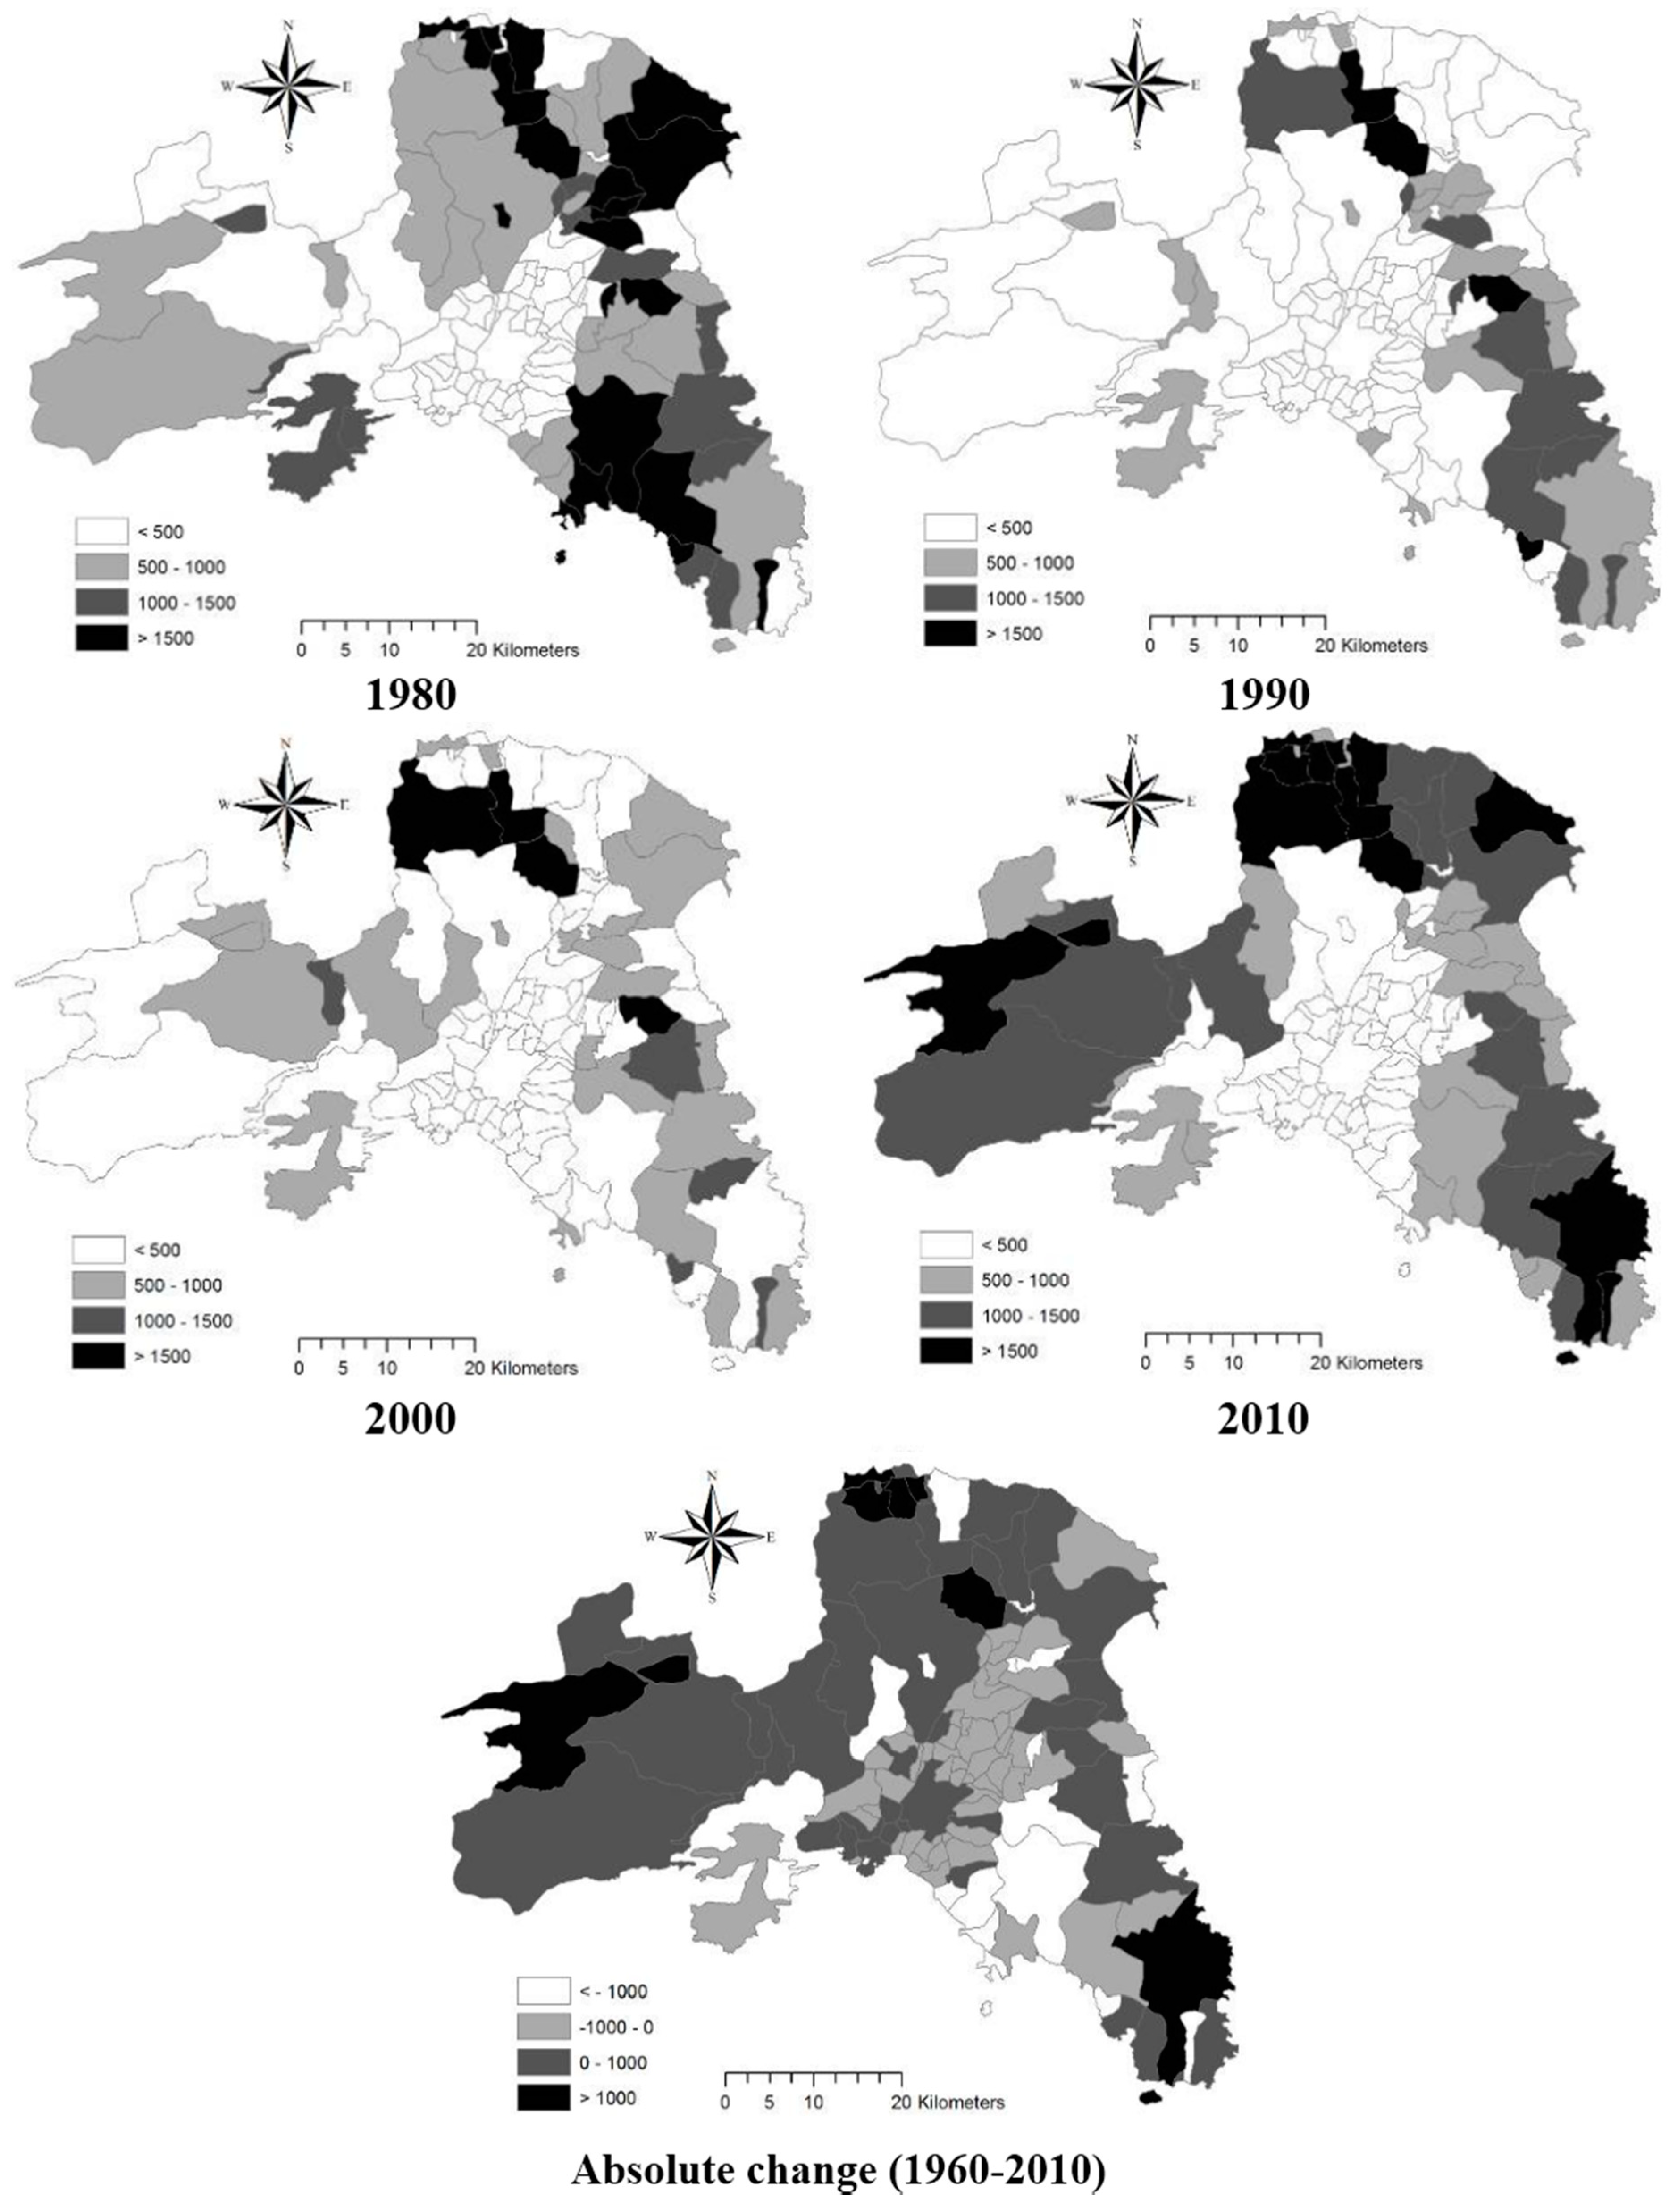
The spatial distribution of per-capita built-up area has been mapped in
Figure 1 and
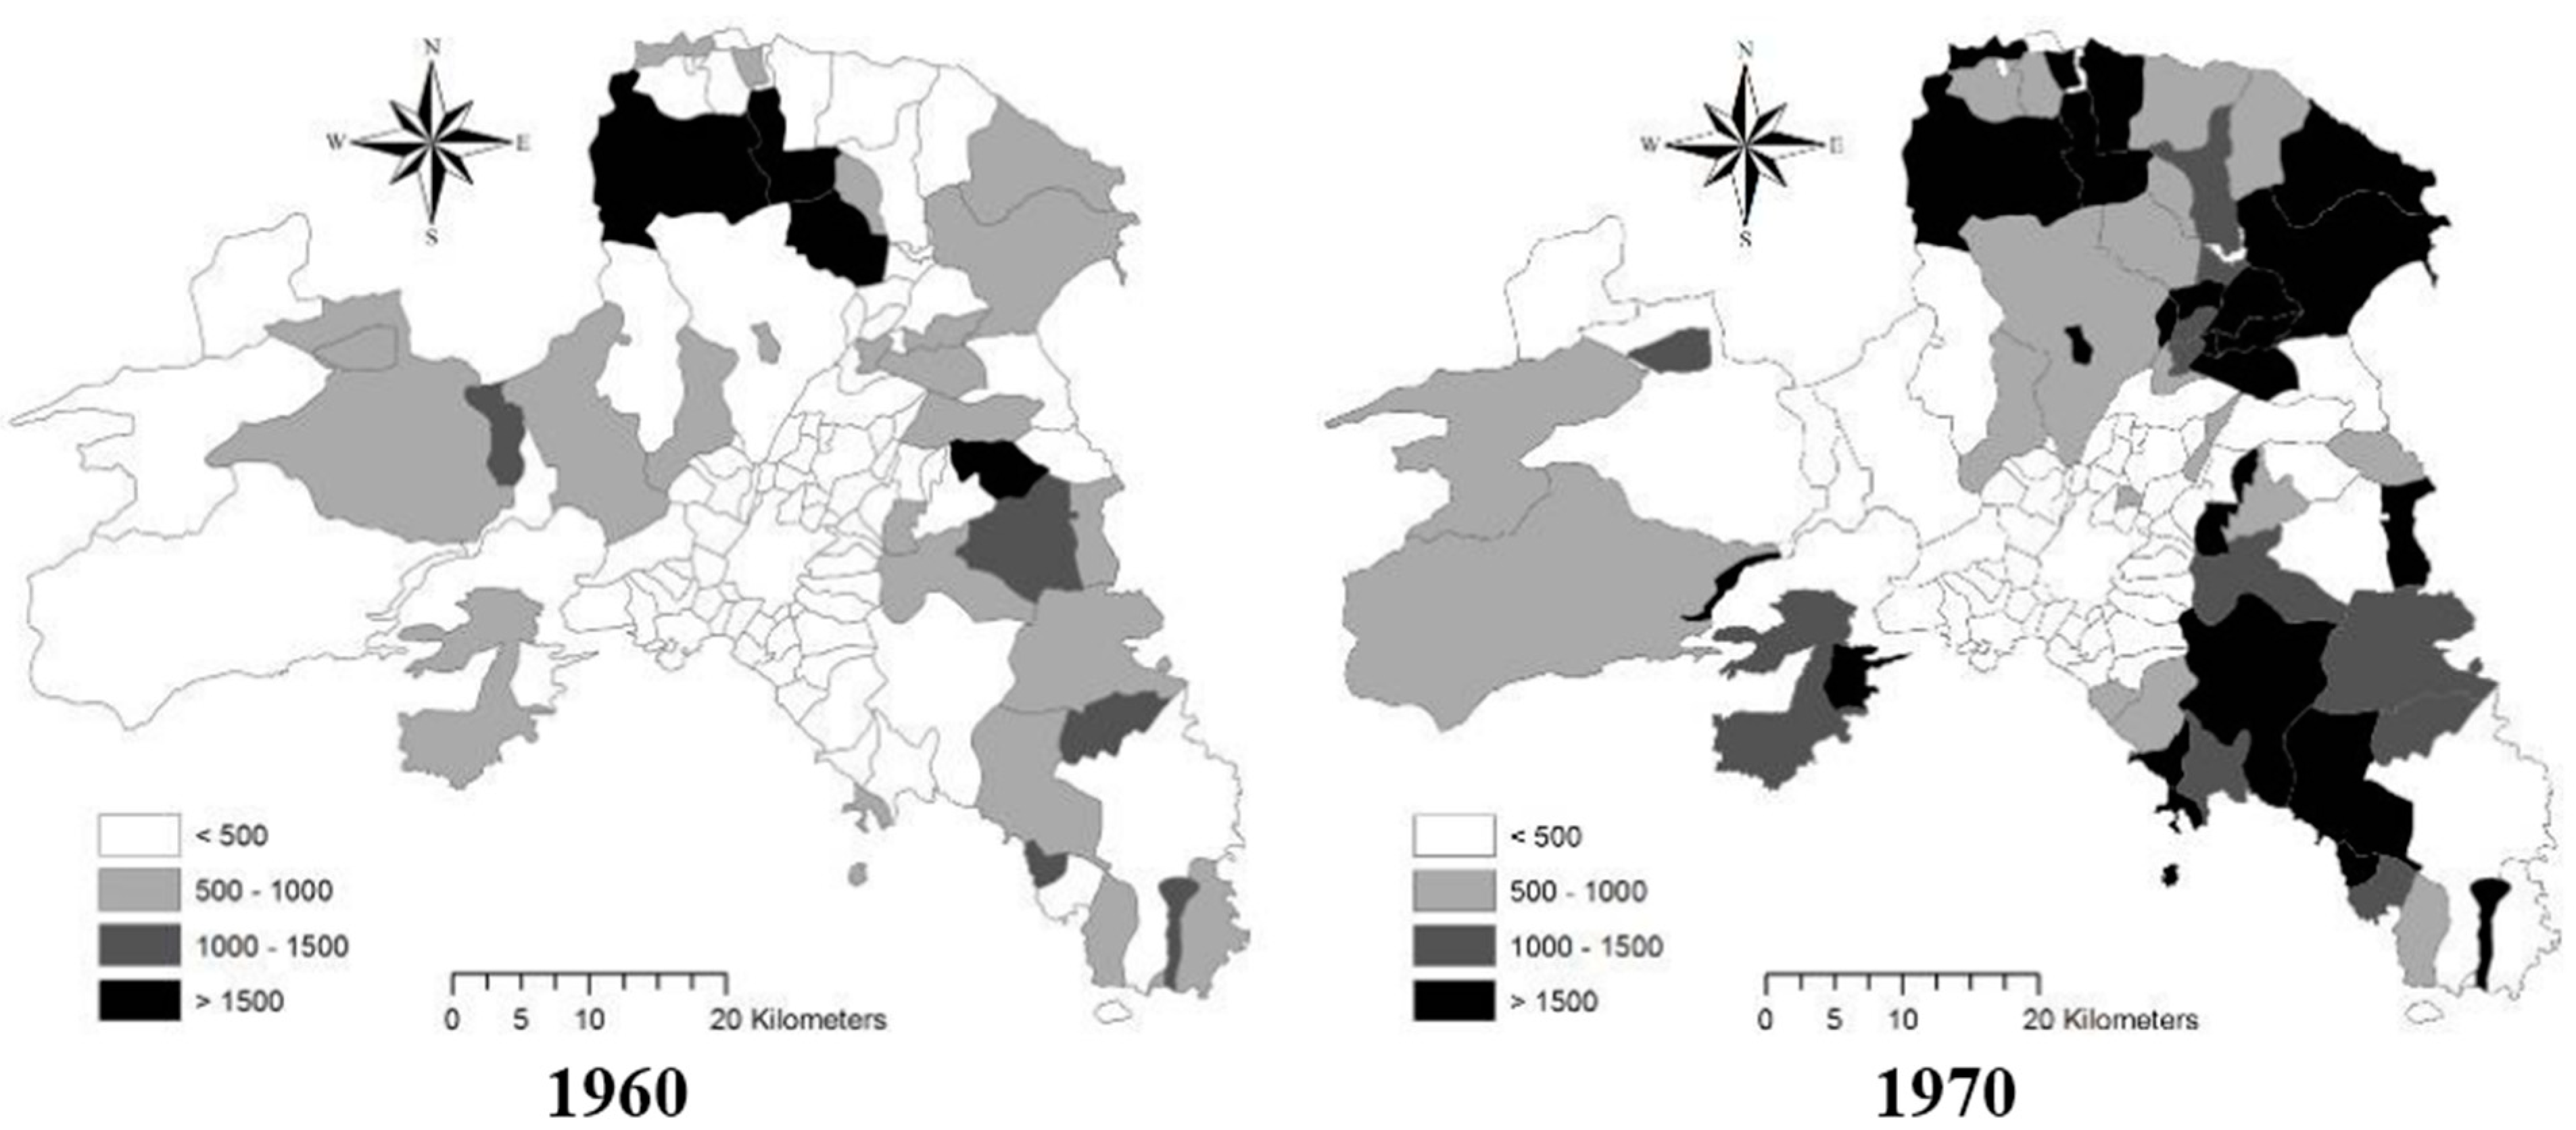
Figure 2 by study year together with the absolute difference between 1960 and 2010. In 1960, LUE was relatively low in the whole of Attica apart from some municipalities located in the northern part of the region, totaling more than 1500 m
2 of developed land per inhabitant (
Figure 2). Per-capita built-up area increased on Athens’ fringe in 1970 and 1980 following a wave of suburbanization with low- and medium-density settlements and house speculation, especially along the coasts. The municipalities with the highest value of developed land per inhabitant were concentrated in the northern and eastern side of the region. In the remaining fringe areas, a moderate process of urban concentration has been observed.
Figure 2.
Per-capita built-up area (m2) by decade and municipality in Athens’ metropolitan area.
Figure 2.
Per-capita built-up area (m2) by decade and municipality in Athens’ metropolitan area.
In 2000, high per-capita built-up areas were concentrated in northern Attica and in the eastern side of the region (Mesogaia Plain). Following the wave of urban re-polarization and sprawl occurring in the last decade encompassing the 2004 Olympic Games, a typical urban-rural gradient in per-capita built-up area was observed in 2010, with the highest values in coastal municipalities. At the same time, urban consolidation occurred in the central area (inner Athens, Piraeus, Maroussi and the surrounding northern suburbs) with developed land systematically <500 m2 per inhabitant. The spatial distribution of the absolute difference of the LUE indicator in each municipality indicates the distinct urbanization waves (concentration, sprawl, re-polarization) observed in the region between 1960 and 2010 well. The municipalities with the largest LUE increase were concentrated along the coast. Conversely, the largest decrease was found in fringe municipalities around Athens with a remarkable population increase. This pattern determined the alteration of the original urban form at the local scale: the strict urban area showed mixed trends with a moderate LUE increase in the inner cities of Athens and Piraeus, mainly driven by population de-concentration and a moderate decrease in the medium-density municipalities in northern Attica (primarily caused by settlement densification).
3.2. Spatial Convergence in Land Use Efficiency over Time
A spatial convergence analysis in LUE by decade (
Table 3) was carried out at the municipal scale. Linear models are significant for all decades, although the highest R
2 was observed for 1960–1970 (0.72) and 1990–2000 (0.86). This result indicates the decades with the largest homogeneity in the spatial distribution of LUE. This evidence is confirmed by non-parametric convergence analysis using Spearman rank correlation tests, identifying 1960–1970, 1970–1980 and 1990–2000 as the most homogeneous decades. Equation slopes (1 indicates a similar spatial distribution between decades) were largely variable over time, with the highest values observed for 1960–1970 (0.76) and 2000–2010 (0.88). The lowest slope coefficients were observed for the decades with relevant changes in the spatial distribution of LUE (see
Figure 2). Based on these findings, the decade 1980–1990 was considered the most heterogeneous decade, possibly representing the shift from compact growth to a more dispersed settlement expansion mode.
Table 3.
Convergence analysis of urban land use efficiency (LUE) observed in each Attica municipality by decade (ns not significant, * significant at p < 0.05; ** significant at p < 0.001).
Table 3.
Convergence analysis of urban land use efficiency (LUE) observed in each Attica municipality by decade (ns not significant, * significant at p < 0.05; ** significant at p < 0.001).
| Parameter | 1960–1970 | 1970–1980 | 1980–1990 | 1990–2000 | 2000–2010 | 1960–2010 |
|---|
| Mainland Attica |
| Intercept | 280.0 ** | 398.6 * | 172.7 * | 77.4 ** | 256.9 * | 549.6 ns |
| Slope | 0.760 ** | 0.531 * | 0.323 * | 0.667 ** | 0.881 * | 0.162 ns |
| R2 | 0.722 ** | 0.411 * | 0.431 * | 0.864 ** | 0.438 * | 0.026 ns |
| Spearman ρ | 0.900 ** | 0.936 ** | 0.867 * | 0.929 * | 0.831 ** | 0.631 * |
| Z sign test | 1.12 ns | 3.91 * | 4.66 * | 2.90 * | 2.80 * | 2.05 * |
| Urban municipalities |
| Intercept | 11.2 ** | 30.8 ** | 43.3 ** | 28.9 ** | 11.7 ** | |
| Slope | 0.806 ** | 0.581 ** | 0.552 ** | 0.737 ** | 0.860 ** | |
| R2 | 0.872 ** | 0.961 ** | 0.869 ** | 0.903 ** | 0.961 ** | |
| Rural municipalities |
| Intercept | 598.1 ** | 932.5 * | 326.8 * | 141.4 ** | 736.8 * | |
| Slope | 0.709 ** | 0.415 * | 0.271 * | 0.629 ** | 0.502 * | |
| R2 | 0.687 ** | 0.280 * | 0.284 * | 0.825 ** | 0.224 * | |
Intercept coefficients indicate the average net increase in LUE, which is not attributable to spatial convergence processes. The highest value was observed for the 1970–1980 decade (399 m2), which represents the time period with the most evident settlement growth in Attica. Decades 1960–1970 and 2000–2010 showed a moderately high coefficient (respectively 280 and 260 m2), while 1980–1990 and 1990–2000 decades were characterized by the lowest net increase. The results of a non-parametric inference (Z sign) testing for significant differences in the statistical distribution of LUE between decades finally suggests that changes between 1960 and 1970 are not significant, with the largest variation being observed between 1980 and 1990. Convergence analysis between 1960 and 2010 indicates a diverging spatial pattern with non-significant R2 coefficient (the absence of a linear correlation between the two years), a weakly significant Spearman ρ coefficient (moderate non-linear correlation) and a high Z sign statistic. All together, these results suggest that a change in the spatial distribution of LUE occurred along the last 50 years in Attica reflecting the two urbanization phases described above.
By classifying municipalities into two homogeneous groups (urban
vs. rural), urban municipalities showed higher convergence than rural municipalities with very high R
2 (from 0.87 to 0.96) and the slope coefficients (from 0.55 to 0.86) for all decades analyzed (
Figure 3). Low intercept coefficients indicate that the average net increase in LUE is moderate and ranges between 11 m
2 and 43 m
2. By contrast, rural municipalities showed a modest convergence between decades, since they experienced more rapid changes in land use efficiency than urban municipalities. Moderate convergence was observed for 1960–1970 and 1990–2000 decades. In the remaining decades, convergence is low or negligible, indicating substantial changes in the structure of settlements at the local scale.
Figure 4 clearly distinguishes urban municipalities from rural municipalities. The former class is more homogeneous than the latter class, confirming the previous results.
3.3. Profiling Attica Municipalities for Urban Land Use Efficiency
Attica municipalities were classified into homogeneous classes of land use efficiency using four criteria and thresholds (
Table 4). The first criterion discriminates municipalities with an increase in per-capita built-up area (LUE+) between 1960 and 2010 from municipalities with decreasing LUE (LUE−). A total of 46 municipalities (69.5% of the total investigated land) showed decreasing land use efficiency during the last 50 years (+519 m
2 per inhabitant on average), while 69 municipalities (30.5% of the total investigated land) showed increasing land use efficiency (−947 m
2 per inhabitant on average). Municipalities with decreasing LUE administer a bigger surface area than municipalities with increasing LUE and host a less dense population, increasing moderately between 1951 and 1981 (from 509 inhabitants/km
2 to 837 inhabitants/km
2) and decreasing slightly between 1981 and 2011 (from 837 inhabitants/km
2 to 799 inhabitants/km
2). By contrast, the share of population residing in LUE(−) municipalities to the total population living in the study area decreased from 70.5% to 44.5%. LUE(−) spatial units are more likely coastal municipalities and are more distant from Athens (+10 km), Piraeus (+7 km), Maroussi (+10 km) and Markopoulo M. (+11 km) than LUE(+) units. This finding reflects the territorial implications of the suburbanization process observed in Athens in the last few decades well.
Table 4.
Basic characteristics of Attica municipalities according to four distinct classification criteria using defined thresholds for the LUE indicator.
Table 4.
Basic characteristics of Attica municipalities according to four distinct classification criteria using defined thresholds for the LUE indicator.
| Variable | LUE Variation | Trend in Per-Capita Built-Up Area | LUE 1960 (m2) | LUE 2010 (m2) |
|---|
| (+) | (−) | L− | L+ | U | inv-U | ?− | ?+ | <500 | >500 | <500 | >500 |
|---|
| No. of municipalities | 69 | 46 | 33 | 4 | 31 | 11 | 13 | 23 | 63 | 52 | 66 | 49 |
| Surface area (%) | 30.5 | 69.5 | 10.0 | 3.5 | 17.9 | 11.3 | 9.1 | 48.2 | 53.0 | 47.0 | 21.6 | 78.4 |
| Average municipal size (km2) | 13.4 | 45.7 | 9.1 | 26.2 | 17.5 | 31.1 | 21.2 | 63.4 | 25.4 | 27.4 | 9.9 | 48.4 |
| Resident population 1951 (%) | 29.5 | 70.5 | 14.6 | 2.1 | 72.5 | 2.3 | 3.6 | 4.9 | 93.3 | 6.7 | 92.1 | 7.9 |
| 1981 (%) | 47.2 | 52.8 | 25.9 | 1.7 | 59.1 | 4.2 | 3.9 | 5.2 | 90.5 | 9.5 | 93.5 | 6.5 |
| 2011 (%) | 55.5 | 44.5 | 32.4 | 1.7 | 45.5 | 5.6 | 6.3 | 8.4 | 81.8 | 18.2 | 88.5 | 11.5 |
| Population density 1951 (/km2) | 484 | 509 | 733 | 302 | 2028 | 101 | 199 | 51 | 883 | 71 | 2137 | 50 |
| 1981 (/km2) | 1707 | 837 | 2857 | 534 | 3640 | 410 | 471 | 120 | 1883 | 223 | 4773 | 91 |
| 2011 (/km2) | 2270 | 799 | 4056 | 612 | 3172 | 618 | 867 | 218 | 1928 | 482 | 5112 | 184 |
| Elevation (m) | 229 | 298 | 210 | 70 | 209 | 268 | 294 | 394 | 221 | 300 | 208 | 323 |
| Coastal municipalities (%) | 23.2 | 37.0 | 24.2 | 75.0 | 16.1 | 27.3 | 23.1 | 47.8 | 28.6 | 28.8 | 19.7 | 40.8 |
| Distance from Athens (km) | 13.0 | 22.5 | 12.1 | 19.5 | 12.0 | 17.6 | 15.2 | 30.0 | 13.4 | 21.0 | 9.1 | 27.3 |
| Distance from Piraeus (km) | 18.1 | 25.2 | 17.0 | 20.3 | 16.1 | 23.3 | 19.8 | 32.8 | 16.6 | 26.2 | 13.2 | 31.4 |
| Distance from Maroussi (km) | 12.6 | 22.8 | 12.2 | 23.1 | 13.3 | 16.1 | 13.6 | 28.6 | 15.2 | 18.6 | 10.5 | 25.0 |
| Distance from Markop. M. (km) | 23.7 | 34.5 | 23.4 | 23.4 | 28.3 | 18.8 | 24.2 | 41.5 | 29.0 | 26.8 | 24.9 | 32.2 |
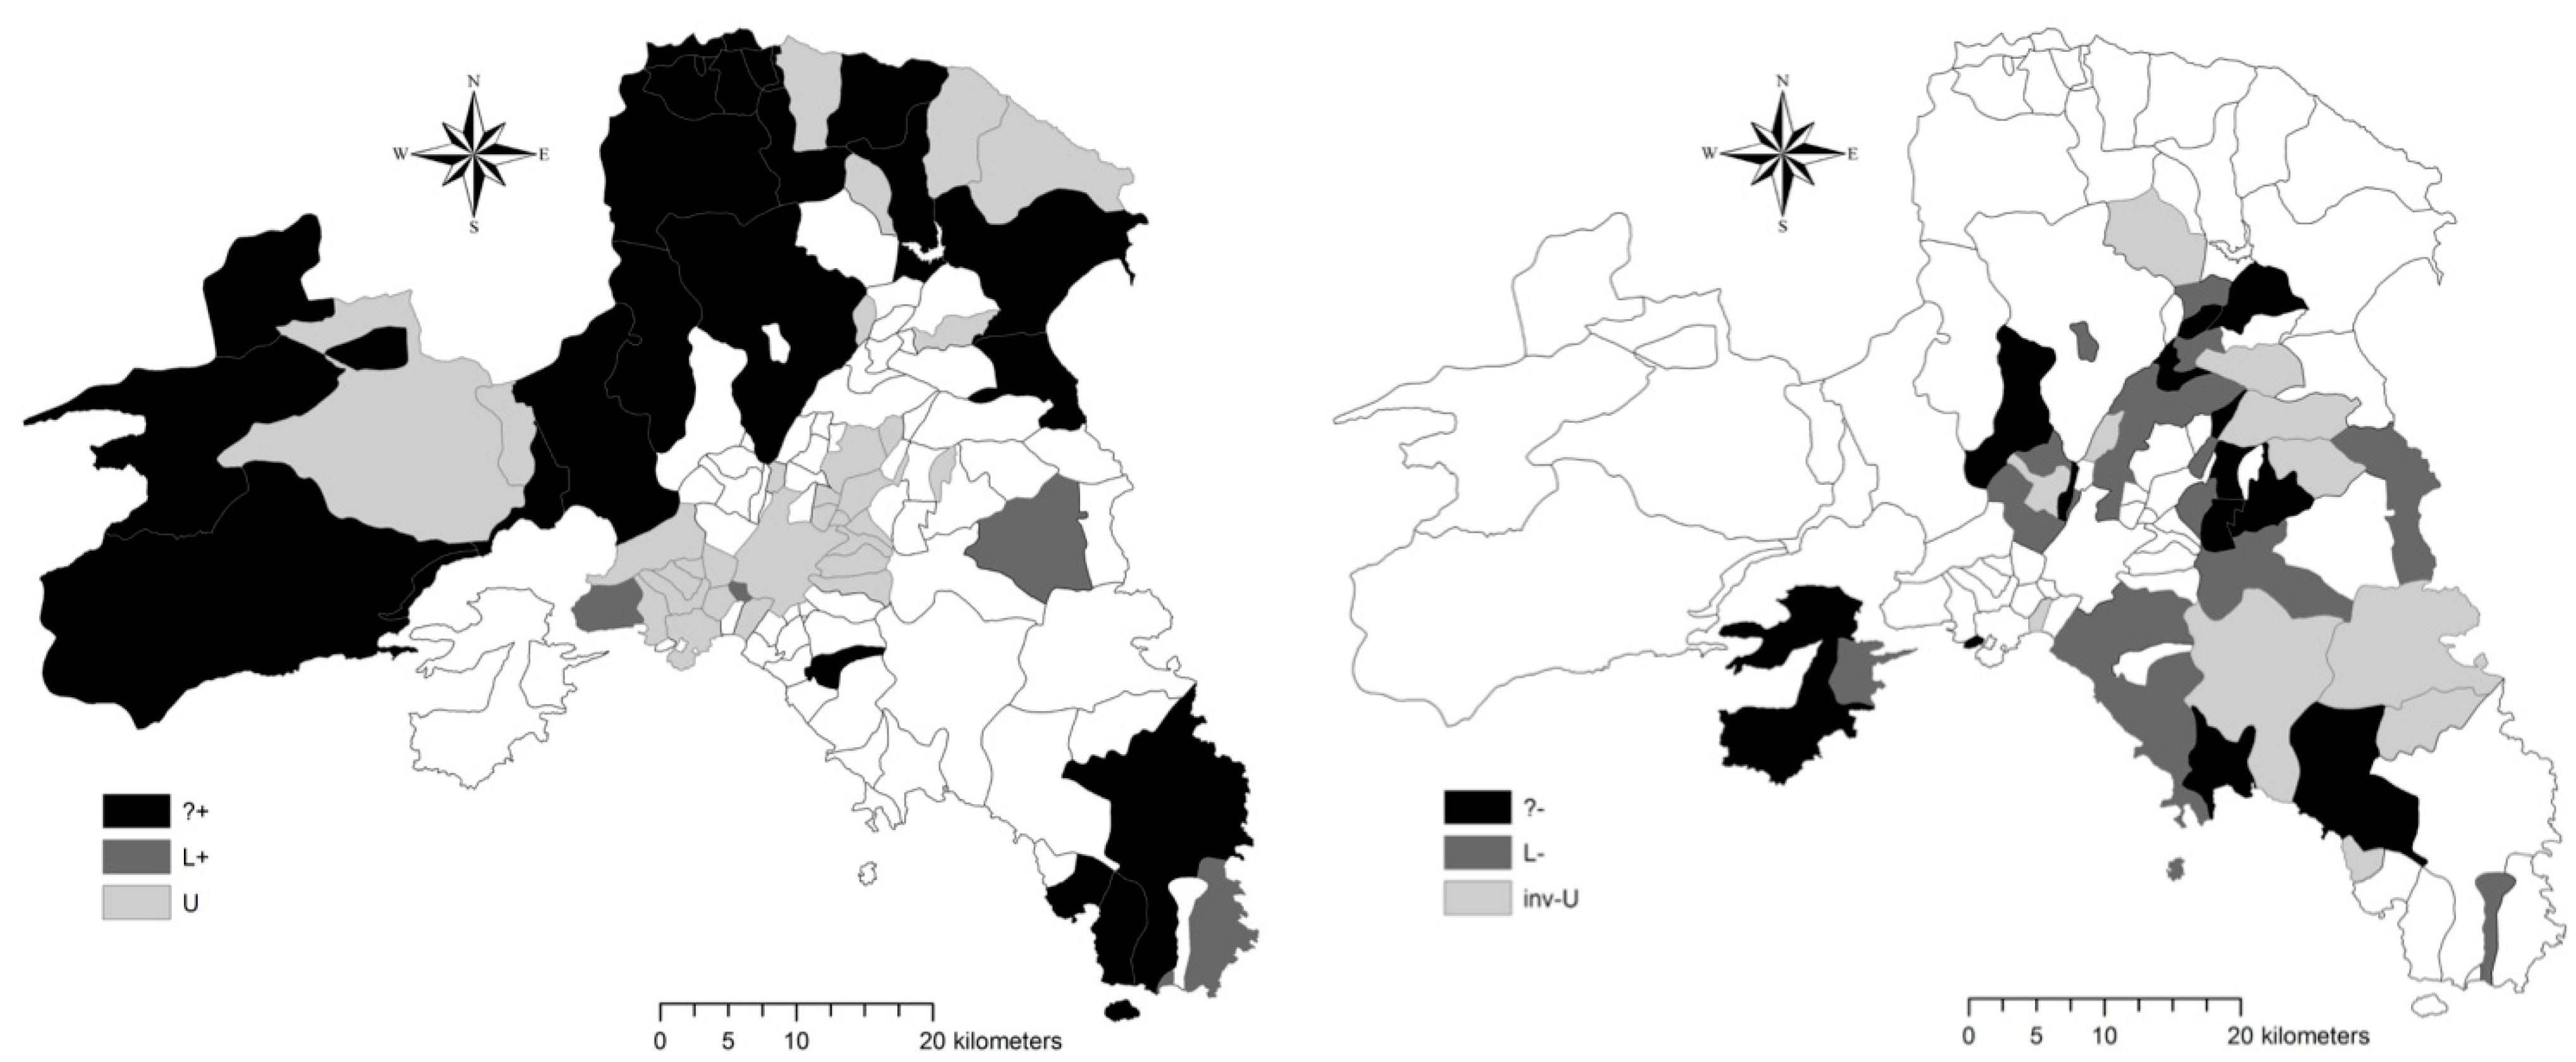
The second criterion discriminates municipalities into six homogeneous trends in per-capita built-up area over 1960–2010 (linear positive or negative trend: L+ or L−; U-shaped and inverse U-shaped square trend: U or inv-U; non-linear, non-square positive or negative trend: ?+ or ?−). The most populated classes are L− and U (respectively 33 and 31 municipalities covering 10% and 18% of the total investigated area). The class occupying the largest surface area is ?+ (48%), including municipalities administering, on average, more than 63 km
2 of land each. This class is typically mixed and heterogeneous with low-density municipalities (from 51 inhabitants/km
2 to 218 inhabitants/km
2) concentrated in both hilly and coastal areas far away from Athens and the other urban sub-centers (
Figure 3). The heterogeneous territorial profile of the municipalities belonging to the six trend classes may indicate the complex relation existing between long-term urban growth and changes in land use efficiency at the local scale.
Figure 3.
Classification of Attica municipalities based on long-term trends in per-capita built-up area ((left) increasing LUE trend classes; (right) decreasing LUE trend classes).
Figure 3.
Classification of Attica municipalities based on long-term trends in per-capita built-up area ((left) increasing LUE trend classes; (right) decreasing LUE trend classes).
Urban municipalities, characterized by high density levels, populated mainly L− and U clusters and host an increasing proportion of resident population. The L+ group includes coastal municipalities with dispersed urbanization, house speculation and second-home settlements. Finally, the inv-U group is interesting from the urban containment perspective: the municipalities belonging to this group experienced a moderate increase in LUE until the 1980s, followed by a rapid decrease in the two most recent decades. These municipalities are examples of urban re-polarization after sprawl, determining a moderate increase in population density.
The last two criteria identify a critical threshold evaluating selected territorial and socioeconomic characteristics of municipalities with low and high urban LUE in both 1960 and 2010. High LUE municipalities increased from 63 to 66 over the study period, administering 53% of the total investigated area in 1960 and only 22% in 2010. Consequently, municipalities classified at low LUE covered 78% of the total investigated area in 2010 with a net increase by 56% during 1960–2010. Comparing 1960 with 2010 figures, the low efficiency class shows a lower population density, higher elevation and a marked increase in the percentage of coastal municipalities and a higher distance from all urban centers (Athens: +6.3 km between 1960 and 2010; Piraeus: +5.2 km; Maroussi: +6.4 km; Markopoulo M.: +5.4 km). This suggests the importance of low-density, sparse settlements determining the increasingly lower land use efficiency observed in several municipalities during the study period.
3.4. Exploring Land Use Efficiency along the Urban-Rural Gradient
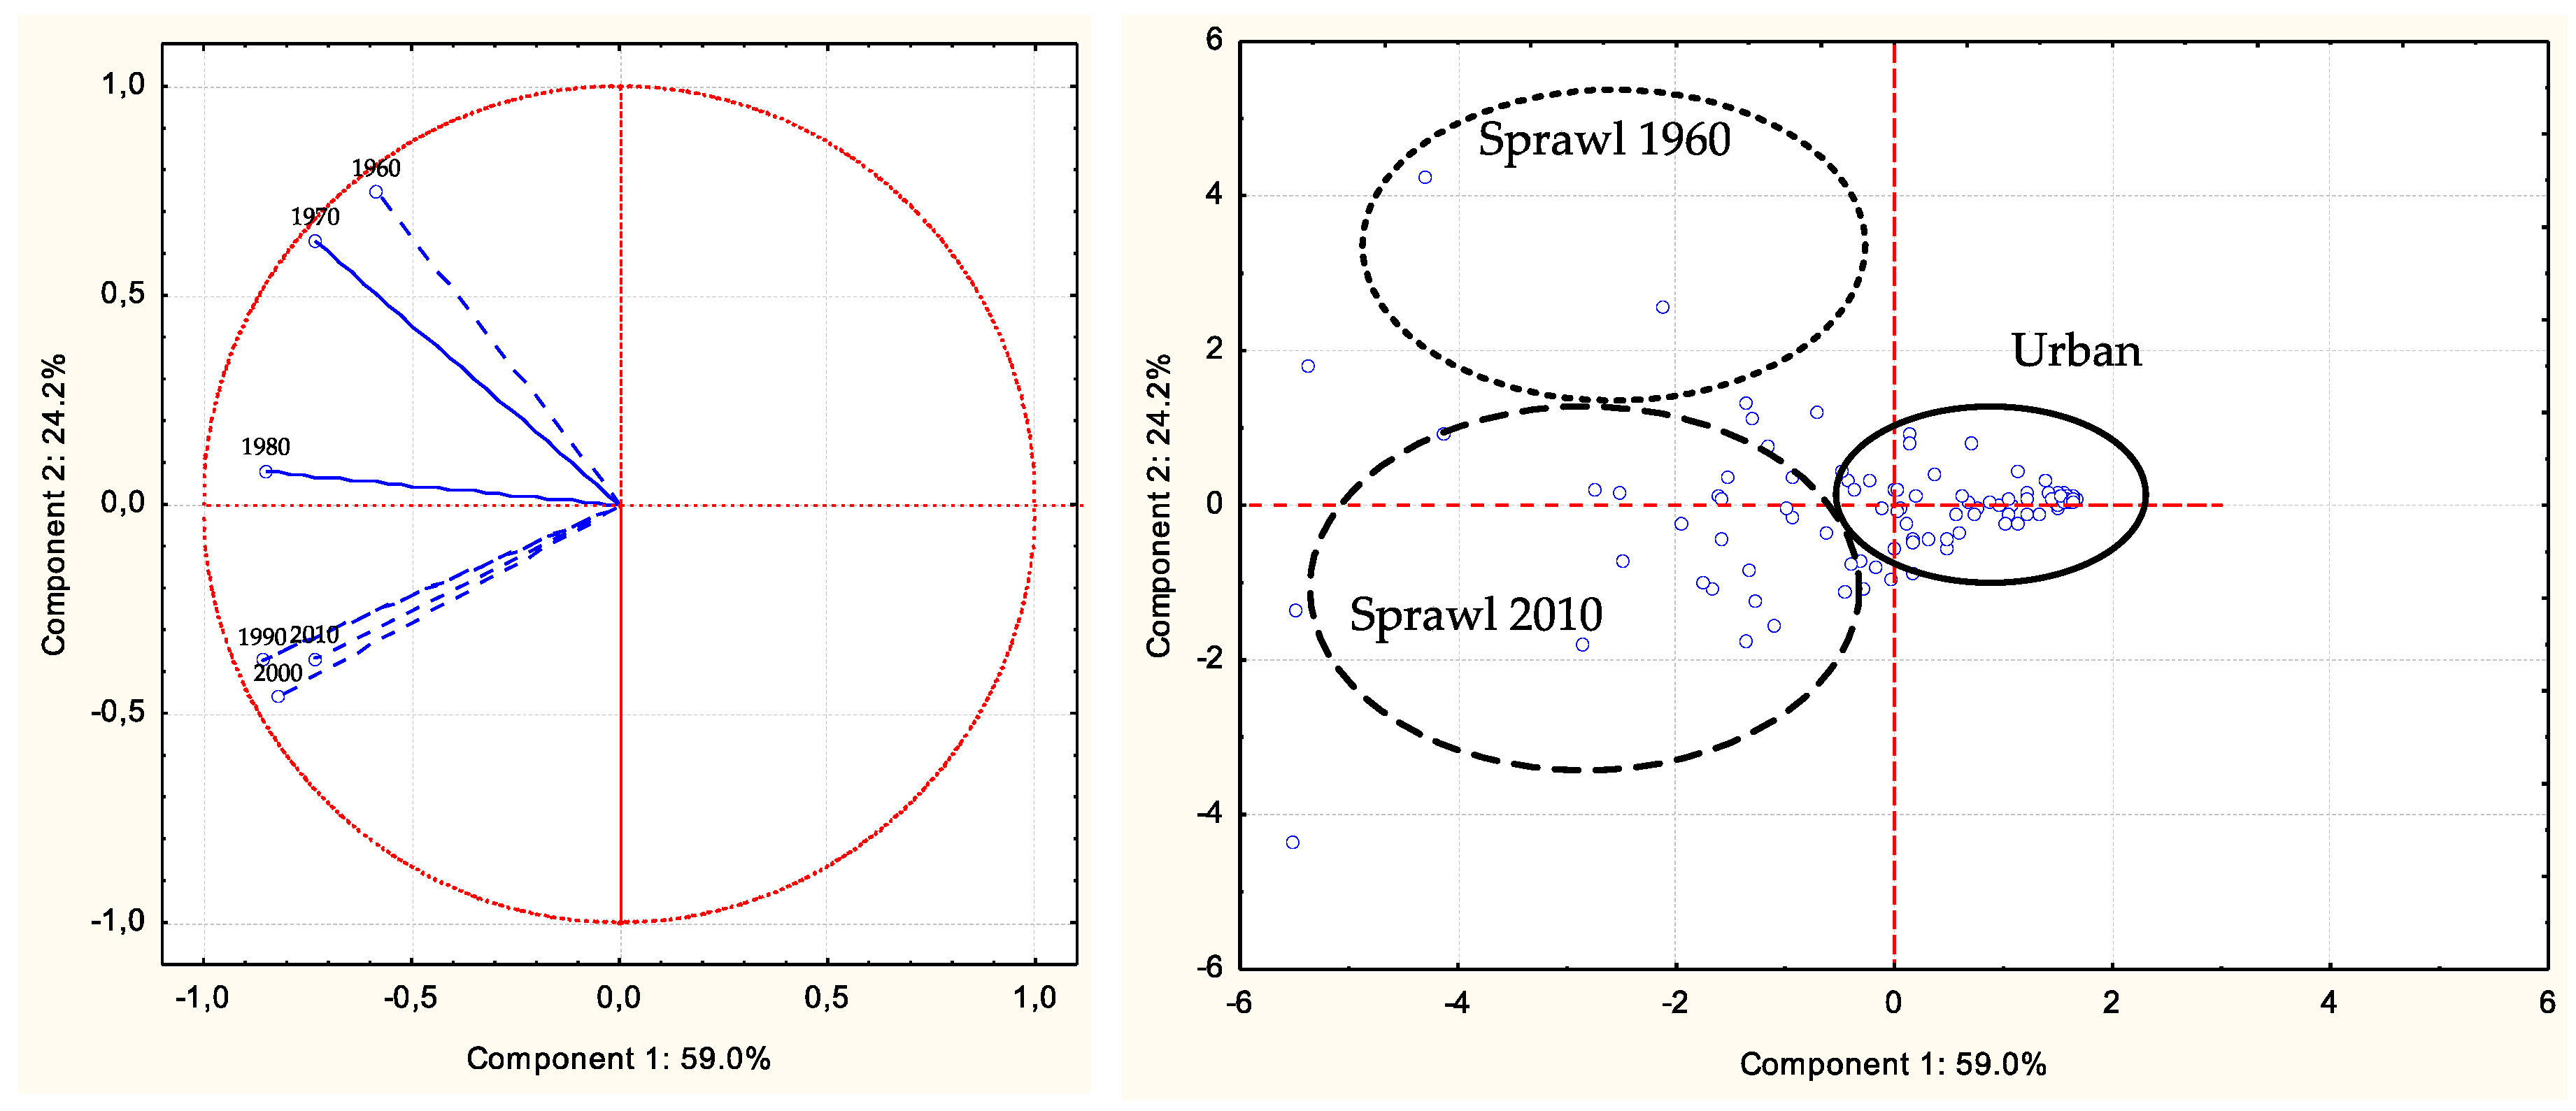
The PCA carried out on the spatial distribution of the LUE indicator in the six decades studied was aimed at extracting the most relevant analysis’ dimensions and identifying homogeneous groups of municipalities based on land use efficiency. Component 1 explains 59% of the total variance and may be regarded as an ‘urban land use efficiency’ gradient, with compact and dense urban municipalities clustered on the positive scores of the axis and rural municipalities with sparse settlements clustered on the negative scores. Component 2 explains 24% of the total variance with scores segregating two distinct groups (
Figure 4): municipalities with low efficiency in the use of land in the earliest observation decades (1960 and 1970) and municipalities with low efficiency in the use of land in the most recent decades (2000 and 2010).
Figure 4.
Principal component analysis applied to the spatial distribution of per-capita built-up area in Attica municipalities by year: (left) component loadings; (right) component scores.
Figure 4.
Principal component analysis applied to the spatial distribution of per-capita built-up area in Attica municipalities by year: (left) component loadings; (right) component scores.
The former group is formed by fringe municipalities surrounding Athens and experiencing the first wave of urban expansion during 1960–1980 and then (re)compacting as a consequence of economic polarization processes. The latter group is formed by rural, remote municipalities with (expanding) sparse settlements and isolated buildings on free land, especially forest areas.
3.5. The Relation between Land Use Efficiency and Socioeconomic Variables
Spearman rank correlations carried out on a decadal scale identified few indicators significantly correlated with per-capita built-up area (
Table 5). As expected, LUE decreased with indicators of urban centrality and settlement compaction, such as building height, population density and diversity in urban land uses. This result reflects the mono-centric structure typically observed in Attica up to the 1980s and the concentration of mixed economic functions in the inner cities of Athens and Piraeus [
30]. Interestingly, correlation intensity (measured by Spearman coefficients) increased for the three indicators, confirming the important role of compact morphologies for urban containment. The proportion of buildings with multiple use, taken as an additional indicator of land use diversification and urban primacy, correlated negatively with LUE, but with stable (or slightly decreasing) Spearman coefficients over time.
Table 5.
Pair-wise Spearman non-parametric correlation analysis between each of the selected indicators and per-capita built-up area (LUE) in six decades between 1960 and 2010 (bold indicates significant correlation at p < 0.05 after Bonferroni’s correction for multiple comparisons).
Table 5.
Pair-wise Spearman non-parametric correlation analysis between each of the selected indicators and per-capita built-up area (LUE) in six decades between 1960 and 2010 (bold indicates significant correlation at p < 0.05 after Bonferroni’s correction for multiple comparisons).
| Variable | LUE |
|---|
| 1960 | 1970 | 1980 | 1990 | 2000 | 2010 |
|---|
| Population density | −0.71 | −0.79 | −0.84 | −0.78 | −0.79 | −0.95 |
| Annual population growth rate | −0.27 | −0.22 | 0.34 | 0.59 | 0.51 | 0.20 |
| Sparse population | 0.20 | 0.34 | 0.45 | 0.51 | 0.52 | 0.74 |
| Agricultural area | 0.35 | 0.47 | 0.56 | 0.54 | 0.56 | 0.77 |
| Forest area | 0.28 | 0.39 | 0.40 | 0.37 | 0.37 | 0.47 |
| Protected land | −0.22 | −0.20 | −0.19 | −0.07 | 0.03 | 0.05 |
| Municipal surface area | 0.30 | 0.35 | 0.44 | 0.43 | 0.51 | 0.64 |
| Inhabitants per building | −0.45 | −0.62 | −0.81 | −0.76 | −0.68 | −0.87 |
| Average building height | −0.50 | −0.62 | −0.68 | −0.68 | −0.70 | −0.85 |
| Self-contained settlements | −0.03 | −0.40 | −0.42 | −0.17 | −0.20 | 0.06 |
| One-dwelling buildings | 0.56 | 0.75 | 0.81 | 0.71 | 0.70 | 0.68 |
| Diversity in urban land use | −0.54 | −0.58 | −0.66 | −0.63 | −0.68 | −0.83 |
| Residential buildings | 0.04 | −0.03 | 0.17 | 0.36 | 0.37 | 0.49 |
| Industrial buildings | −0.36 | −0.23 | −0.13 | −0.14 | −0.07 | −0.15 |
| Hotel use buildings | −0.19 | −0.04 | −0.04 | −0.04 | −0.06 | 0.09 |
| Service/commerce buildings | −0.32 | −0.23 | −0.25 | −0.44 | −0.25 | −0.40 |
| Multiple usage buildings | −0.58 | −0.74 | −0.79 | −0.74 | −0.68 | −0.66 |
| Elevation | 0.40 | 0.40 | 0.39 | 0.35 | 0.39 | 0.38 |
| Coastal municipality | 0.06 | 0.14 | 0.16 | 0.14 | 0.11 | 0.17 |
| Distance from Athens | 0.54 | 0.68 | 0.75 | 0.69 | 0.67 | 0.87 |
| Distance from Piraeus | 0.56 | 0.69 | 0.74 | 0.68 | 0.66 | 0.84 |
| Distance from Maroussi | 0.20 | 0.31 | 0.40 | 0.37 | 0.36 | 0.61 |
| Distance from Markopoulo M. | −0.09 | −0.01 | 0.02 | −0.06 | −0.01 | 0.22 |
The proportion of one-dwelling buildings and the distances from Athens and Piraeus are the indicators showing a significant positive correlation with LUE. This intuitive result confirms that areas with low land use efficiency are concentrated in rural municipalities at distances progressively higher from the inner city. At the same time, the distance from Markopoulo M., the center of Mesogaia Plain (considered as the best example of Athens’ sprawl [
28]), became significant in 2010. This suggests that the Mesogaia area is re-configuring itself through urban polarization and densification (according to [
30]), and low efficiency areas are progressively moving out of Athens’ fringe. In this sense, LUE can be considered an anticipatory variable for spatially-complex urban dynamics moving from compaction to sprawl and back again (but, see also [
14]).
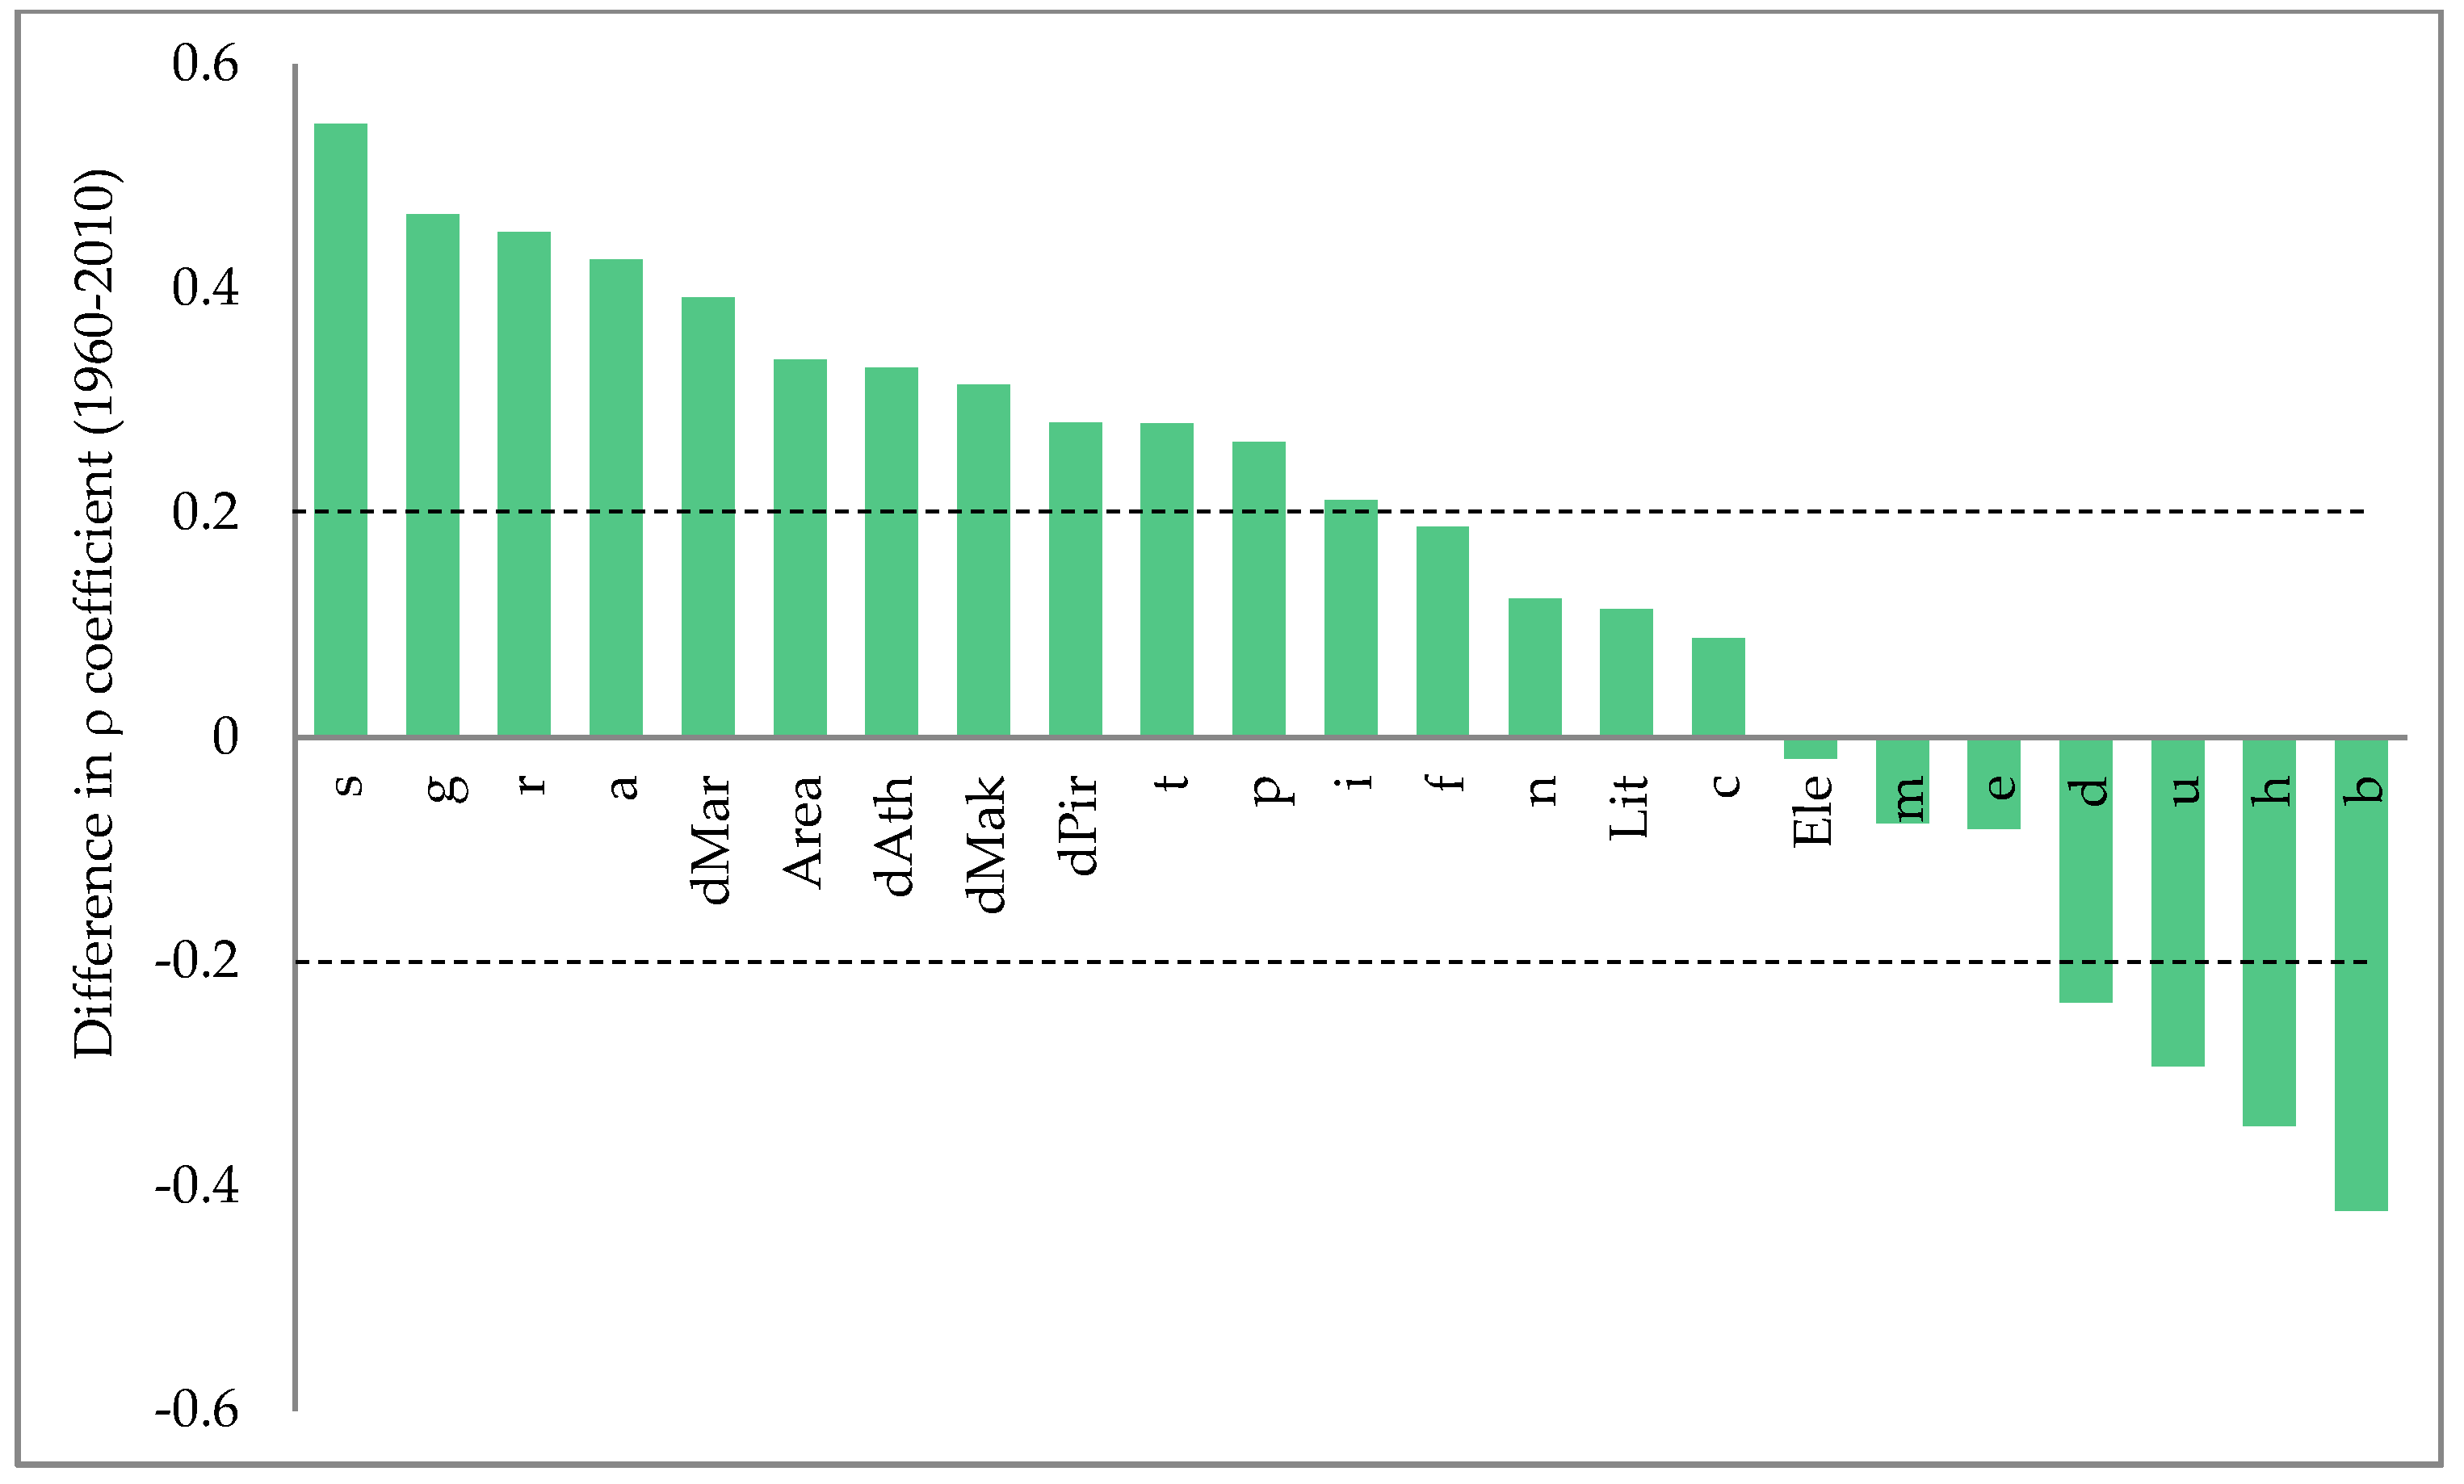
Figure 5 illustrates the indicators with the most changing correlation intensity with LUE between 1960 and 2010. The population growth rate and the proportion of sparse residential settlements are the variables with the highest net increase in the Spearman coefficient over time. This finding suggests that a lower land use efficiency is mainly caused by low-density, discontinuous expansion fuelled by real-estate speculation and increased demand for specific residential house typologies [
23].
Figure 5.
Change in Spearman non-parametric rank coefficients (1960–2010) for the pair-wise correlation between the LUE indicator and each of the socioeconomic and territorial variables * considered in this study (dotted lines indicate the confidence threshold). * s, sparse population; g, annual population growth rate; r, residential buildings; a, agricultural area; dMar, distance from Maroussi; Area, municipal surface area; dAth, distance from Athens; dPir, distance from Piraeus; t, hotel-use buildings; p, protected land; i, industrial buildings; f, forest area; n, one-dwelling buildings; Lit, closeness to the sea; c, self-contained buildings; Ele, mean elevation; m, multiple usage buildings; e, service/commerce buildings; d, population density; u, diversity in urban land use; h, average building height; b, inhabitants per building.
3.6. Changes over Time in the Spatial Determinants of Urban Land Use Efficiency
A step-wise multiple regression analysis (
Table 6) identified the variables impacting LUE levels most in Attica. Taken together, our results reflect a substantial divergence in the urban structure between 1960 and 2010. This allows identifying the different expansion waves in Attica and evaluating their impact on urban land use efficiency. The model’s performance increased over time, passing from 0.13 adjusted R
2 in 1960 to 0.74 in 2010. This may indicate a polarization in areas with high and low efficiency in the use of urban land. In 1960, only the percentage of buildings with multiple uses impacted the LUE distribution negatively. The number of significant predictors increased over time. In 1970, LUE decreased with both the percentage of buildings with multiple uses and the area of self-contained urban expansion.
In 1980, the percentage of one-dwelling buildings was the predictor that impacted the LUE indicator positively with the largest intensity. Lower intensities were observed for the concentration of tourism activities (positive) and agricultural area (negative). Our findings reflect the dominant sprawl model observed in Athens in the late 1970s and the early 1980s. This settlement model was characterized by residential (sometimes informal) urban expansion, creating low-density suburban districts dominated by detached houses, mainly along coastal areas [
4]. The proportion of sparse settlements was the most relevant variable determining higher LUE values also for 1990. In that period, the proportion of residential buildings was negatively correlated with LUE. This pattern was associated with massive industrial re-location from the central city on fringe land typically observed in the 1980s [
36]. This process resulted in the overall decline of land use efficiency in suburban municipalities.
Interestingly, LUE decreases with the distance from Markopoulo Mesogaia. This reflects the intense sprawl observed in Mesogaia Plain since the early 1980s [
28], and it is in line with previous findings indicating urban re-polarization, following dispersed expansion, in the last decade. In 2000, the proportion of sparse settlements is the variable with the highest positive coefficient for LUE and contrasts the negative impact of population density. In 2010, the distance from inner Athens is the variable associated with the most rapid variation in the LUE spatial distribution. However, sparse settlements remain an important variable for LUE together with the extension of forest land. The high vertical profile of buildings, and, thus, settlement compactness/density, is the only variable negatively correlated with LUE. In summary, the multiple regression outputs distinguish among the most relevant socioeconomic and territorial characteristics of the different expansion models in Attica: settlement compaction and population densification in the 1960s; more dispersed expansion along the coasts and on Athens’ fringe in the 1970s; urban consolidation on Athens’ fringe in the 1980s; a moderate re-polarization in peri-urban areas together with a more diffused; discontinuous urban expansion in the 1990s; and finally, urban sprawl in rural areas in the 2000s.
Table 6.
Results of the forward stepwise multiple regression analysis with the LUE indicator as the dependent variable (* indicates a significant coefficient at
p < 0.05; ** indicates a significant coefficient at
p < 0.0001; see
Table 1 for the abbreviations).
Table 6.
Results of the forward stepwise multiple regression analysis with the LUE indicator as the dependent variable (* indicates a significant coefficient at p < 0.05; ** indicates a significant coefficient at p < 0.0001; see Table 1 for the abbreviations).
| Variable | 1960 | 1970 | 1980 | 1990 | 2000 | 2010 |
|---|
| Population density | | | | | −0.31(0.09) ** | |
| Sparse settlement | | | | | 0.35(0.09) ** | 0.25 (0.06) ** |
| Agricultural areas | | | −0.29 (0.10) * | | | |
| Forest areas | | | | | | 0.19 (0.05) ** |
| Average building height | | | | | | −0.17 (0.07) * |
| Self-contained buildings | | −0.26 (0.09) * | | | | |
| One-dwelling buildings | | | 0.74 (0.10) ** | 0.62 (0.09) ** | | |
| Residential buildings | | | | −0.23 (0.09) * | | |
| Hotel-use buildings | | | 0.29 (0.07) ** | | | |
| Multiple usage buildings | −0.37 (0.09) * | −0.34 (0.09) ** | | | | |
| Dist. Athens | | | | | | 0.49 (0.08) ** |
| Dist. Markopoulo | | | | −0.26 (0.08) ** | | |
| Adjusted R2 | 0.13 | 0.23 | 0.40 | 0.27 | 0.31 | 0.74 |
| Fisher-Snedecor F | 17.7 | 18.3 | 25.8 | 15.2 | 26.4 | 82.2 |
| Degrees of freedom | 1113 | 2112 | 3111 | 3111 | 2112 | 4110 |
| Durbin-Watson test | 2.05 | 2.08 | 2.14 | 2.07 | 1.99 | 1.89 |
After the first period (1960, 1970) dominated by the dichotomy between urban areas (with mixed economic functions, dense population and settlement compactness) and rural areas, land use efficiency declined (1980, 1990), with discontinuous, low-density residential settlements along coastal areas surrounding Athens and in ‘sprawl’ districts (such as Mesogaia). In the last two decades (2000, 2010), land use efficiency was shaped by the expansion of sparse (or even isolated) buildings in forest areas at increasing distances from inner Athens. These results also highlight the importance of semi-dense and spatially balanced morphologies, as revealed by the positive impact of the vertical profile of buildings on LUE [
31].
3.7. A Summary Analysis of Urban Growth and Changes in Attica over 1960–2010
Changes in the spatial distribution of land use efficiency and in selected socioeconomic factors were assessed using a multiple factor analysis (
Table 7). The analysis illustrates the expansion waves and the progressive restructuring of the spatial structure of Athens’ metropolitan region by decade. The analysis extracted two factors with an eigenvalue >2 explaining, respectively, 31.7% and 12.2% of the total variance. Factor 1 identifies the urban-rural gradient with the (progressively increasing) opposition between dense municipalities (population density, settlement compactness, building height, diversity in urban land use, buildings with multiple use, density of services) and rural municipalities with sparse settlements (
Figure 6, upper panel). The distribution of loadings along Factor 1 indicates an increasing polarization between urban and rural municipalities over time. In particular, the loadings of urban concentration indicators, such as population density, inhabitants per building and building’s vertical profile, increased continuously over time. The concentration of service activities correlated with Factor 1 in 1990 only.
Table 7.
The multiple factor analysis (MFA) indicator’s loading by factor and year (bold indicates loadings >|0.5|; see
Table 1 for the abbreviations).
Table 7.
The multiple factor analysis (MFA) indicator’s loading by factor and year (bold indicates loadings >|0.5|; see Table 1 for the abbreviations).
| Variable | 1960 | 1970 | 1980 | 1990 | 2000 | 2010 |
|---|
| 1 | 2 | 1 | 2 | 1 | 2 | 1 | 2 | 1 | 2 | 1 | 2 |
|---|
| Population density | 0.71 | 0.28 | 0.74 | 0.29 | 0.78 | 0.28 | 0.81 | 0.27 | 0.83 | 0.25 | 0.84 | 0.24 |
| Pop. growth | 0.55 | −0.10 | 0.53 | −0.15 | 0.09 | −0.36 | −0.29 | −0.28 | 0.01 | −0.45 | 0.11 | −0.58 |
| Sparse settl. | −0.62 | 0.00 | −0.66 | −0.04 | −0.65 | 0.00 | −0.71 | −0.05 | −0.65 | −0.20 | −0.53 | −0.24 |
| Agriculture | −0.45 | −0.56 | −0.49 | −0.50 | −0.51 | −0.45 | −0.77 | −0.31 | −0.82 | −0.27 | −0.81 | −0.11 |
| Forests | −0.34 | 0.54 | −0.37 | 0.51 | −0.37 | 0.53 | −0.26 | 0.51 | −0.27 | 0.60 | −0.34 | 0.64 |
| Protected land | 0.21 | 0.14 | 0.16 | 0.24 | 0.13 | 0.22 | 0.16 | 0.22 | 0.17 | 0.21 | −0.09 | 0.21 |
| Inhab/building | 0.32 | 0.17 | 0.51 | 0.26 | 0.78 | 0.39 | 0.82 | 0.37 | 0.83 | 0.34 | 0.86 | 0.33 |
| Building height | 0.78 | 0.25 | 0.80 | 0.29 | 0.84 | 0.28 | 0.88 | 0.22 | 0.86 | 0.18 | 0.86 | 0.16 |
| Self-containm. | −0.50 | 0.08 | −0.10 | 0.42 | 0.23 | 0.30 | 0.18 | −0.08 | 0.17 | −0.11 | −0.10 | 0.10 |
| One-dwell. buil. | −0.62 | −0.32 | −0.80 | −0.36 | −0.86 | −0.32 | −0.90 | −0.28 | −0.83 | −0.27 | −0.66 | −0.27 |
| Diversity land use | 0.66 | 0.07 | 0.69 | 0.05 | 0.69 | 0.03 | 0.66 | 0.02 | 0.67 | 0.02 | 0.70 | 0.04 |
| Residential buildings | −0.04 | 0.01 | 0.08 | −0.18 | −0.11 | −0.27 | −0.36 | −0.32 | −0.45 | −0.34 | −0.46 | −0.37 |
| Industrial buildings | 0.28 | 0.11 | 0.20 | 0.02 | 0.19 | −0.02 | 0.08 | 0.05 | −0.02 | 0.14 | 0.11 | 0.09 |
| Hotels | 0.26 | 0.05 | −0.12 | 0.21 | 0.07 | −0.04 | 0.05 | 0.22 | −0.09 | 0.23 | −0.05 | 0.26 |
| Service/commerce | 0.33 | −0.02 | 0.18 | 0.05 | 0.47 | −0.02 | 0.64 | 0.11 | 0.42 | 0.16 | 0.40 | 0.08 |
| Multiple-usage buil. | 0.55 | 0.18 | 0.66 | 0.32 | 0.78 | 0.40 | 0.80 | 0.36 | 0.76 | 0.32 | 0.65 | 0.16 |
| Municipal area | −0.19 | 0.32 | −0.30 | 0.31 | −0.29 | 0.36 | −0.25 | 0.34 | −0.22 | 0.40 | −0.22 | 0.40 |
| Elevation | −0.46 | 0.64 | −0.46 | 0.64 | −0.46 | 0.64 | −0.46 | 0.64 | −0.46 | 0.64 | −0.46 | 0.64 |
| Closeness to the sea | −0.21 | −0.45 | −0.21 | −0.45 | −0.21 | −0.45 | −0.21 | −0.45 | −0.21 | −0.45 | −0.21 | −0.45 |
| Dist. Athens | −0.88 | 0.26 | −0.88 | 0.26 | −0.88 | 0.26 | −0.88 | 0.26 | −0.88 | 0.26 | −0.88 | 0.26 |
| Dist. Piraeus | −0.81 | 0.07 | −0.81 | 0.07 | −0.81 | 0.07 | −0.81 | 0.07 | −0.81 | 0.07 | −0.81 | 0.07 |
| Dist. Maroussi | −0.73 | 0.32 | −0.73 | 0.32 | −0.73 | 0.32 | −0.73 | 0.32 | −0.73 | 0.32 | −0.73 | 0.32 |
| Dist. Markopoulo | −0.45 | 0.70 | −0.45 | 0.70 | −0.45 | 0.70 | −0.45 | 0.70 | −0.45 | 0.70 | −0.45 | 0.70 |
| LUE indicator | −0.07 | −0.39 | −0.19 | −0.39 | −0.23 | −0.35 | −0.17 | −0.23 | −0.23 | −0.14 | −0.79 | 0.09 |
By contrast, indicators of discontinuous urban expansion (one-dwelling buildings and sparse settlements) showed negative loadings, with peak values observed for 1990. Taken together, these results confirm that the most relevant changes in the morphological structure of the Attica region (influencing land use efficiency at the local scale) occurred primarily in the 1980s. Interestingly, LUE was associated (negatively) with Factor 1 for 2010 only. This indicates that spatial transformations in Attica are shaping the spatial distribution of land use efficiency along the urban-rural gradient.
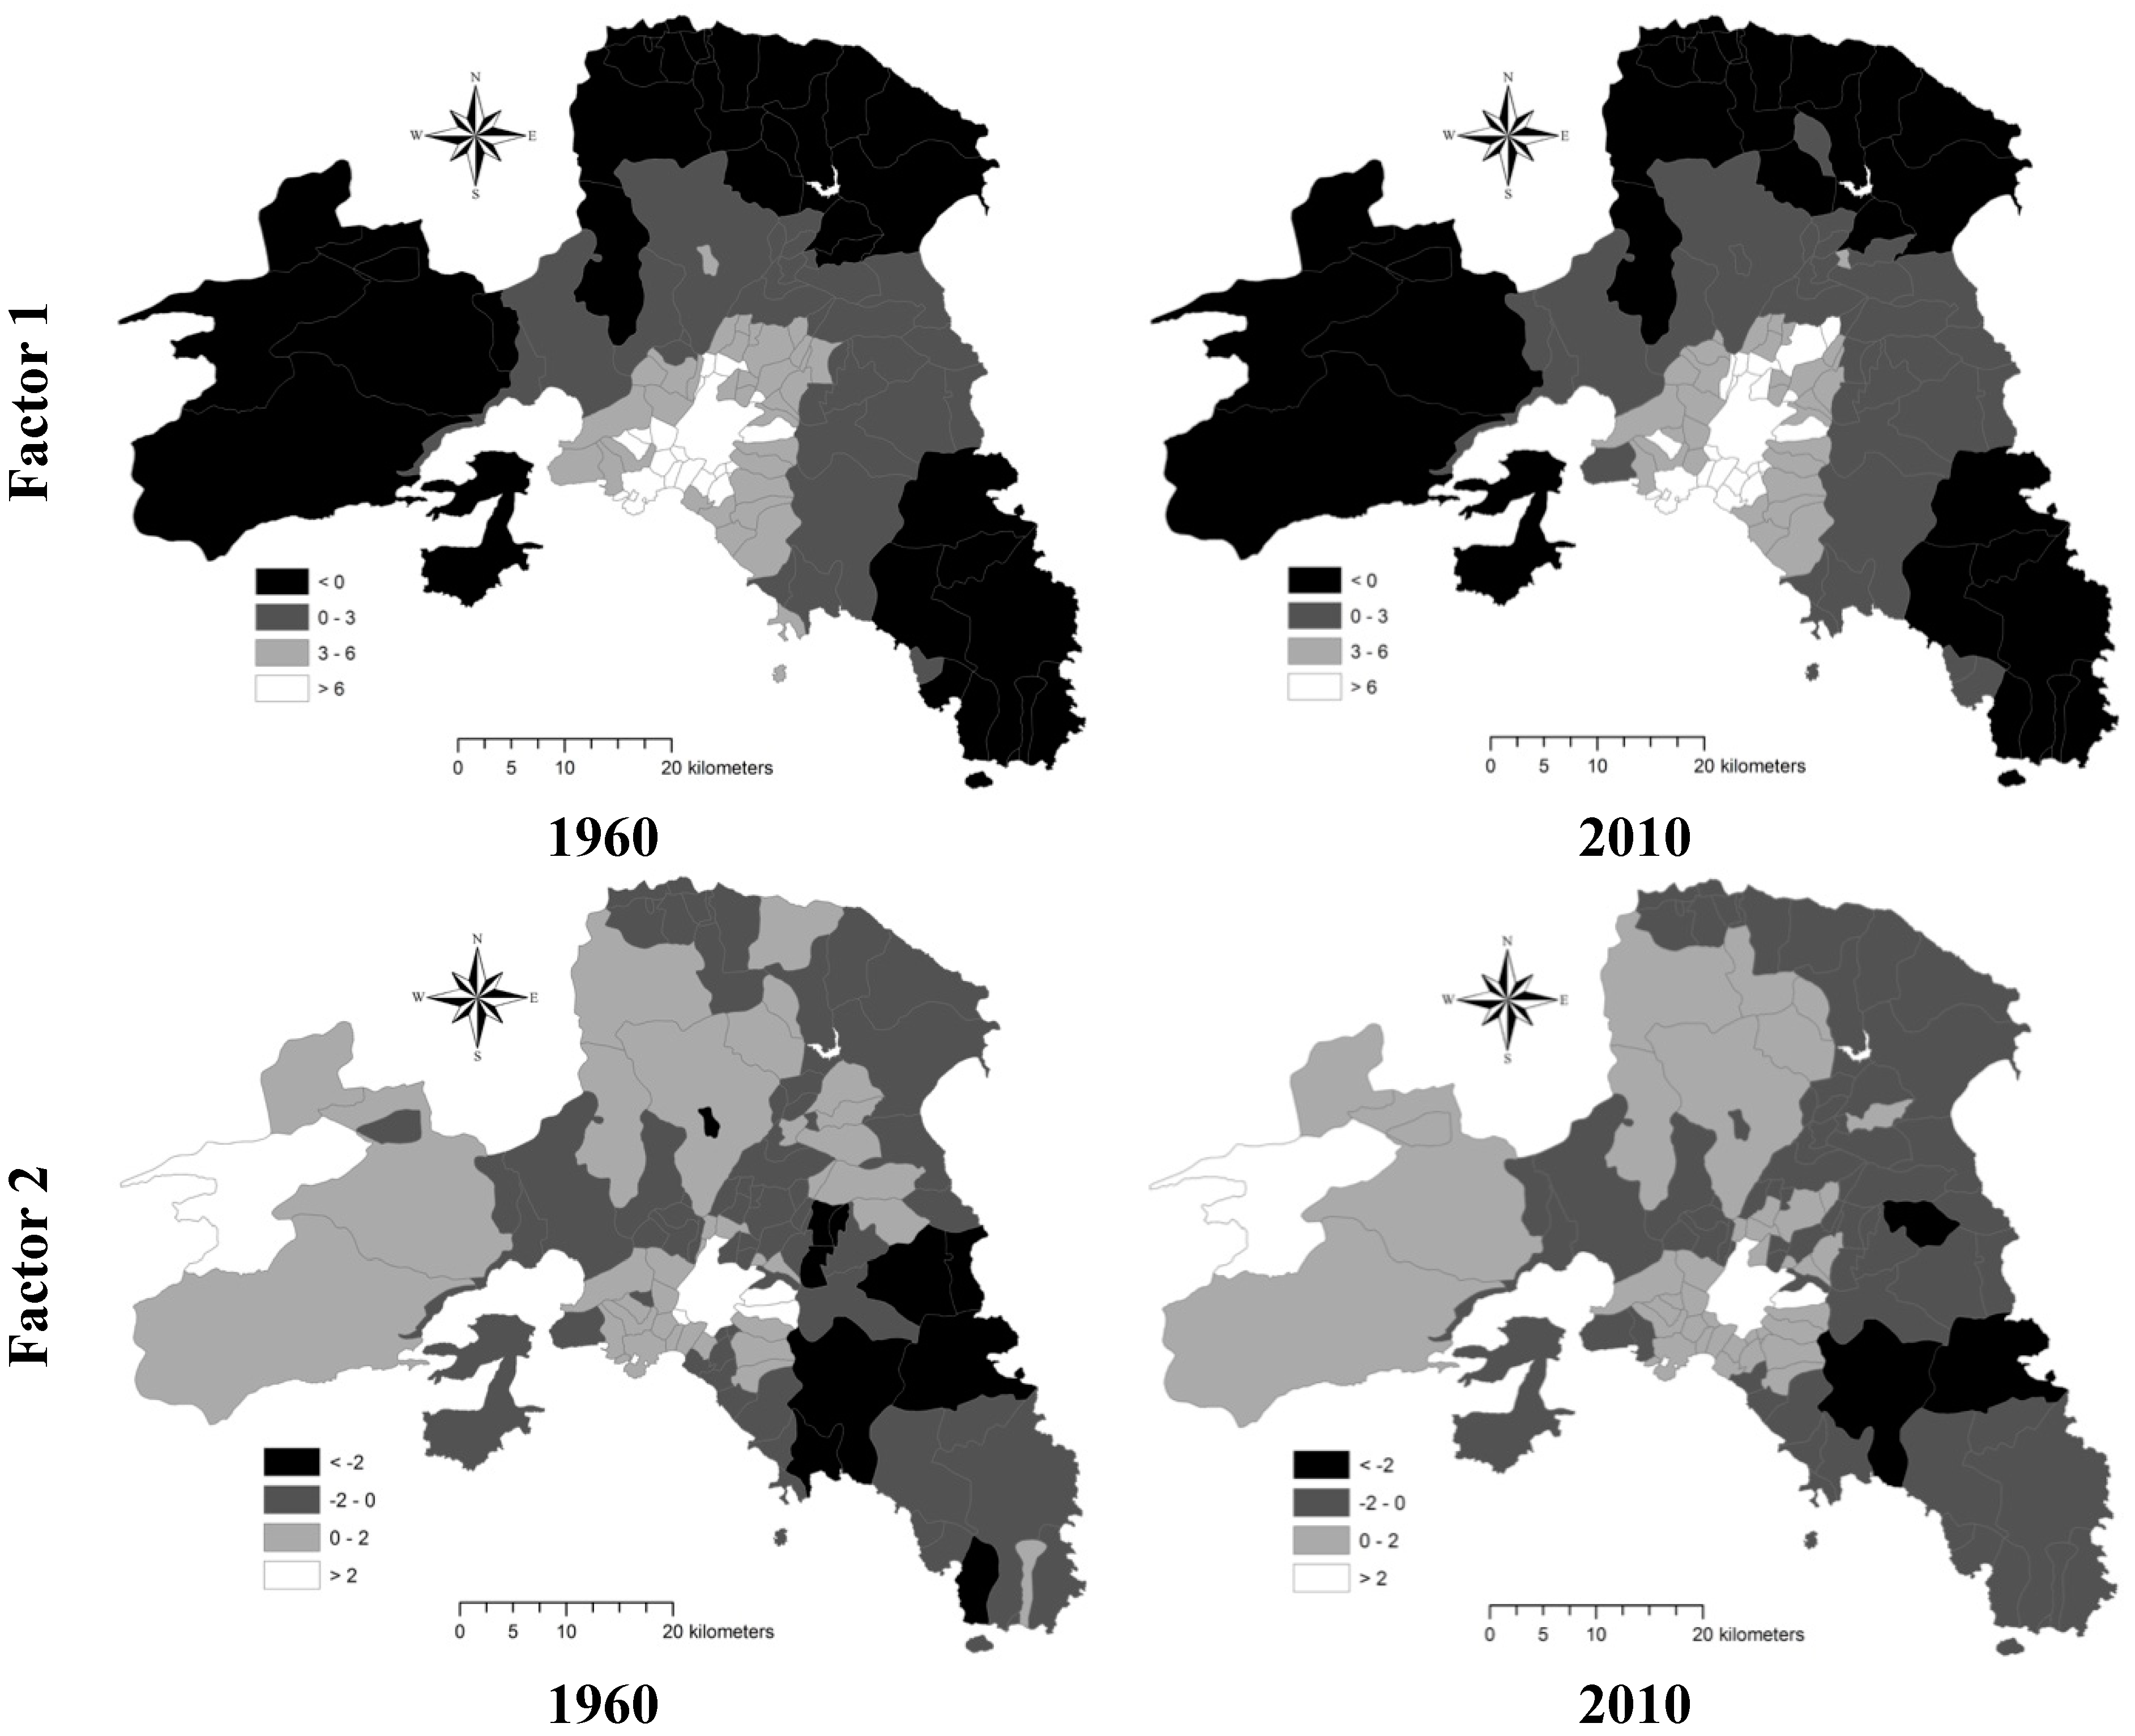
Factor 2 loadings illustrate the regional polarization into agricultural and forest (natural) land. Forest areas showed an increasingly negative loading over time, while the agricultural areas’ loading decreased in absolute terms. Factor 2 represents a typical (non-urban) land use gradient shaped by elevation: forests are associated with hilly and mountain areas, and the reverse pattern is observed for agricultural areas. Only the distance from Markopoulo M. correlated with Factor 2, indicating that agricultural areas were concentrated in Mesogaia in the first decades and then disappeared progressively due to urban sprawl (
Figure 6, lower panel). This result is in agreement with previous studies dealing with land use changes in Attica [
31].
Figure 6.
MFA score map by component and year.
Figure 6.
MFA score map by component and year.
4. Discussion
This study proposed an original framework to assess spatio-temporal changes in urban land use efficiency. An evaluation exercise through quantitative indicators and multivariate statistical approaches was carried out in Attica, a southern European region characterized by consecutive phases of compact and dispersed urban expansion [
29]. Athens’ development did not benefit from an integrated planning of the metropolitan area, being instead influenced by successive waves of de-regulated urban growth characterized by different morphological characteristics and mixed functions [
30]. How urban growth and change influence the efficiency in the use of land at the local scale can be an example for other Mediterranean cities undergoing similar expansion processes, spanning from post-war compact expansion to the sprawled development of recent years [
4,
37,
38,
39]. The novelty of this study is in introducing an operational framework aimed at verifying if and how different urban phases (assessed through a large set of contextual indicators) may affect the efficiency in the use of land at both the local and regional scale. Our work clarified the relation between an efficient use of urban land and the local socioeconomic context, identifying the contextual variables most associated with low soil consumption or, conversely, low urban containment [
40,
41,
42].
The results presented in this paper, based on long-term analysis encompassing the last 50 years of urban growth and change in Athens, indicate the non-linearity in the settlement dynamics and expansion patterns at the local level and the important changes in the urban structure observed at the regional scale. These processes were mainly related to the polarization in areas of low and high efficiency in the use of land along the urban gradient [
31]. Based on these results, multi-scalar sustainable land management policies are particularly important for curbing sprawl in peri-urban contexts [
43]. At the same time, it seems clear that strategies that re-direct urban expansion towards self-contained development, particularly required in Mediterranean contexts featuring traditionally compact urban morphologies, should be based on the promotion of semi-dense, continuous settlements [
44]. This can be done by facilitating the processes of urban consolidation on the fringes developed informally after World War II, as observed in Athens, especially during 1970–1980 and 1980–1990 decades. Mixed urban-rural fringe land is mostly made up of heterogeneous and fragmented areas, which can be converted to urban functions through densification processes, while maintaining a balanced socioeconomic structure and moderate environmental quality [
45]. At the same time, a more effective protection of natural and agricultural land from scattered urban expansion is required for rural districts, which were identified in Attica as the places of the most recent sprawl processes [
32].
Notably, the present study assesses urban land use efficiency in Athens up to the beginning of the economic and political crisis that struck Southern Europe deeply [
46]. It is not yet clear what might be the outcome of these changes in the structure and functions of originally compact, but recently sprawling, regions, such as Attica [
47]. The urban transformations observed in the last decade are characterized by a higher land consumption rate at the local scale and reflect a progressive re-polarization of population, settlements and economic activities along the urban gradient at the regional scale. If this condition continues in the coming years, or conversely, if the economic crisis spurs a more efficient use of urban land, depends on many factors combined [
48], some of which have been analyzed in this work. Every decade that we have analyzed, in fact, was the result of a dynamic equilibrium between settlement patterns and urban functions. As the convergence analysis applied in this study shows, equilibrium conditions have been altered by (more or less marked) social and economic changes. One case is represented by the transition from a compact expansion to a more dispersed growth observed in the 1980–1990 decade, as the regression analysis indicates. Since the socioeconomic changes observed in the most recent years could drive a new turning point in the development path of several Mediterranean cities, further studies are required to ascertain the possible changes in the relation among urban growth, socioeconomic contexts and land use efficiency at the present time.
Evidence suggests how a balanced local context is a key element when promoting an effective and sustainable use of land resources ([
1,
4,
25] among others). This may depend on the fine-tuning among the different components of the system (e.g., social, economic, territorial, environmental), as was sometimes observed in past waves of Athens’ development [
30]. These results have important implications when designing policies for sustainable urban form and promoting the containment of sprawl in de-regulated urban contexts [
18].


