Article

Resource Demand Growth and Sustainability Due to Increased World Consumption

by
Alexander V. Balatsky
1,2,*,
Galina I. Balatsky
2 and
Stanislav S. Borysov
1,3,†
1
Nordita, Roslagstullsbacken 23, 106 91 Stockholm, Sweden
2
Institute for Materials Science, Los Alamos National Laboratory, Los Alamos, NM 87545, USA
3
Nanostructure Physics, KTH Royal Institute of Technology, Roslagstullsbacken 21, SE-106 91 Stockholm, Sweden
*
Author to whom correspondence should be addressed.
Present Address: Singapore-MIT Alliance for Research and Technology, 1 CREATE Way, #09-02, Create Tower, 138602 Singapore;
Sustainability 2015, 7(3), 3430-3440; https://0-doi-org.brum.beds.ac.uk/10.3390/su7033430
Submission received: 7 November 2014 / Revised: 6 March 2015 / Accepted: 17 March 2015 / Published: 20 March 2015
(This article belongs to the Section Economic and Business Aspects of Sustainability)

Abstract

:
The paper aims at continuing the discussion on sustainability and attempts to forecast the impossibility of the expanding consumption worldwide due to the planet’s limited resources. As the population of China, India and other developing countries continue to increase, they would also require more natural and financial resources to sustain their growth. We coarsely estimate the volumes of these resources (energy, food, freshwater) and the gross domestic product (GDP) that would need to be achieved to bring the population of India and China to the current levels of consumption in the United States. We also provide estimations for potentially needed immediate growth of the world resource consumption to meet this equality requirement. Given the tight historical correlation between GDP and energy consumption, the needed increase of GDP per capita in the developing world to the levels of the U.S. would deplete explored fossil fuel reserves in less than two decades. These estimates predict that the world economy would need to find a development model where growth would be achieved without heavy dependence on fossil fuels.

1. Introduction

Globalization and the development of informational technologies have facilitated the growth of expectations among people around the world. Governments do encourage consumption and inflation to fuel economic development [1]. Assuming that better standards imply greater consumption, it is natural to expect greater demand on resources in the near future. Hence, the pattern of resource distribution, like energy, food and water, and, as a separate category, GDP, would need to be readjusted as the world economy evolves. The growth of the world population in countries like China and India and other developing countries in the near future is well established [2]. This growth would also place significant new demands on resources. The following maps below (Figure 1) illustrate total population, annual GDP growth, GDP and energy consumption per capita, indicating that the majority of countries developing their economies will require a large amount of natural resources in the near future [3].
Figure 1. Estimated economic and demographic characteristics by country for 2013. Total population (a); annual GDP growth (%) (b); GDP purchasing power parity (PPP) per capita (current international $) (c); and energy use (kg of oil equivalent) per capita (d). Data and figures are taken from the World Bank website [4,5,6,7,8].
Sustainability 07 03430 g001
Public concern about sustainable development issues has been at the forefront of current discussions on development in recent decades (for illustration purposes, a Google Scholar search produced 2.35 million hits on papers having world “sustainability” in its title [9]). The challenges of global sustainability affect developed economics, like Organization for Economic Co-operation and Development (OECD) member countries, and developing economies, like Middle East and North Africa (MENA) countries, and generate the attention of politicians, prompting high-level discussions between the countries at the United Nations [10]. Google Trend analysis demonstrates that “sustainability” as a search term has currently more than twice the Internet searches as the term “economic growth” [11]. Particularly, this worldwide trend has vividly manifested itself in the U.S., starting from 2007, as an indicator of the possible anticipation of financial crisis [12]. The ongoing discussion on economic development paradigms generally includes three energy supply models: fossil, nuclear and renewable based [13]. Although the future of nuclear and renewable sources of energy is still a question of vigorous debates, the development paradigm based on fossil fuels is unanimously accepted to be unsustainable. More recently, we also start seeing studies suggesting that equal distribution of the international welfare is not likely to happen [14]. In support of this line of research, the current study concludes with significant questions about reaching equality of energy and resource consumption due to natural limitations of economic growth in principle.
In the current investigation, we choose a specific set of questions to address: What growth in percentage of current worldwide consumption of energy, food and water would need to be achieved to reach the average level of a developed industrialized economy, like the U.S., and what relevant resources limitations could constrain that growth? Our goal is to give a bound without engaging in the discussion on what else might happen if this bound cannot be reached. Our calculations demonstrate that growing demands would place significant strains on the existing economic models, which rely on the supply of natural resources. The analysis provides simple and direct “upper bounds” of the impact and demonstrates how significant and far-ranging changes would need to be.

2. Methodology

There is a multitude of aspects to consider to properly assess the consumption of resources. For clarity, we consider total aggregate demands where the growth will occur. We take it as a fact that developing countries strive to improve quality of life for their residents to match the level of the developed world, as opposed to preserving the current level and staying within or lowering to absorb the growing population without any increase in consumption. To keep the analysis as model free as possible, we do not take into account variations of consumption within nor between countries. All factors are considered as aggregated without a detailed analysis of the distribution. This is a rather drastic assumption, as different countries might choose different paths for their development. Modeling the latter would require a more sophisticated approach that would require making many more assumptions that go beyond the present investigation. We also use the fact that the majority of projected fastest growing economies in the world are underdeveloped countries [15], and their economic growth is tightly linked to the use of resources, trying to repeat the historical success model of developed countries.
We derive our findings relying on publically available data from the World Bank [16] and use officially issued figures. Respective countries’ populations are assumed to be constant as of 2012: the U.S. at 313.9 million people, the EU at 503.5 million people, China at 1344.1 million people, India at 1241.5 million people and the world at 7075.0 million people. Under these assumptions, we estimate the required level of resources to bring China, India and the rest of the world to the level of U.S. consumption. We employ linear extrapolation to estimate the projected total consumption given the fixed rate of resource consumption per capita. For example, consider energy (Table 1): the current annual consumption level per capita for the U.S. is 7164.5 kg of oil equivalent. This would set the bound on the consumption to which we would like to scale the levels of India and China. Therefore, taking the respective population level of, for instance, China (1344.1 million people), we arrive at the estimates of the annual total country’s consumption corresponding to the current U.S. level per capita, which equals 7164.5 × 1344.1 = 9618.5 Mt of oil equivalent. Similar calculations are performed for Tables S1–S3. The needed relative increase in annual consumption of the resources depicted in Figure 2 and Figure 3 equals the difference between the needed and current total consumption of a country, divided by the current world total consumption. For example, world energy consumption should be increased by (9618.5 − 2417.1)/12,524.7 × 100% = 57.5%, due to China’s demand alone. Finally, the correlations in Figure 5 are calculated using a simple moving window approach, where a number of equally weighted past values from annual time series for GDP and energy consumption per capita are used for each year.
Table 1. Annual energy use (2011) [17]. A country’s needed total consumption equals U.S. current consumption per capita times the population of the country.
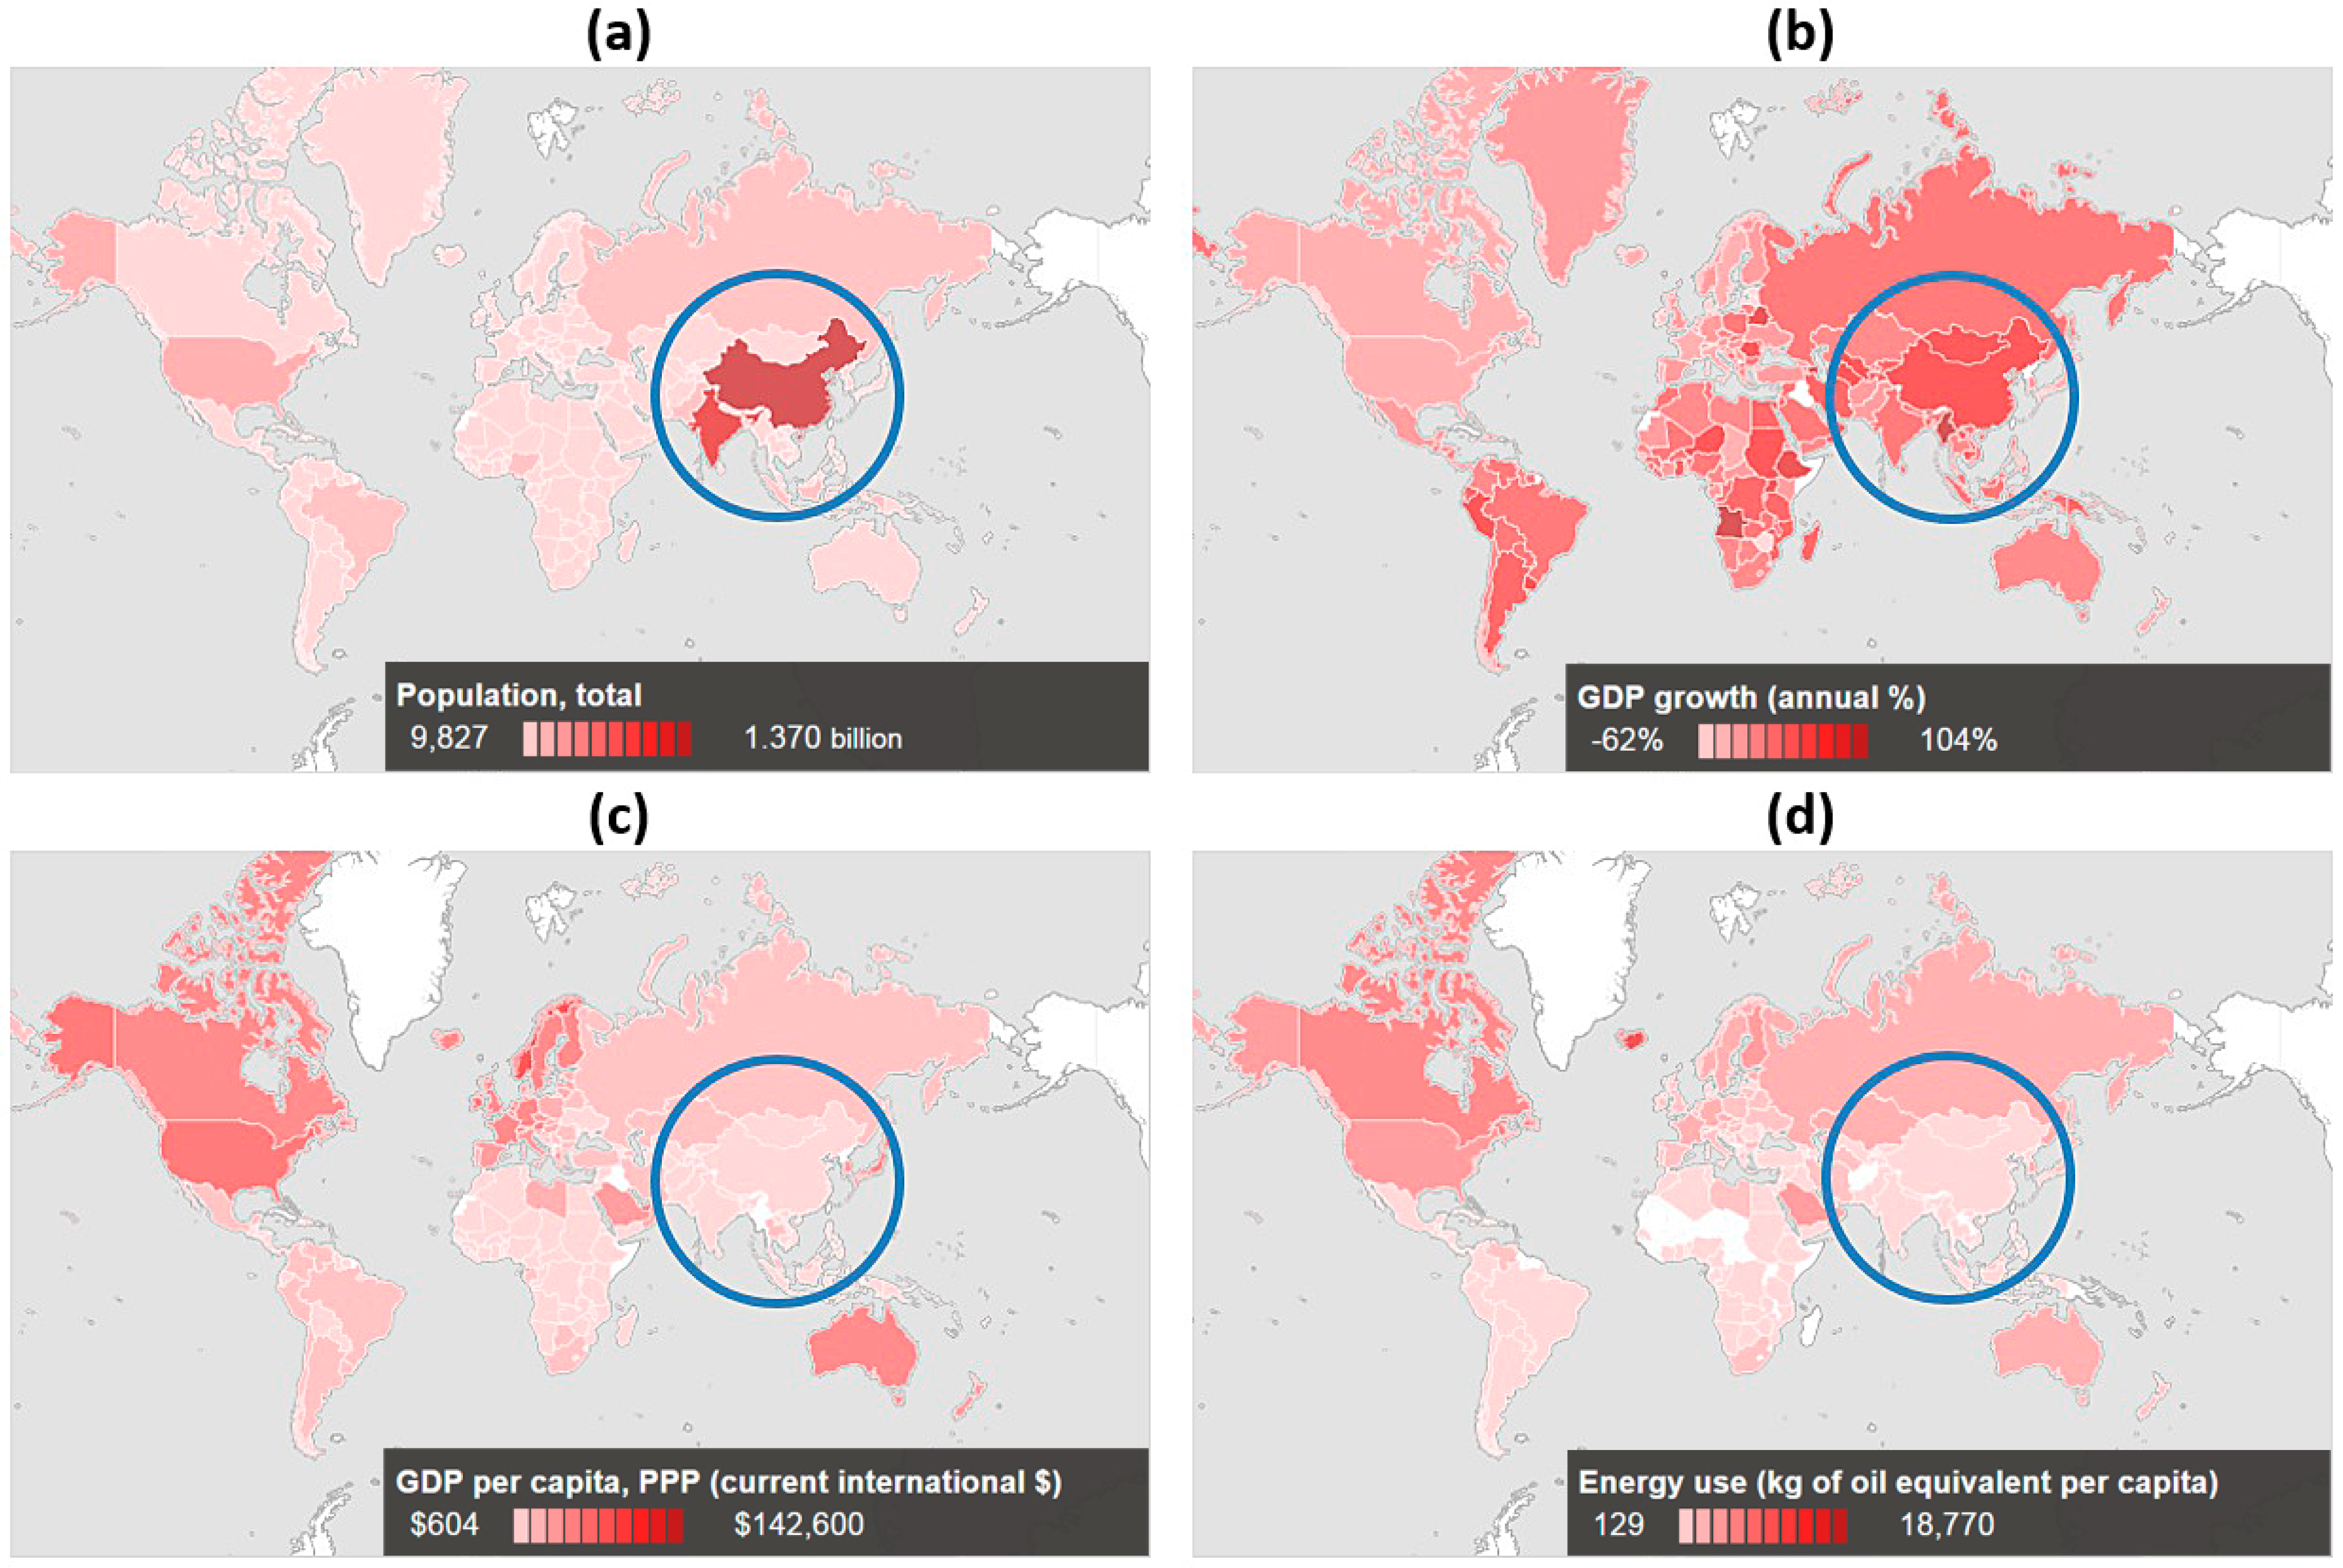
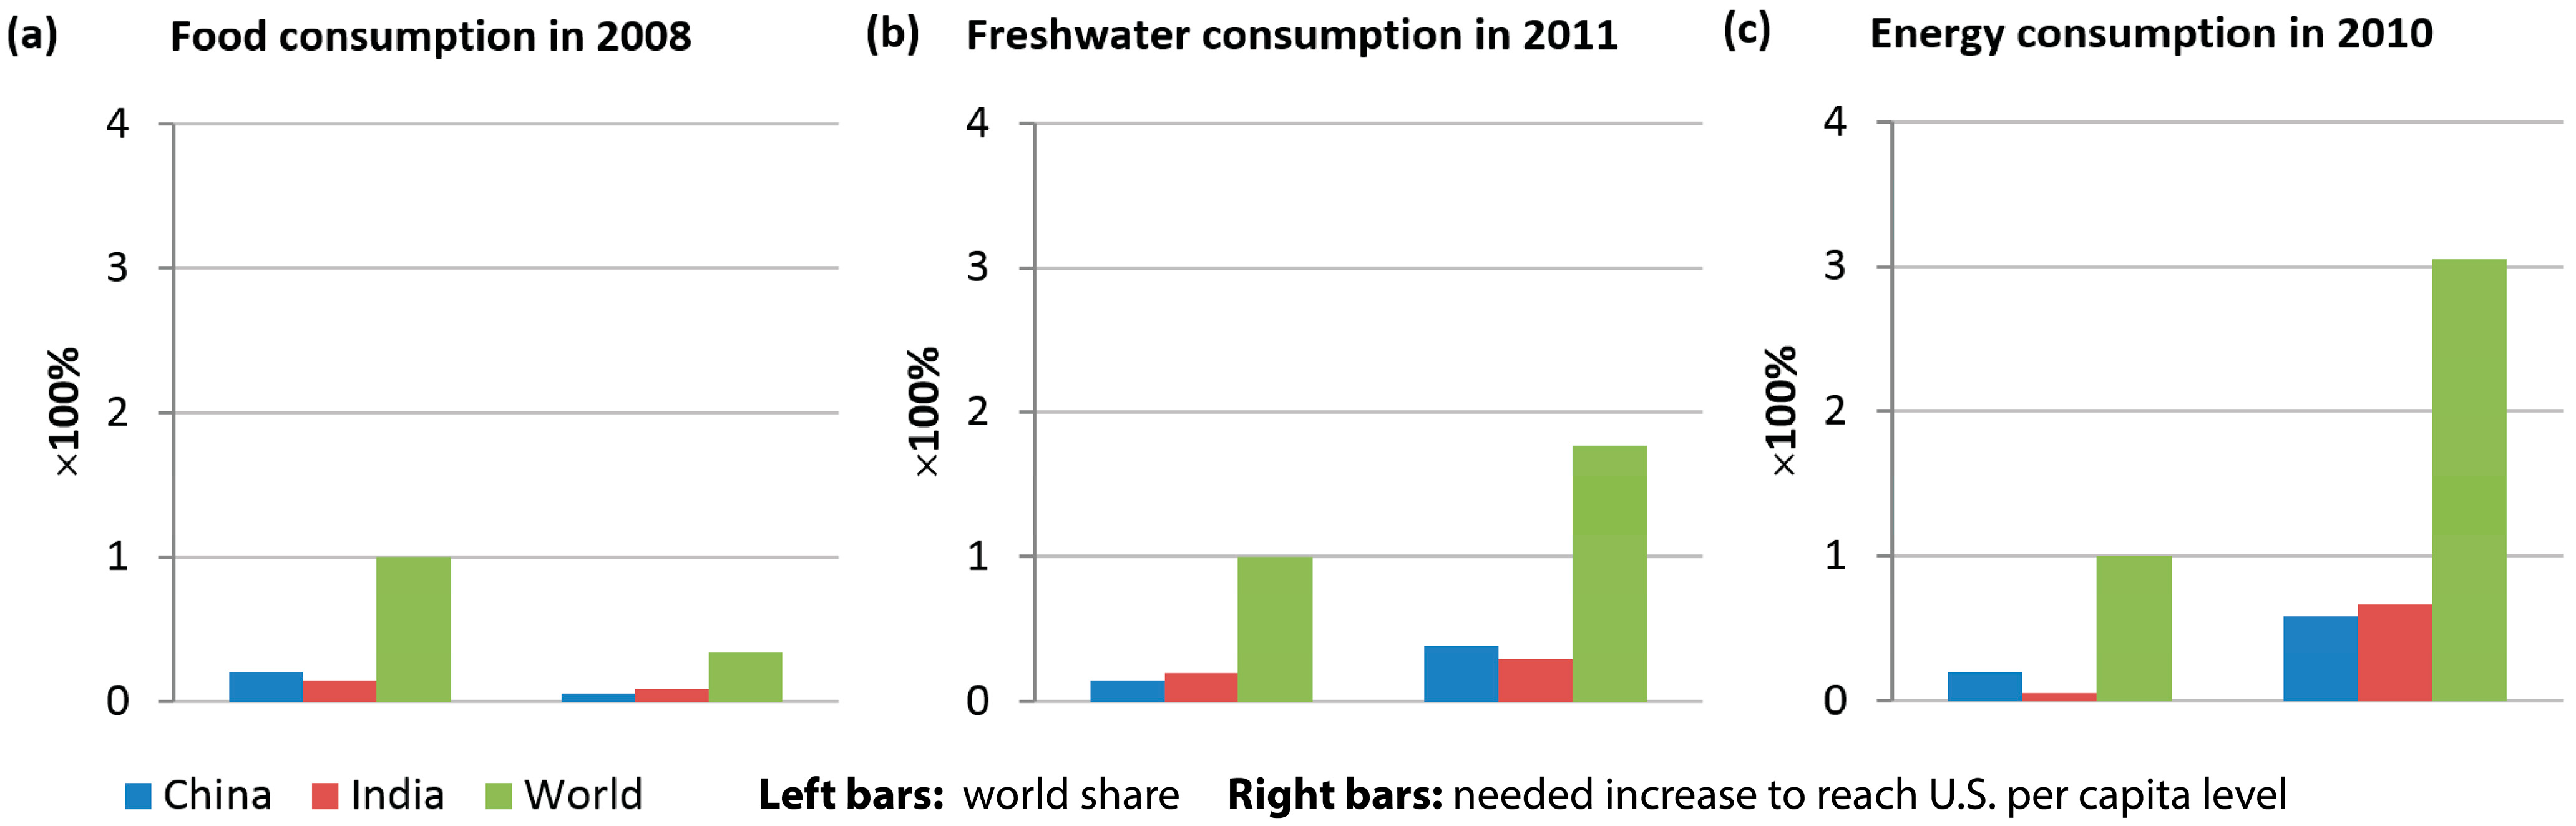
Annual Energy Consumption per Capita (2010) kg of Oil EquivalentTotal Annual Energy Consumption (2010) Mt of Oil EquivalentTotal Annual Energy Consumption Needed to Reach U.S. Level (2010) Mt of Oil Equivalent
U.S.7164.52216.32216.3
EU-273412.81714.33603.3
China1806.82417.19618.5
India565.6692.78885.2
World1881.112,524.750,688.8
Figure 2. Analysis of: dietary energy (a); freshwater (b); and energy (c) consumption. Left bars represent a country’s share in the current total world consumption; right bars indicate the needed total increase in world consumption to reach the current U.S. per capita level for a particular country and the world in general. The bars are calculated using the data from [17,18,19] represented in Tables S1 and S2 and Table 1, respectively.
Sustainability 07 03430 g002
Figure 3. Analysis of GDP (a) and GDP PPP (b) levels. Left bars represent the share of the current total world GDP; right bars indicate the needed total world increase in GDP to reach the current U.S. per capita level. The bars are calculated using the data from [20,21] represented in Tables S3 and S4, respectively.
Sustainability 07 03430 g003

3. Results and Discussion

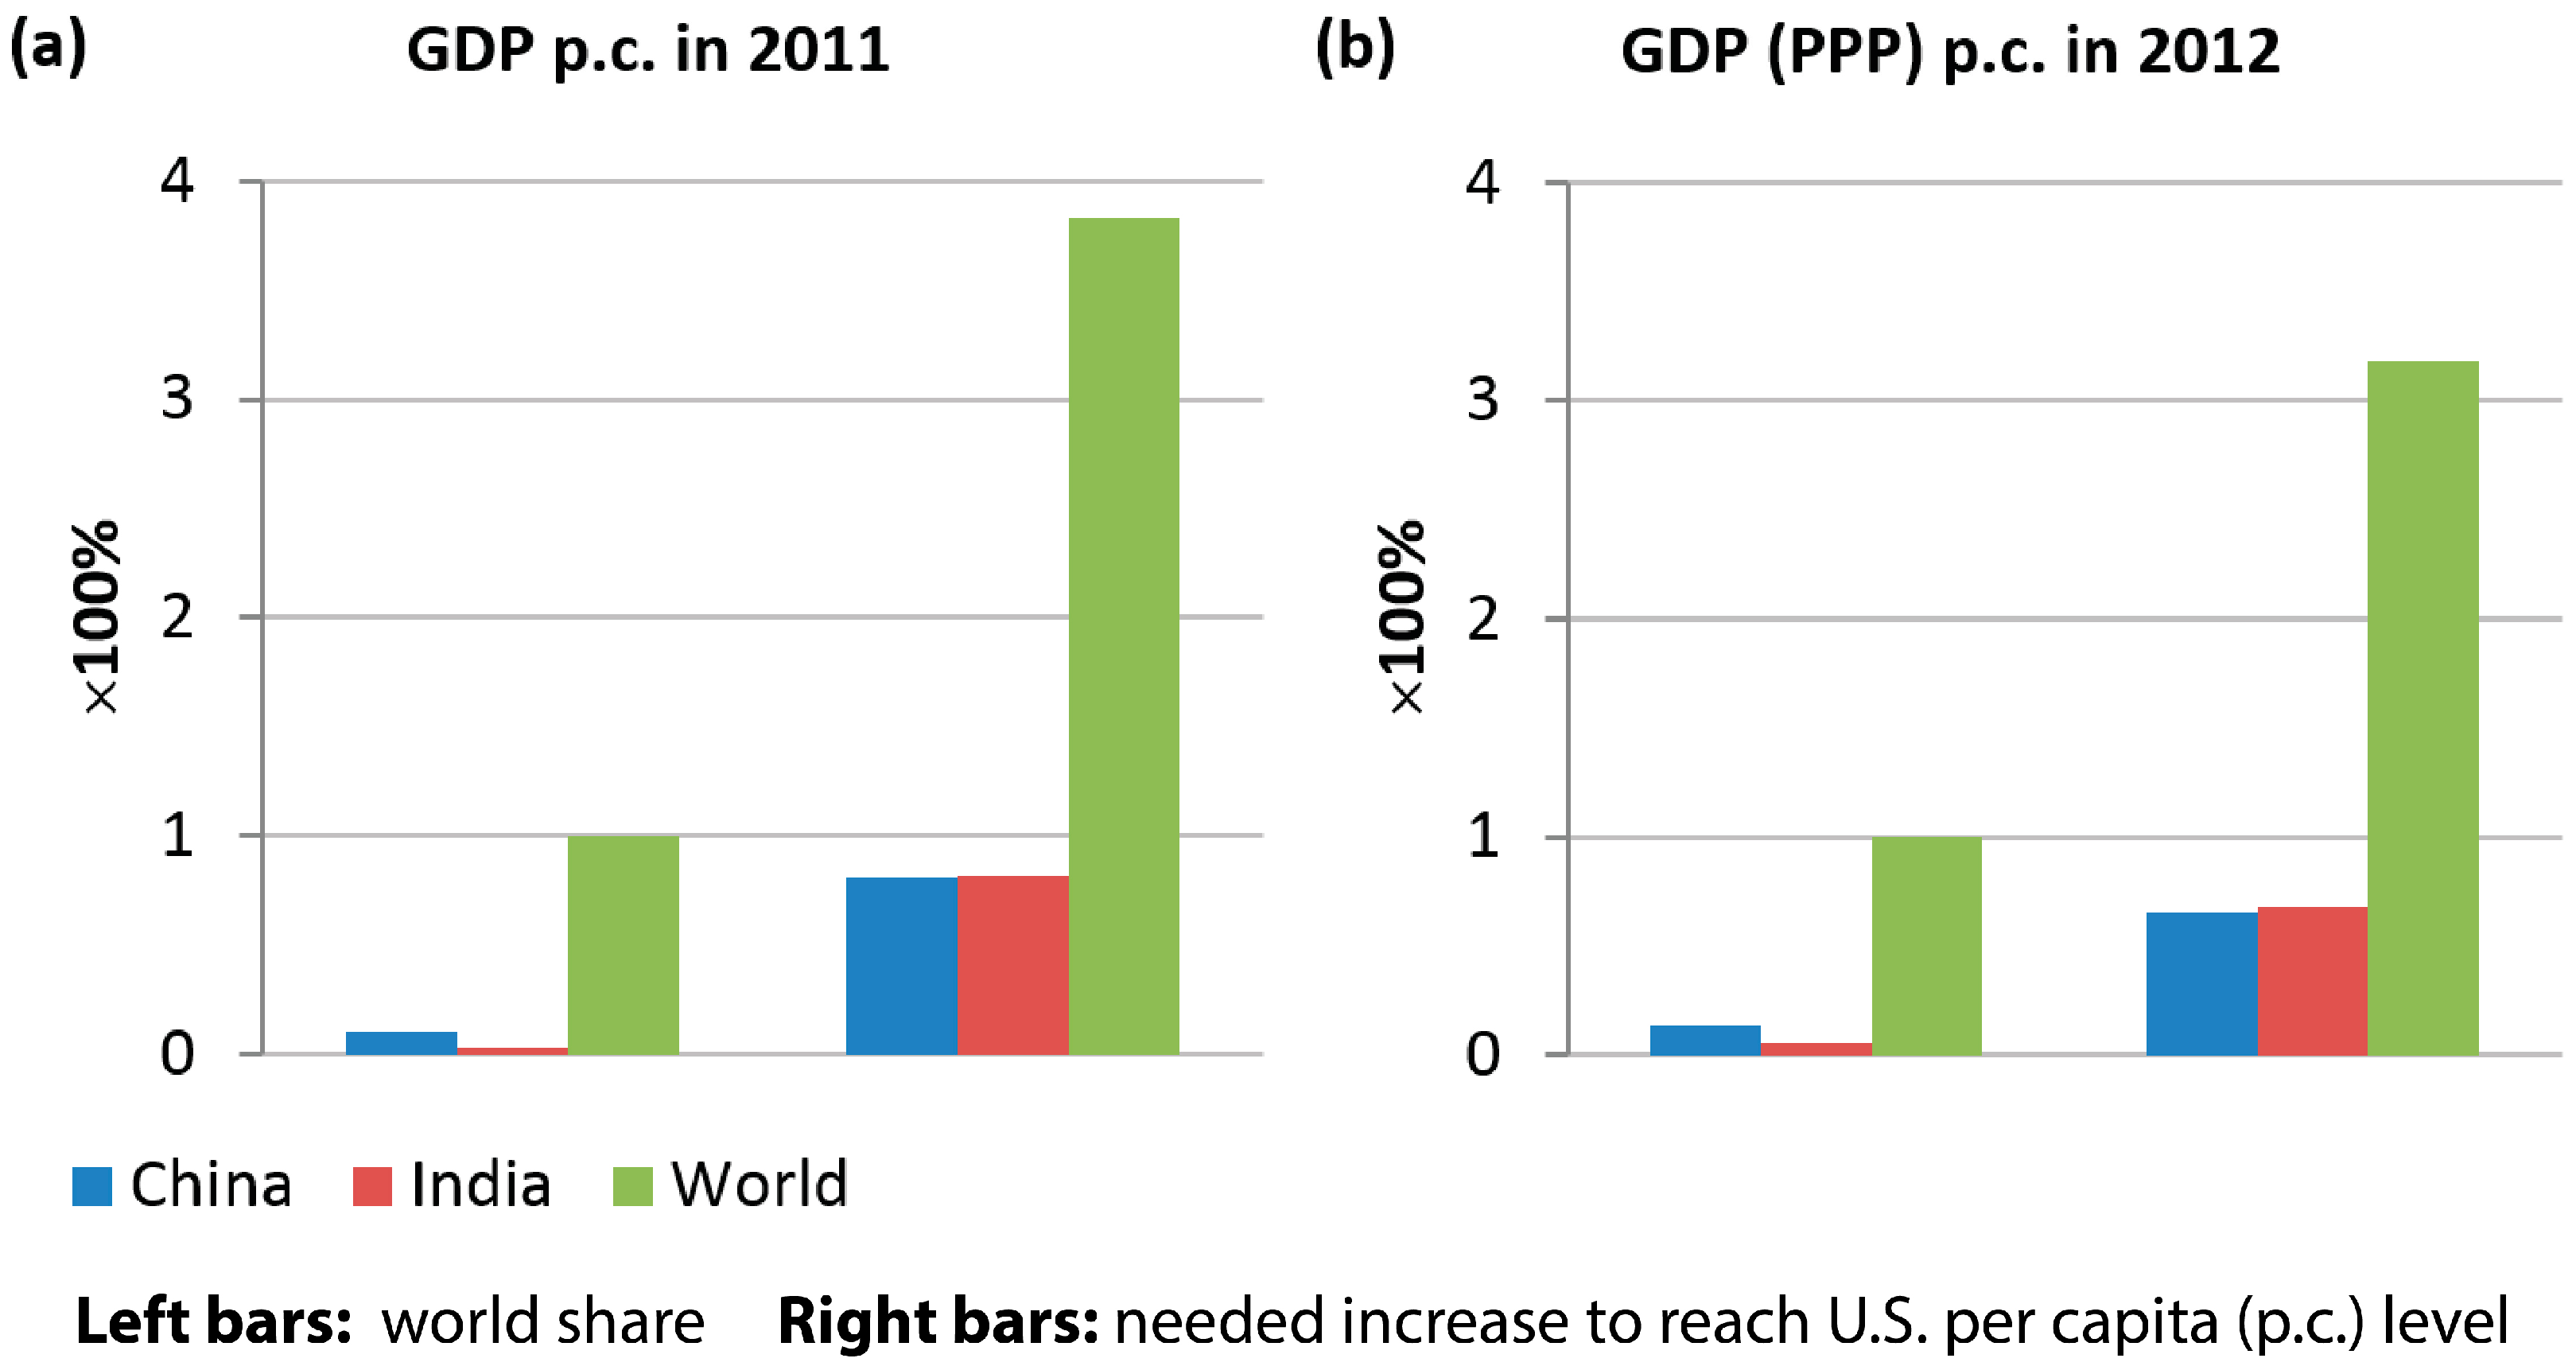
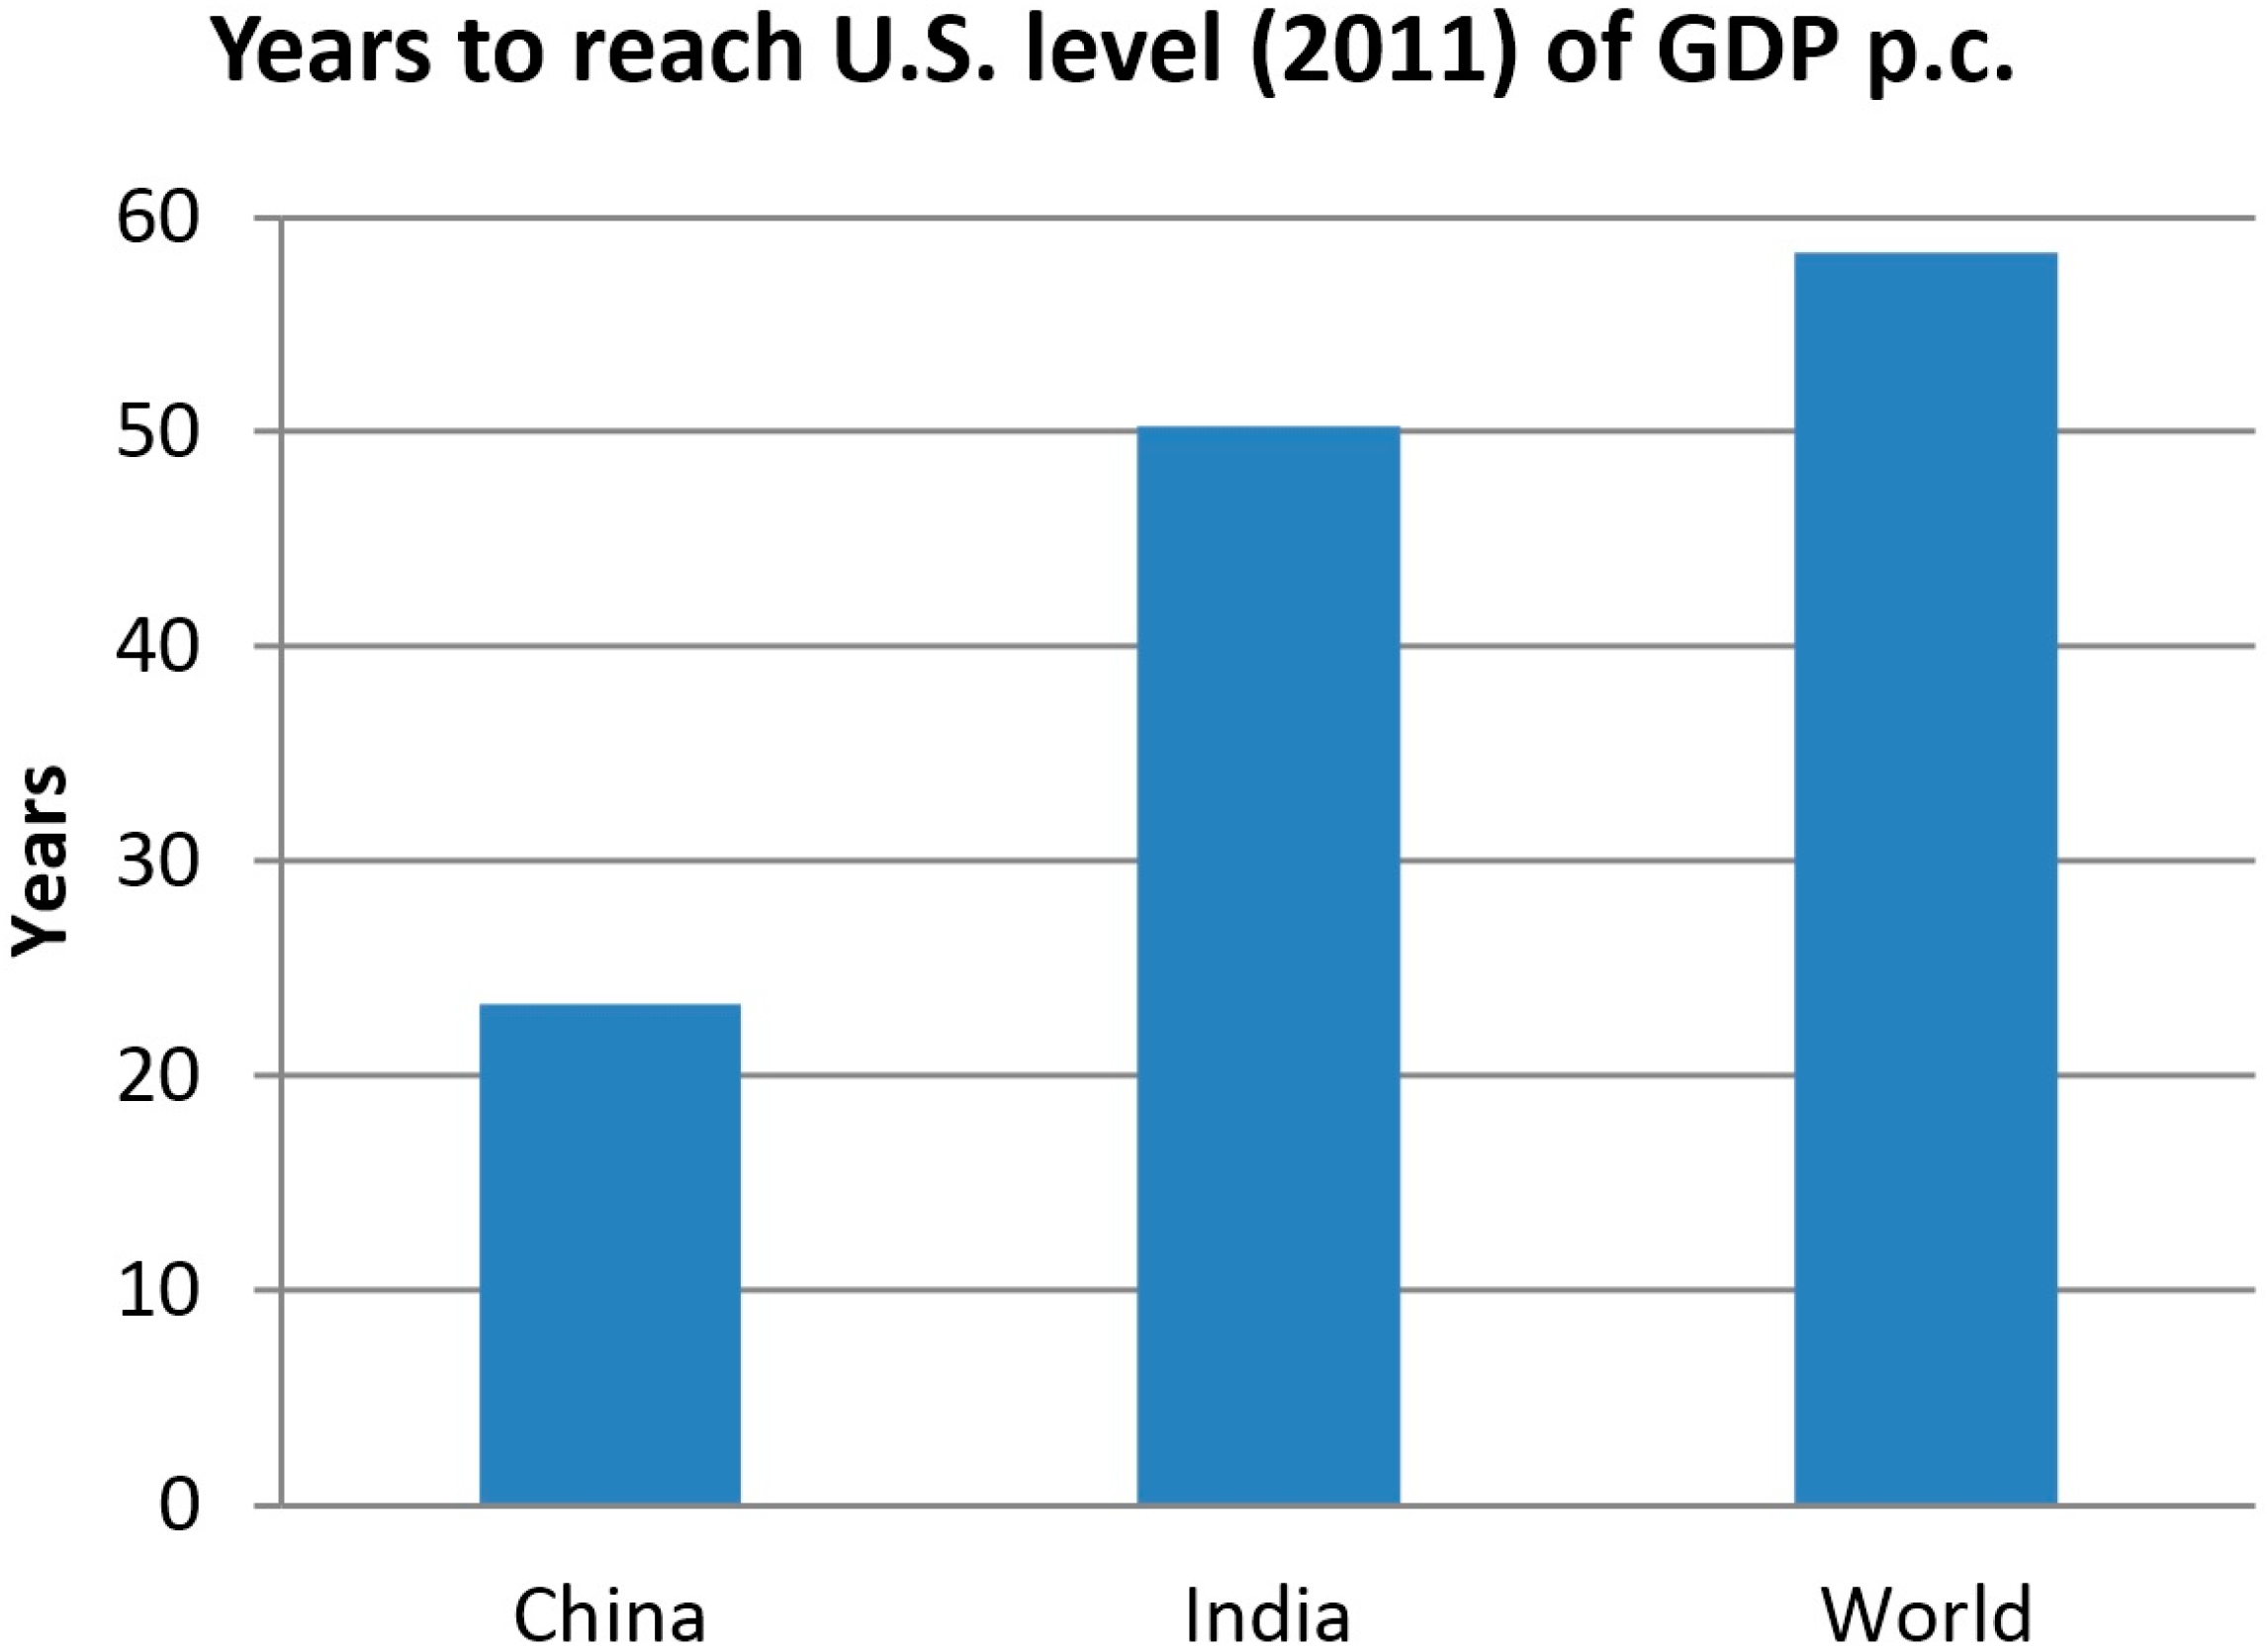
3.1. Levels of Food, Water and Energy Consumption and Economic Growth Estimates

Following our main goal, we estimate the needed increase in resource consumption to reach the level and standards of the U.S. As calculations have shown, average world consumption of food (Table S1 and Figure 2a) does not require a dramatic increase. In this context, the development of efficient distribution-related technologies of food plays more of an important role, because about 24% of currently produced calories are wasted [22]. While the growth in the food supply seems to be less constraining and indeed appears as more manageable, freshwater demands (Table S2 and Figure 2b) represent a more difficult problem, where about a 150% increase is needed. Although we use the current U.S. levels as a common benchmark, this does not mean that one endorses current consumption levels in any particular country as a world model. For example, water consumption in the U.S. (1550 m3/capita year) is almost four-times larger than in Germany (392 m3/capita year). The issue becomes more acute taking into account climate changes [23] and contamination [24] problems. Finally, the most crucial challenge is represented by a 300% increase required in terms of energy use per capita (Table 1 and Figure 2c).
Following the assumption that the developing countries try to reach the same level of affluence as the developed world and GDP per capita can serve as a relevant measure of quality of life, we estimated what GDP per capita is needed to achieve for India and China to be on par with the current U.S. level. The presented data analysis indicates that the gap in terms of GDP (Table S3 and Figure 3a for GDP, Table S4 and Figure 3b for purchasing power parity (PPP) GDP) between U.S. and the average world level is more than four-fold. A coarse estimate shows (Figure 4) that it would take 22 years for China, 50 years for India and almost 60 years for the world as a whole to reach the 2011 U.S. level of GDP per capita, keeping respective growth rates constant as for 2011.
Figure 4. Required time for the developing countries and the world as a whole to reach the current (2011) U.S. level of GDP per capita (p.c.) with the assumption of a country’s constant GDP growth index and no GDP growth in the U.S. Respective growth rates for 2011 are [25]: China 9.3%, India 6.9% and world 2.7%. Assuming compound interest, years are calculated as a log: (needed country’s GDP/current country’s GDP)/country’s GDP growth index.
Sustainability 07 03430 g004

3.2. Energy-Based Economic Growth and Natural Resources Constrains

As was mentioned above, current world GDP and energy use per capita should be increased by more than 300% in order to meet the current U.S. standards (see Figure 2c and Figure 3b, respectively). However, can these two indicators be separated? Previous studies have shown that economic growth in developing countries historically goes along with an increase of energy consumption [26,27,28]. Indeed, our calculations for the corresponding historical time series presented in Figure 5 demonstrate almost perfect correlation between GDP level and energy use for developing economies and the world as a whole. At the same time, developed countries have been exhibiting an opposite trend. This discrepancy demonstrates that the economies in the U.S. and EU have been moving toward the post-industrial age, shifting from goods to services consumption. China, India and the world on average, as we can see, are still growing extensively [29], struggling to satisfy the demands for common material benefits. This observation underscores the lack of technical efficiency [30], social and organizational innovations to reduce the strong correlation between GDP and energy use in the developing world. Related studies have also shown that the developing economies of China and India still require substantial structural reforms and new policies to sustain their economic growth [31]. It is worth noting that energy consumption has currently a high impact on international affairs due to this demand of the fossil-based economies of China and India [32].
Our analysis implies limitations of future economic growth, as well. While it is very difficult to estimate potentially available food and freshwater volumes [33], energy production is essentially limited. Indeed, our energy production almost solely relies on fossil fuels, with a striking 87% share [34]. Moreover, fossil fuels will remain the dominant source of energy for the next 20 years, with an estimation of about an 82% share in 2035 [35]. Given that the estimated guaranteed world reserves of all major fossil fuels (crude oil, natural gas and coal) are approximately 1000 billion metric tons of oil equivalent [35], in the worst case scenario, simple algebraic calculations suggest that for the current level of consumption, they will be depleted in the next 80 years. If the whole world would reach the U.S. standards, such a life style could be supported for the next 20 years only.
Figure 5. Correlation between GDP PPP per capita (p.c.) and annual energy use per capita for different countries and the world as a whole calculated using moving windows of 10 (a) and 20 (b) years.
Sustainability 07 03430 g005

3.3. Developing World Growth Perspectives

Based on our calculations and observations, we can state that the future growth of the world economies in its current form requires a significant new demand on the resources to fuel new growth in GDP, since it is a mathematical inevitability under the current economic paradigm. This demand on resources is likely to result in constraints on future growth, as a further increase in consumption would be difficult to accomplish; thus, we expect to see slower economic growth for the near future outlook. While the use of new technologies to increase and improve the distribution efficiency of food production [22] and security [36] and to improve water treatment [24] seems to be potentially possible, the increase in demand on energy resources, on the other hand, is harder to accommodate. A slowdown seems to be a more likely outcome than the continued growth as current indicators, e.g., states’ debt and stock markets, are suggesting. Today, we witness a “tag of war” between resource limitations and unsustainable demand for “capital growth”. The world economies will likely come to a new equilibrium to accommodate these opposing trends. Where exactly this new equilibrium will be remains to be seen.
As we were finishing this analysis, we came across the report by Dr. Morgan [37], where a much broader analysis of resource constraints was performed. Our conclusions are in agreement with this report on energy-related constraints. A similar conclusion was also reached in a study researching energy consumption from the entropy perspective [14]. The paper argues that partitioning of the limited fossil fuel resources among the world population is subject to the maximal entropy principle, resulting in the exponentially-distributed inequality in energy consumption. It concludes that it is impossible to bring the whole world to the U.S. standards, not only because there are not enough resources (as argued in the present paper), but also because such an equal distribution would have lower entropy and, thus, be extremely improbable.
There is another possibility that can drastically alter the present analysis. One can imagine that as a result of the recent crisis and pressures, we will develop a new paradigm for economic growth where GDP and income will grow without the attendant increase of resource consumption to match the growing demand. There have been proposed a number of theories promoting economic growth not linked to resource consumption, for instance, R&D-based models [38], use of technology advancement [39], economic integration [40], social organization [41] or human capital [42] as engines for economic development. Another feasible option, which some countries are considering along with renewables [13], is the increased use of nuclear energy as a stable and long-term energy source capable of feeding manufacturing [43]. This possibility cannot be discarded, although it would inevitably face qualitatively new technological and security challenges [44,45].

4. Conclusions

Our study estimates the level of consumption of energy, food and fresh water in India, China and the world in general that matches current levels of the U.S. per capita. For simplicity, we assumed that these resources would be uniformly consumed based on the average per capita consumption of the developed world. In spite of oversimplification, our analysis illustrates that a linear expansion growth model is not sustainable over a long period of time worldwide, due to the finite nature of the planet’s resources. The anticipated shortage of resources would have to be addressed by the world economies. The explicit calculation points to the significant adjustments that economies worldwide would have to make to accommodate the constraints that we have presented. In terms of future research, it would be useful to follow up the present study with a comparison of the estimates that we made with the dynamics of world resources over a considerable span of time. We do not know how the future will look, but we present a simple estimate that the current rates of consumption expansion are not scalable for the developing world. We hope our analysis will facilitate future discussions on alternative development models.

Supplementary Materials

Supplementary materials can be accessed at: https://0-www-mdpi-com.brum.beds.ac.uk/2071-1050/7/3/3430/s1.

Acknowledgments

This work was supported by Nordita. We are grateful to Yasser Roudi and Alexander Lipton for useful discussions.

Author Contributions

Alexander V. Balatsky designed the research. All authors performed the research. Galina I. Balatsky performed the analysis of the energy demands and implications. Stanislav S. Borysov collected and analyzed the data. All authors wrote the paper and read and approved the final manuscript.

Conflicts of Interest

The authors declare no conflict of interest.

References and Notes

  1. Yao, K.; Wang, A. China Bets on Consumer-Led Growth to Cure Social Ills. Available online: http://www.reuters.com/article/2013/03/05/us-china-parliament-idUSBRE92402R20130305 (accessed on 4 October 2014).
  2. United Nations, Department of Economic and Social Affairs, Population Division. World Population Prospects: The 2012 Revision. Available online: http://esa.un.org/wpp/documentation/publications.htm (accessed on 4 October 2014).
  3. Energy Information Administration, Office of Integrated Analysis and Forecasting, U.S.Department of Energy. International Energy Outlook 2005. Available online: https://www.hsdl.org/?view&did=15905 (accessed on 19 January 2015).
  4. World Bank. Total Population Map. Available online: http://data.worldbank.org/indicator/SP.POP.TOTL/countries?display=map (accessed on 4 October 2014).
  5. World Bank. Annual GDP Growth Map. Available online: http://data.worldbank.org/indicator/NY.GDP.MKTP.KD.ZG?display=map (accessed on 4 October 2014).
  6. World Bank. GDP PPP per Capita Map. Available online: http://data.worldbank.org/indicator/NY.GDP.PCAP.PP.CD?display=map (accessed on 4 October 2014).
  7. World Bank. Energy Use per Capita Map. Available online: http://data.worldbank.org/indicator/EG.USE.PCAP.KG.OE?display=map (accessed on 4 October 2014).
  8. The Maps for 2013 are Used Because There are no Available Maps for 2011 or 2012
  9. Google Inc. Google Scholar. Available online: https://0-scholar-google-com.brum.beds.ac.uk/scholar?q=sustainability (accessed on 19 January 2015).
  10. United Nations Department of Economic and Social Affairs. United Nations Conference on Sustainable Development. Sustainable development.un.org—Sustainable Development Knowledge Platform. http://wfuna.org/sustainable-development—Sustainable Development at World Federation of United Nations Association.
  11. Google Inc. Google Trends. Available online: http://www.google.com/trends/explore#q=economic%20growth%2C%20sustainability (assessed on 4 January 2015).
  12. Google Inc. Google Trends. Available online: http://www.google.com/trends/explore#q=economic%20growth%2C%20sustainability&geo=US (assessed on 4 January 2015).
  13. Asif, M.; Muneer, T. Energy supply, its demand and security issues for developed and emerging economies. Renew. Sustain. Energy Rev. 2007, 11, 1388–1413. [Google Scholar] [CrossRef]
  14. Lawrence, S.; Liu, Q.; Yakovenko, V.M. Global inequality in energy consumption from 1980 to 2010. Entropy 2013, 15, 5565–5579. [Google Scholar] [CrossRef]
  15. Kawa, L. The 20 Fastest-Growing Countries in the World. Available online: http://www.businessinsider.com/fastest-growing-economies-through-2015-2013-1?op=1 (accessed on 4 October 2014).
  16. World Bank. World Bank Open Data. Available online: http://data.worldbank.org/ (accessed on 4 October 2014).
  17. International Energy Agency. IEA Statistics (on World Bank Web-Site). Available online: http://data.worldbank.org/indicator/EG.USE.COMM.KT.OE/countries/1W-EU-US-CN-IN?display=graph (accessed on 4 October 2014).
  18. Food and Agriculture Organization of the United Nations. FAO Statistics Division. Available online: http://www.fao.org/fileadmin/templates/ess/documents/food_security_statistics/FoodConsumptionNutrients_en.xls (accessed on 4 October 2014).
  19. Food and Agriculture Organization. AQUASTAT Data (on World Bank Web-Site). Available online: http://data.worldbank.org/indicator/ER.H2O.FWTL.K3/countries/1W-EU-US-CN-IN?display=graph (accessed on 4 October 2014).
  20. World Bank National Accounts Data, and OECD National Accounts Data Files. Available online: http://data.worldbank.org/indicator/NY.GDP.MKTP.CD/countries/1W-EU-US-CN-IN?display=graph (accessed on 4 October 2014).
  21. World Bank. International Comparison Program Database. Available online: http://data.worldbank.org/indicator/NY.GDP.MKTP.PP.CD/countries/US-EU-CN-IN-1W?display=graph (accessed on 4 October 2014).
  22. Lipinski, B.; Hanson, C.; Waite, R.; Searchinger, T.; Lomax, J.; Kitinoja, L. Reducing Food Loss and Waste; Working Paper, Installment 2 of Creating a Sustainable Food Future. World Resources Institute: Washington, DC, USA, 2013. Available online: http://www.wri.org/publication/reducing-food-loss-and-waste/ (accessed on 4 October 2014).
  23. MIT Joint Program on the Science and Policy of Global Change. Energy and Climate Outlook 2014. Available online: http://globalchange.mit.edu/research/publications/other/special/2014Outlook (accessed on 4 October 2014).
  24. World Health Organization. Water Quality and Health Strategy 2013–2020. Available online: http://www.who.int/water_sanitation_health/publications/2013/water_quality_strategy/en/ (accessed on 4 October 2014).
  25. World Bank National Accounts Data, and OECD National Accounts Data Files. Available online: http://data.worldbank.org/indicator/NY.GDP.MKTP.KD.ZG/countries/1W-EU-US-CN-IN?display=graph (accessed on 4 October 2014).
  26. Asafu-Adjaye, J. The relationship between energy consumption, energy prices and economic growth: Time series evidence from Asian developing countries. Energy Econ. 2000, 22, 615–625. [Google Scholar] [CrossRef]
  27. Costantini, V.; Martini, C. The causality between energy consumption and economic growth: A multi-sectoral analysis using non-stationary cointegrated panel data. Energy Econ. 2010, 32, 591–603. [Google Scholar] [CrossRef]
  28. Belke, A.; Dobnik, F.; Dreger, C. Energy consumption and economic growth: New insights into the cointegration relationship. Energy Econ. 2011, 33, 782–789. [Google Scholar] [CrossRef]
  29. United Nations Conference on Trade and Development. Available online: http://unctad.org/en/PublicationsLibrary/webgdsdsi2012d2_en.pdf (accessed on 4 October 2014).
  30. Du, M.; Wang, B.; Wu, Y. Sources of China’s Economic Growth: An Empirical Analysis Based on the BML Index with Green Growth Accounting. Sustainability 2014, 6, 5983–6004. [Google Scholar] [CrossRef]
  31. De Mello, L. Growth and Sustainability in Brazil, China, India, Indonesia and South Africa; Organization for Economic Co-operation and Development (OECD): Paris, France, 2010. [Google Scholar]
  32. Li, J. China and India’ global demand for resources: Key inferences on international energy security and Africa’s development. In Sustainable Growth and Resource Productivity: Economic and Global Policy Issues; Bleischwitz, R., Welfens, P.J.J., Zhang, Z., Eds.; Greenleaf Publishing Limited: Sheffield, UK, 2009. [Google Scholar]
  33. Vörösmarty, C.J.; Green, P.; Salisbury, J.; Lammers, R.B. Global Water Resources: Vulnerability from Climate Change and Population Growth. Science 2000, 289, 284–288. [Google Scholar] [CrossRef] [PubMed]
  34. BP Plc. Statistical Review of World Energy 2013. Available online: http://www.bp.com/content/dam/bp/excel/Energy-Economics/statistical_review_of_world_energy_2013_workbook.xlsx (accessed on 4 October 2014).
  35. BP Plc. Energy Outlook 2035. Available online: http://www.bp.com/content/dam/bp/excel/Energy-Economics/BP_Energy_Outlook_2035_Summary_Tables_2014.xls (accessed on 4 October 2014).
  36. Richardson, R.B. Ecosystem Services and Food Security: Economic Perspectives on Environmental Sustainability. Sustainability 2010, 2, 3520–3548. [Google Scholar] [CrossRef]
  37. Morgan, T. Perfect Storm: Energy, Finance and the End of Growth. Available online: http://www.tullettprebon.com/documents/strategyinsights/tpsi_009_perfect_storm_009.pdf (accessed on 4 October 2014).
  38. Strulik, H. The Role of Human Capital and Population Growth in R&D-based Models of Economic Growth. Rev. Int. Econ. 2005, 13, 129–145. [Google Scholar] [CrossRef]
  39. Kemeny, T. Are International Technology Gap Growing or Shrinking in the Age of Globalization? J. Econ. Geogr. 2011, 11, 1–35. [Google Scholar] [CrossRef]
  40. Rivera-Batiz, L.A.; Romer, P.M. Economic integration and endogenous growth. Q. J. Econ. 1991, 106, 531–555. [Google Scholar] [CrossRef]
  41. Tonn, B.; Frymier, P.; Graves, J.; Meyers, J. A Sustainable Energy Scenario for the United States: Year 2050. Sustainability 2010, 2, 3650–3680. [Google Scholar] [CrossRef]
  42. Dinda, S. Social Capital in the Creation of Human Capital and Economic Growth: A Productive Consumption Approach. J. Soc. Econ. 2008, 37, 2020–2033. [Google Scholar] [CrossRef] [Green Version]
  43. McDonald, A. Nuclear Power Global Status. IAEA Bull. 2008, 49-2, pp. 45–48. Available online: http://www.iaea.org/sites/default/files/49204734548.pdf (accessed on 4 October 2014).
  44. Pearce, J.M. Limitations of Nuclear Power as a Sustainable Energy Source. Sustainability 2012, 4, 1173–1187. [Google Scholar] [CrossRef]
  45. Romanello, V.; Salvatores, M.; Schwenk-Ferrero, A.; Gabrielli, F.; Vezzoni, B.; Rineiski, A.; Fazio, C. Sustainable Nuclear Fuel Cycles and World Regional Issues. Sustainability 2012, 4, 1214–1238. [Google Scholar] [CrossRef]

