
A Comparative Study of Fouling and Bottom Ash from Woody Biomass Combustion in a Fixed-Bed Small-Scale Boiler and Evaluation of the Analytical Techniques Used


Abstract
:1. Introduction
2. Experimental Section
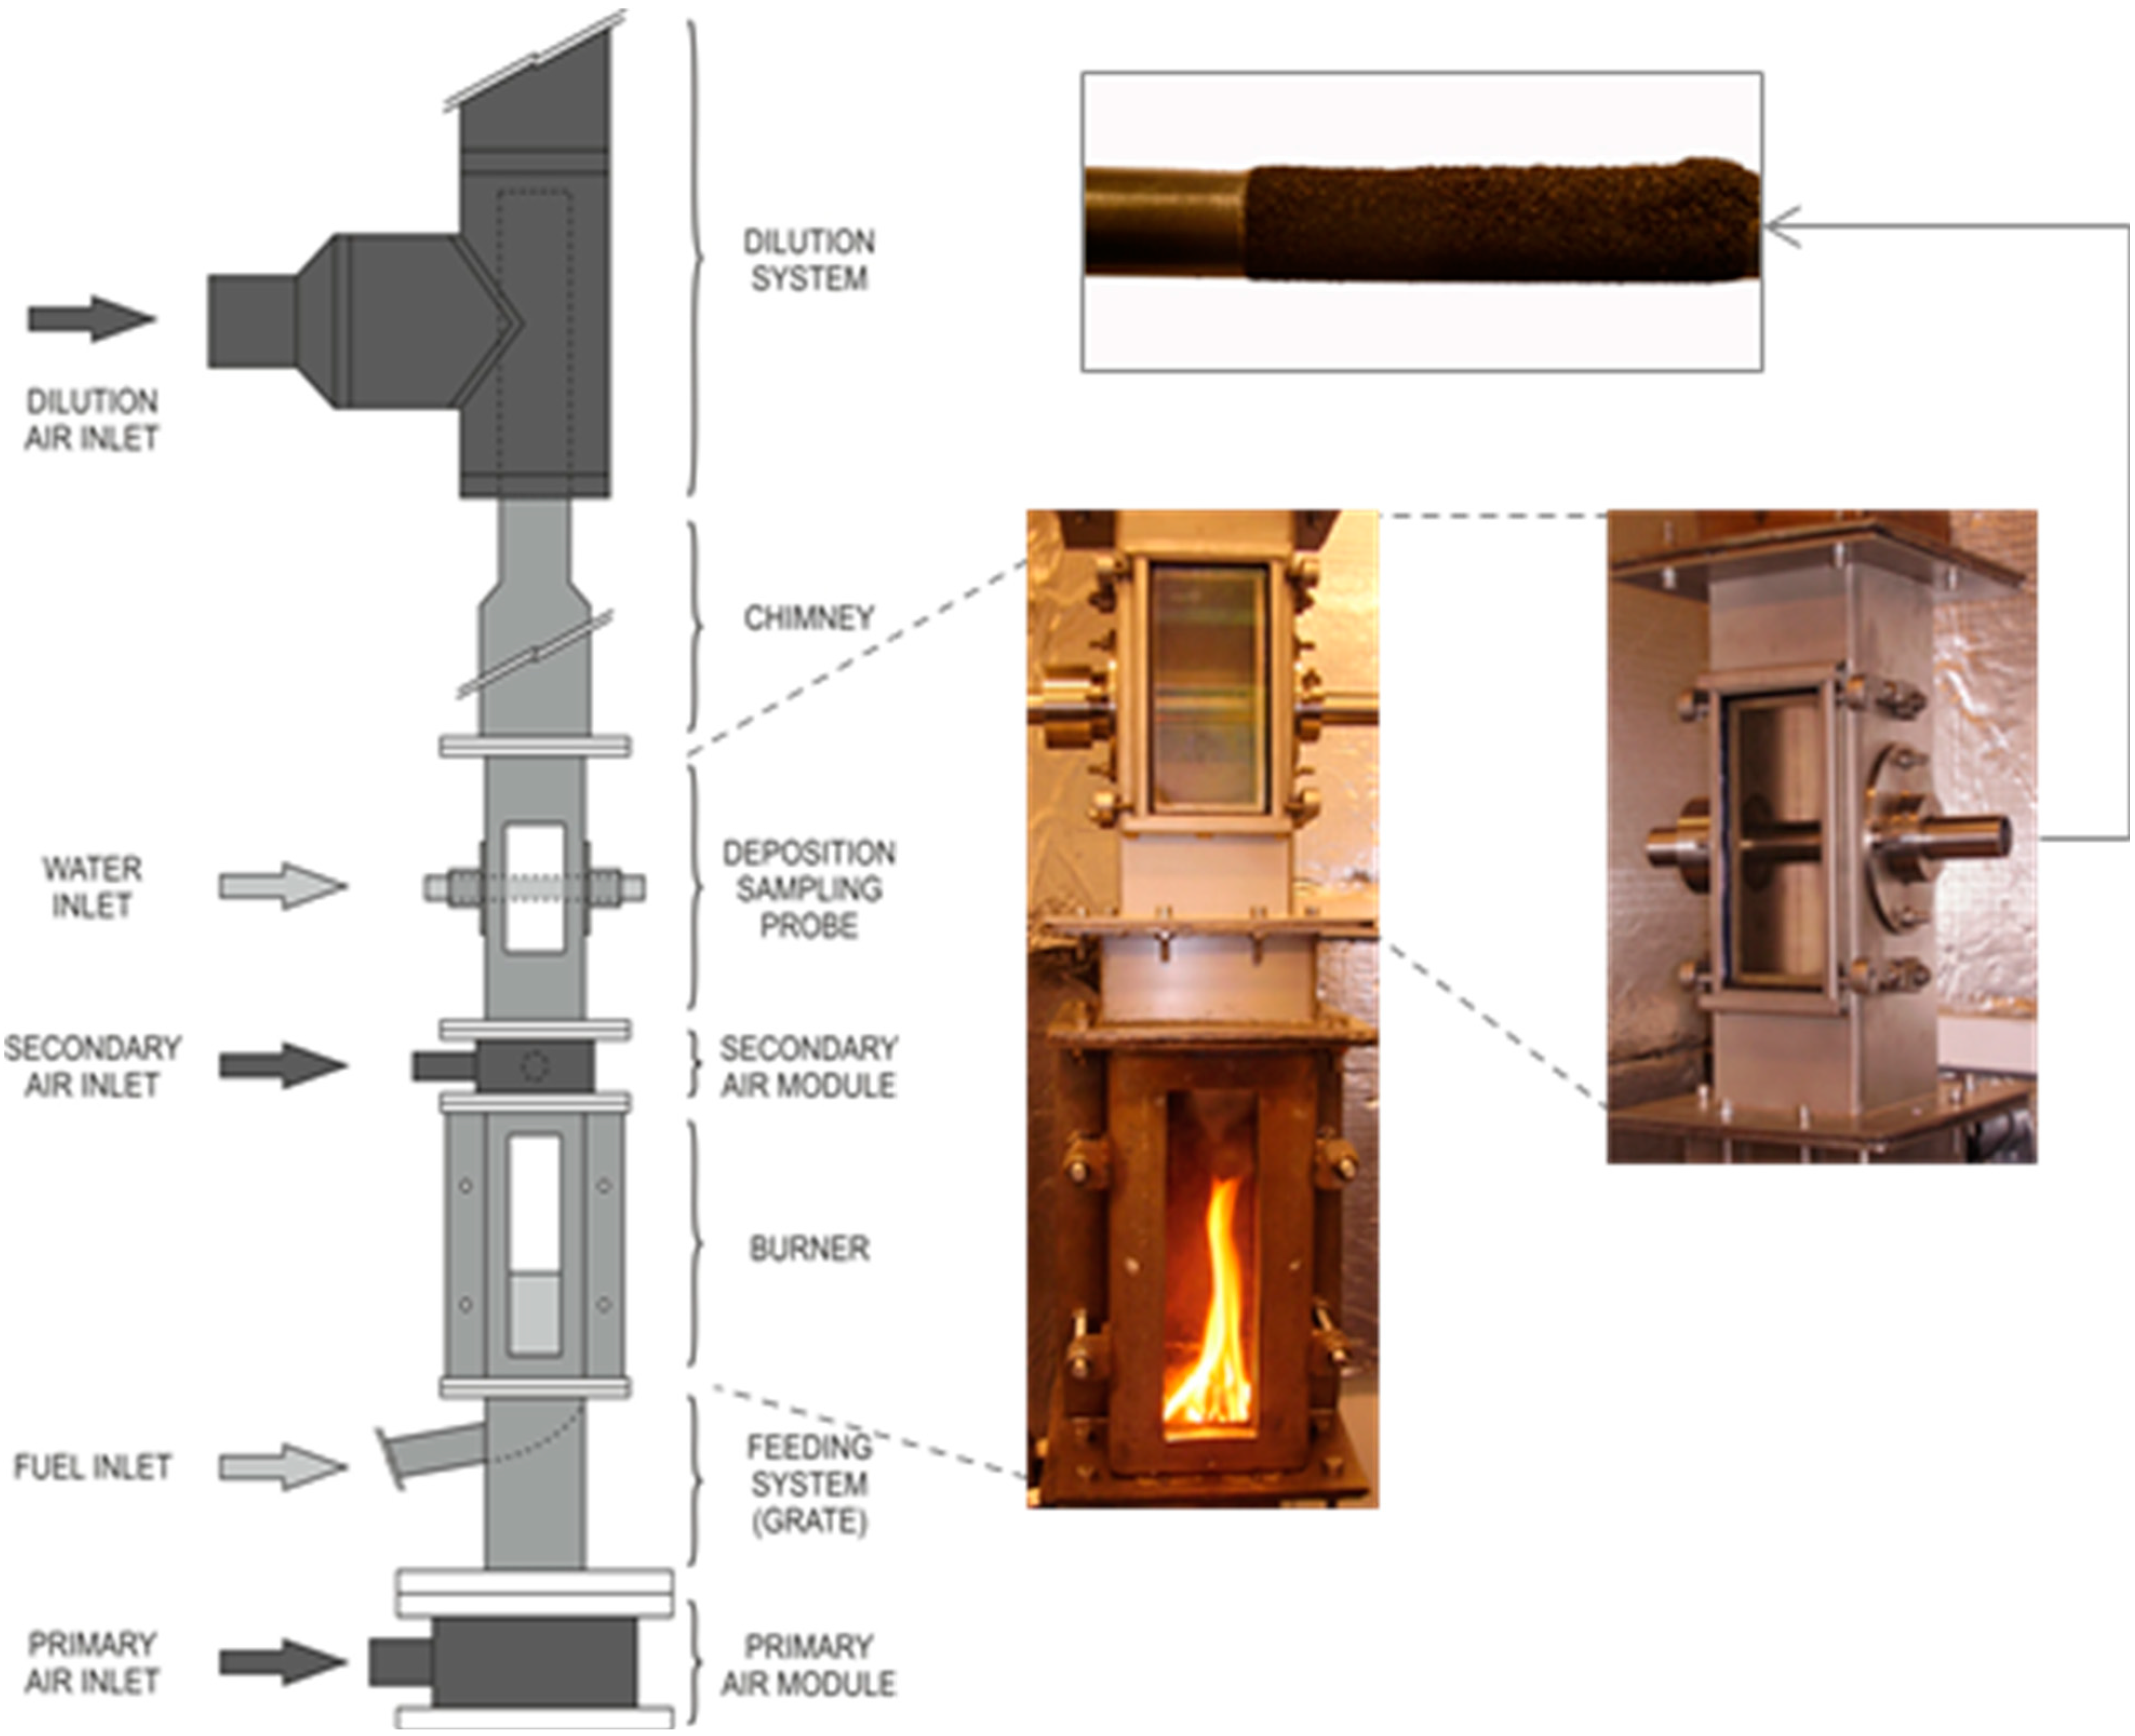
2.1. Fuel, Facility and Samples

| Proximate analysis (wt.% of dry fuel) | |
| Moisture | 6.85 a |
| Ash | 0.44 |
| Volatile Matter | 73.54 |
| Fixed Carbon | 26.02 |
| Ultimate analysis (wt.% of dry fuel) | |
| C | 47.21 |
| H | 6.19 |
| N | 0.14 |
| O | 46.02 b |
| S | c |
| Ash analysis (wt.% of dry ash) | |
| Na2O | 6.22 |
| MgO | 10.36 |
| Al2O3 | 7.74 |
| SiO2 | 16.47 |
| P2O5 | 6.98 |
| SO3 | 4.25 |
| Cl | 3.27 |
| K2O | 14.29 |
| CaO | 28.03 |
| MnO | 1.31 |
| Fe2O3 | 0.83 |
| ZnO | 0.24 |
| HHV (MJ∙kg−1) | 17.72 |
| LHV (MJ∙kg−1) | 16.28 |

| Combustion Parameters | |
|---|---|
| Power generated | 10–15 kWth |
| Stable combustion time | 4 h |
| Total airflow supplied | 20 m3 h−1 |
| Distribution of primary and secondary airflow | 20%–80% |
| Average water temperature | ≈60 °C |
| Average flue gas temperature | 450–550 °C |
| Average mass fuel consumed | 0.45 g s−1 |
| Bottom Ash | Deposited Fouling | Adhered Fouling | |
|---|---|---|---|
| Combustion 1 | S1-B | S1-D | S1-A |
| Combustion 2 | S2-B | S2-D | S2-A |
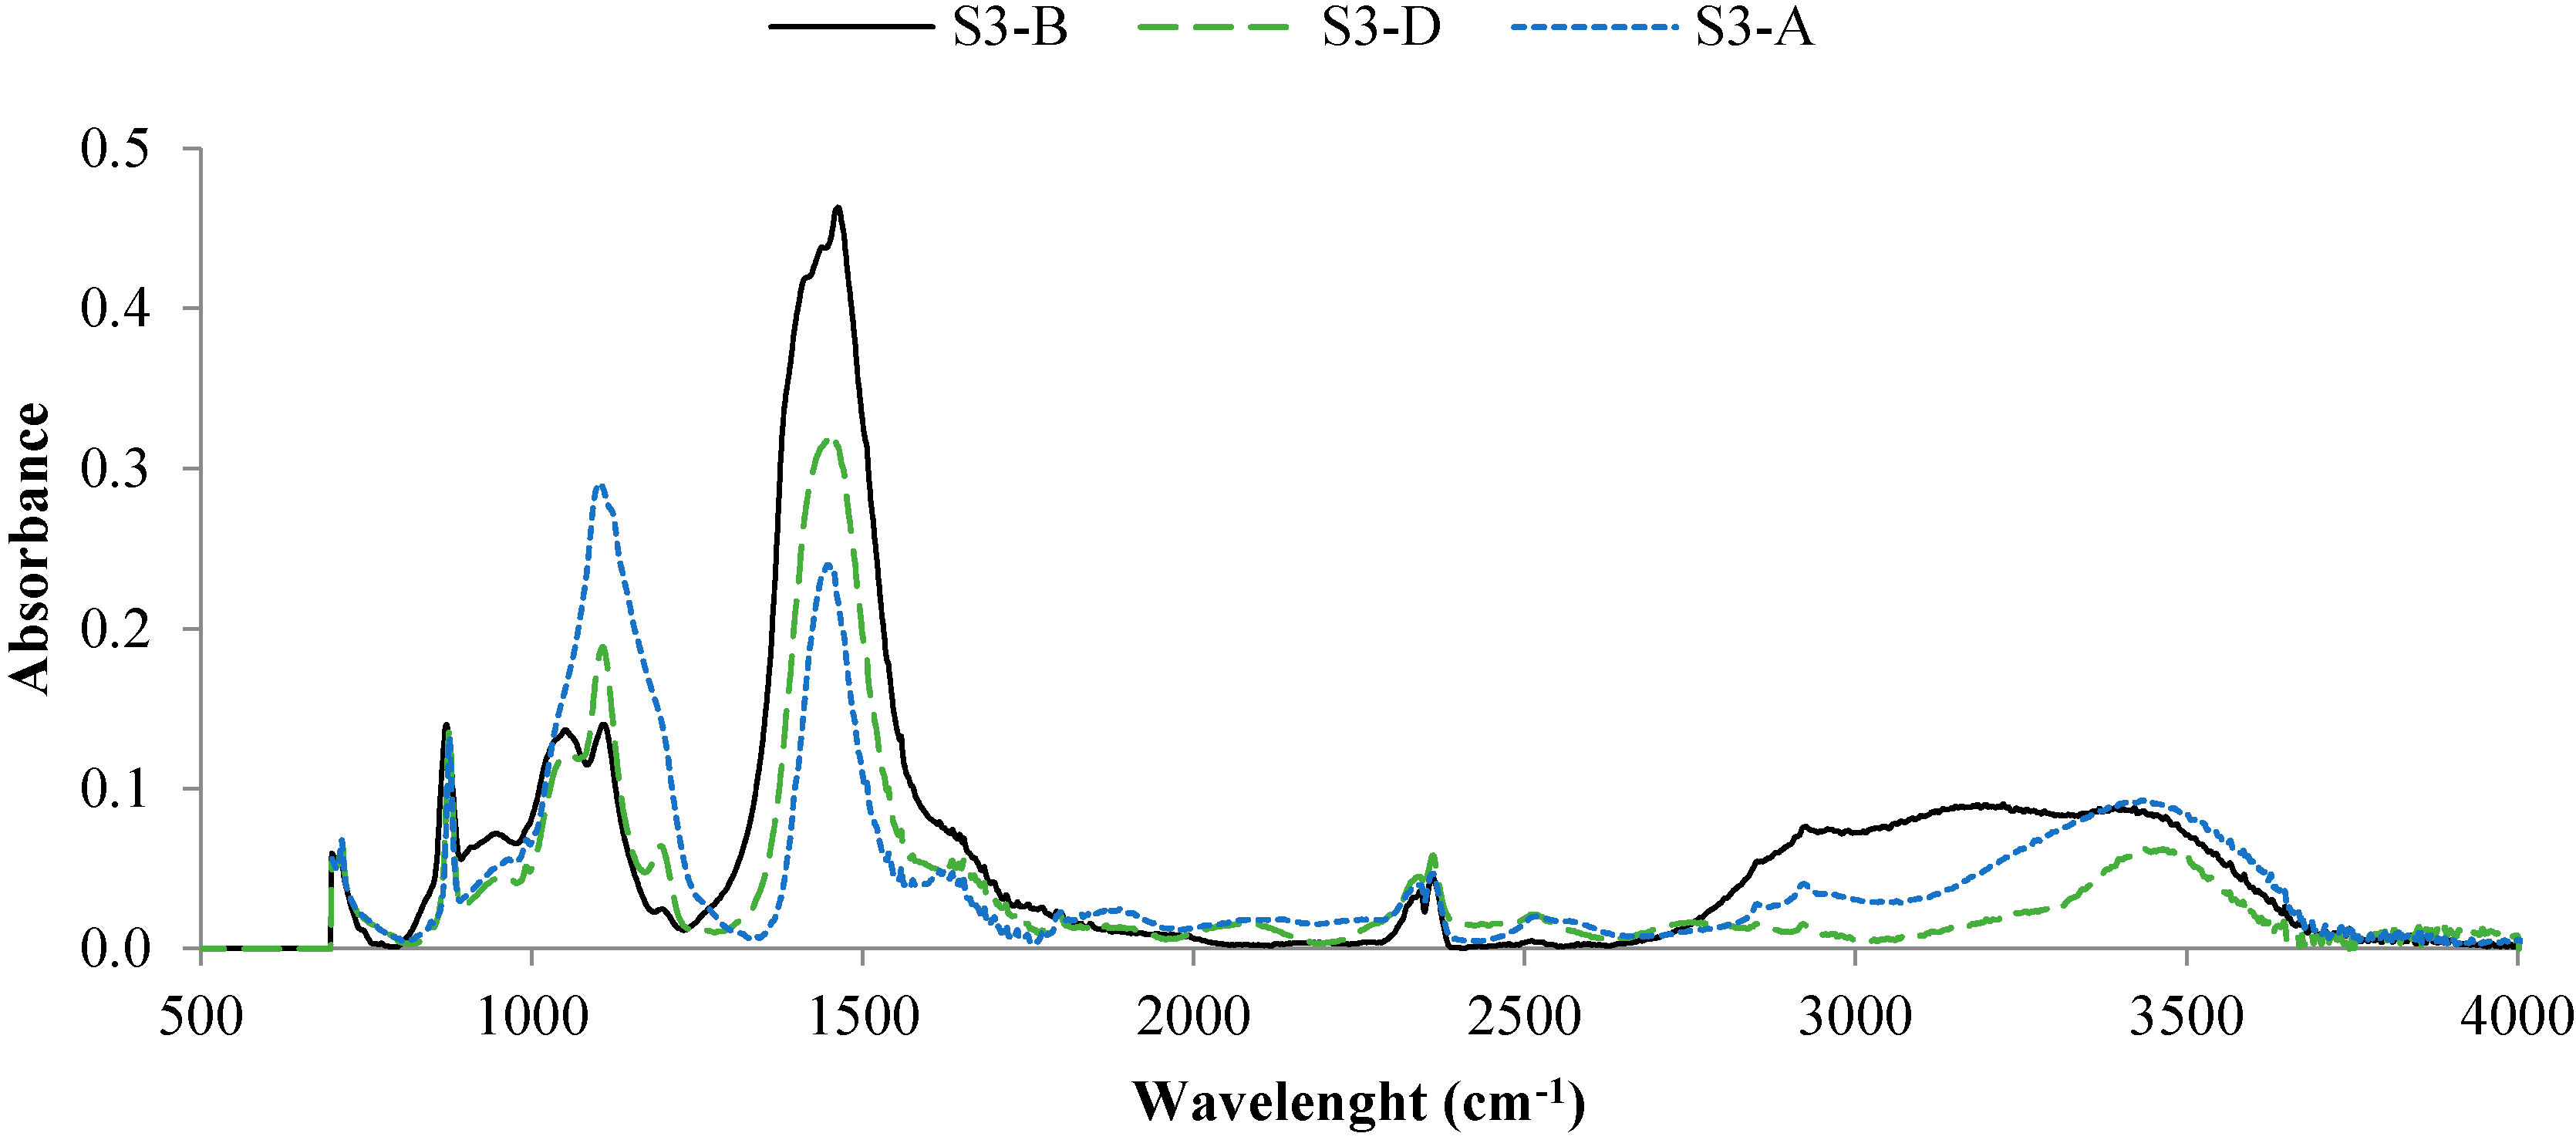
| Combustion 3 | S3-B | S3-D | S3-A |
| Deposited Fouling (g) | Adhered Fouling (g) | |
|---|---|---|
| Combustion 1 | 0.42 | 0.12 |
| Combustion 2 | 0.41 | 0.08 |
| Combustion 3 | 0.37 | 0.10 |
2.2. Analytical Techniques
2.2.1. Thermal Analysis
2.2.2. Chemical Analysis
3. Results and Discussion
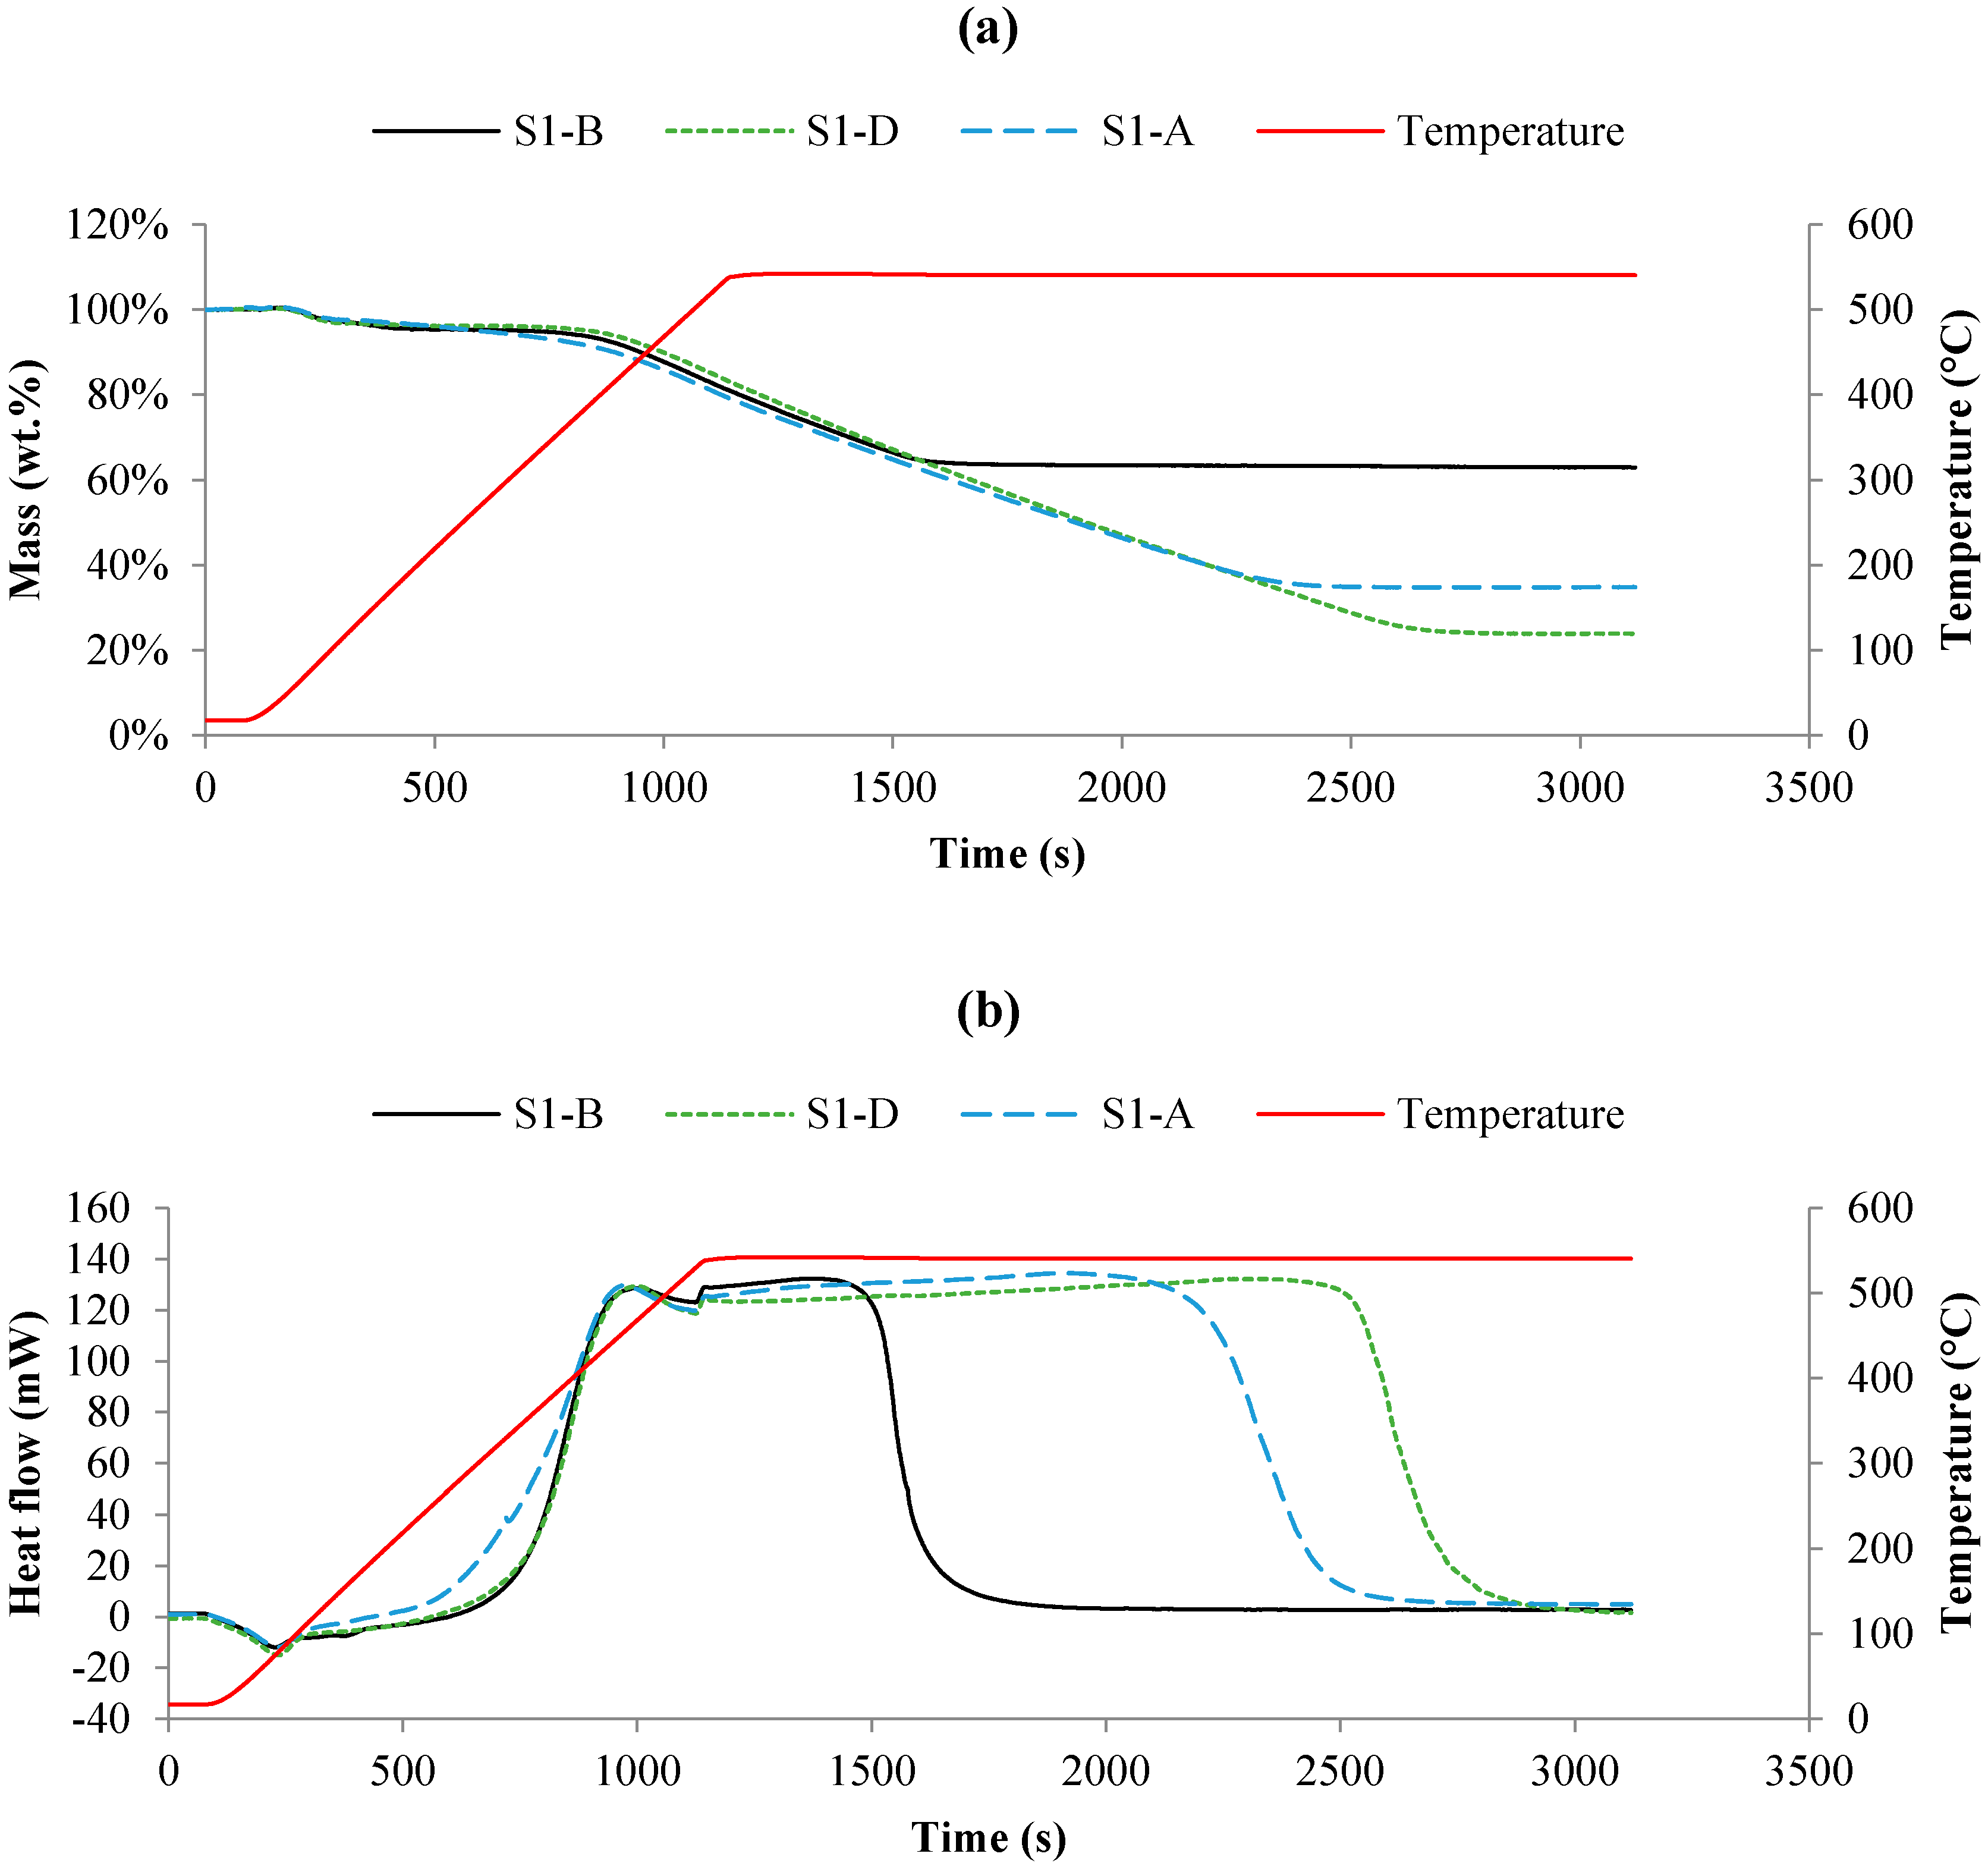
3.1. Thermal Results


3.2. Chemical Results
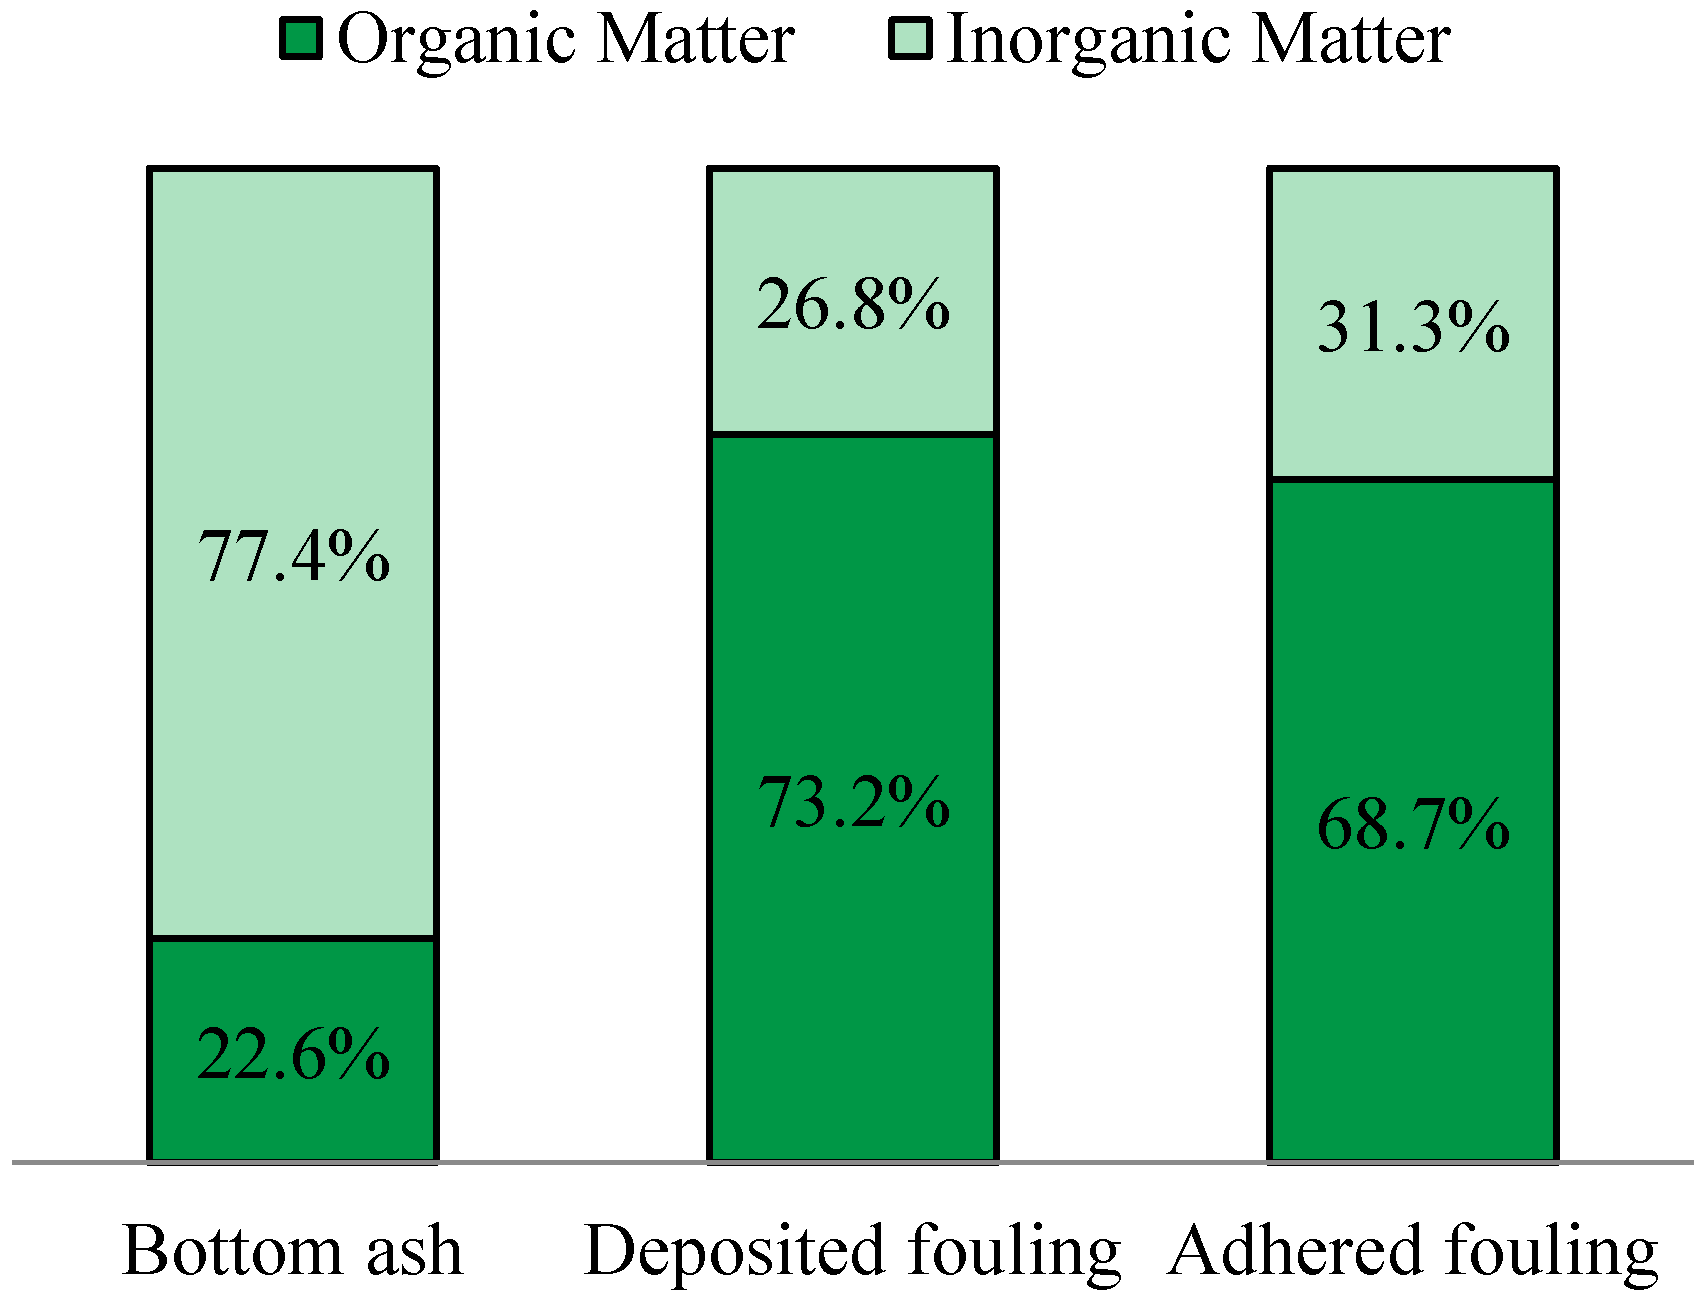
3.2.1. Organic Elemental Analysis
| Element | Bottom Ash | Deposited Fouling | Adhered Fouling |
|---|---|---|---|
| % C | 21.20 | 62.60 | 54.17 |
| % H | 0.31 | 0.82 | 1.76 |
| % N | 0.19 | 0.60 | 1.32 |
| % S | c | c | c |
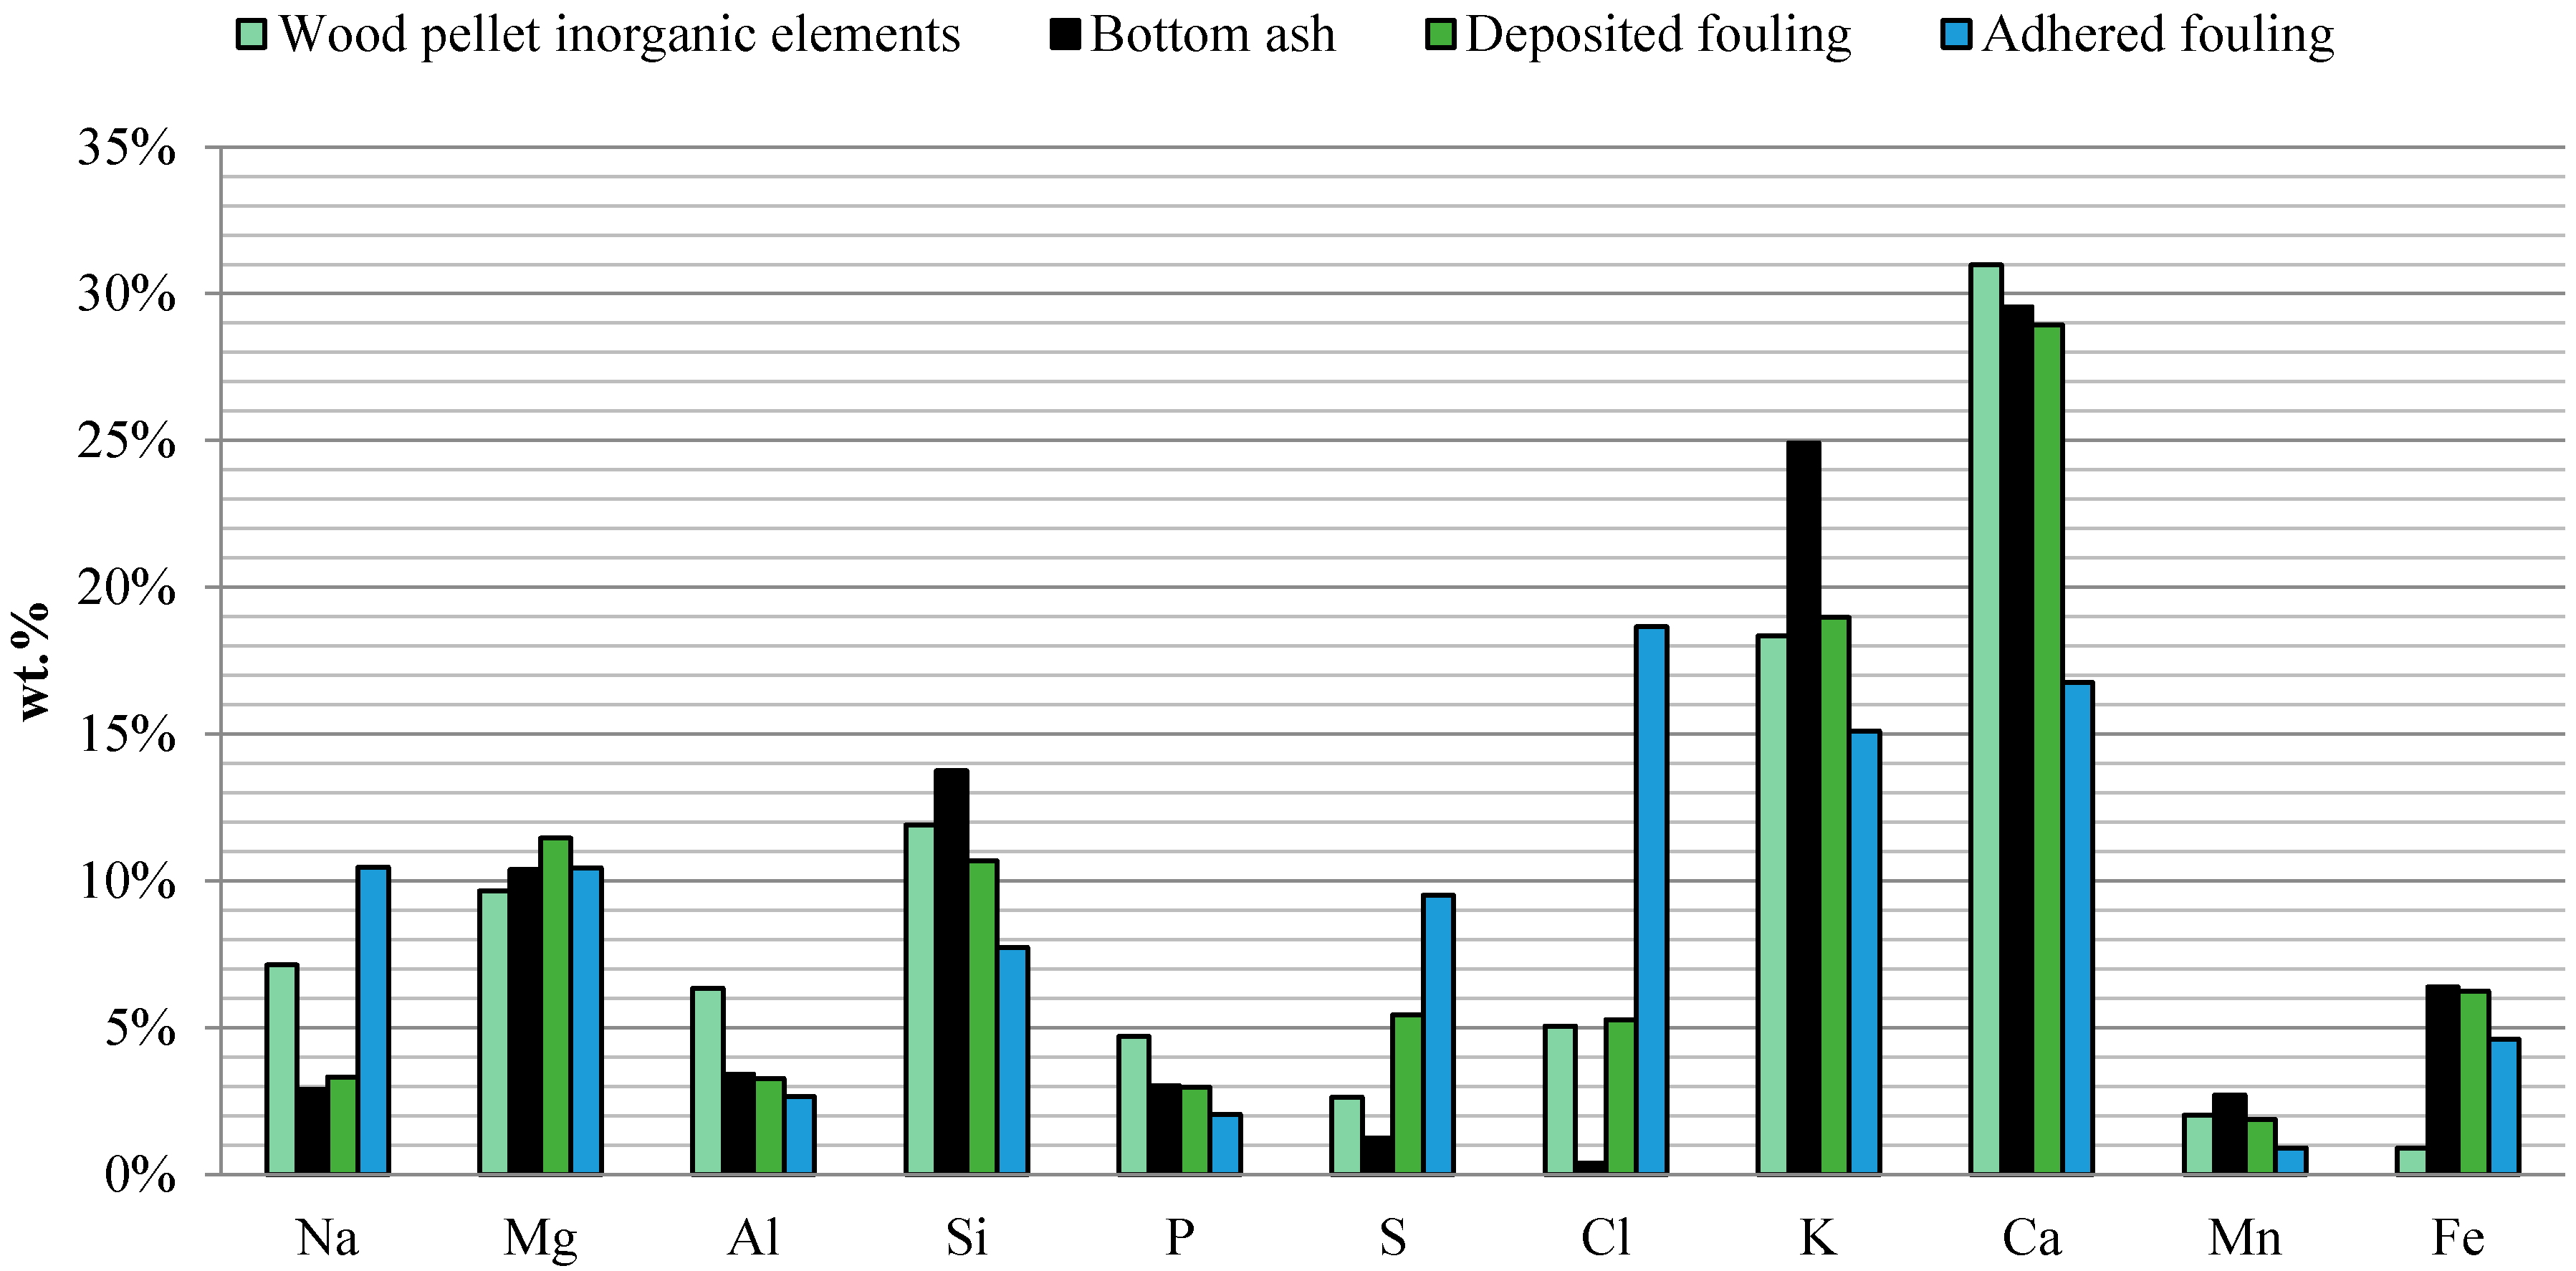
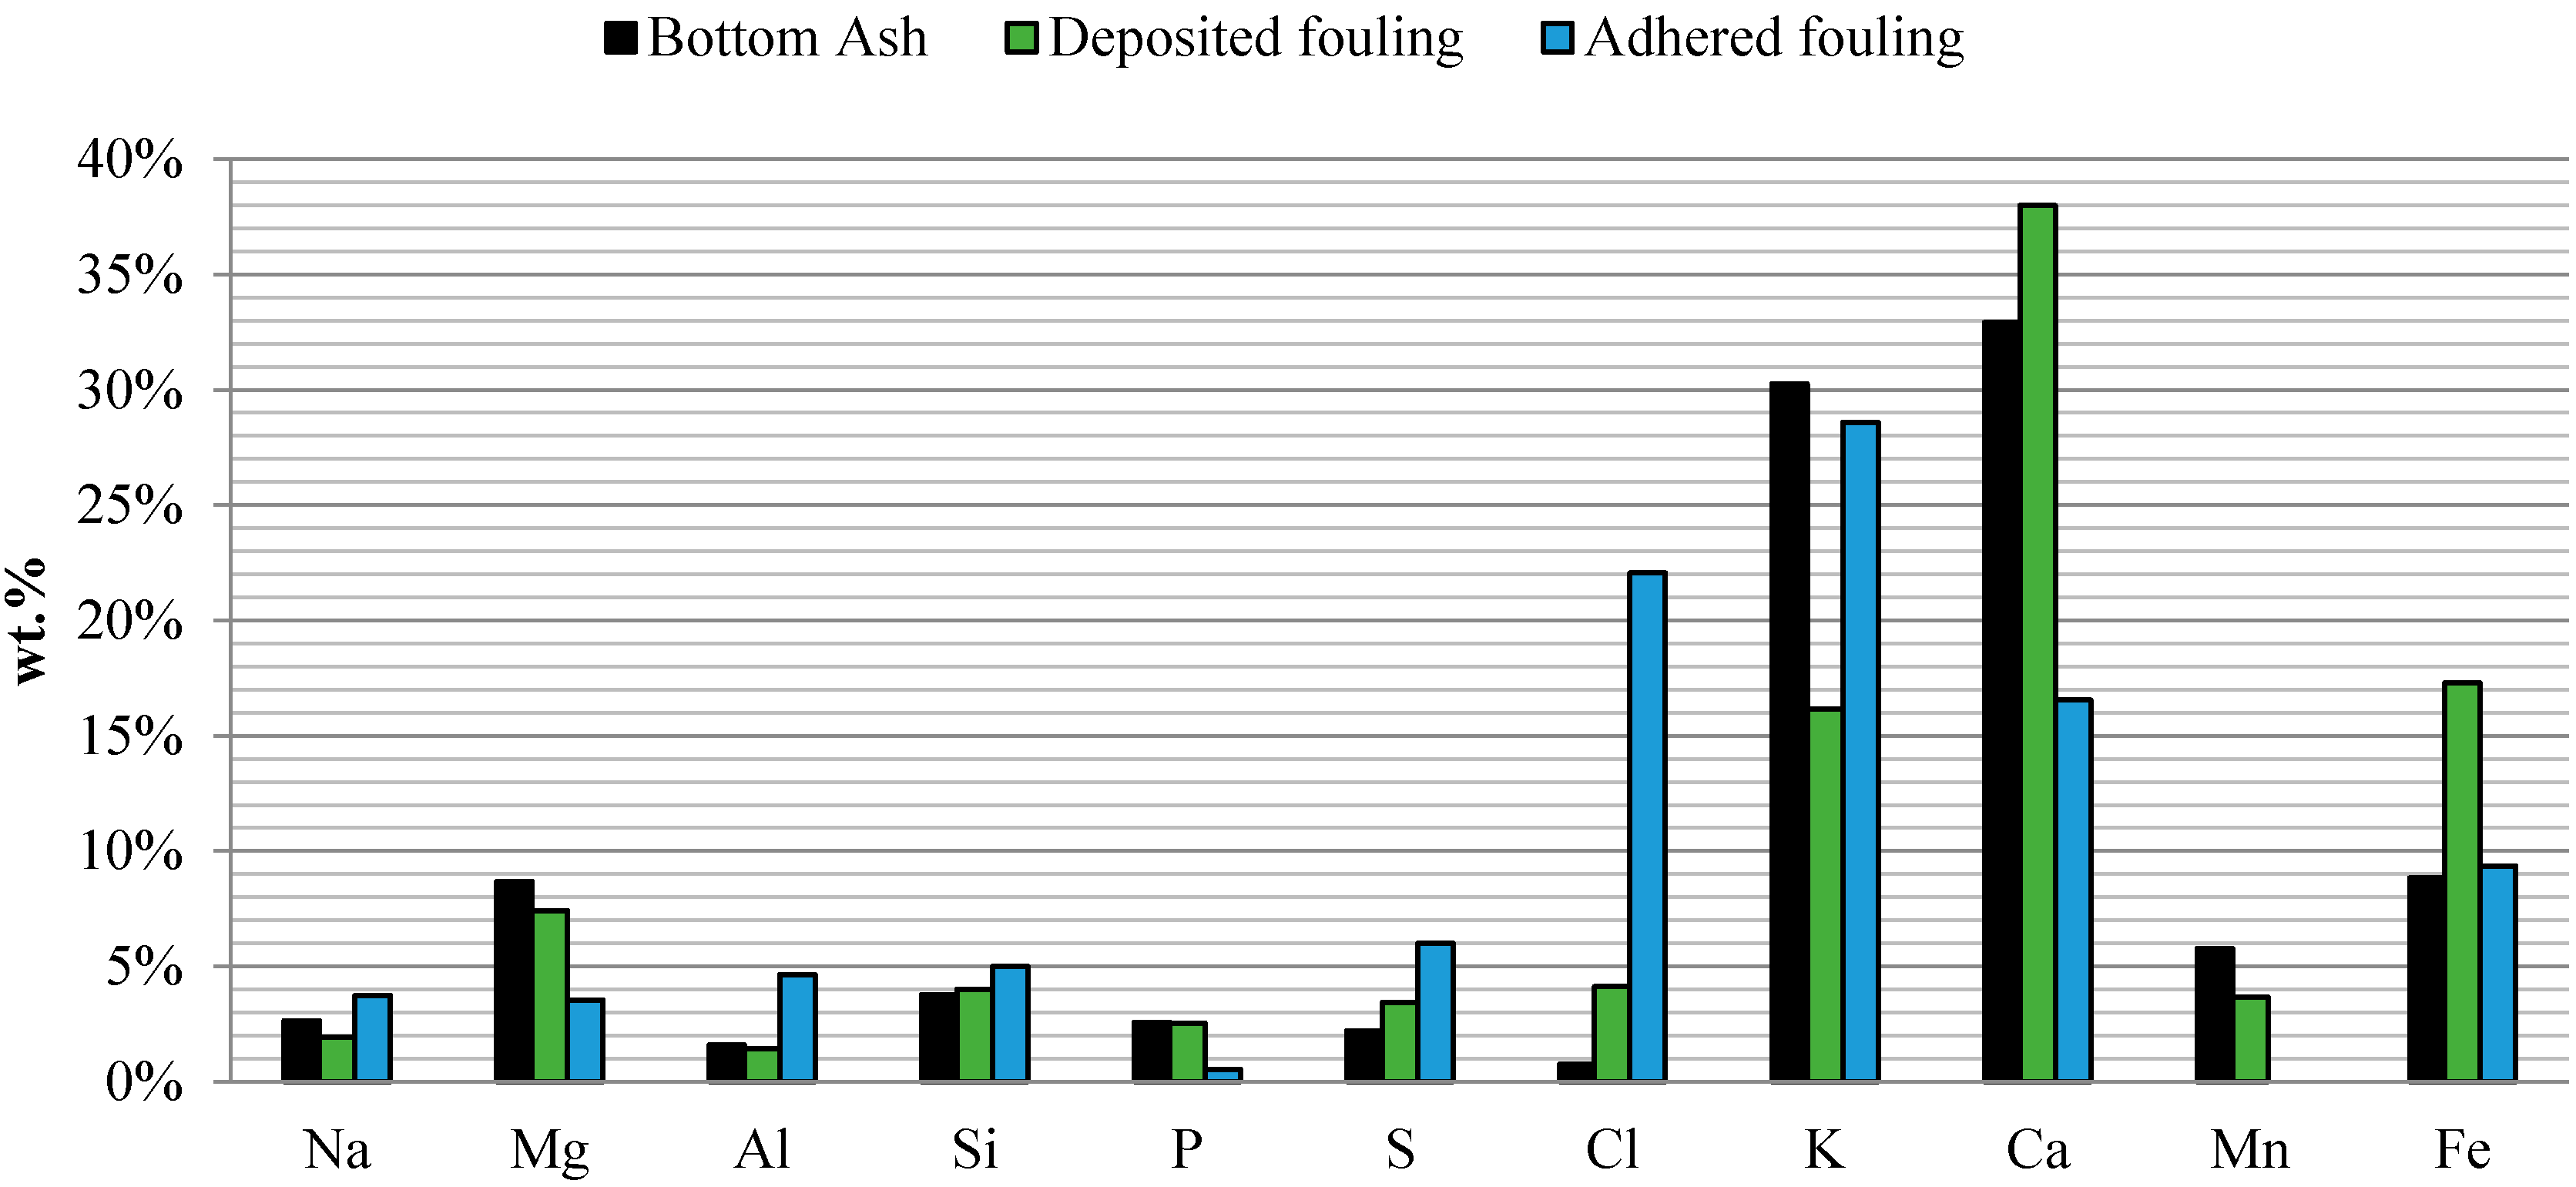
3.2.2. X-Ray Fluorescence Spectroscopy
| Na2O | MgO | Al2O3 | SiO2 | P2O5 | SO3 | Cl | K2O | CaO | TiO2 | Cr2O3 | MnO | Fe2O3 | NiO | CuO | ZnO | Rb2O | SrO | BaO | |
|---|---|---|---|---|---|---|---|---|---|---|---|---|---|---|---|---|---|---|---|
| WP | 6.22 | 10.36 | 7.74 | 16.47 | 6.98 | 4.25 | 3.27 | 14.29 | 28.03 | 0.00 | 0.00 | 1.31 | 0.83 | 0.00 | 0.00 | 0.24 | 0.00 | 0.00 | 0.00 |
| S1-B | 2.61 | 13.34 | 3.48 | 11.84 | 4.93 | 3.09 | 0.57 | 19.59 | 29.95 | 0.16 | 0.23 | 1.88 | 7.59 | 0.13 | 0.04 | 0.14 | 0.02 | 0.07 | 0.34 |
| S2-B | 2.59 | 10.07 | 4.73 | 23.93 | 4.26 | 1.58 | 0.08 | 19.64 | 25.34 | 0.21 | 0.12 | 1.60 | 5.25 | 0.06 | 0.05 | 0.02 | 0.04 | 0.08 | 0.35 |
| S3-B | 2.53 | 11.20 | 4.28 | 19.57 | 4.58 | 1.84 | 0.23 | 19.82 | 27.11 | 0.21 | 0.21 | 1.88 | 5.72 | 0.13 | 0.06 | 0.07 | 0.06 | 0.18 | 0.30 |
| S1-D | 3.22 | 14.20 | 4.80 | 17.91 | 4.25 | 8.15 | 2.58 | 12.69 | 24.06 | 0.16 | 0.42 | 1.03 | 5.83 | 0.23 | 0.03 | 0.13 | 0.00 | 0.03 | 0.29 |
| S2-D | 2.91 | 12.53 | 3.78 | 13.70 | 4.56 | 9.90 | 4.63 | 14.09 | 26.15 | 0.16 | 0.39 | 1.10 | 5.38 | 0.18 | 0.05 | 0.14 | 0.02 | 0.02 | 0.30 |
| S3-D | 2.62 | 10.21 | 3.55 | 13.37 | 4.40 | 7.95 | 2.62 | 17.74 | 28.40 | 0.15 | 0.36 | 1.54 | 6.27 | 0.18 | 0.03 | 0.18 | 0.03 | 0.06 | 0.33 |
| S1-S2-S3-A | 9.36 | 11.49 | 3.32 | 10.98 | 3.11 | 15.77 | 12.38 | 12.08 | 15.56 | 0.09 | 0.30 | 0.61 | 4.38 | 0.14 | 0.02 | 0.23 | 0.00 | 0.02 | 0.14 |

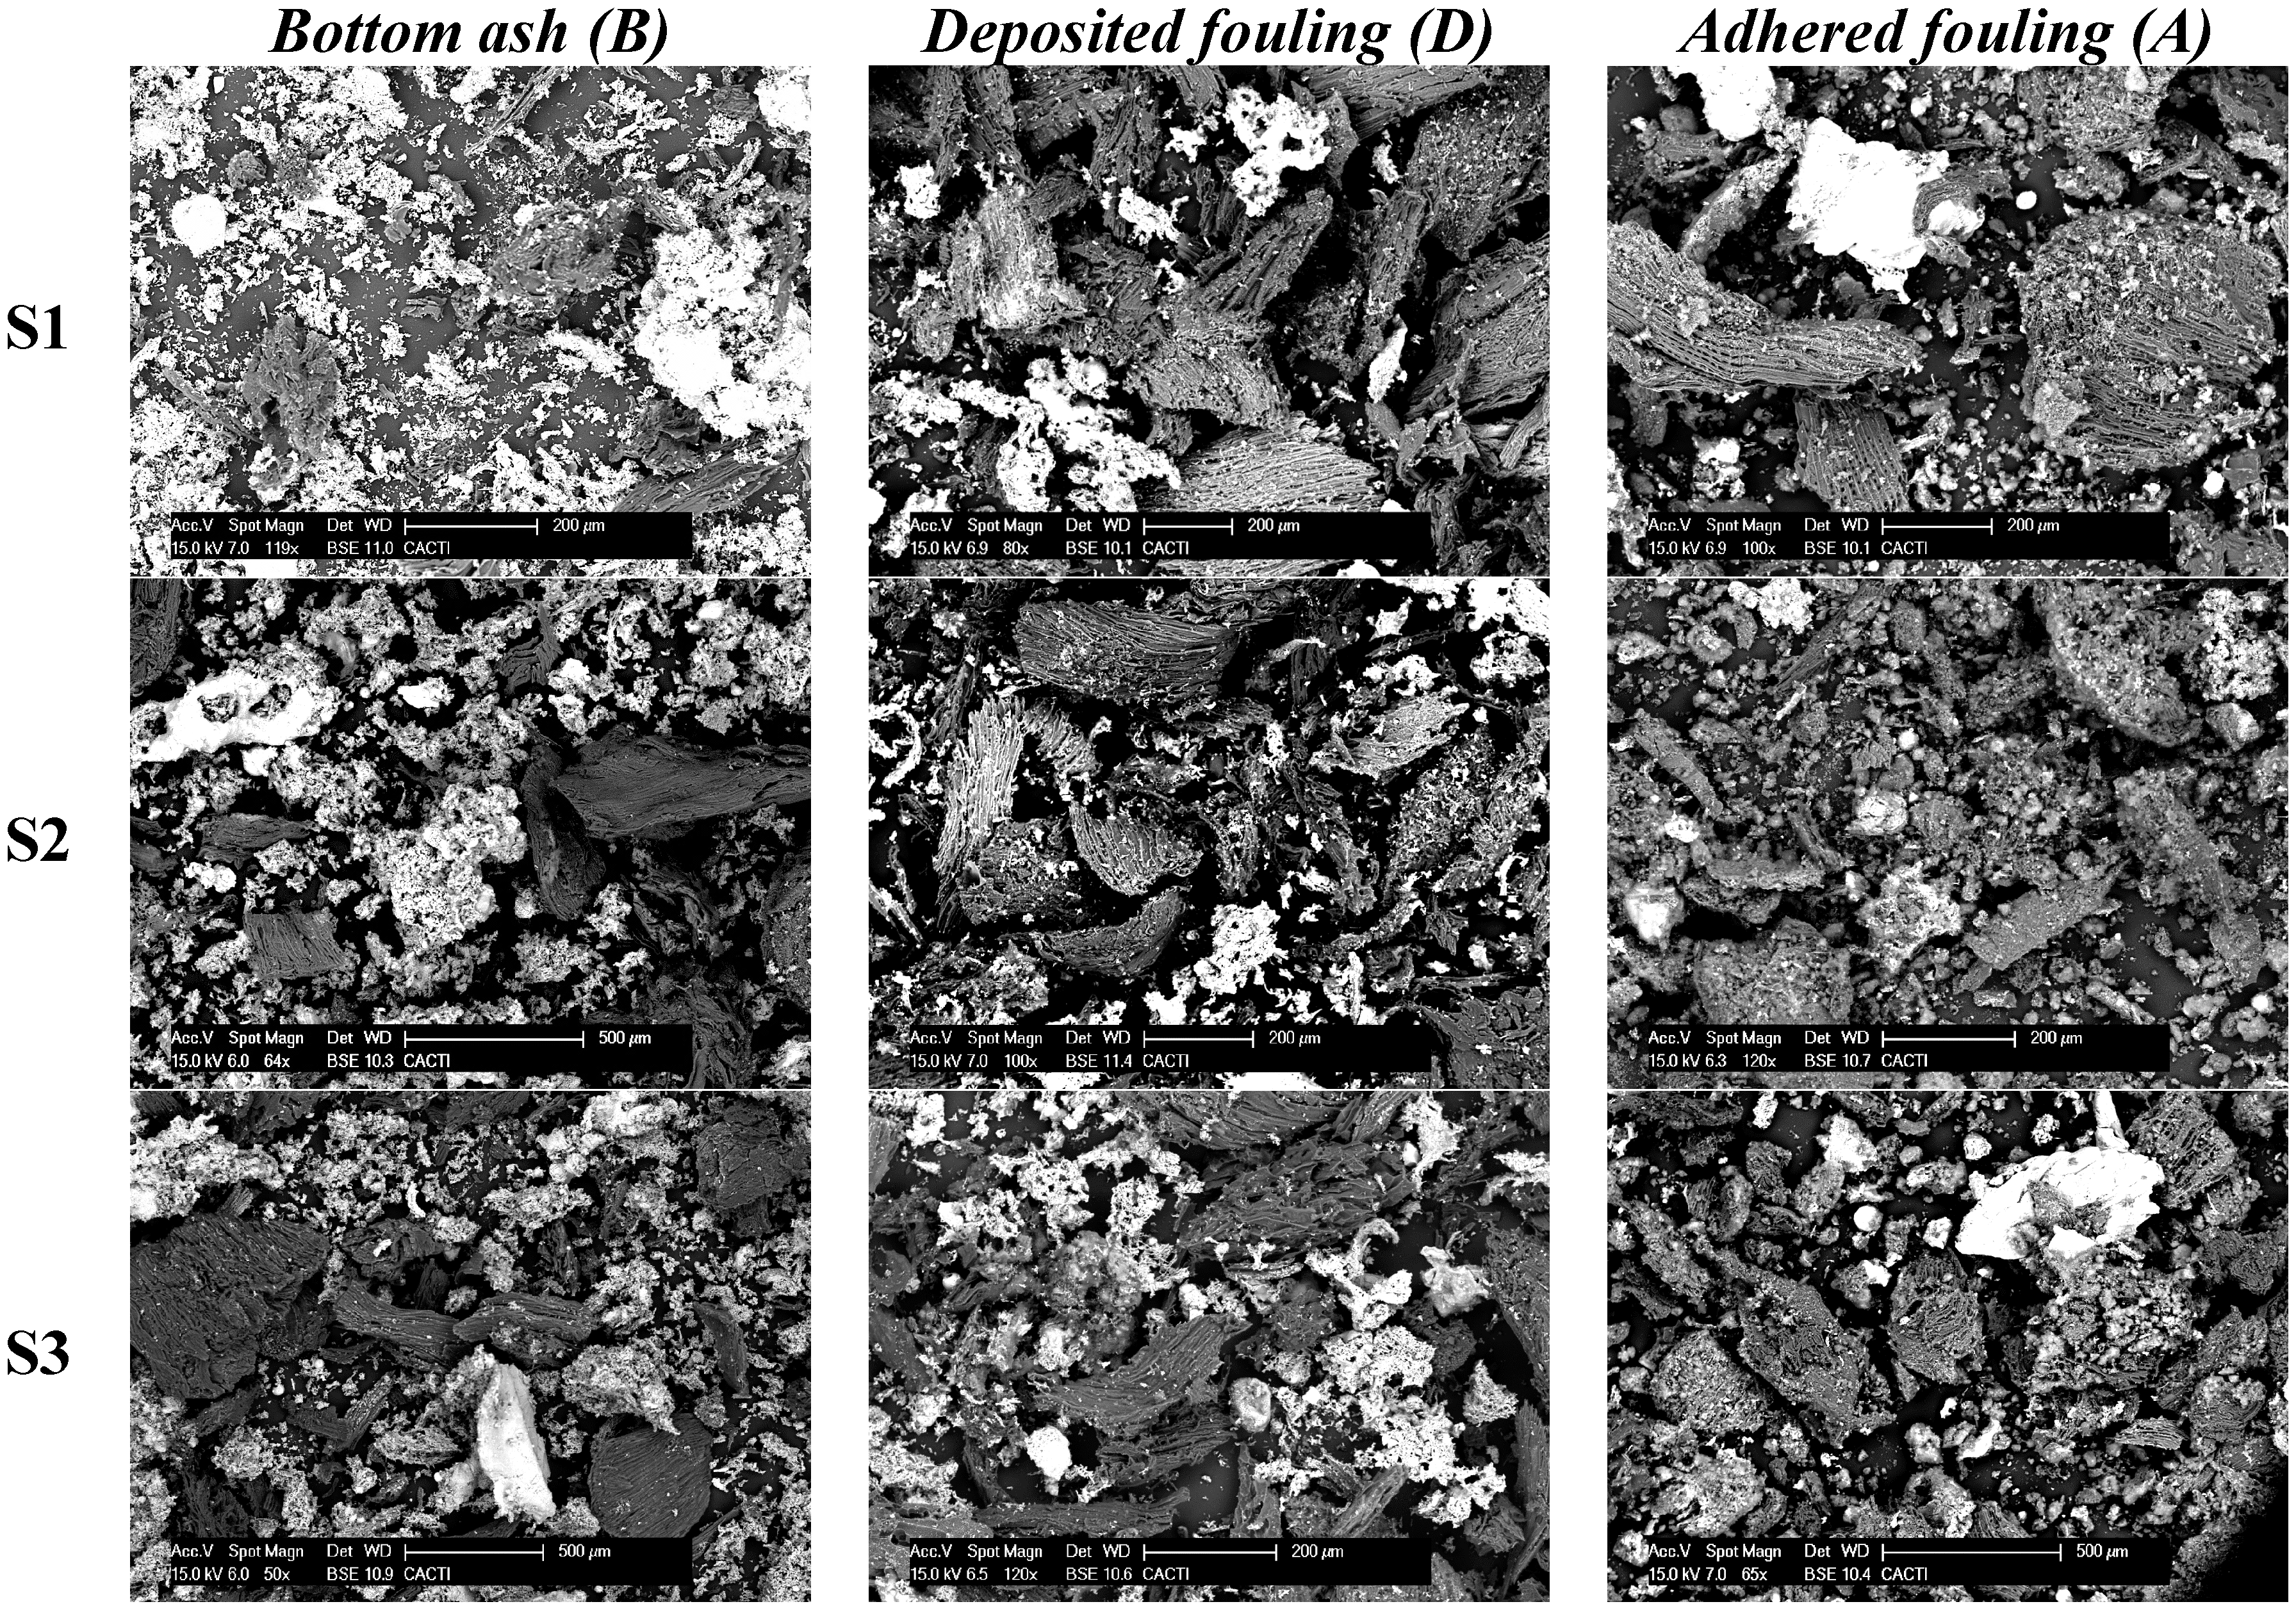
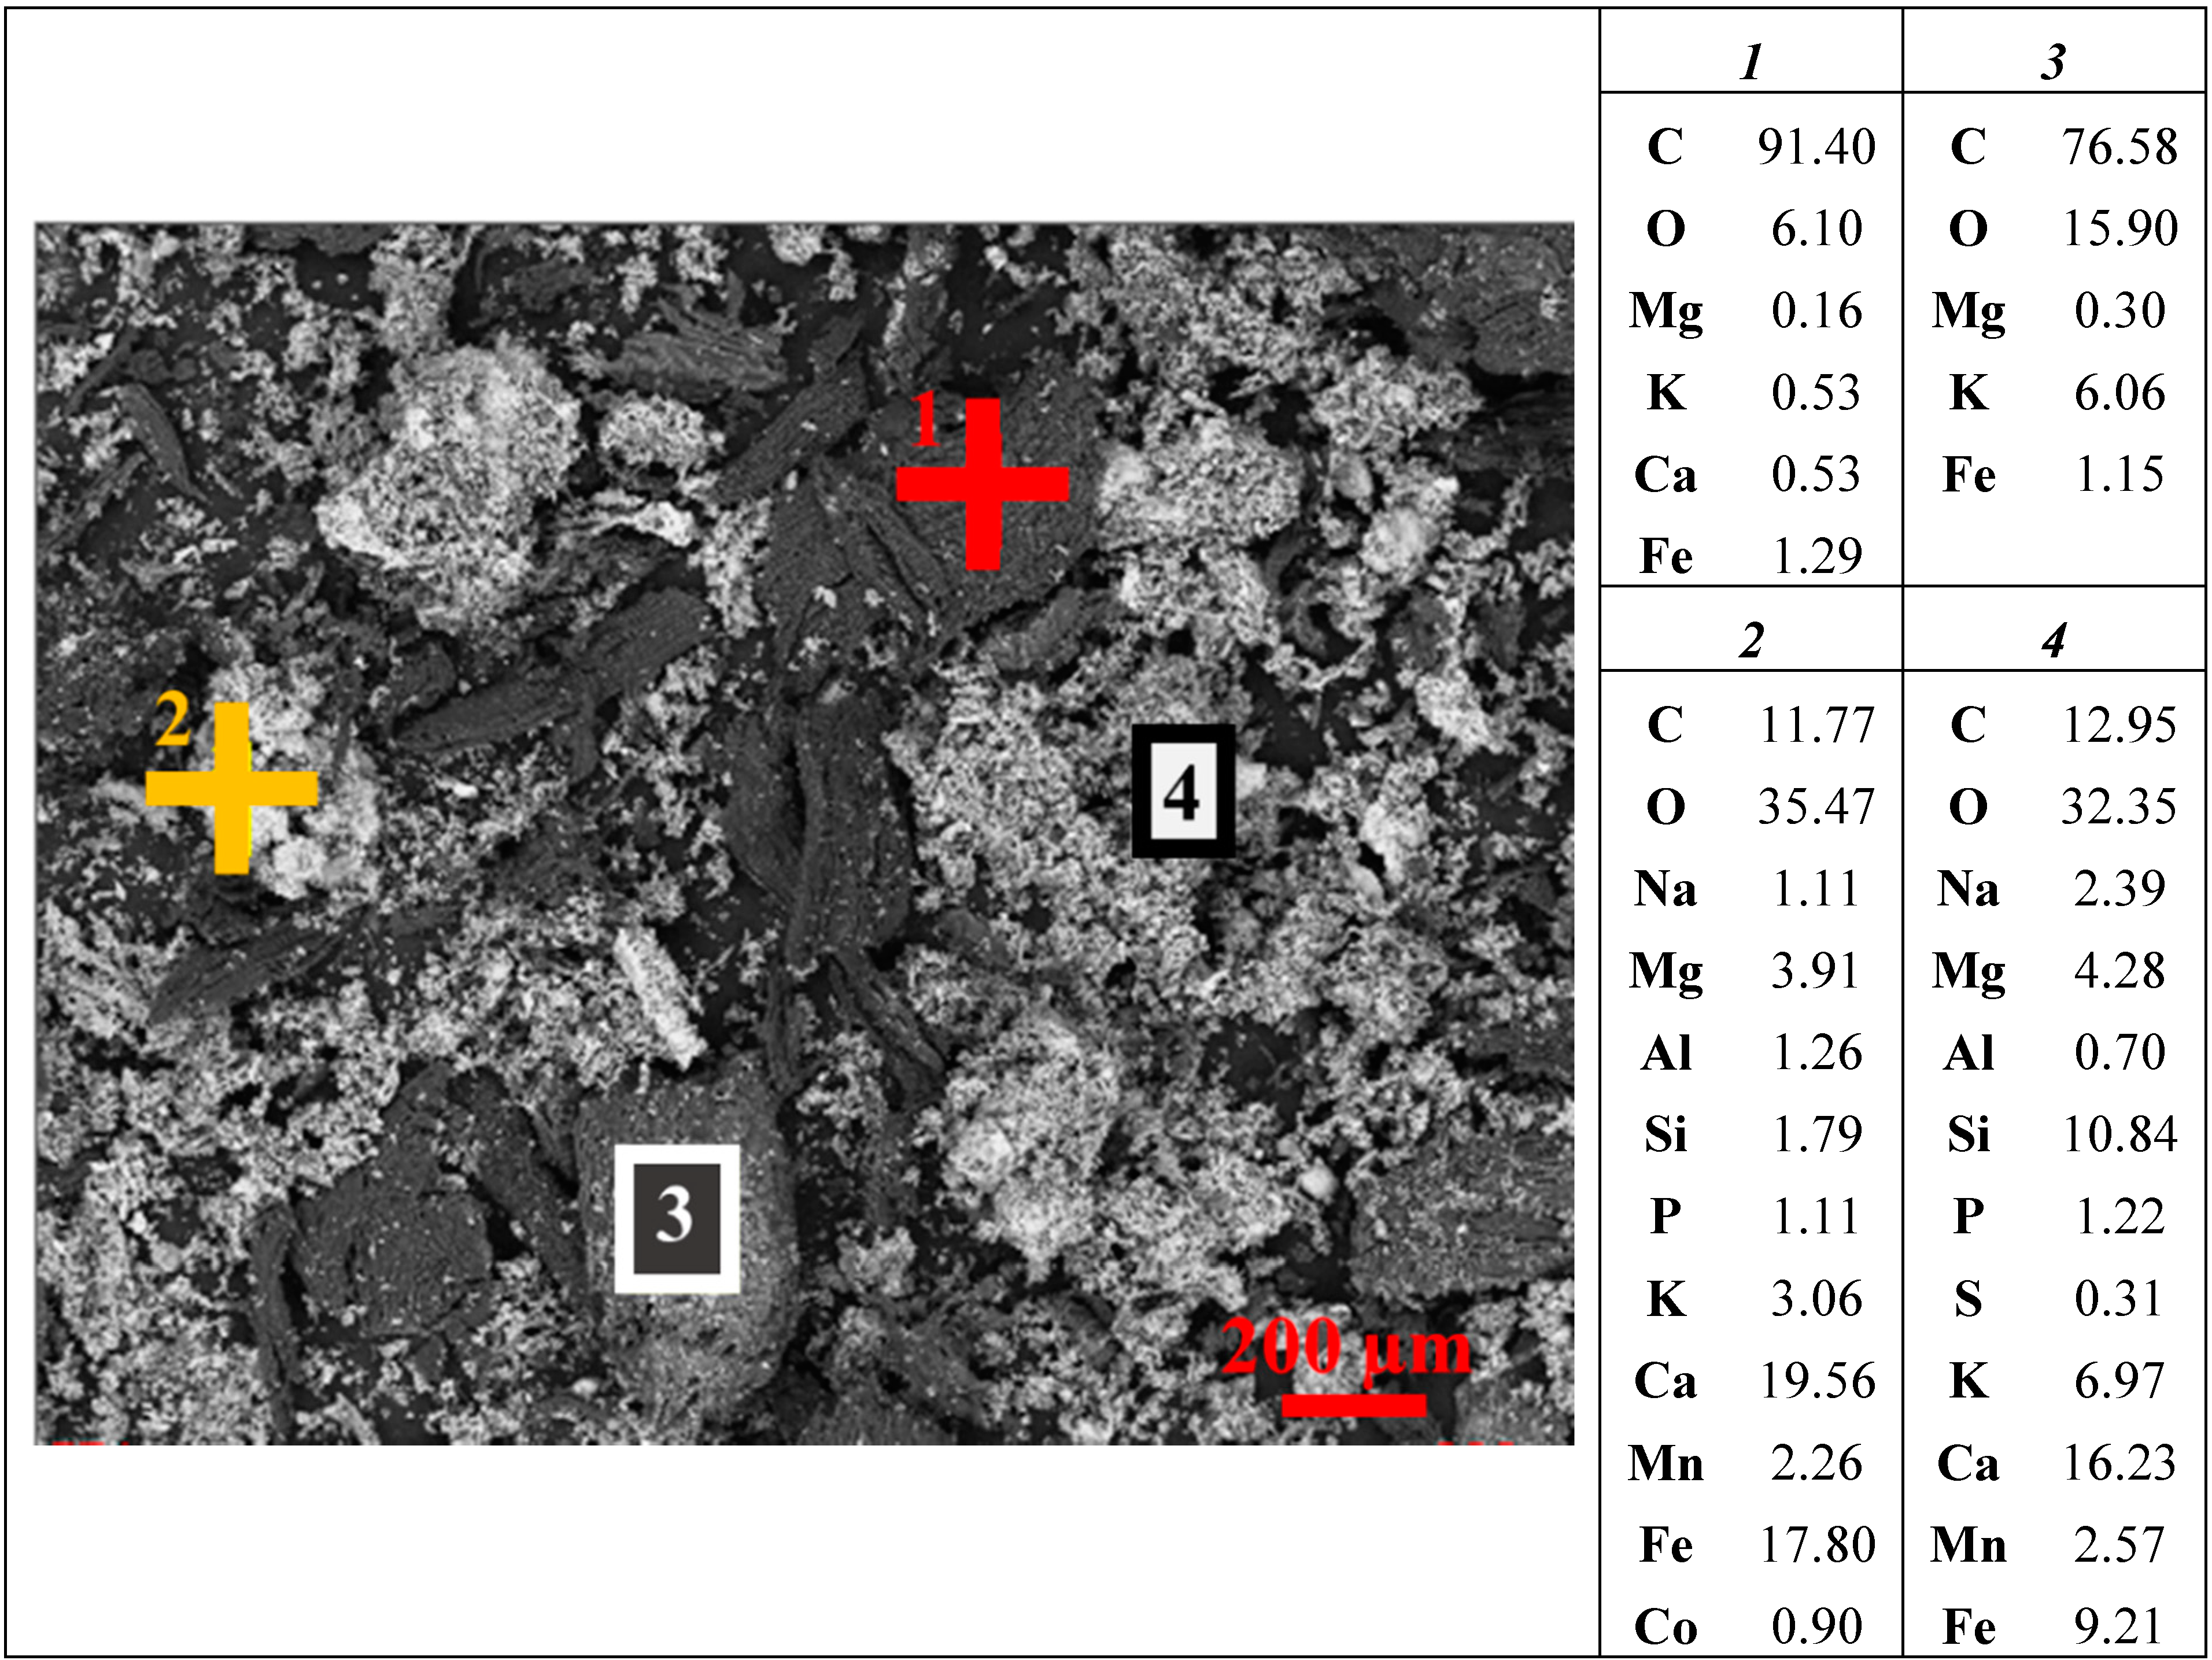
3.2.3. Scanning Electron Microscopy with Energy Dispersive X-Ray Spectroscopy (SEM-EDS)


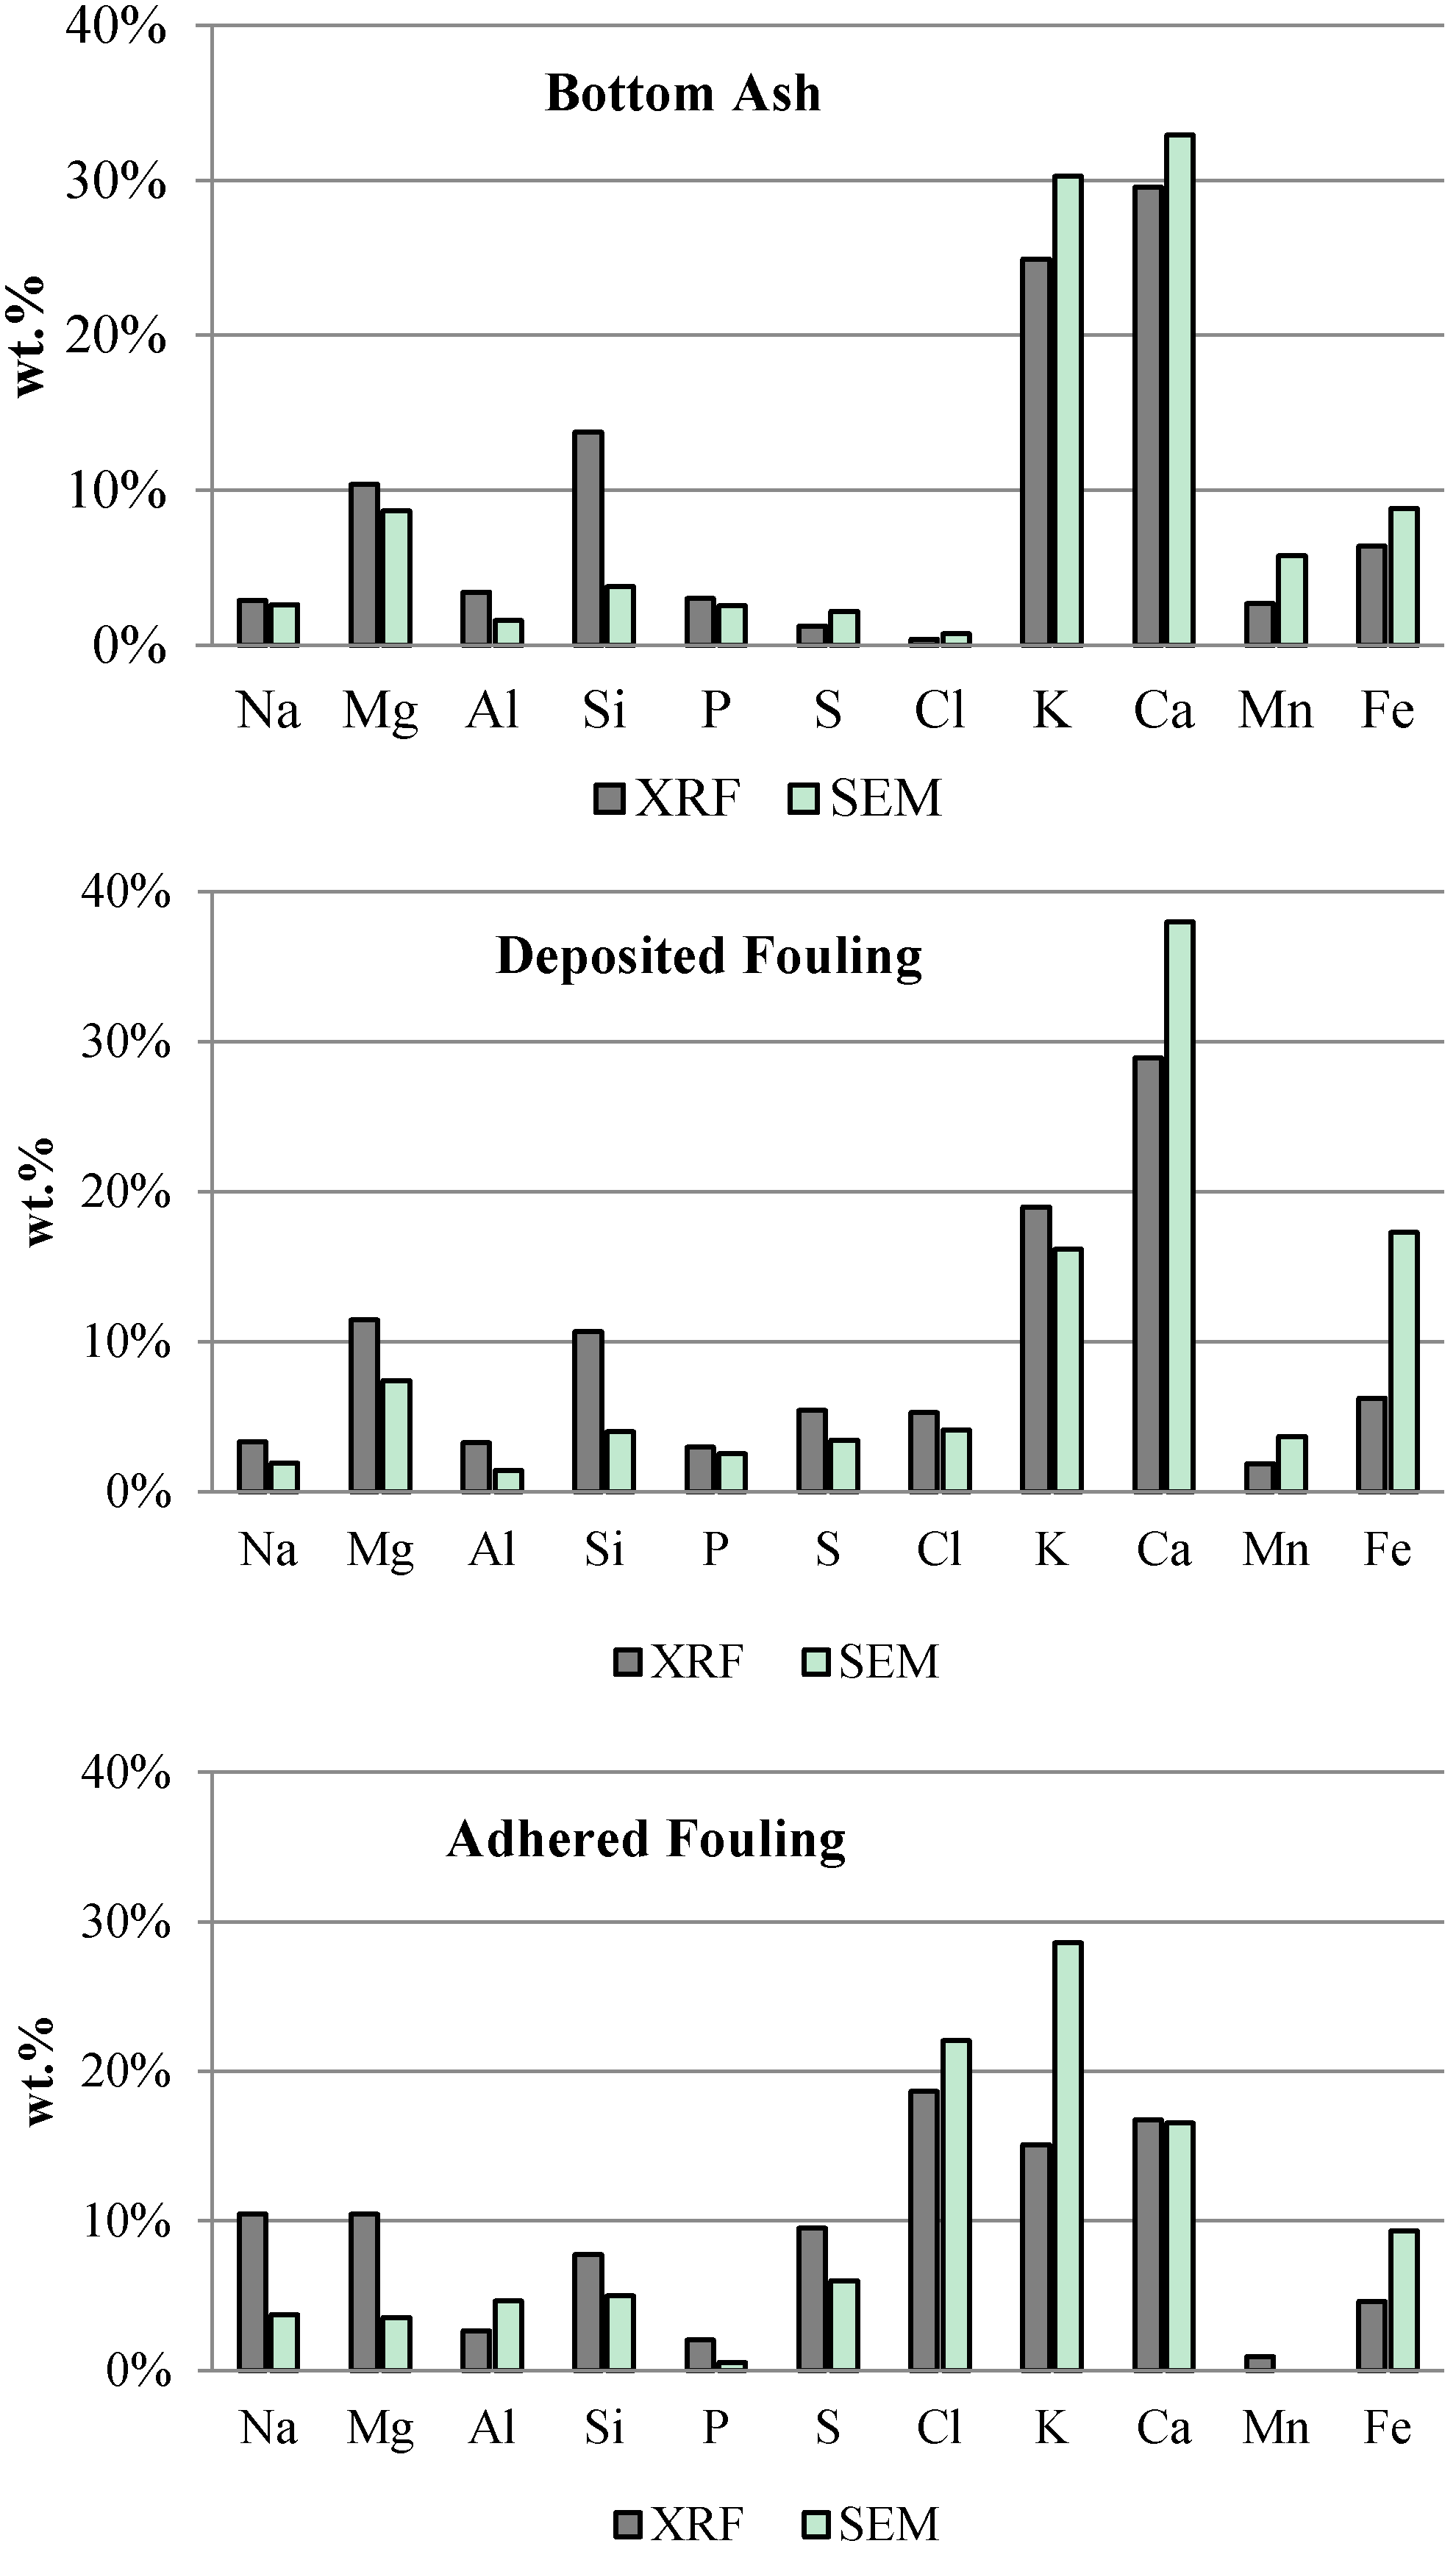
3.2.4. Comparison between Elemental Techniques

3.2.5. Fourier Transform Infrared Spectrometry (FTIR)

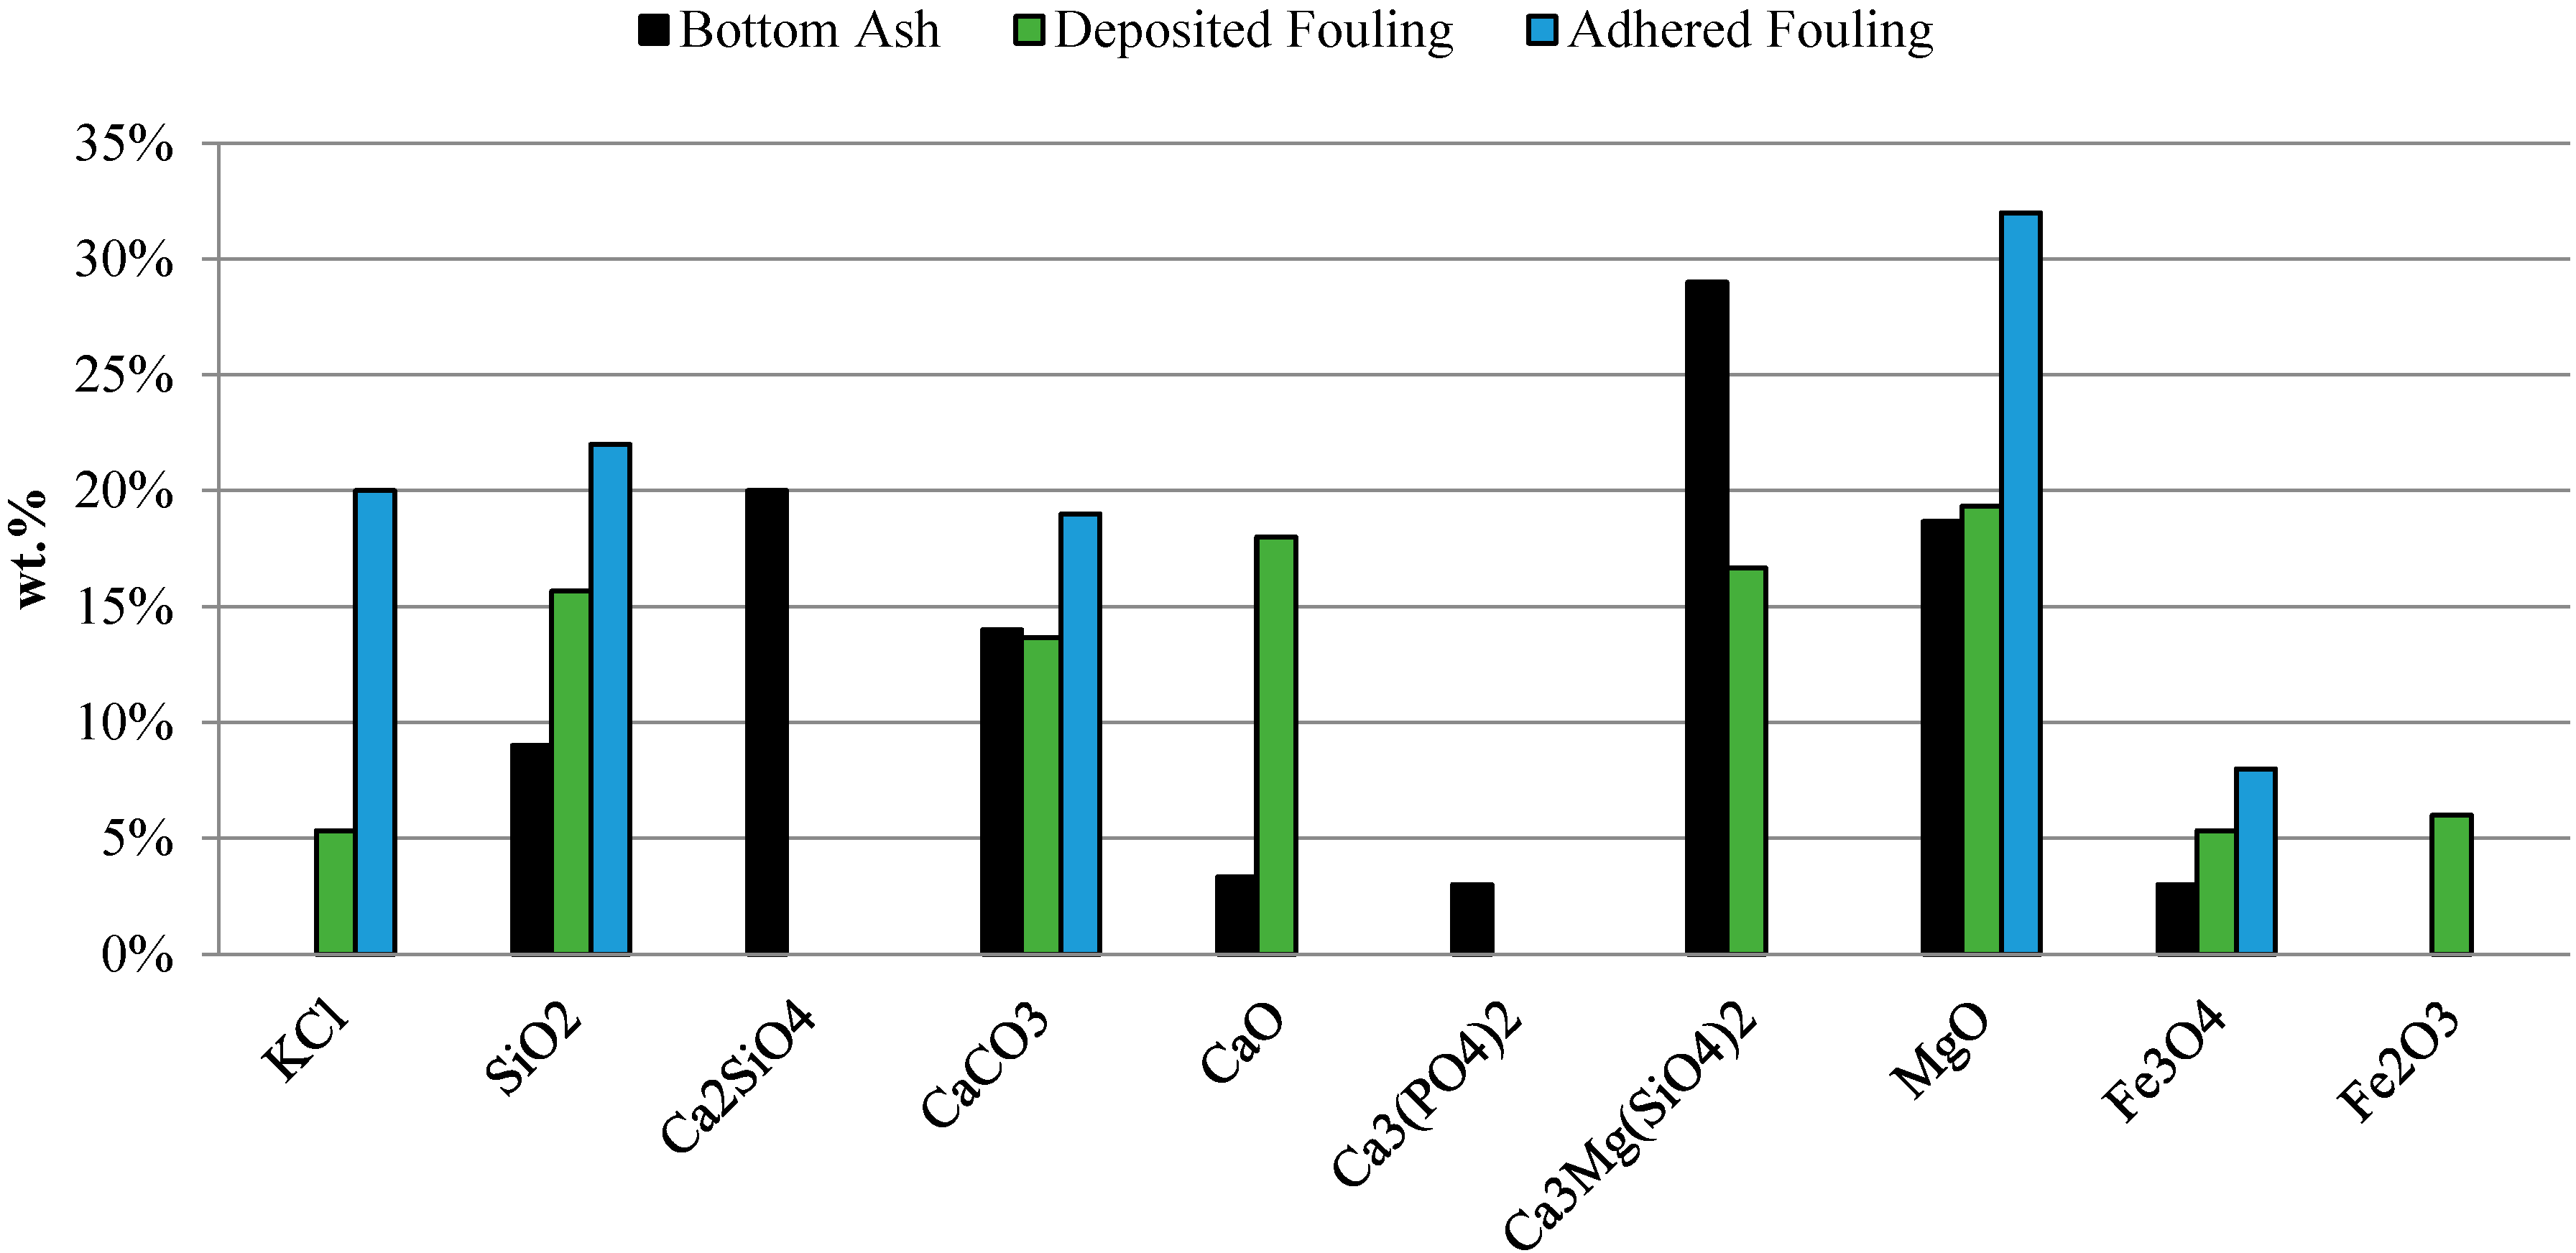
3.2.6. X-Ray Diffraction Spectroscopy (XRD)

4. Conclusions
Acknowledgments
Author Contributions
Conflicts of Interest
References
- Saidur, R.; Abdelaziz, E.A.; Demirbas, A.; Hossain, M.S.; Mekhilef, S. A review on biomass as a fuel for boilers. Renew. Sustain. Energy Rev. 2011, 15, 2262–2289. [Google Scholar] [CrossRef]
- Demirbas, A. Potential applications of renewable energy sources, biomass combustion problems in boiler power systems and combustion related environmental issues. Progr. Energy Combust. Sci. 2005, 31, 171–192. [Google Scholar] [CrossRef]
- Grimm, A.; Skoglund, N.; Boström, D.; Boman, C.; Öhman, M. Influence of phosphorus on alkali distribution during combustion of logging residues and wheat straw in a bench-scale fluidized bed. Energy Fuels 2012, 26, 3012–3023. [Google Scholar] [CrossRef]
- Davidsson, K.O.; Åmand, L.E.; Leckner, B.; Kovacevik, B.; Svane, M.; Hagström, M.; Pettersson, J.B.C.; Petterson, J.; Asteman, H.; Svensson, J.E.; et al. Potassium, chlorine, and sulfur in ash, particles, deposits, and corrosion during wood combustion in a circulating fluidized-bed boiler. Energy Fuels 2007, 21, 71–81. [Google Scholar] [CrossRef]
- Szemmelveisz, K.; Szucs, I.; Palotás, Á.B.; Winkler, L.; Eddings, E.G. Examination of the combustion conditions of herbaceous biomass. Fuel Process. Technol. 2009, 90, 839–847. [Google Scholar] [CrossRef]
- Baxter, L.L.; Miles, T.R.; Miles, T.R., Jr.; Jenkins, B.M.; Milne, T.; Dayton, D.; Bryers, R.W.; Oden, L.L. The behavior of inorganic material in biomass-fired power boilers: Field and laboratory experiences. Fuel Process. Technol. 1998, 54, 47–78. [Google Scholar] [CrossRef]
- Khan, A.A.; de Jong, W.; Jansens, P.J.; Spliethoff, H. Biomass combustion in fluidized bed boilers: Potential problems and remedies. Fuel Process. Technol. 2009, 90, 21–50. [Google Scholar] [CrossRef]
- Darvell, L.I.; Jones, J.M.; Gudka, B.; Baxter, X.C.; Saddawi, A.; Williams, A.; Malmgren, A. Combustion properties of some power station biomass fuels. Fuel 2010, 89, 2881–2890. [Google Scholar] [CrossRef]
- Teixeira, P.; Lopes, H.; Gulyurtlu, I.; Lapa, N.; Abelha, P. Evaluation of slagging and fouling tendency during biomass co-firing with coal in a fluidized bed. Biomass Bioenergy 2012, 39, 192–203. [Google Scholar] [CrossRef]
- Hansen, L.A.; Frandsen, F.J.; Dam-Johansen, K.; Sørensen, H.S.; Skrifvars, B.J. Characterization of ashes and deposits from high-temperature coal-straw co-firing. Energy Fuels 1999, 13, 803–816. [Google Scholar] [CrossRef]
- Gogebakan, Z.; Gogebakan, Y.; Selçuk, N.; Selçuk, E. Investigation of ash deposition in a pilot-scale fluidized bed combustor co-firing biomass with lignite. Bioresour. Technol. 2009, 100, 1033–1036. [Google Scholar] [CrossRef] [PubMed]
- Li, L.; Yu, C.; Huang, F.; Bai, J.; Fang, M.; Luo, Z. Study on the deposits derived from a biomass circulating fluidized-bed boiler. Energy Fuels 2012, 26, 6008–6014. [Google Scholar] [CrossRef]
- Pronobis, M. The influence of biomass co-combustion on boiler fouling and efficiency. Fuel 2006, 85, 474–480. [Google Scholar] [CrossRef]
- Aho, M.; Silvennoinen, J. Preventing chlorine deposition on heat transfer surfaces with aluminium-silicon rich biomass residue and additive. Fuel 2004, 83, 1299–1305. [Google Scholar] [CrossRef]
- Vassilev, S.V.; Baxter, D.; Andersen, L.K.; Vassileva, C.G. An overview of the composition and application of biomass ash. Part 1. Phase-mineral and chemical composition and classification. Fuel 2013, 105, 40–76. [Google Scholar] [CrossRef]
- Johansen, J.M.; Aho, M.; Paakkinen, K.; Taipale, R.; Egsgaard, H.; Jakobsen, J.G.; Frandsen, F.J.; Glarborg, P. Release of K, Cl, and S during combustion and co-combustion with wood of high-chlorine biomass in bench and pilot scale fuel beds. Proc. Combust. Instit. 2013, 34, 2363–2372. [Google Scholar] [CrossRef]
- Wei, X.; Schnell, U.; Hein, K.R.G. Behaviour of gaseous chlorine and alkali metals during biomass thermal utilisation. Fuel 2005, 84, 841–848. [Google Scholar] [CrossRef]
- Vassilev, S.V.; Baxter, D.; Andersen, L.K.; Vassileva, C.G. An overview of the composition and application of biomass ash: Part 2. Potential utilisation, technological and ecological advantages and challenges. Fuel 2013, 105, 19–39. [Google Scholar] [CrossRef]
- Kassman, H.; Broström, M.; Berg, M.; Åmand, L.E. Measures to reduce chlorine in deposits: Application in a large-scale circulating fluidised bed boiler firing biomass. Fuel 2011, 90, 1325–1334. [Google Scholar] [CrossRef]
- Arvelakis, S.; Folkedahl, B.; Dam-Johansen, K.; Hurley, J. Studying the melting behavior of coal, biomass, and coal/biomass ash using viscosity and heated stage xrd data. Energy Fuels 2006, 20, 1329–1340. [Google Scholar] [CrossRef]
- Robinson, A.L.; Junker, H.; Baxter, L.L. Pilot-scale investigation of the influence of coal-biomass cofiring on ash deposition. Energy Fuels 2002, 16, 343–355. [Google Scholar] [CrossRef]
- Silvennoinen, J.; Hedman, M. Co-firing of agricultural fuels in a full-scale fluidized bed boiler. Fuel Process. Technol. 2013, 105, 11–19. [Google Scholar] [CrossRef]
- Mroczek, K.; Kalisz, S.; Pronobis, M.; Sołtys, J. The effect of halloysite additive on operation of boilers firing agricultural biomass. Fuel Process. Technol. 2011, 92, 845–855. [Google Scholar] [CrossRef]
- Wiinikka, H.; Grönberg, C.; Öhrman, O.; Boström, D. Influence of tio2 additive on vaporization of potassium during straw combustion. Energy Fuels 2009, 23, 5367–5374. [Google Scholar] [CrossRef]
- Lang, T.; Jensen, P.A.; Knudsen, J.N. The effects of ca-based sorbents on sulfur retention in bottom ash from grate-fired annual biomass. Energy Fuels 2006, 20, 796–806. [Google Scholar] [CrossRef]
- Tobiasen, L.; Skytte, R.; Pedersen, L.S.; Pedersen, S.T.; Lindberg, M.A. Deposit characteristic after injection of additives to a danish straw-fired suspension boiler. Fuel Process. Technol. 2007, 88, 1108–1117. [Google Scholar] [CrossRef]
- Wang, L.; Hustad, J.E.; Skreiberg, Ø.; Skjevrak, G.; Grønli, M. A Critical Review on Additives to Reduce Ash Related Operation Problems in Biomass Combustion Applications. Energy Procedia 2012, 20, 20–29. [Google Scholar] [CrossRef]
- Davidsson, K.O.; Åmand, L.E.; Steenari, B.M.; Elled, A.L.; Eskilsson, D.; Leckner, B. Countermeasures against alkali-related problems during combustion of biomass in a circulating fluidized bed boiler. Chem. Eng. Sci. 2008, 63, 5314–5329. [Google Scholar] [CrossRef]
- Jenkins, B.M.; Baxter, L.L.; Miles, T.R., Jr.; Miles, T.R. Combustion properties of biomass. Fuel Process. Technol. 1998, 54, 17–46. [Google Scholar] [CrossRef]
- Granada, E.; Patiño, D.; Míguez, J.L.; Morán, J. Analysis of deposition of fouled matter in a water-tube heat exchanger of a biomass combustor. In Proceedingfs of the 34th International Symposium on Combustion, Warsaw, Poland, 29 July–3 August 2012.
- Febrero, L.; Granada, E.; Pérez, C.; Patiño, D.; Arce, E. Characterisation and comparison of biomass ashes with different thermal histories using tg-dsc. J. Therm. Anal. Calorim. 2014, 118, 1–12. [Google Scholar] [CrossRef]
- Rajamma, R.; Ball, R.J.; Tarelho, L.A.C.; Allen, G.C.; Labrincha, J.A.; Ferreira, V.M. Characterisation and use of biomass fly ash in cement-based materials. J. Hazard. Mater. 2009, 172, 1049–1060. [Google Scholar] [CrossRef] [PubMed]
- Wiinikka, H.; Gebart, R.; Boman, C.; Boström, D.; Öhman, M. Influence of fuel ash composition on high temperature aerosol formation in fixed bed combustion of woody biomass pellets. Fuel 2007, 86, 181–193. [Google Scholar] [CrossRef]
- Yin, C.; Rosendahl, L.A.; Kær, S.K. Grate-firing of biomass for heat and power production. Progr. Energy Combust. Sci. 2008, 34, 725–754. [Google Scholar] [CrossRef]
- Porteiro, J.; Patiño, D.; Moran, J.; Granada, E. Study of a fixed-bed biomass combustor: Influential parameters on ignition front propagation using parametric analysis. Energy Fuels 2010, 24, 3890–3897. [Google Scholar] [CrossRef]
- Wiinikka, H.; Gebart, R. The influence of air distribution rate on particle emissions in fixed bed combustion of biomass. Combust. Sci. Technol. 2005, 177, 1747–1766. [Google Scholar] [CrossRef]
- Porteiro, J.; Collazo, J.; Patiño, D.; Granada, E.; Gonzalez, J.C.M.; Míguez, J.L. Numerical modeling of a biomass pellet domestic boiler. Energy Fuels 2009, 23, 1067–1075. [Google Scholar] [CrossRef]
- Shao, Y.; Wang, J.; Preto, F.; Zhu, J.; Xu, C. Ash deposition in biomass combustion or co-firing for power/heat generation. Energies 2012, 5, 5171–5189. [Google Scholar] [CrossRef]
- Obernberger, I.; Brunner, T.; Bärnthaler, G. Chemical properties of solid biofuels-significance and impact. Biomass Bioenergy 2006, 30, 973–982. [Google Scholar] [CrossRef]
- Nutalapati, D.; Gupta, R.; Moghtaderi, B.; Wall, T.F. Assessing slagging and fouling during biomass combustion: A thermodynamic approach allowing for alkali/ash reactions. Fuel Process. Technol. 2007, 88, 1044–1052. [Google Scholar] [CrossRef]
© 2015 by the authors; licensee MDPI, Basel, Switzerland. This article is an open access article distributed under the terms and conditions of the Creative Commons Attribution license (http://creativecommons.org/licenses/by/4.0/).
Share and Cite
Febrero, L.; Granada, E.; Patiño, D.; Eguía, P.; Regueiro, A. A Comparative Study of Fouling and Bottom Ash from Woody Biomass Combustion in a Fixed-Bed Small-Scale Boiler and Evaluation of the Analytical Techniques Used. Sustainability 2015, 7, 5819-5837. https://0-doi-org.brum.beds.ac.uk/10.3390/su7055819
Febrero L, Granada E, Patiño D, Eguía P, Regueiro A. A Comparative Study of Fouling and Bottom Ash from Woody Biomass Combustion in a Fixed-Bed Small-Scale Boiler and Evaluation of the Analytical Techniques Used. Sustainability. 2015; 7(5):5819-5837. https://0-doi-org.brum.beds.ac.uk/10.3390/su7055819
Chicago/Turabian StyleFebrero, Lara, Enrique Granada, David Patiño, Pablo Eguía, and Araceli Regueiro. 2015. "A Comparative Study of Fouling and Bottom Ash from Woody Biomass Combustion in a Fixed-Bed Small-Scale Boiler and Evaluation of the Analytical Techniques Used" Sustainability 7, no. 5: 5819-5837. https://0-doi-org.brum.beds.ac.uk/10.3390/su7055819